POLITICAL ECONOMY RESEARCH INSTITUTE 10th floor Thompson Hall University of Massachusetts Amherst, MA, 01003-7510 Telephone: (413) 545-6355 Facsimile: (413) 545-2921 Email:[email protected] Website: http://www.umass.edu/peri / INEQUALITY AND ENVIRONMENTAL PROTECTION JAMES K. BOYCE 2003 Number 52 POLITICAL ECONOMY RESEARCH INSTITUTE University of Massachusetts Amherst WORKING PAPER SE RIES

Welcome message from author
This document is posted to help you gain knowledge. Please leave a comment to let me know what you think about it! Share it to your friends and learn new things together.
Transcript
POLITIC
AL EC
ON
OM
YR
ESEAR
CH
INSTITU
TE
10th floor Thompson HallUniversity of MassachusettsAmherst, MA, 01003-7510Telephone: (413) 545-6355Facsimile: (413) 545-2921 Email:[email protected]
Website: http://www.umass.edu/peri/
INEQUALITY AND ENVIRONMENTAL PROTECTION
JAMES K. BOYCE
2003
Number 52
POLITICAL ECONOMY RESEARCH INSTITUTE
University of Massachusetts Amherst
WORKINGPAPER SERIES
1
INEQUALITY AND ENVIRONMENTAL PROTECTION
JAMES K. BOYCE
JANUARY 2003
PROGRAM ON DEVELOPMENT, PEACEBUILDING, AND THE ENVIRONMENT POLITICAL ECONOMY RESEARCH INSTITUTE UNIVERSITY OF MASSACHUSETTS, AMHERST

2
Abstract: Social and economic inequalities can influence both the distribution of the costs and benefits from environmental degradation and the extent of environmental protection. When those who benefit from environmentally degrading economic activities are powerful relative to those who bear the costs, environmental protection is generally weaker than when the reverse is true. This can lead to environmental inequalities along lines of class, race, ethnicity, gender, and age. At the same time, inequalities may affect the overall extent of environmental quality. There are good theoretical reasons to expect inequalities to reduce environmental protection and exacerbate environmental degradation. The available empirical evidence generally is consistent with this expectation.
______________________________________________________ 1. Introduction Inequalities of power and wealth may affect the magnitude as well as the incidence of environmental protection. A growing body of literature documents that social and economic inequalities – based on class, race, ethnicity, gender, and age – often translate into environmental inequalities. This essay suggests that the impact of inequalities affect not only how environmental quality is distributed, but also the total size of the pie. The global environment is our common home, but not everyone lives in the same room. Clearly, many crucial dimensions of environmental quality are not private goods, exchanged in markets where the rich can buy more than the poor. But neither are they pure public goods, that when available to one person are equally available to all. Rather, many aspects of environmental quality lie in the intermediate terrain between the public and the private, a terrain where, in George Orwell’s haunting phrase, some are “more equal than others.” Social and economic inequalities take many forms.1 This essay focuses primarily on inequalities of power, and secondarily on inequalities of income. Data on income distribution are fairly widely available.2 Data on power distribution, by contrast, are by and large non-existent; hence proxies must be used to measure this dimension of inequality. I first consider why, in theory, we can expect inequalities to have an impact on environmental protection. Section 2 discusses power and its role in social decisions regarding the environment. Section 3 formalizes this impact via a “power-weighted social decision rule,” and advances two hypotheses: first, that social decisions on environmental protection will systematically favor some individuals and groups over others; and second, that a more unequal distribution of power will generally result in less environmental
1 For discussion, see Sen (1992). 2 In some respects, wealth distribution provides a more robust measure of economic inequality, but data on wealth are far less common.
3
protection and more environmental degradation. Section 4 considers the effects of income distribution on environmental quality, and explains why the usual assumption that higher-income individuals have higher demand for environmental quality does not necessarily imply that a redistribution of income in their favor (that is, greater income inequality) will lead to better environmental quality. I then turn to the empirical evidence. Section 5 reviews the burgeoning literature on environmental injustice in the United States, highlighting several key areas of ongoing debate. Section 6 summarizes a state-level analysis of the impact of power inequality on the extent of environmental protection and environmental quality in the United States. Section 7 reviews international evidence on the effects of inequality on environmental quality, drawing on recent literature on the “environmental Kuznets curve.” Section 8 concludes by suggesting some potentially fruitful avenues for further research. 2. Power and the Environment In analyzing environmental degradation, we can ask three basic questions:
• First, who benefits from economic activities that degrade the environment? If there were no winners – people who derive net benefits from these activities (or at least expect to do so) – the environmental degradation would not take place.
• Second, who bears the costs of environmental degradation? If there were no losers
– people on the receiving end of “negative externalities” – there would be no need to worry about these activities, at least from the standpoint of human well-being.
• Finally, why are the winners able to impose environmental costs on the losers?
There are three possible answers to the final question. The first is that the losers do not yet exist; that is, they belong to future generations who are not here to defend themselves. The second possibility is that the losers exist but lack information about the costs that the winners are imposing on them; even if they are aware of the costs – for example, they may see that their children are ill – they have not traced these costs to the activities of the winners. The third possibility is that the losers exist and know that the winners are imposing costs on them, but they lack the power to prevent this imposition. In the first scenario – where the losers do not yet exist – environmental protection requires that the present generation embrace an ethic of responsibility toward future generations. In the second scenario – where the losers lack information – environmental education and right-to-know legislation can help to tip the scales in favor of environmental protection.3 In the third scenario – where the losers lack power relative to
3 For discussions of right-to-know legislation in the United States and its impact on environmental protection, see Rich et al. (1993), Konar and Cohen (1995), and Khanna et al. (1998).
4
the winners – environmental protection requires a change in the balance of power. This third scenario is the main focus of this essay. Dimensions of power Five dimensions of power affect social decisions on environmental protection:
• Purchasing power: If environmental protection were a simple commodity, like orange juice, that could be bought and sold in the market, then purchasing power would be a key determinant of the extent of environmental protection. Inequalities of power would mirror inequalities in the distribution of income and wealth. The preferences of different individuals would influence social decisions insofar as they are backed by ability to pay; in effect, one dollar would buy one vote. Although environmental protection in practice has a substantial “public good” component, shifting many decisions from the market to the arena of public policy, this does not mean that purchasing power is entirely irrelevant to these decisions.
• Decision power: When different people prefer different public policy outcomes,
those who prevail are said to wield “decision power.” If the extent of environmental protection were determined by simple majority rule, each individual’s preferences would count equally – one person, one vote – with the outcomes mirroring the preferences of the median voter. In practice, as every political lobbyist knows, some people wield greater decision power than others.
• Agenda power: Some issues never make it into the public policy arena at all. The
ability to determine which do, and which do not, is termed “agenda power.” This is a subtler dimension of power, in that it can determine environmental protection outcomes before overt decision power comes into play. In his classic study The Un-Politics of Air Pollution (1971), for example, Matthew Crenson describes how corporate power in the steel-mill town of Gary, Indiana, kept air pollution off the local government’s political agenda for years.
• Value power: Individual preferences do not fall from the sky. The ability to
influence what other people want – what they will choose if given the opportunity to do so – is an even subtler aspect of power (Lukes 1974). As John Kenneth Galbraith (1973, p. 9) once observed, power can be deployed to persuade people that pollution is “palatable or worth the cost.”
• Event power: A final dimension of power is the ability to determine the
circumstances in which people make choices, rather the choices themselves. Randall Bartlett (1989, p. 43) offers this hypothetical illustration: “Suppose I dig a deep pit, fill it with poisonous snakes, and throw you in. I then stand on the edge of the pit and offer to sell you a ladder. To buy or not to buy is not the only question. What prior events made you need to buy, and my influence over them, are also relevant.”

5
All five dimensions of power are relevant to environmental protection. When the winners from environmentally degrading economic activities wield greater purchasing power, decision power, agenda power, value power, and/or event power than the losers, we can expect less environmental protection than if the power balance is reversed. Correlates of power Power, as the term is used here, is inherently relative: individuals wield power vis-à-vis others. In a world of solitary Robinson Crusoes, power would be absent (as would “externalities”). Power depends both on individual attributes and on the political framework in which these attributes are mapped into the five dimensions of power. Correlations between individual attributes and power vary across societies. Wealth, income, race, ethnicity, gender, and age are commonly among the most important correlates. Richer individuals not only wield more purchasing power in the market for private goods and services, but also tend to be well-endowed in the other dimensions of power. For both reasons, we may expect affluent communities to receive higher levels of environmental protection than low-income communities. Although race and ethnicity are often correlated with economic class, they may have independent effects on power. That is, holding wealth or income constant, members of disadvantaged racial or ethnic groups may wield less power (apart from the purchasing power dimension) than other groups. In the United States, for example, many studies have found that African-Americans and Latinos systematically tend to bear disproportionate burdens from pollution and environmental hazards, a relationship explored further in section 5 below. Gender and age can also be correlated with power, especially when these attributes interact with economic class, race, or ethnicity. For example, Bina Agarwal (1992) has documented how the degradation of forest resources in rural India has particularly severe effects on poor women, via impacts on their time, income, and nutrition. Other studies in India have found that indoor air pollution generated by cooking stoves has the most adverse effects on women and children under five (Parikh, Smith, and Laxmi 1999). Similarly, critics of inadequate regulation of pesticide use in the United States have pointed out that children are most vulnerable to their effects (Wargo 1998). The extent to which differences in these individual attributes translate into differences in power depends on the political framework. Holding the distribution of income and other attributes constant, a society with free elections and a high degree of respect for political rights and civil liberties will have a more equal distribution of power than one with an authoritarian or totalitarian regime. Despite the relatively egalitarian distribution of income in the Soviet Union, for example, power was quite inequitably distributed, a factor that arguably contributed to its dismal record in environmental protection (Pryde 1991).
6
The next section analyzes how disparities in power, arising from interactions between individual attributes and the political framework, can affect both the incidence of environmental costs and the extent of environmental protection. 3. The Power-weighted Social Decision Rule Formally, we can analyze the impact of the “non-economic” dimensions of power (that is, the four dimensions other than purchasing power) by comparing actual social decisions to those prescribed by the normative rule of benefit-cost analysis (BCA). The BCA rule is: max ∑
iib ,
where bi = the net benefit to the ith individual, with costs counted as negative benefits. The outcome of this rule is “efficient” in the sense that total net benefits are maximized.4 These benefits are conventionally measured in monetary terms, with non-market benefits and costs assessed using various techniques founded on the criterion of “willingness to pay.” As a result, in the shadow markets of BCA as in the actual markets for goods and services, purchasing power plays a crucial role, a point to which I return below. In many cases, social decisions can more accurately be better described by a power-weighted social decision rule (PWSDR), in which benefits and costs are weighed by the power of those to whom they accrue (Boyce 1994): max ∑
iiibπ
where πi = the power of the ith individual. Whereas the benefit-cost rule addresses the normative question of what a society should do, the PWSDR addresses the positive question of what a society does. The two correspond only in the special case where all individuals have equal power (that is, πi = πj for all i, j). The PWSDR predicts that environmental protection decisions will systematically diverge from the “optimal” level prescribed by BCA whenever power disparities exist between the winners (those for whom bi > 0) and the losers (those for whom bi < 0). Power here plays a role similar to that of “influence” in Becker’s (1983) model of fiscal policy. The remedy that Becker proposes for inefficiencies arising from disparities in influence is simply to downsize the state, thereby reducing the scope for the powerful to
4 This does not mean that the result is efficient in the strict sense of Pareto optimality. In practice, some people typically are made worse off by decisions based on the BCA rule, notwithstanding the “potential Pareto improvement” represented by a larger economic pie. As Amartya Sen (1987, p. 33) remarks, “The losers could include the worst off and the most miserable in the society, and it is little consolation to be told that it is possible to compensate them fully, but (‘good God!’) no actual plan to do so.”
7
pursue private gains at the expense of the public good. When we turn to environmental policy, however, the inadequacy of this remedy becomes evident. In the presence of externalities, inefficiencies can result not only from government action, but also from government inaction. In such cases, the only remedy for the inefficiencies caused by power inequalities is democratization, defined as movement toward a more equal distribution of power. Power, like utility, is not directly observable. But in the same way that neoclassical microeconomic theory infers utility from preferences as revealed by individual choice, so we can infer power from the preferences as revealed by social choice. Like the utility-maximization model of individual behavior, the PWSDR yields testable predictions. Two hypotheses Two hypotheses on environmental protection can be derived from the PWSDR. The first concerns how the environmental-quality pie is sliced; the second concerns its overall size.
• H1: Social choices regarding environmental protection will systematically favor some individuals and groups over others, reflecting their relative power.
• H2: The more unequal the distribution of power, the lower will be the level of
environmental protection and the greater the magnitude of environmental degradation.
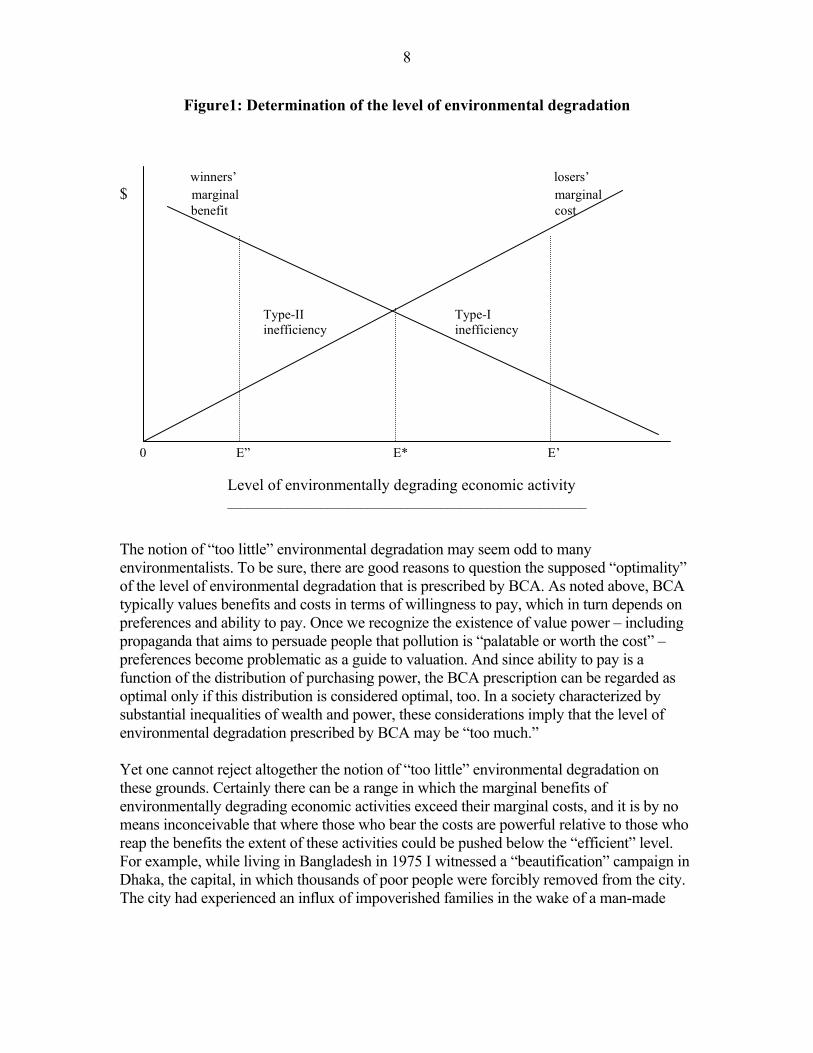
The rationale for the first hypothesis is straightforward, but the second requires some elaboration. The PWSDR can result in either “too much” environmental degradation or “too little” when compared to the normative BCA rule. When the winners from environmentally degrading economic activities are powerful relative to the losers, the PWSDR predicts too much degradation; but when the losers are more powerful than the winners, it predicts too little. Figure 1 depicts these possibilities, labeling them Type-I and Type-II inefficiencies, respectively. The “optimal” environmental degradation prescribed by BCA is represented by E* in Figure 1. Beyond this level, there is too much environmental degradation in that its marginal cost to the losers exceeds its marginal benefit to the winners. This is equivalent to saying that the marginal benefit of environmental protection would exceed its marginal cost. To the left of E*, there is “too little” environmental degradation in the sense that the marginal benefits of the environmentally degrading activity would exceed its costs. E* = “optimal” level prescribed by cost-benefit analysis; E’ = level under the power-weighted social decision rule when winners are more powerful than losers; E” = level under the power-weighted social decision rule when losers are more powerful than winners.
8
Figure1: Determination of the level of environmental degradation
winners’ losers’ $ marginal marginal benefit cost Type-II Type-I inefficiency inefficiency 0 E” E* E’ Level of environmentally degrading economic activity
______________________________________________________ The notion of “too little” environmental degradation may seem odd to many environmentalists. To be sure, there are good reasons to question the supposed “optimality” of the level of environmental degradation that is prescribed by BCA. As noted above, BCA typically values benefits and costs in terms of willingness to pay, which in turn depends on preferences and ability to pay. Once we recognize the existence of value power – including propaganda that aims to persuade people that pollution is “palatable or worth the cost” – preferences become problematic as a guide to valuation. And since ability to pay is a function of the distribution of purchasing power, the BCA prescription can be regarded as optimal only if this distribution is considered optimal, too. In a society characterized by substantial inequalities of wealth and power, these considerations imply that the level of environmental degradation prescribed by BCA may be “too much.” Yet one cannot reject altogether the notion of “too little” environmental degradation on these grounds. Certainly there can be a range in which the marginal benefits of environmentally degrading economic activities exceed their marginal costs, and it is by no means inconceivable that where those who bear the costs are powerful relative to those who reap the benefits the extent of these activities could be pushed below the “efficient” level. For example, while living in Bangladesh in 1975 I witnessed a “beautification” campaign in Dhaka, the capital, in which thousands of poor people were forcibly removed from the city. The city had experienced an influx of impoverished families in the wake of a man-made
9
famine in the previous year. 5 The makeshift houses they had constructed on vacant lots were razed to the ground, and the residents were transported to squalid camps outside the town, far from the eyes of the city’s more affluent residents and equally far from urban employment opportunities. One day, near Dhaka’s General Post Office, I saw a squadron of policemen clearing the street of beggars, using batons to prod the slow or reluctant onto the truck that would haul them away. An emaciated baby sat on a rag on the sidewalk, her mother having wandered down the street begging for alms. A policeman spotted the child, picked her up, and tossed her into the back of the truck, which lumbered off in search of more human eyesores. To the architects of the beautification campaign, the very presence of the poor in Dhaka was a kind of environmental degradation. This recalls the “externality” view of poverty:
People must not be allowed to become so poor that they offend or are hurtful to society. It is not so much the misery and plight of the poor but the discomfort and cost to the community which is crucial to this view of poverty. We have a problem of poverty to the extent that low income creates problems for those who are not poor. (Rein 1971, p. 46, cited by Sen 1981, p. 9)
The costs to the rich may have been modest, when compared to the benefits to the poor of securing a livelihood in the city. But the expulsion of the poor reflected the balance of power in urban Bangladesh. If, in principle, power inequalities can cause both types of inefficiencies – too much environmental degradation and too little – we must ask which is likely to be more prevalent. The answer hinges on the correlation between net benefits (bi) and power (πi), summed over all environmentally degrading economic activities. If the correlation is positive – that is, if the winners tend to be more powerful than the losers – then the net environmental impact of power inequalities will be more environmental degradation than would be prescribed by the BCA rule. If the correlation is negative, the PWSDR yields the opposite result. There is good reason to expect the correlation to be positive. The benefits from environmentally degrading economic activities accrue to firms and individuals in the form of producers’ surplus and consumers’ surplus. The rich generally reap more of both than do the poor, by virtue of the simple facts that they own more productive assets and consume more goods and services. Hence we can expect wealth to be correlated with net benefits. At the same time, wealth is generally correlated with power. If both benefits and power are correlated with wealth, they are likely to be correlated with each other. Type-I inefficiencies are therefore likely to be more prevalent than Type-II inefficiencies, in which case wider inequalities in the distribution of power lead to higher overall levels of environmental degradation. 5 For accounts of the famine, see Ravallion (1987) and Sen (1981, Ch. 9).
10
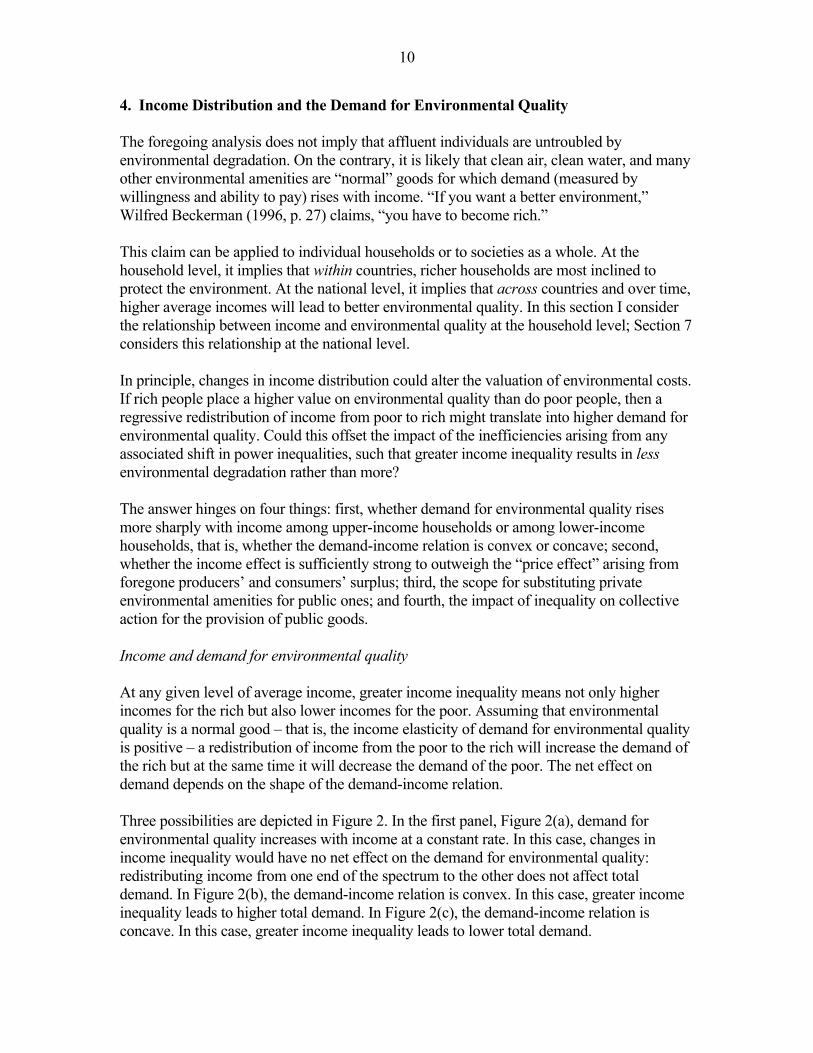
4. Income Distribution and the Demand for Environmental Quality The foregoing analysis does not imply that affluent individuals are untroubled by environmental degradation. On the contrary, it is likely that clean air, clean water, and many other environmental amenities are “normal” goods for which demand (measured by willingness and ability to pay) rises with income. “If you want a better environment,” Wilfred Beckerman (1996, p. 27) claims, “you have to become rich.” This claim can be applied to individual households or to societies as a whole. At the household level, it implies that within countries, richer households are most inclined to protect the environment. At the national level, it implies that across countries and over time, higher average incomes will lead to better environmental quality. In this section I consider the relationship between income and environmental quality at the household level; Section 7 considers this relationship at the national level. In principle, changes in income distribution could alter the valuation of environmental costs. If rich people place a higher value on environmental quality than do poor people, then a regressive redistribution of income from poor to rich might translate into higher demand for environmental quality. Could this offset the impact of the inefficiencies arising from any associated shift in power inequalities, such that greater income inequality results in less environmental degradation rather than more? The answer hinges on four things: first, whether demand for environmental quality rises more sharply with income among upper-income households or among lower-income households, that is, whether the demand-income relation is convex or concave; second, whether the income effect is sufficiently strong to outweigh the “price effect” arising from foregone producers’ and consumers’ surplus; third, the scope for substituting private environmental amenities for public ones; and fourth, the impact of inequality on collective action for the provision of public goods. Income and demand for environmental quality At any given level of average income, greater income inequality means not only higher incomes for the rich but also lower incomes for the poor. Assuming that environmental quality is a normal good – that is, the income elasticity of demand for environmental quality is positive – a redistribution of income from the poor to the rich will increase the demand of the rich but at the same time it will decrease the demand of the poor. The net effect on demand depends on the shape of the demand-income relation. Three possibilities are depicted in Figure 2. In the first panel, Figure 2(a), demand for environmental quality increases with income at a constant rate. In this case, changes in income inequality would have no net effect on the demand for environmental quality: redistributing income from one end of the spectrum to the other does not affect total demand. In Figure 2(b), the demand-income relation is convex. In this case, greater income inequality leads to higher total demand. In Figure 2(c), the demand-income relation is concave. In this case, greater income inequality leads to lower total demand.

11
Figure 2: Household income and demand for environmental quality
QD QD QD yi yi yi (a) linear (b) convex (c) concave Key: QD = demand for environmental quality yi = household income
______________________________________________________ The claim that greater income inequality (as distinct from higher average incomes) leads to greater demand for environmental quality therefore hinges, first, on the assumption that the demand-income relation in convex as in Figure 2(b). The price of environmental quality Environmental quality has a price, in form of producers’ and consumer’s surplus foregone when external costs are internalized. Pollution abatement and other measures to protect the environment raise the firm’s internal costs of production. This results in lower producer incomes and/or higher consumer prices, depending on how readily the firm can pass cost increases on to its customers. A more unequal income distribution means that the rich reap a greater share of producers’ and consumers’ surplus. Wider income inequality thus raises the “price” of environmental protection to the rich. This price effect operates in the opposite direction of the income effect. Returning to Figure 1, these two effects could be represented by rises in the marginal benefit and marginal cost curves, respectively. Whether the “efficient” level of environmental degradation rises or falls depends on the balance between the two. In other words, even though richer individuals may desire more environmental quality, but they also desire more of the goods and services that are responsible for environmental degradation. Faced with this tradeoff, it is not obvious that their desire for environmental quality will prevail. The claim that greater income inequality leads to greater demand for environmental quality therefore hinges, second, on the assumption that the income effect outweighs the price effect.
12
Private-public substitution Many elements of environmental quality are not pure public goods. To some extent, at least, the affluent can purchase private environmental quality (or private insulation from public bads), by living in relatively unpolluted enclaves, drinking bottled water, and taking holidays in pristine locations, and so on. The extent to which their demand for environmental quality translates into demand for the public elements of environmental quality depends on the scope for substitution between the private and public elements. Studies of environmental disparities within countries and regions, some of which are reviewed in Section 5, provide evidence that many important aspects of environmental quality indeed are not pure public goods. These studies have documented the higher-than-average levels of pollution and environmental hazards to which low-income communities and disempowered racial and ethnic groups are exposed. The flip side of this coin is that high-income communities and more powerful groups are exposed to lower-than-average levels of pollution and hazards. Insofar as the costs from environmentally degrading economic activities can be imposed on others – separated spatially, as well as socially, from the beneficiaries – the affluent can have their environmental-quality cake and eat it too, protecting favored locations while despoiling others. Carried to its extreme, this could yield world partitioned into “sacred groves and sacrifice zones” (Hecht 2002). The claim that greater income inequality leads to greater demand for public environmental quality therefore hinges, third, on the assumption that the scope for substituting private environmental quality for public environmental quality is sufficiently small. Collective action Insofar as environmental quality cannot be purchased privately, but is indeed a public good, its provision requires more than individual demand. It also requires collective action to solve the free-rider problem. The degree of income inequality may affect a society’s ability to engage in collective action. As the essays in this volume attest, ascertaining the direction of this effect is not a straightforward matter. On the one hand, inequality may facilitate collective action by fostering the emergence of strong leaders who are able to internalize a large share of the benefits from public goods and enforce the rules of cooperation. On the other hand, inequality may corrode the bonds of sympathy and trust that constitute “social capital.” The net effect may vary from time to time, and from place to place. The claim that greater income inequality leads to more environmental protection therefore hinges, fourth, on the assumption that inequality facilitates, or at least does not seriously impede, collective action. Taken together, then, a rather restrictive set of assumptions must hold true for income inequality to have a positive effect on environmental protection. Demand for environmental quality must be convex in income. The resultant income effect must outweigh the price effect arising from the costs of environmental protection in terms of reduced producers’ and consumers’ surplus. The scope for fulfilling demand for environmental quality privately

13
must be too small to displace the increased demand for the public elements of environmental quality. And the impact of income inequality on the society’s ability to engage in collective action must not undermine the effectiveness of this demand. If all of these conditions hold, then higher income inequality would raise the “efficient” level of environmental protections, and this could outweigh the inefficiencies resulting from any associated increase in power disparities. Otherwise, income inequality may have an adverse effect on environmental protection. Empirical studies can shed light on which outcome is more common in practice. 5. Environmental Injustice This section briefly reviews studies of environmental injustice in the United States, to assess whether the empirical evidence supports the hypothesis that the direction of environmental protection (that is, who is protected from whom) reflects power inequalities related to class, racial, and ethnic differences. No attempt will be made here to provide a comprehensive survey of this large and growing literature.6 Instead I highlight a few key issues. Early studies In the 1980s, several influential studies appeared that examined the distribution of environmental hazards along race and class lines in the United States (Bullard 1983; U.S. General Accounting Office 1993; United Church of Christ 1987; Bullard 1990). The main focus of these early studies was the correlation between the location of hazardous waste sites and the demographic characteristics of the communities in which they are located. Their general conclusion was that such sites are located disproportionately in communities with above-average percentages of African-American residents and below-average household incomes. Apart from the statistical correlations reported in these studies, “smoking gun” evidence of environmental injustice surfaced in the Cerrell report, a 1984 consultant’s report commissioned by the California Waste Management Board. Noting that “political criteria have become every bit as important in determining the outcome of a project as engineering factors” and that “a great deal of time, resources, and planning could be saved and political problems avoided if people who are resentful and people who are amenable to Waste-to-Energy projects [a.k.a. incinerators] could be identified before selecting a site,” the report recommended that “middle and higher-socioeconomic strata neighborhoods should not fall at least within the one-mile and five-mile radii of the proposed site” (Cerrell Associates 1984, pp. 17, 31, 43).7
6 For literature reviews, see Szasz and Meuser (1997), Bowen (2000, Ch. 6), and Pastor (2001). 7 Other attributes included in the report’s “personality profile” of those likely to offer the least resistance to siting decisions included “older people, people with a high school education or less, and those who adhere to a free market orientation” (Cerrell Associates 1984, p. 43).
14
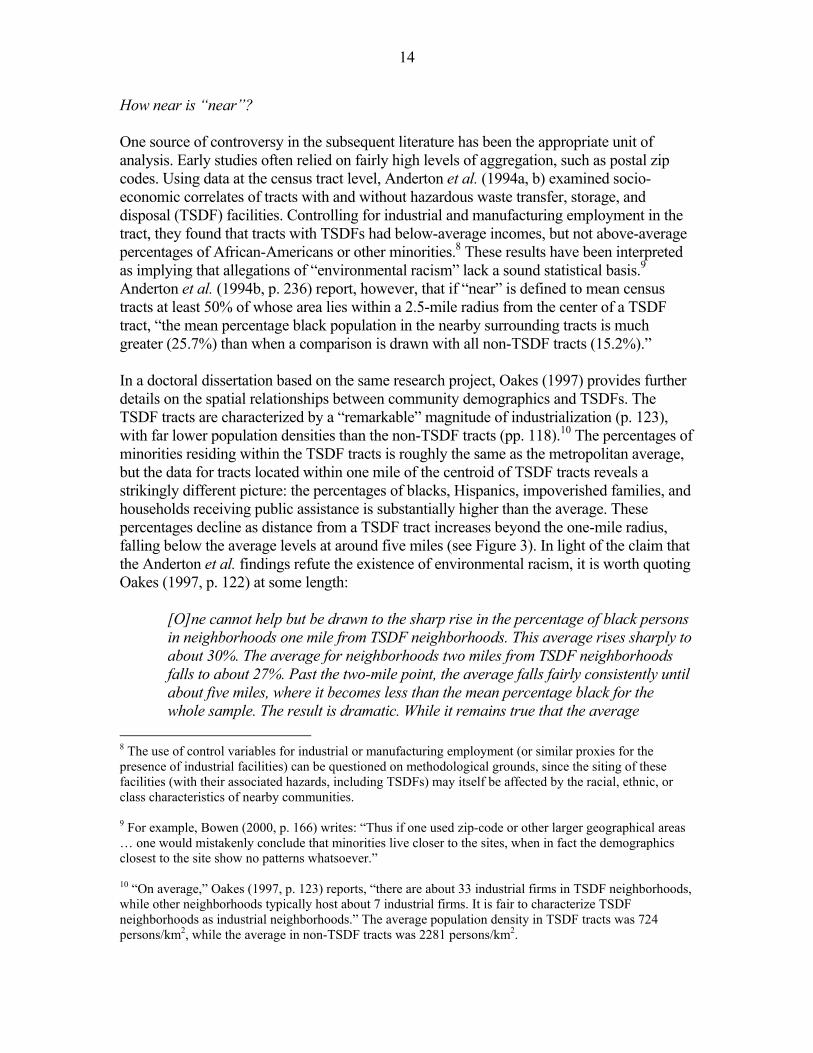
How near is “near”? One source of controversy in the subsequent literature has been the appropriate unit of analysis. Early studies often relied on fairly high levels of aggregation, such as postal zip codes. Using data at the census tract level, Anderton et al. (1994a, b) examined socio-economic correlates of tracts with and without hazardous waste transfer, storage, and disposal (TSDF) facilities. Controlling for industrial and manufacturing employment in the tract, they found that tracts with TSDFs had below-average incomes, but not above-average percentages of African-Americans or other minorities.8 These results have been interpreted as implying that allegations of “environmental racism” lack a sound statistical basis.9 Anderton et al. (1994b, p. 236) report, however, that if “near” is defined to mean census tracts at least 50% of whose area lies within a 2.5-mile radius from the center of a TSDF tract, “the mean percentage black population in the nearby surrounding tracts is much greater (25.7%) than when a comparison is drawn with all non-TSDF tracts (15.2%).” In a doctoral dissertation based on the same research project, Oakes (1997) provides further details on the spatial relationships between community demographics and TSDFs. The TSDF tracts are characterized by a “remarkable” magnitude of industrialization (p. 123), with far lower population densities than the non-TSDF tracts (pp. 118).10 The percentages of minorities residing within the TSDF tracts is roughly the same as the metropolitan average, but the data for tracts located within one mile of the centroid of TSDF tracts reveals a strikingly different picture: the percentages of blacks, Hispanics, impoverished families, and households receiving public assistance is substantially higher than the average. These percentages decline as distance from a TSDF tract increases beyond the one-mile radius, falling below the average levels at around five miles (see Figure 3). In light of the claim that the Anderton et al. findings refute the existence of environmental racism, it is worth quoting Oakes (1997, p. 122) at some length:
[O]ne cannot help but be drawn to the sharp rise in the percentage of black persons in neighborhoods one mile from TSDF neighborhoods. This average rises sharply to about 30%. The average for neighborhoods two miles from TSDF neighborhoods falls to about 27%. Past the two-mile point, the average falls fairly consistently until about five miles, where it becomes less than the mean percentage black for the whole sample. The result is dramatic. While it remains true that the average
8 The use of control variables for industrial or manufacturing employment (or similar proxies for the presence of industrial facilities) can be questioned on methodological grounds, since the siting of these facilities (with their associated hazards, including TSDFs) may itself be affected by the racial, ethnic, or class characteristics of nearby communities. 9 For example, Bowen (2000, p. 166) writes: “Thus if one used zip-code or other larger geographical areas … one would mistakenly conclude that minorities live closer to the sites, when in fact the demographics closest to the site show no patterns whatsoever.” 10 “On average,” Oakes (1997, p. 123) reports, “there are about 33 industrial firms in TSDF neighborhoods, while other neighborhoods typically host about 7 industrial firms. It is fair to characterize TSDF neighborhoods as industrial neighborhoods.” The average population density in TSDF tracts was 724 persons/km2, while the average in non-TSDF tracts was 2281 persons/km2.

15
percentage black persons in TSDF neighborhoods is no greater than the same average in non-TSDF neighborhoods, at least some neighborhoods near TSDF neighborhoods contain a much greater percentage of black persons. Furthermore, the average percentage of black persons in neighborhoods surrounding TSDFs falls consistently as distance is increased past two miles.
There is no obvious a priori basis for judging the “right” spatial unit of analysis – how close people must live to an environmental hazard for it to be judged relevant to their well-being, and hence relevant to analyses of environmental justice. It clearly would be rash, however, to claim that the only relevant unit is the (predominantly industrial) census tract within which the hazard is located, and that the demographic characteristics of nearby residential communities are inconsequential. Contrary to the “spin” often placed on their findings, the results of the study by Anderton et al. therefore offer strong evidence of environmental injustice along lines of race and ethnicity as well as class. Siting versus “move-in” A further issue of debate in the literature is the direction of causality. In theory, correlations between the location of environmental hazards and the demographic characteristics of
______________________________________________________
Figure 3: Demographic characteristics by distance to nearest TSDF tract (with 95% confidence intervals)
Source: Oakes (1997, p. 147).
16
nearby communities could arise not only as a result of siting decisions, but also as a result of post-siting demographic changes. After the siting of a nuisance, those who can afford to do so might move elsewhere, and at the same time falling property values might lure others to move in. Such “market dynamics” may cause or contribute to the correlations (Been 1994). While siting decisions can be seen as unambiguous evidence of environmental inequity, move-in may seem less reprehensible, since the resulting disparities are the result of choices freely made by individuals (constrained, as in all economic choices, by their incomes) to accept lower environmental quality in return for housing that is preferable to the alternatives in other respects. In such cases, disproportionate exposure to hazards is “merely” a function of lack of income, rather than lack of power.11 The most thorough longitudinal study of this issue is an analysis of TSDF siting in Los Angeles County from 1970 to 1990 (Pastor et al. 2001). Examining demographic patterns before and after the siting of TSDFs, the authors find little evidence of disproportionate move-in along racial or ethnic lines. They find strong evidence, on the other hand, that neighborhoods with above-average percentages of African-Americans and Latinos and with below-average incomes before the siting decision were more likely to receive a TSDF. The authors conclude that “demographics reflecting political weakness” are the most reliable predictors of where TSDFs will be sited. Political economy of vulnerability While a growing body of evidence documents that race, ethnicity, and class are correlated with the incidence of environmental costs, the mechanisms by which these characteristics affect vulnerability have yet to be explored in detail. Hamilton (1993) and Brooks and Sethi (1997) find that voter participation, a variable they interpret as a proxy for the propensity of communities to engage in collective action, is a statistically significant predictor of TSDF siting and toxic air releases, respectively. In the Los Angeles study, Pastor et al. (2001) find that neighborhoods that are fairly evenly split between African-Americans and Latinos, and those that are undergoing “ethnic churning” or rapid changes in their demographic composition, are most vulnerable to TSDF siting. Pastor (2001) suggests that this arises from the relatively weak “social capital” in such neighborhoods. Siting versus exposure Most environmental justice studies have focused on the location of hazardous facilities, rather than the resulting exposure to pollutants. Information on exposure or exposure risks could provide more direct evidence of environmental inequities. Such information also may help to resolve the unit-of-analysis issue discussed above. A new database being developed by the US Environmental Protection Agency (EPA) makes such studies more feasible. Drawing on data from the Toxic Release Inventory (TRI), the
11 Note that the “move-in” explanation for environmental disparities is more plausible when proximity to hazards is negatively correlated with income than when it is correlated with race or ethnicity, holding income constant.

17
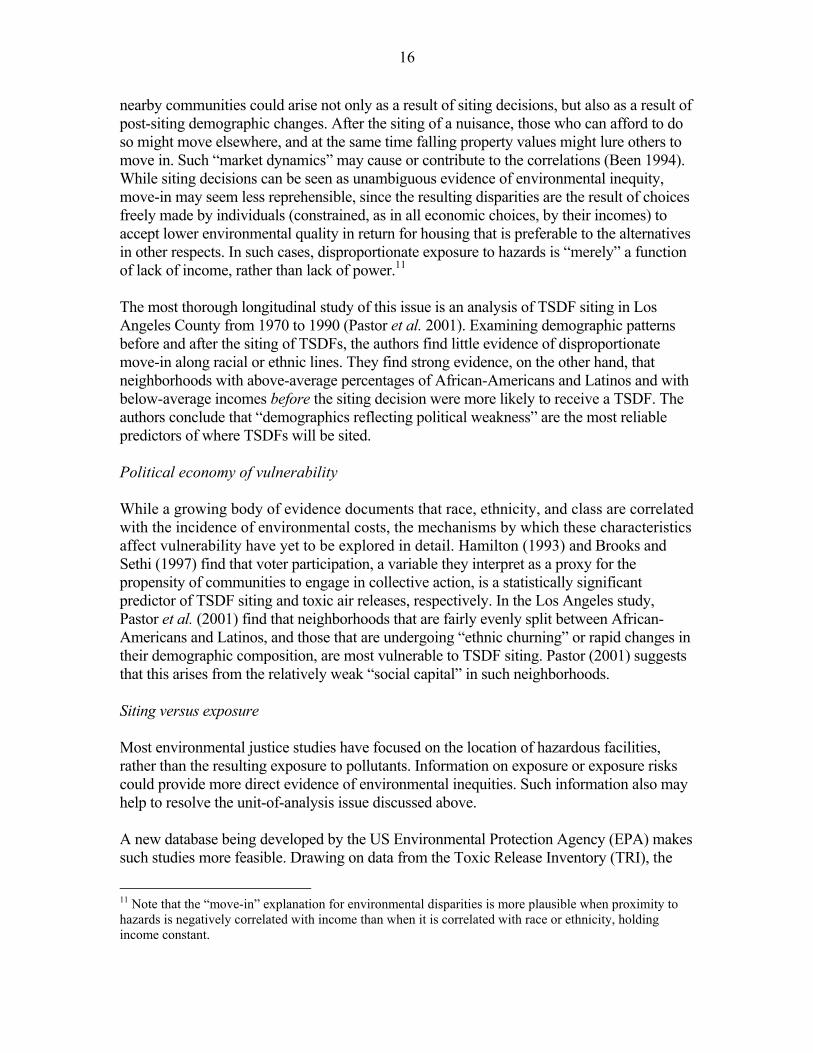
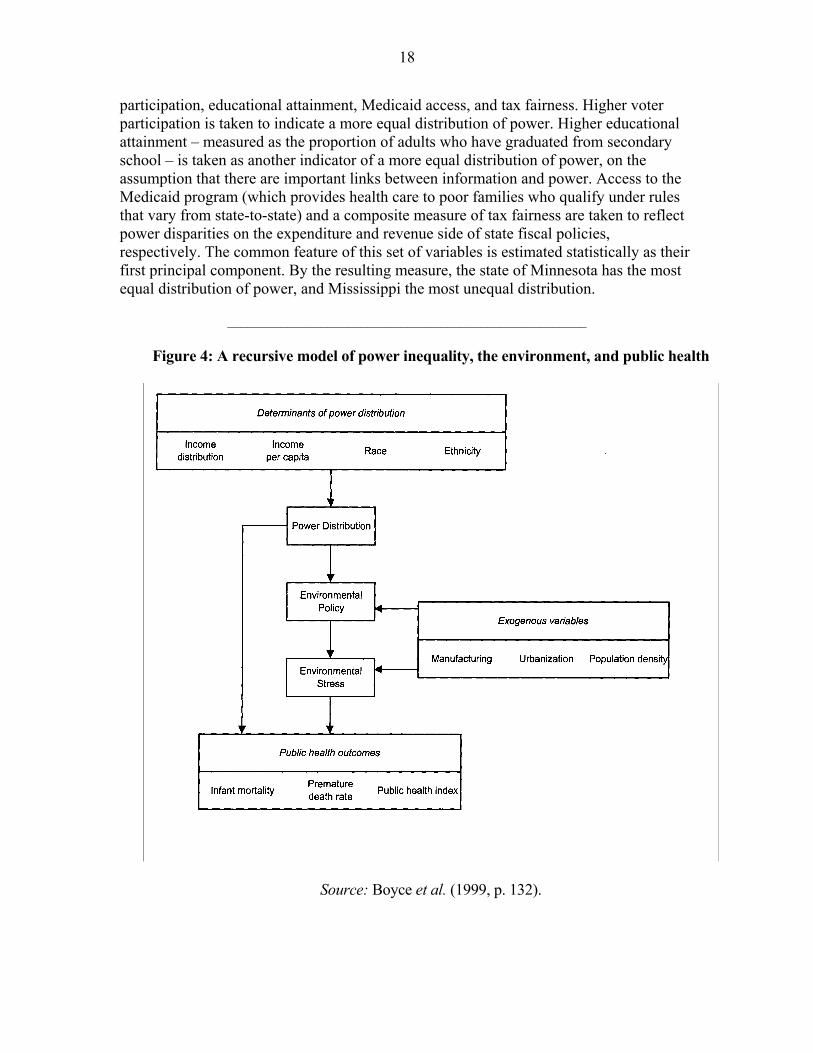
EPA’s Risk-Screening Environmental Indicators (RSEI) project is intended mainly to provide information for the prioritization of risk-reduction efforts. The TRI contains annual data on the volume (by weight) of toxic chemical releases by thousands of industrial facilities across the United States. The usefulness of these data for assessing hazards to nearby communities has been limited, however, by the fact that the hundreds of chemicals covered in the inventory vary in toxicity by as much as seven orders of magnitude, and by the lack of information on how these releases are dispersed by prevailing winds and water currents. The RSEI project incorporates information on toxicity and dispersal, partitioning the entire country into a one-square-kilometer grid for this purpose. A national-level analysis of these exposure-risk data reveals that the localities facing the greatest risks are inhabited by significantly higher-than-average percentages of blacks, Latinos, and Asian-Americans (Bouwes et al. 2001). The disparities are even sharper when dummy variables are included to control for variations across metropolitan areas: within the nation’s metropolitan areas, people of color systematically tend to live on the “wrong side” of the environmental tracks (Fetter and Ash 2002). So what? A final set of issues relates to the consequences of environmental injustice. What are the impacts of environmental burdens on the economic, physical, and emotional well-being of people who reside in the affected communities – and how important are these compared to the other problems they confront in their daily lives? There is evidence, for example, that health is affected adversely by poverty and inequality (Kaplan et al. 1996; Kennedy et al. 1996), but the role of environmental variables in this regard has yet to be explored in depth. A recent study of variations in school performance in metropolitan Los Angeles suggests that, controlling for other socioeconomic predictors, exposure to airborne toxics has a statistically significant negative effect on academic test scores (Pastor et al., 2000). Other potential effects that warrant investigation include impacts on property values, medical expenses, and days lost from work due to illness. 6. Inequality and Environmental Quality: Evidence from the United States The second hypothesis derived from the power-weighted social decision rule – that inequalities in the distribution of power affect the total magnitude of environmental degradation – has been tested in a study of the United States by Boyce et al. (1999), using cross-sectional data from the 50 states. As a unit of analysis, the state is attractive in that while all 50 states operate within the same overall U.S. political framework, the state governments play a major role in the formulation and enforcement of environmental protection policies, with considerable state-to-state variations. The study estimates a recursive econometric model in which power inequality affects environmental policy, these policies affect environmental quality, and this in turn affects public health. The structure of the model is depicted in Figure 4. To construct a state-level measure of power inequality, Boyce et al. combine data on four variables: voter
18
participation, educational attainment, Medicaid access, and tax fairness. Higher voter participation is taken to indicate a more equal distribution of power. Higher educational attainment – measured as the proportion of adults who have graduated from secondary school – is taken as another indicator of a more equal distribution of power, on the assumption that there are important links between information and power. Access to the Medicaid program (which provides health care to poor families who qualify under rules that vary from state-to-state) and a composite measure of tax fairness are taken to reflect power disparities on the expenditure and revenue side of state fiscal policies, respectively. The common feature of this set of variables is estimated statistically as their first principal component. By the resulting measure, the state of Minnesota has the most equal distribution of power, and Mississippi the most unequal distribution.
______________________________________________________
Figure 4: A recursive model of power inequality, the environment, and public health
Source: Boyce et al. (1999, p. 132).

19
To assess the validity of this measure of power inequality and shed light on its underlying determinants, the authors estimate the following equation, with and without regional dummy variables:
π = α1 + β1G + β2Y + β3RACE + β4ETH + µ1 (1) where π is power inequality; G is the Gini ratio of income distribution; Y is per capita income; RACE is the percentage of African-Americans in the state’s population; ETH is the percentage of people of Hispanic origin; and µ1 is an independent, normally distributed error term with zero mean. The results indicate that higher income inequality, higher percentages of African-Americans, and higher percentages of Hispanics are associated with greater power inequalities, and that higher average income is associated with lower power inequalities. Together, these variables “explain” more than half of the variation in power inequality across the 50 states. The authors then analyze the impact of power inequality on environmental policies, using an environmental policy index (EP) that is based on 77 indicators of the strength of state environmental policies in areas from toxic waste management, air quality and water quality to recycling, agriculture, energy and transportation. They estimate the following equation: EP = α2 + γ1π+ γ2MAN + γ3URB + γ4PD +µ2 (2) where the three control variables – the manufacturing share of output (MAN), urbanization (URB), and population density (PD) – are expected to generate demand for stronger environmental policies. This model “explains” about two-thirds of the variation in the environmental policy index. The estimated coefficients all have the expected signs, at levels of statistical significance ranging from 0.01% (in the case of the power inequality) to 5% (in the case of population density). Next the authors analyze the impact of environmental policies on environmental quality, using an aggregate measure of environmental stress (ES) based on 167 indicators, including data on air and water pollution, toxic chemical releases, transportation efficiency, and the health of forests and fisheries: ES = α3 + δ1EP + δ2MAN + δ3URB + δ4PD + µ3 (3) This model “explains” roughly half the variance in the environmental stress index. The estimated coefficient on the environmental policy index has the expected sign and is statistically significant at the 0.01% level; manufacturing and urbanization also are statistically significant as determinants of environmental stress, but population density has no significant independent effect. A Hausman test for endogeneity of the environmental policy index is negative; after controlling for manufacturing intensity,
20
urbanization, and population density, greater environmental stress does not appear to lead to stronger environmental policies.12 Finally, the authors examine the impact of environmental stress on public health by estimating the following model: HEALTH = α4 + Φ1ES + Φ2π + µ4 (4) where HEALTH is one of three measures of public health – infant mortality, the premature death rate, and a composite public health index. The power inequality measure is included on the right-hand side of equation (4) to allow for the possibility that it affects public health by avenues apart from environmental stress. The results indicate that states with greater environmental stress have poorer public health by all three measures, with the estimated coefficients statistically significant at the 5% level. When power inequality is included as an independent variable, it too has statistically significant adverse effects on all three public health variables; the adverse effect of environmental stress remains statistically significant at the 5% level in two of the three cases. This suggests that environmental impacts are one route by which power inequality diminishes public health, but not the only one. In sum, the study by Boyce et al. (1999) provides empirical support for the hypothesis that greater power inequality leads to weaker environmental policies, and that weaker policies in turn lead to greater environmental degradation. This suggests that inequalities in the distribution of power operate not only to the detriment of specific groups, but also to the detriment of environmental quality in the state as a whole. 7. Inequality and Environmental Quality: International Evidence International data have also been used to test the hypothesis that political and economic inequalities adversely affect environmental protection and environmental quality. Empirical research in this field confronts a number of difficulties: the paucity of internationally comparable data on environmental quality and on political and economic inequality; the pitfalls of international cross-sectional analysis, where the ceteris paribus assumption is always questionable; and the rather limited scope for deriving useful conclusions from time-series variations, given that the linkages between inequality and environmental quality are expected to operate over an extended time horizon. In recent years, however, international data have become available that permit some exploration of this topic. Several recent studies have ventured into this terrain, allowing us to draw some preliminary conclusions. The starting point for this research has been analysis
12 Whereas stronger environmental policies are expected to lead to lower environmental stress, higher environmental stress might lead to stronger environmental policies. If such endogeneity were present, this would bias the estimate of δ1 so as to make it less (rather than more) likely that equation (3) would yield a statistically significant estimate with the expected sign.
21
of the “environmental Kuznets curve,” a stylized relationship suggesting that environmental quality initially deteriorates as national per capita income rises, but then goes on to improve as per capita income rises further. This section reviews the handful of such studies that have examined the role of political and economic inequalities in this relationship. The “environmental Kuznets curve” The World Bank’s World Development Report 1992, which took the environment as its thematic focus, observed that some environmental problems “initially worsen but then improve as incomes rise,” and claimed that “most forms of air and water pollution” fit into this category (World Bank 1992, p. 10). A number of subsequent studies, among the most widely cited of which is one by Grossman and Krueger (1995), have reported the existence of such a relationship for a number of environmental variables.13 This pattern has been dubbed the “environmental Kuznets curve” (EKC) by virtue of its resemblance to the inverted U-shaped relationship between income inequality and per capita income first posited by Simon Kuznets (1955). The EKC immediately provoked controversy, in part because it could be cast as a prescription for complacency. Just as some economists interpreted the original Kuznets curve to mean that developing countries need not worry about income distribution, but should rely instead on economic growth to solve problems of poverty and inequality, so critics feared that the EKC would offer ammunition to “gung-ho” proponents of growth by downplaying environmental concerns. To be sure, the upward-sloping segment of the EKC shows that environmental quality initially deteriorates as per capita incomes rise, up to a turning point that is often estimated to be around $5000 per capita (roughly the level of Mexico or the Czech Republic). In the range of incomes below this level – where the most of the world’s nations and people are located – rising incomes would therefore be accompanied by a worsening of environmental quality. This suggests that even though environmental quality may be a “normal good” with a positive income elasticity of demand, the offsetting factors discussed in section 4 tend to dominate within this range. But the downward-sloping segment of the EKC suggests that eventually the deterioration in environmental quality can be reversed, and that further rises in per capita incomes help to bring this about. Most authors agree that such reversals, if and when they occur, result from the introduction of policies for environmental protection. “There is nothing automatic about this improvement,” the World Bank (1992, p. 10) suggests; “it occurs only when countries deliberately introduce policies to ensure that additional resources are devoted to dealing with environmental problems.” Similarly, Grossman and Krueger (pp. 371-2) suggest that “an induced policy response” in the form of tougher environmental regulations, driven by citizen demand, provides the principal link between rising incomes and declining pollution, and caution that “there is no reason to believe the process is an automatic one.” This echoes Kuznets’ (1955, p. 28) conclusion regarding the relationship between per
13 For a critical review of EKC studies, see Stern (1998).

22
capita income and income distribution: “Effective work in this field necessarily calls for a shift from market economics to political and social economy.” The impact of power inequality Building on this insight, several studies have examined the effects of variables related to power inequality on international variations in environmental quality. Torras and Boyce (1998) examine variations in air pollution (ambient concentrations of sulfur dioxide, smoke, and heavy particles), water pollution (concentrations of dissolved oxygen and fecal coliform), and the percentages of the population with access to safe water and sanitation facilities. In addition to per capita income and income distribution, they include two explanatory variables – adult literacy and an index of political rights and civil liberties – that they consider relevant to the distribution of power. In the case of low-income countries, they find that the estimated coefficients on the rights and literacy variables have the expected signs in all cases, and are statistically significant in five of the seven cases for the rights variable and in four of the seven for the literacy variable. They obtain mixed results in the high-income countries, suggesting that rights and literacy are most important as determinants of environmental quality when average incomes are low. Scruggs (1998) uses an index of political rights and civil liberties in an empirical exercise based on a mixed set of high and low-income countries. He finds that greater rights have a statistically significant favorable effect on sulfur dioxide concentrations; favorable but statistically insignificant effects on particulates and fecal coliform pollution; and a statistically significant adverse effect on dissolved oxygen. Barrett and Graddy (2000) also examine the impact of civil liberties and political rights, advancing the rationale that environmental quality depends not only on national income, but also on “citizens being able to acquire information about the quality of their environment, to assemble and organize, and to give voice to their preferences for environmental quality; and on governments having an incentive to satisfy these preferences by changing policy, perhaps the most powerful incentive being the desire to get elected or re-elected” (p. 434). They find the empirical evidence to be consistent with this expectation in the case of air pollution by sulfur dioxide, smoke, and particulates: “pollution levels are monotonically decreasing in the extent of democratic freedoms” (p. 440). In the case of water pollutants, they find the rights variables to have significant favorable effects in the cases of fecal coliform, arsenic, and lead. For several other water quality variables, including dissolved oxygen, they find no statistically significant effects.14 Harbaugh et al. (2000) include a “democracy index” – a 0-10 index of the extent of democratic participation in government – in a re-examination of the evidence on sulfur dioxide, smoke, and particulate air pollution, using environmental data from the same source as the World Bank (1992), Grossman and Krueger (1995), Torras and Boyce (1998), and Barrett and Grady (2000). After cleaning and updating these data, the authors conclude that
14 The authors note that “oxygen loss does not threaten human health directly” (p. 447), perhaps helping to explain the lack of significant effects in this case.
23
“the evidence for an inverted-U relationship [between pollution and per capita income] is much less robust than previously thought” (p. 2). At the same time, however, their regression results reveal a very robust relationship between these pollutants and the democracy index: the estimated coefficients invariably have the expected sign, and they are statistically significant at the 1% level in twelve of the thirteen specifications tested. Finally, Neumayer (2002) examines the impact of four different proxies for “democracy” on international environmental commitments by national governments, including their ratification of and compliance with multilateral environmental agreements and participation in intergovernmental environmental organizations. He argues that a focus on environmental commitments, rather than environmental outcomes, is appropriate given the potentially long time lags between commitments and outcomes, the difficulty of monitoring outcomes, and the sensitivity of outcomes to factors outside a government’s control. While it can be argued that environmental commitments are not terribly important unless they do affect outcomes, it is certainly true that commitments tell us something about environmental protection and may be relatively easy to monitor. Neumayer finds strong evidence in favor of the hypothesis that democracies exhibit stronger environmental commitments; in most cases the estimated coefficients on the proxy variables are statistically significant, with the expected sign. In sum, the international studies that have been carried out so far offer fairly robust support to the hypothesis that inequalities in the distribution of power lead to weaker environmental protection and greater environmental degradation. The impact of income inequality Given the axes of the original Kuznets curve, surprisingly few EKC-type studies have explored the relationship between environmental quality and income distribution. There are two reasons why such a relationship might exist. The first is the political-economy effect arising from the correlation between the distribution of income and the distribution of power: ceteris paribus, countries with more unequal income distributions will tend to have more unequal power distributions. Of course, ceteris is seldom paribus, as the example of the former Soviet Union – where a highly unequal distribution of power co-existed with a fairly egalitarian income distribution – reminds us. Insofar as income inequality does translate into greater power inequality, however, the power-weighted social decision rule leads to the prediction that at any given level of average income, countries with higher income inequality will have higher levels of environmental degradation. A second reason why income distribution may matter for the environment is that the amount of environmental degradation per unit of income may vary systematically across households ranked by income. If so, the overall level of environmental degradation will reflect not only the country’s average income, but also the distribution of income across households. The sign of this “aggregation effect” depends on the shape of the relationship between household income and environmental degradation (Heerink et al. 2001). If the relation is concave – a pattern sometimes termed a “household-level environmental
24
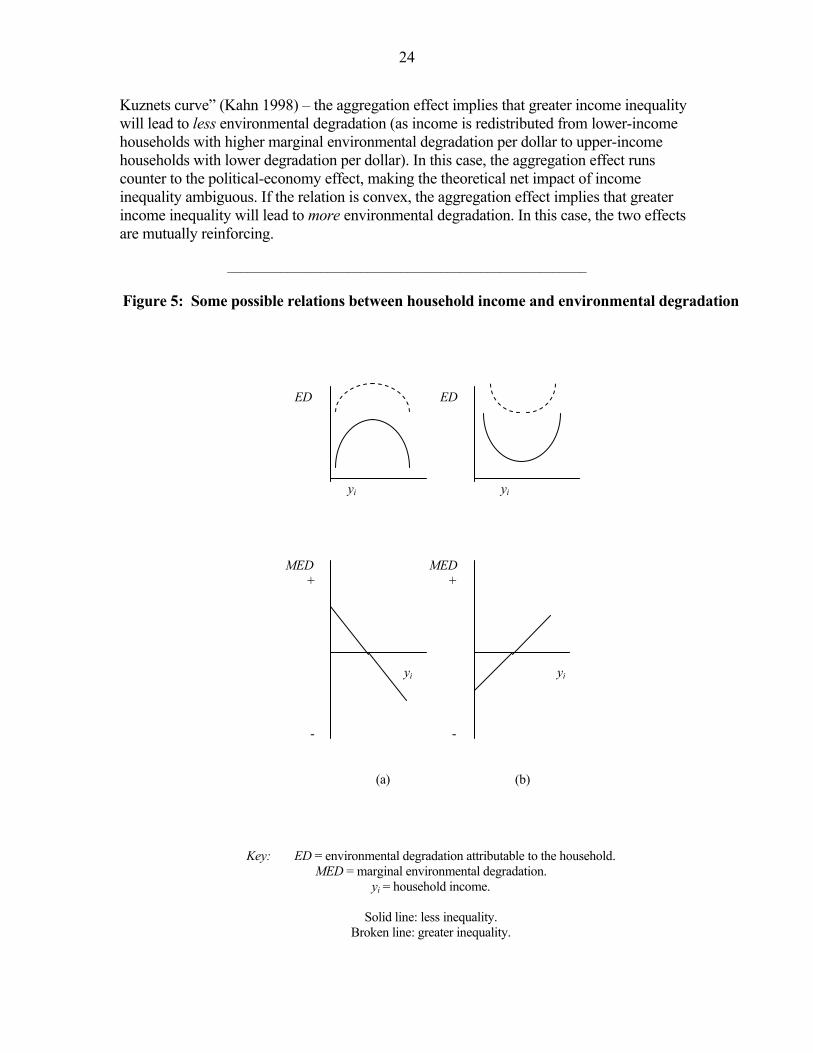
Kuznets curve” (Kahn 1998) – the aggregation effect implies that greater income inequality will lead to less environmental degradation (as income is redistributed from lower-income households with higher marginal environmental degradation per dollar to upper-income households with lower degradation per dollar). In this case, the aggregation effect runs counter to the political-economy effect, making the theoretical net impact of income inequality ambiguous. If the relation is convex, the aggregation effect implies that greater income inequality will lead to more environmental degradation. In this case, the two effects are mutually reinforcing.
______________________________________________________
Figure 5: Some possible relations between household income and environmental degradation
ED ED yi yi MED MED + + yi yi - - (a) (b)
Key: ED = environmental degradation attributable to the household. MED = marginal environmental degradation.
yi = household income.
Solid line: less inequality. Broken line: greater inequality.

25
These two possibilities are depicted in Figure 5. As in Figure 2, the horizontal axes depict household income, but instead of demand for environmental quality, the vertical axes depict the amount of environmental degradation attributable to the household (by virtue of its sources of income, pattern of consumption expenditure, or some combination of the two). In Figure 5(a), environmental degradation is concave in household income. Marginal degradation diminishes as income increases. Beyond some income level, MED may even turn negative – that is, further increments to income are associated with environmental improvements – causing total degradation to decline. In Figure 5(b), the environmental degradation is convex in household income: high-income households generate more environmental degradation per dollar income than do low-income households.15 The sign of the aggregation effect depends on the shape of the curve. The political-economy effect is depicted by the broken-line curves in Figure 5: whatever the shape of the relationship between household income and environmental degradation relation, higher inequality shifts the curve upward, with higher levels of environmental degradation at each level of household income.16 Attempts to allocate responsibility for aggregate environmental degradation across individual households would face formidable conceptual difficulties. One approach is to allocate responsibility so on the basis of consumer expenditure: a household that buys an automobile is thus responsible for the environmental impacts generated by its production, use, and ultimate disposal.17 A limitation of this approach is that consumers often have little information about the environmental impacts generated in the production of the goods and services they buy; it stretches the notion of “consumer sovereignty” to ascribe these impacts entirely to consumer preferences.18 An alternative approach is to allocate responsibility on the basis of income sources: households that derive income from the production of automobiles, in the form of profits or wages, bear responsibility for the associated environmental impacts. A limitation of this approach is that decisions on pollution control are typically in the hands of managers, not workers; it would be hard to infer much about workers’ environmental preferences on this basis. The practical data requirements of
15 As in Figure 5(a), the curves in Figure 5(b) are drawn to allow for the possibility of negative MED (and thus a downward-sloping segment of the ED curve), in this case at lower income levels. 16 For simplicity, I have drawn this “shift effect” so as to leave marginal environmental damage (MED) unchanged. Uneven shifts across the income range would change the MED curve, too.
17 In the case of automobiles, the share of each of the three stages of the product life-cycle – production, use, and disposal – in total environmental costs are estimated at 33%, 60%, and 7%, respectively (Kay1997, p. 93). 18 Moreover, circumstantial factors can affect the resulting pattern. For example, lower-income households in the United States tend to drive older vehicles that were built when emissions and fuel-efficiency standards were less stringent, whereas the rich tend to drive newer vehicles for which the standards are higher (Harrington and McConnell 1999, p. 22). This resulting pattern, arising from the phase-in of stricter regulations, may not generalize to other circumstances. For example, the recent boom in purchases by upper-income U.S. households of “sport utility vehicles” (SUVs) that are exempt from fuel-efficiency standards may reverse the pattern.
26
implementing either approach (or some combination of the two) are also formidable. The consumption-based approach requires detailed data on consumer expenditure (among households ranked by income or expenditure), input-output data on the quantities of raw materials and intermediate goods used in finished products, and data on the associated environmental impacts.19 The production-based approach requires detailed data on wages, salaries, and profits, in addition to input-output and environmental impact data. In either case, the relationship between household incomes and environmental degradation clearly depends on more than individual demand for environmental quality, as discussed in section 4. A further complication arises from the fact that some environmental degradation is caused by public-sector activities. There is no obvious way to allocate responsibility for the releases of radioactive materials at the Rocky Flats, Colorado, nuclear weapons plant, or for the dumping of bacteriological warfare agents on Vozrozhdeniye Island in the Aral Sea, across individual Americans or former Soviet citizens, ranked by their household incomes. Such cases highlight the importance of political-economy effects. The few empirical studies that have included income distribution in EKC-type regressions have yielded mixed results. Torras and Boyce (1998) estimate the effect of the Gini coefficient of income distribution alongside the effects of adult literacy and political rights and civil liberties. Their results thus control for the impact of these aspects of power inequality on environmental quality. In the low-income countries, they find that greater income equality is associated with lower levels of air pollution from sulfur dioxide and smoke (with the estimated coefficients being statistically significant at the 1% level). They also find that greater income equality is associated with higher levels of access to safe drinking water, greater access to sanitation facilities, and lower levels of fecal coliform in water bodies (though the relationship is statistically significant only in the case of safe water). In the same countries, however, greater income equality was associated with worse environmental quality for two variables: heavy-particle air pollution and dissolved oxygen in water bodies.20 Scruggs (1998) includes income distribution as a regressor in two empirical tests. The first, using data from a mixed set of 25-29 countries, analyzes two water-quality variables (dissolved oxygen and fecal coliform) and two air-quality variables (sulfur dioxide and particulates). He finds that income equality has a statistically significant favorable effect on dissolved oxygen, and a statistically significant adverse effect in the case of particulates; in the other two cases, its effect is adverse but not statistically significant. In a second exercise, using data from seventeen OECD countries, Scruggs takes as the dependent variable a composite index based on “levels of municipal waste, fertilizer use, and sulfur dioxide, 19 Studies of the distributional incidence of environmental taxes have assembled such data for certain pollutants; see, for example, Metcalf (1999). 20 For high-income countries the estimated impact of income inequality was generally weaker, a result consistent with Kuznets’ (1963, p. 49) conjecture that “not only the welfare equivalents but also the power equivalents of the same relative income spread show a much wider range when the underlying average income is low than when it is high.”
27
nitrous oxide, and carbon dioxide emissions” (p. 269). This is a rather curious set: the volume of municipal waste may be less relevant than how that waste is treated; how much fertilizer is used may be less relevant than what kinds, where, and how it is applied; nitrous oxide presumably is mistaken for nitrogen oxides; and the inclusion of carbon dioxide emissions is problematic since pollutants with long-term global impacts are less likely to generate policy responses than pollutants with short-term local impacts.21 In four of five specifications, Scruggs finds that income equality has an adverse impact on this composite environmental variable, although in no case is the estimated coefficient statistically significant at the 5% level.22 Magnani (2000) examines the impact of income distribution on public research and development expenditures for environmental protection in a set of OECD countries. Using a model in which social decisions are determined simply by the preferences of the median voter, she hypothesizes that income inequality reduces pro-environmental public expenditure due to a “relative income effect,” whereby greater inequality shifts the preferences of those with below-average income (including the median voter) in favor of greater consumption of private goods and lower expenditure on environmental public goods.23 She finds that in those countries with average or above-average per capita incomes, greater income equality has a positive effect on environmental expenditures; in countries with below-average levels of per capita income her results are less definitive. Heerink et al. (2001) include income distribution in a regression analysis of international variations in airborne sulfur dioxide and particulate concentrations, carbon dioxide emissions, access to safe water and sanitation, deforestation, and (for a 16-country sample of sub-Saharan African countries) the depletion of soil nitrogen and phosphorus. In six of these eight cases, the estimated coefficient on income distribution is statistically significant at the 1% level. In three of these cases – access to safe water, access to sanitation, and deforestation – they find that greater income equality has a favorable effect; in the other three – carbon dioxide emissions, nitrogen depletion, and phosphorus depletion – they find an adverse effect.
21 Scruggs divides emissions by national population to get a per capita measure. This too is problematic, since environmental quality is a matter of ambient concentrations and exposures, rather than emissions per capita. Higher emissions per capita in a sparsely populated country, where the emissions are widely dispersed, may be less harmful than lower emissions per capita in a densely populated country. The data presented by Scruggs (p. 273) indicate, for example, that per capita emissions of NOx and SOx are twice and 5.5 times as high, respectively, in Canada as in Holland. This does not necessarily imply worse environmental quality in Canada. 22 Another curious feature of Scruggs’ model for the OECD countries is the inclusion of the percentage contribution of nuclear power to the nation’s energy supply as a control variable. He finds that this variable has a positive effect on his environmental quality index; as he notes, this may indicate a shift in the composition of environmental costs rather than an overall reduction. 23 Magnani (2000, p. 435) attributes this to the notion that “one’s subjective feeling of well-being is based more on relative income than on absolute income,” inferring that this translates into a desire to improve one’s relative expenditure on private goods. The plausibility of this inference presumably depends on the distributional incidence of taxation for the provision of public goods.

28
In sum, the limited international evidence that is now available provides empirical support for the proposition that income inequality tends to exacerbate some types of air pollution (notably smoke and sulfur dioxide), lack of access to clean drinking water and sanitation facilities, and deforestation. In each of these cases, the political-economy effect – operating via the impact of income distribution on the balance of power between winners and losers – offers a plausible explanation. The contrary findings for carbon dioxide are not surprising, since environmental impacts that are displaced onto other countries and future generations are not as likely to generate domestic pressures for national-level policies to curb emissions (Ansuategi and Escapa 2002). Other contrary findings – such as those for particulate air pollution – are inconsistent with the effect expected on political-economy grounds. Inconclusive findings are not surprising, given (i) the rather poor quality of international data on income distribution;24 (ii) problems in the definition of environmental variables, the quality of environmental data, and sample selection; (iii) the theoretical ambiguity with respect to aggregation effects; and (iv) the possibility that income inequality simply is not a very good proxy for power inequality. 8. Concluding remarks Economic theory often treats market failure and government failure as impersonal, exogenous phenomena to be remedied by disinterested public policy. This essay suggests that the both the magnitude and incidence of environmental degradation and environmental protection can instead be treated as endogenous phenomena, shaped by the relative power of winners and losers. The mounting evidence that low-income communities and people of color in the United States bear disproportionate environmental burdens is consistent with the hypothesis that social decisions on environmental protection systematically favor the more powerful over the less powerful. The more limited evidence available on the impact of inequality on overall environmental quality offers support for the hypothesis that greater inequality in the distribution of power leads to lower levels of environmental protection and hence greater environmental degradation. There is much scope for further research on these issues. Among the potentially fruitful avenues for future study are the following:
• the measurement of power and power inequality, including the identification of relevant variables, alternative methods for aggregating these variables into comprehensive measures, and tests of their robustness;
• investigation of household-level relationships between income and environmental
impacts, a topic important not only for assessments of the distributional incidence
24 For example, for some countries the available data refer to income distribution, while for others they refer to expenditure distribution. Measures of the latter generally show less inequality, since the expenditure/income ratio tends to decline as household income rises.
29
of environmental policies, but also for estimation of the “aggregation effect” of income distribution on environmental quality;
• exploration of differences among environmental variables, in terms of public
demand for (and opposition to) environmental protection and its marginal costs;
• extension of environmental injustice research to include exposure to hazards (rather than just the location of hazardous facilities) and the impacts on such exposure on health, economic well-being, and other quality-of-life variables;
• documentation of the links between power-related variables, specific
environmental policies, and specific environmental outcomes; • estimation of the net effect of inequality on the environmental quality experienced
by those who are relatively well-off, to assess whether more egalitarian distributions of power and income might bring absolute gains in this dimension of their well-being even at this end of the distributional spectrum; and
• analysis of the complementarities and tradeoffs between intra-generational and
inter-generational equity, that is, between environmental justice and sustainability.
While much remains to be done, the broad contours of a new vision of the relationship between social justice and the environment are already visible. In the past two decades, advocates of social justice have grown increasingly aware of the importance of environmental protection, recognizing that the communities for whom they speak often bear disproportionate environmental costs. At the same time, advocates of environmental protection are beginning to recognize the importance of social justice: if inequality exacerbates environmental degradation, then advances in environmental quality will require movement toward a more democratic distribution of power and wealth.
30
References Agarwal, Bina (1992) “The Gender and Environment Debate: Lessons from India,” Feminist Studies 18(1): 119-158. Anderton, Douglas L., Andy B. Anderson, John Michael Oakes, Michael R. Fraser, Eleanor W. Weber, and Edward J. Calabrese (1994a) “Hazardous Waste Facilities: Environmental Equity Issues in Metropolitan Areas,” Evaluation Review 18(2): 123-140. Anderton, Douglas L., Andy B. Anderson, John Michael Oakes, and Michael R. Fraser (1994b) “Environmental Equity: The Demographics of Dumping,” Demography 31(2): 229-248. Ansuategi, Alberto and Marta Escapa (2002) “Economic Growth and Greenhouse Gas Emissions,” Ecological Economics 40(1): 23-37. Barrett, Scott and Kathryn Graddy (2000) “Freedom, Growth, and the Environment,” Environment and Development Economics 5: 433-456. Bartlett, Randall (1989) Economics and Power: An Inquiry into Human Relations and Markets. Cambridge: Cambridge University Press. Becker, Gary (1983) “A Theory of Competition Among Pressure Groups for Political Influence,’ Quarterly Journal of Economics 48(3): 371-400. Beckerman, Wilfred (1996) Through Green-Colored Glasses: Environmentalism Reconsidered. Washington, D.C.: Cato Institute. Been, Vicki (1994) “Locally Undesirable Land Uses in Minority Neighborhoods: Disproportionate Siting or Market Dynamics?” Yale Law Journal 103: 1383-1422. Bouwes, Nicolaas W., Stephen M. Hassur, and Marc D. Shapiro (2001) “Empowerment through Risk-Related Information: The EPA’s Risk-Screening Environmental Indicators Project,” Amherst, MA: Political Economy Research Institute, Working Paper No. DPE-01-06, February [http://www.umass.edu/peri/pdfs/WP18.pdf]. Bowen, William M. (2000) Environmental Justice through Research-Based Decision Making. New York: Garland. Boyce, James K. (1994) “Inequality as a Cause of Environmental Degradation,” Ecological Economics 11: 169-178. Boyce, James K., Andrew R. Klemer, Paul H. Templet, and Cleve E. Willis (1999) “Power Distribution, the Environment, and Public Health: A State-level Analysis,” Ecological Economics 29: 127-140.
31
Brooks, N. and R. Sethi (1997) “The Distribution of Pollution: Community Characteristics and Exposure to Air Toxics,” Journal of Environmental Economics and Management 32: 233-250. Bullard, Robert D. (1983) “Solid Waste Sites and the Black Houston Community,” Sociological Inquiry 53: 273-288. Bullard, Robert D. (1990) Dumping in Dixie: Race, Class, and Environmental Quality. Boulder: Westview. Cerrell Associates (1984) “Political Difficulties Facing Waste-to-Energy Conversion Plant Siting.” Report prepared for the California Waste Management Board, Technical Information Series, Waste to Energy, Chapter 3a. Crenson, Matthew (1971) The Un-Politics of Air Pollution: A Study of Non-Decisionmaking in the Cities. Baltimore: Johns Hopkins University Press. Fetter, T. Robert and Michael Ash (2002) “Social and Economic Correlates of Exposure to Industrial Pollution: Evidence from the EPA’s Relative Risk-Based Environmental Indicators Model,” Amherst, MA: Political Economy Research Institute, unpublished paper. Galbraith, John Kenneth (1973) “Power and the Useful Economist,” American Economic Review 63(1): 1-11. Grossman, Gene and Alan Krueger (1995) “Economic Growth and the Environment,” Quarterly Journal of Economics 110: 353-377. Hamilton, James T. (1993) “Politics and Social Costs: Estimating the Impact of Collective Action on Hazardous Waste Facilities,” Rand Journal of Economics 24(1): 101-125. Harbaugh, William, Arik Levinson, and David Wilson (2000) “Reexamining the Empirical Evidence for an Environmental Kuznets Curve,” Cambridge, MA: National Bureau of Economic Research, Working Paper 7711, May. Harrington, Winston and Virginia D. McConnell (1999) “Coase and Car Repair: Who Should Be Responsible for Emissions of Vehicles in Use?” Washington, D.C.: Resources for the Future, Discussion Paper 99-22, February. Hecht, Susanna B. (2002) “Sacred Groves and Sacrifice Zones: Ideologies of Conservation and Development,” paper presented the Inaugural Symposium of the Rock Ethics Institute, Pennsylvania State University, March. Heerink, Nico, Abay Mulatu and Erwin Bulte (2001) “Income Inequality and the Environment: Aggregation Bias in Environmental Kuznets Curves,” Ecological Economics 38(3): 359-367.
32
Kahn, Matthew E. (1998) “A Household Level Environmental Kuznets Curve,” Economics Letters 59: 269-273. Kaplan, G.A., E.R. Pamuk, J.W. Lynch, R.D. Cohen, and J.L. Balfour (1996) “Inequality in Income and Mortality in the United States: Analysis of Mortality and Potential Pathways,” British Medical Journal 312: 999-1003. Kay, Jane Holtz (1997) Asphalt Nation. Berkeley: University of California Press. Kennedy, B.P., I. Kawachi, and D. Prothrow-Smith (1996) “Income Distribution and Mortality: Cross-sectional Ecological Study of the Robin Hood Index in the United States,” British Medical Journal 312: 1004-1007. Khanna, Madhu, Wilma Rose H. Quimio, and Dora Bojilova (1998) “Toxic Release Information: A Policy Tool for Environmental Protection,” Journal of Environmental Economics and Management 36: 243-266. Konar, Shameek and Mark A. Cohen (1995) “Information as Regulation: The Effect of Community Right to Know Laws on Toxic Emissions,” Journal of Environmental Economics and Management 32: 109-124. Kuznets, Simon (1955) “Economic Growth and Income Inequality,” American Economic Review 49:1-28. Kuznets, Simon (1963) “Quantitative Aspects of the Economic Growth of Nations,” Economic Development and Cultural Change 11(2/II): 1-80. Lukes, Steven (1974) Power: A Radical View. London: Macmillan. Magnani, Elisabetta (2000) “The Environmental Kuznets Curve, Environmental Protection Policy and Income Distribution,” Ecological Economics 32(3): 431-443. Metcalf, Gilbert E. (1999) “A Distributional Analysis of an Environmental Tax Shift,” National Tax Journal 52(4): 655-681. Neumayer, Eric (2002) “Do Democracies Exhibit Stronger International Environmental Commitment? A Cross-Country Analysis,” Journal of Peace Research 39(2): 139-164. Oakes, John Michael (1997) The Location of Hazardous Waste Facilities. University of Massachusetts, Amherst, Department of Sociology, unpublished Ph.D. dissertation. Parikh, Jyoti, Kirk Smith and Vijay Laxmi (1999) “Indoor Air Pollution: A Reflection on Gender Bias,” Economic and Political Weekly, 27 February: 539-544.

33
Pastor, Manuel (2001) “Building Social Capital to Protect Natural Capital: The Quest for Environmental Justice,” Amherst, MA: Political Economy Research Institute, Working Paper No. DPE-01-02, January [http://www.umass.edu/peri/pdfs/WP11.pdf]. Pastor, Manuel, James Sadd, and Rachel Morello-Frosch (2000) “Who’s Minding the Kids? Pollution, Public Schools, and Environmental Justice in Los Angeles,” draft, July. Pastor, Manuel, Jim Sadd, and John Hipp (2001) “Which Came First? Toxic Facilities, Minority Move-in, and Environmental Justice,” Journal of Urban Affairs 23: 1-21. Pryde, P.R. (1991) Environmental Management in the Soviet Union. Cambridge: Cambridge University Press. Ravallion, Martin (1987) Markets and Famines. Oxford: Clarendon. Rein, Martin (1971) ‘Problems in the Definition and Measurement of Poverty,’ in Peter Townsend, ed., The Concept of Poverty. London: Heinemann, pp. 46-63. Rich, Richard C., W. David Conn, and William L. Owens (1993) “’Indirect Regulation’ of Environmental Hazards Through the Provision of Information to the Public: The Case of SARA, Title III,” Policy Studies Journal 21(1): 16-34. Scruggs, Lyle A. (1998) “Political and Economic Inequality and the Environment,” Ecological Economics 26: 259-275. Sen, Amartya (1981) Poverty and Famines: An Essay on Entitlement and Deprivation. Oxford: Clarendon Press. Sen, Amartya (1987) On Ethics & Economics. Oxford: Basil Blackwell. Sen, Amartya (1992) Inequality Reexamined. Cambridge, MA: Harvard University Press. Stern, David I. (1998) “Progress on the Environmental Kuznets Curve?” Environment and Development Economics 3: 173-196. Szasz, Andrew and Michael Meuser (1997) “Environmental Inequalities: Literature Review and Proposals for New Directions in Research and Theory,” Current Sociology 45(3): 99-120. Torras, Mariano and James K. Boyce (1998) “Income, Inequality, and Pollution: A Reassessment of the Environmental Kuznets Curve,” Ecological Economics 25: 147-160. United Church of Christ, Commission for Racial Justice (1987) Toxic Wastes and Race in the United States: A National Report on the Racial and Socio-economic Characteristics of Communities with Hazardous Waste Sites. New York: Public Data Access, Inc.
34
United States General Accounting Office (1983) Siting of Hazardous Waste Landfills and their Correlation with Racial and Economic Status of Surrounding Communities. Washington, D.C.: United States Congress. Wargo, John (1998) Our Children’s Toxic Legacy: How Science and Law Fail to Protect Us from Pesticides. New Haven: Yale University Press. World Bank (1992) World Development Report 1992. New York: Oxford University Press.
Related Documents