Environmental Taxes, Inequality and Technical Change Fabrizio Patriarca * and Francesco Vona † June 11, 2012 Abstract Abstract Environmental innovations heavily depend on government policies and consumers’ behaviour. This paper addresses the issue of how these two factors interact in shaping the transition to a green technology. We extend models of technological selection with heterogeneous agents and learning by including a weak hierarchy between green and polluting goods. For general distributions of agents’ income and the explicit inclusion of a car- bon tax, the model is not analytically tractable so we derive our results using numerical simulations. Given the level of income, carbon taxes are generally more effective when technological improvements brought about by wealthy pioneer consumers suffice in inducing the remaining population to buy the green good. A negative relationship between income inequality and tax effectiveness emerges. Taxes on polluting production have a re- gressive effect since they are mainly paid by poorer people who consume less of the green good. For these people, a negative wealth effect strongly contrasts the standard substitution effect of the tax. Finally, both lower- ing inequality and taxation have the expected effect for intermediate level of the learning parameter. 1 Introduction Concerns for quality of life, sustainability of growth and environmental issues occupy an increasingly important position in the set of citizens’ values, espe- cially in developed countries where basic needs have been met (Inglehart 1995). Technical change is at the centre of the political discourse being the unique way of reconciling current consumption patterns with both natural resources preser- vation and environmental quality. In the case of environmental technologies, * Sapienza University of Rome, [email protected]. † OFCE Sciences-Po, [email protected] 1

Welcome message from author
This document is posted to help you gain knowledge. Please leave a comment to let me know what you think about it! Share it to your friends and learn new things together.
Transcript
Environmental Taxes, Inequality and Technical
Change
Fabrizio Patriarca∗and Francesco Vona†
June 11, 2012
Abstract
Abstract
Environmental innovations heavily depend on government policies andconsumers’ behaviour. This paper addresses the issue of how these twofactors interact in shaping the transition to a green technology. We extendmodels of technological selection with heterogeneous agents and learningby including a weak hierarchy between green and polluting goods. Forgeneral distributions of agents’ income and the explicit inclusion of a car-bon tax, the model is not analytically tractable so we derive our resultsusing numerical simulations. Given the level of income, carbon taxes aregenerally more effective when technological improvements brought aboutby wealthy pioneer consumers suffice in inducing the remaining populationto buy the green good. A negative relationship between income inequalityand tax effectiveness emerges. Taxes on polluting production have a re-gressive effect since they are mainly paid by poorer people who consumeless of the green good. For these people, a negative wealth effect stronglycontrasts the standard substitution effect of the tax. Finally, both lower-ing inequality and taxation have the expected effect for intermediate levelof the learning parameter.
1 Introduction
Concerns for quality of life, sustainability of growth and environmental issuesoccupy an increasingly important position in the set of citizens’ values, espe-cially in developed countries where basic needs have been met (Inglehart 1995).Technical change is at the centre of the political discourse being the unique wayof reconciling current consumption patterns with both natural resources preser-vation and environmental quality. In the case of environmental technologies,∗Sapienza University of Rome, [email protected].†OFCE Sciences-Po, [email protected]
1

policy interventions and the spontaneous involvement of citizens-consumers areparticularly important as market prices do not reward for the lower environ-mental impact of green goods. Furthermore, two channels are recognized to bethe most important drivers of environmental innovations (Beise and Rennings2005): a direct market demand for green products and an indirect politicalpressure for the approval of ambitious environmental policies.
On the political side, consumers, local communities and environmental ac-tivists play a key role in signalling harmful effects of certain economic activities,in giving political voice to ethical issues (i.e. the rights of future generations)and in reinforcing the effectiveness of government interventions (Esty 1998).For instance, cooperatives and diffuse ownership characterize the industry ofwind turbines in Denmark (Johnson and Jacobsson 2003), while German en-vironmental activists played a key role in sustaining ambitious feed-in-tariffprograms (Lauber and Mez 2004). On the economic side, agents’ consumptionchoices and willingness-to-pay (WTP) higher prices for products with low envi-ronmental impacts allow creating niche markets for these products. Policies canbe targeted to promote the creation of niche markets through labelling, publicprocurement or regulation, e.g. car sharing requiring low-emission cars (Kempet al. 1998). Another example is the one of the private provision of a publicgood where certain consumers accept to contribute to the good independentlyon what the others do (Kotchen 2006). All these examples suggest that the ef-fectiveness of environmental policies depends on the distribution of preferencesfor environmental quality across heterogeneous agents.
This paper focuses on a particular aspect of the complex relationship be-tween agents’ heterogeneity in preferences, technology diffusion and environ-mental policy. In particular, we analyse how the effect of the policies on greentechnologies is mediated by the distribution of agents’ preferences and by thebudget constraints preventing these preferences to be realized, i.e. poverty andfinancial distress. With this aim in mind, we develop a simple model of tech-nological selection with heterogeneous agents and pioneer consumers generatingpositive spillovers on the remaining population. These ingredients are commonto a wealth of models, both analytical (Matsuyama 2002, Bertola et al. 2006)and computational (Frenken et al. 2006, Cantono and Silverberg 2010). We con-tribute to this literature in two ways. First, heterogeneous attitudes towardsgreen or non-green goods, embodying technologies with different environmentalimpacts1, depend in our model on microfounded agents’ behaviour. Followingour previous paper (Vona and Patriarca 2011, PV henceforth), we capture thefact that wealthier households care relatively more about environmental qual-ity by introducing a weak hierarchy between green and non-green goods. Thisallows us to analyse not only the decision of buying the green good or not, asin related studies (e.g. Cantono and Silverberg 2010), but also the intensity ofthat choice. As a result, consumers’ decisions depend on two income thresholds:a low threshold when a consumer starts buying the green good, a high thresh-
1We assume that each good is produced with only one technology. Green (resp. non-green)goods are produced using a technology with low-(resp. high-) environmental impact.
2

old when she shifts from a mix of goods to full green consumption. Second,we extend PV (2011) in two ways: 1. by examining technological selection forgeneral distributions of income, 2. looking at the effect of a tax on pollutinggoods in correspondence to different levels of income inequality.
These two extensions require a substantial departure from the methodologyused in our original paper as it is difficult to preserve analytical tractability withmany heterogeneous consumers not uniformily distributed and two thresholdsmoving endogeneously with technological learning. Besides, numerical simu-lations help in quantifying the effect of the tax in scenarios characterized bydifferent learning speeds and levels of income inequality. Results of simulationsnot only generalize our previous theoretical and empirical findings on the re-version of the effect of inequality on the diffusion of the green good, but alsocontribute to explain the heterogeneneity in the effect of environmental poli-cies on technological development (e.g. Vona et al. 2012). In particular, weshow that, given the initial level of income per capita, environmental taxes aregenerally more effective when positive spillovers from pioneer consumers caneffectively trigger a second wave of demand for the green good. Thus, nega-tive relationship between income inequality and tax effectiveness emerges. Inextreme cases, the regressive impact of polices like carbon taxes may have theparadoxical effect of reducing the number of consumers of green products. Ourfinal contribution is methodological as we develop a model that has an analyti-cally tractable core and an extension solved numerically. With respect to closelyrelated percolation models of technology adoption (e.g. Cantono and Silverberg2010) and to ABM in general, this extension seems particularly promising as itenables to anchor simluation results to analytical ones. An interesting exten-sion of our semi-analytical approach would be to explicitly consider both localas well as global interactions among heterogeneous agents.
The paper is organized as follows. Next section reviews the literature oninequality, environmental technologies and consumers’ behaviour. In section 3,we remind the model and extends it for general distribution of income, Section4 presents the main results, while section 5 concludes.
2 Related Literature
Understanding the determinants of environmentally friendly behaviour repre-sents the point of departure to entrech theoretical analyses on well-establishedstylized facts. Two strands of literature analyse the formation of green pref-erencences: at the micro level, the empirical evidence on the determinants ofthe WTP for green goods; at the macro level, the one on the determinants ofenvironmental regulation.
The macro strand of literature is quite scant given the lack of reliable time-varying data on environmental policies and regulation. Among the few excep-tions, Dasgupta et al. (2001) and Easty and Porter (2002) show that GDP percapita is positively correlated with two indendently built indicators of environ-mental policies, even when adding proxies of governement efficiency and the
3

costs of bureaucracy2. Interestingly, too, the index built by Easty and Portertends to be significantly higher in more equal Nordic and central European coun-tries. Recent work of Nicolli and Vona (2012) develops a time-varying aggegateindicators of renewable energy policy3 that is positively correlated with GDPper capita. Lowering inequality positively affects the policy support for renew-able energy especially in high income countries and using policy indicators builtwith factor analysis. Inequality has a strong negative impact on public expen-ditures in green R&D as found by Magnani (2000) and by PV (2011), where theeffect of inequality appears even stronger in the longer time span considered.Both in PV (2011) and in Nicolli and Vona (2012) a reversion in the relativeeffect of income levels and inequality emerge, that is: whereas for rich countriesinequality negatively affects public policies and demand for green technologies,per-capita income is paramount in poorer ones. This evidence confirms ourclaim that environmental quality is a good relatively higher in the hierarchicalranking.
At the micro level, several studies have shown that wealthier and more ed-ucated households are generally more willing to pay higher prices for greengoods (Roe et al. 2001, Wiser 2007, Diaz-Rainey and Ashton 20094), to parte-cipate voluntarily to the provision of green public goods (Rose et al. 2002, Wiser2007, Kotchen and Moore 2007, Kotchen 2010) or to effectively buy green goods(OECD 2008, Kahn 1998, Gilg at al. 2005). It is worth noticing that the overallimpact of richer households on the environmental quality can be either positiveor negative as long as richer households consume more. However, their impacton technology thorugh the demand of green goods is certainly positive. Alsomicro-evidence is consistent with our claim that environmental quality is a goodrelatively higher in the hierarchical ranking. In particular, sociologial studiesusing value and social surveys show that ”concern for quality-of-life issues, suchas free of speech, liberty and environmental protection... arise only after indi-viduals have met their more basic materialist needs for food, shelter, and safety”(Gelissen 2007, p. 393, see Diekmann and Franzen 1999, Franzen 2003).
On the theoretical side, the standard way to examine the relationship be-tween income inequality and environmental quality is to look at the politico-economy determinants of environmental regulation. Using a median voter ar-gument, Magnani (2000) claims that income inequality and expenditures forenvironmental R&D can be negatively correlated if richer households prefer
2The composite indicator used in Dasgupta et al. (2001) includes both environmental policyand environmental awareness and it is based on a survey conducted by the United Nation. Theindicator used in Easty and Porter (2002) attempts to measure environmental regulation anduses data sources from the ESI project and the Global Competitiveness Report. Data sources:http://www.yale.edu/esi/ and http://www.weforum.org/issues/global-competitiveness
3Data source: http://www.iea.org/textbase/pm/?mode=re4Peer effects in consumption are also found to be very relevant in the Contingent Evalu-
ation of the WTP for clean energy carried out by Wiser (2007). In particular, the expectedcontribution of the others is found to be significantly correlated with the individual willingnessto contribute. This result becomes relevant for the relationship between inequality and envi-ronmental quality if, as well known in the literature on peer effect in education, peer effectsenter nonlinearily in the utility function.
4

more environmental quality than poorer ones. Eriksson and Persson (2003) alsoderive a partial negative relationship inequality-pollution in a political-economymodel where heterogeneous agents decide the optimal level of pollution controlunder the assumption that wealthier individuals are less affected by pollution5.Kempf and Rossignol (2007) study a similar problem but allow for a dynamictrade-off between growth and environmental quality. Here, the median voterjointly decides the taxes devoted to finance two public goods: environment andinfrastructures, which are conductive to growth. In line with previous studies,if the weight assigned to the “environment” in the utility function is low enoughwith respect to the one assigned to “consumption”, a more unequal societywould privilege production rather than the environment. Among the channelsthat support a negative impact of inequality and social segregation on the envi-ronment, recent studies (Rothman 1998, Roca 2003) claim that rich people areoften able to divert the monetary benefits out-of-pollution from the cost of it.For instance, in a model of spatial sorting of agents by skills, Gawande et al.(2001) show that hazardous waste sites tend to be located in neighbourhoodswith a higher fraction of poorer workers willing to accept higher pollution inexchange of jobs in the polluting sector.
All these models examine settings where technology does not change andhence neglect the role of environmental innovations, especially of those inno-vations that imply a redesign of the whole production process rather than themere adoption of end-of-pipe solutions. Environmental innovations can be con-viniently distinguished between end-of-pipe and cleaner (or integrated) technolo-gies: “Cleaner production reduces resource use and/or pollution at the sourceby using cleaner products and production methods, whereas end-of-pipe tech-nologies curb pollution emissions by implementing add-on measures” (Frondelet al. 2004, pp.1). The former are the only true innovations, both from the per-spective of reducing net energy and material flows and from the one of economicagents, who have to change their behaviour to adopt these technologies6. Morein general, a transition from polluting to cleaner technology is best understoodas a complex phenomena involving changes in many institutional layers and thebuilding of new social constituencies (Kemp 1994). Particularly important isthe process through which new technologies acquire social legitimacy and be-come cost-effective. Overall, these socio-cultural features of new technologiesare particulalry important for green products that involve radical changes inhabits and convey an intrinsic ethical motivation.
Following this argument, it is convenient to think at the dynamic interactionbetween consumers’ behaviour and technological development as a prototypicalfeature of green technological transitions. Standard growth models are notwell-equiped to deal with the path dependency emerging from demand-supply
5As in Magnani (2000), the result hinges upon the fact that, given the average income, aricher median voter can afford both more pollution control and more consumption.
6Examples of significant behavioural changes are: production of energy from renewablesources involving greater decentralization and self-production; change in the ownership struc-ture to enlenght the durability of certain goods, e.g. cars; recycling and reusing activities;creation of consumers’ networks to ensure steady demand to local producers of biofood.
5

interactions. This weakness of standard models is even more relevant whenconsumers are heterogeneous and hence the dynamics of demand results fromthe aggregation of different evolving behaviour (e.g. Faber and Frenken 2009on this argument in relation to environmental issues).
With regards to the diffusion of green products, agent-based computationalmodels (ABM) have been applied to capture the intrinsic socio-cultural aspectsof green technologies by introducing a richer set of assumptions on consumers’behaviour. These models typically analyse diffusion patterns of green goodsin complex environment characterized by rich supply-side dynamics (Bleda andValente 2009, Windrum et al. 2009) and using calibrated data to build scenariosfor technological transitions (Schwarz and Ernst 2010). Within the broad classof simulation and ABM models, percolation models (Antonelli 1996, Silverbergand Verspagen 2005, Frenken et al. 2008) represent the most parsimoniousapproach to study technology selection with economies of scale and network ex-ternalities (e.g. Geroski 2000) when consumers are heteorgeneous. Cantono andSilverberg (2010) apply these models to the case of the diffusion of environmen-tally friendly goods and analyse the effectiveness of a green subsidy. Diffusion ofgreen consumption is constrained by both the heterogeneity in individual WTPsand the consumers’ network structure, which affects the spread of informationdiffusion across potential adopters. To capture learning, the price of the newgood decreases with the number of adopters. In this simple setting, the sub-sidy is effective only within an internal range of the learning parameter: whenlearning is too slow consumption does not take off, when it is too fast diffusiontakes place anyway.
The logic of our model is related to the one of Cantono and Silverberg(2010) as lead-users and consumers’ heterogeneity are also essential. Our paper,however, provides a different microfoundation for agent’s adoption decision thatdepends explicitly on the opportunity cost of giving up consumption of thepolluting good7, through income, and on the initial price gap between the twogoods. As will be clearer in the next section, our model also analyses therelationship between the shape of the distribution of WTP for environmentalquality and the final outcome.
3 The model
To analyze the choice between polluting and non-polluting goods, we adoptthe framework of PV (2011). The simplest setting to address this issue is toconsider two goods and two wants. Both goods satisfiy a basic need, like foodor shelter. The green good, indexed by 2, is more expensive but it also satisfies
7It is interesting to note that, in sociological surveys measuring the values for environmentalquality, result strongly depends on the way the demand is made. In terms of absolute prefer-ences developed and developing countries do not differ much. In turn, the higher propensity tospend in environmental quality of developed countries clearly emerges when the opportunitycost of environmental protection in terms, for instance, of foregone income is explicitly men-tioned in the survey questionnaire (Inglehart 1995, Diekmann and Franzen 2003). Therefore,this opportunity cost should be also considered in building theoretical models.
6

a non basic want like environment preservation. The green good enables agentsto enjoy the same direct utility of the old one plus an additional utility linked toan “eco-friendly” motif. This is a convenient way to model preferences for theenvironment as it encompasses both the case in which “eco-friendly” goods areof better quality, and the one where they are consumed for “altruistic” reasonsor moral obligations (see Eriksson 2004, Conrad 2005, Oecd 2008).
The weak hierarchy between the two wants, the second being not necessaryin an Inada sense, is essential to derive the particular shape of the Engel curvethat, in turn, is crucial to derive our main results. As discussed in previoussection, this assumption is also empirically founded.
More in details, we adopt the simplified framework of a utility function wcontinuous and additively separable in the two wants. In particular, w(.) isconcave in the basic want, i.e. u(.) is strictly concave, and linear in the secondone. Thus:
w(x1, x2) = u(x1 + x2) + x28; (1)
where xi is the quantity of the good i. Note that each unit of the second goodgives a greater utility than each unit of the first one, so the first good is consumedonly if the price of x2 is sufficiently higher than the price of x1. Now let m be thetotal income to be allocated between the two goods, δP the relative price gap,i.e. p2−p1
p1, that represents a proxy of technological expertise in the production
of the two goods. Under previous hypotheses on the utility function, the firstorder condition for the internal solutions of this simple constrained optimizationproblem gives9:
u′(x1 + x2) =1δP
; (2)
Considering the properties of u, and defining the function φ as the inverse of u′,this condition has the following solution:
x1 + x2 = φ
(1δP
)= x .; (3)
Eq. 3 implies that a mixed bundle is chosen only within an income thresholdsm ∈ (m−,m+). If income is not enough to buy the quantity x of the cheapestgood (m < m− = p1x) the green good is not consumed. When agents are richenough to buy at least a quantity x of the more expensive good (m > m+), theywill consume only that good satisfying also the other want.
Figure 1 shows the Engel’s curve derived by this analysis. The particularS-shape of the Engel’s curve of x2 is the main driver of all further developments.To give a preliminary intuition, it is worth to recall an important property of this
8Further details are discussed in the original paper where we also show that the linearityof the utility function in the second want is not necessary to derive our results. Note that themore general form wi(x1, x2) = u(x1 + x2) + νix2 would allow to capture heterogeneity inindividual preferences for the environment.
9The first order condition in eq.2 states that x corresponds to the level of consumption atwhich the ratio between the marginal utilities of the basic want (u′(x1 +x2)) and of the otherwant (1) equals the marginal cost of substitution between the two goods
7

!" !#
!$%& !$
%'
(&
('
!
(
()
Figure 1: Engel’s curves for the two goods
curve (see the original paper for details). It is steeper in the region (m−,m+)than above m+. Between m− and m+, the gradual substitution of the old goodwith the new one reinforces the positive effect on the consumption of x2 dueto the income expansion itself, while in the third region substitution no longeroccurs.
For what follows, it is useful to recall that the income thresholds (m−,m+)have a “dual” counterpart in the price domain. Looking at the “price gap”thresholds is important to analyse technological change in so far as, under stan-dard competitive conditions in all markets, prices reflect costs and the inverse ofthe price gap reflects technological levels. Specifically, the two price gap thresh-olds that correspond to a shift in consumers’ behaviour depend on m. Thericher the consumer, the lower the two price gap thresholds required to startconsuming the green good. Put it differently, rich consumers buy the green goodeven if the way of producing it is relatively inefficient.
3.1 The effect of a tax on the first good
In this section, we derive basic analytical results on the effect of a tax thatincreases the price of good 1, a carbon tax. The non linearities in the income-demand curves derived in previous section imply that higher income peopleconsume lower shares of the taxed good. Thus, the tax has a regressive impact.For consumers with incomes above m+, the tax has clearly no effects since theydo not consume the taxed good. Conversely, for consumers with incomes belowm+, the tax will have, as usual, the two contrasting substitution and incomeeffects. The strenght of each of these effects varies according to agents share ofconsumption, hence according to their income. To analyze the combined impactof these two effects, let us consider the effect of the tax on the two thresholds.A higher p1 entails a lower δP : looking at eq. 2, since the marginal utility isa decreasing function, it is straightforward to show that this implies a lowerx. That is, a tax on the old good always decreases the quantity threshold ofconsumption at which agents start consuming the new good. In formulas we
8
have10:∂x
∂p1=
1u′′
p2
(p2 − p1)2< 0. (4)
However, the effect on the income thresholds is not so trivial. Indeed, wehave:
∂m+
∂p1= p2
∂x
∂p1< 0. (5)
∂m−
∂p1= p1
∂x
∂p1+ x>
<0. (6)
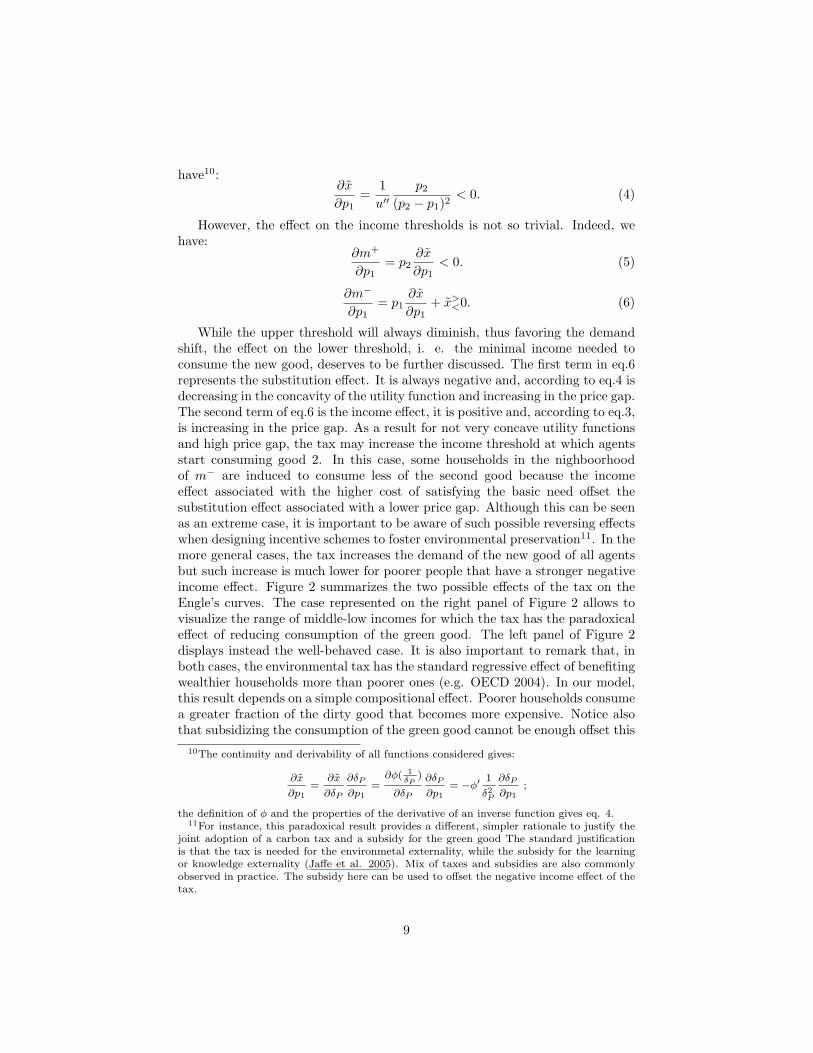
While the upper threshold will always diminish, thus favoring the demandshift, the effect on the lower threshold, i. e. the minimal income needed toconsume the new good, deserves to be further discussed. The first term in eq.6represents the substitution effect. It is always negative and, according to eq.4 isdecreasing in the concavity of the utility function and increasing in the price gap.The second term of eq.6 is the income effect, it is positive and, according to eq.3,is increasing in the price gap. As a result for not very concave utility functionsand high price gap, the tax may increase the income threshold at which agentsstart consuming good 2. In this case, some households in the nighboorhoodof m− are induced to consume less of the second good because the incomeeffect associated with the higher cost of satisfying the basic need offset thesubstitution effect associated with a lower price gap. Although this can be seenas an extreme case, it is important to be aware of such possible reversing effectswhen designing incentive schemes to foster environmental preservation11. In themore general cases, the tax increases the demand of the new good of all agentsbut such increase is much lower for poorer people that have a stronger negativeincome effect. Figure 2 summarizes the two possible effects of the tax on theEngle’s curves. The case represented on the right panel of Figure 2 allows tovisualize the range of middle-low incomes for which the tax has the paradoxicaleffect of reducing consumption of the green good. The left panel of Figure 2displays instead the well-behaved case. It is also important to remark that, inboth cases, the environmental tax has the standard regressive effect of benefitingwealthier households more than poorer ones (e.g. OECD 2004). In our model,this result depends on a simple compositional effect. Poorer households consumea greater fraction of the dirty good that becomes more expensive. Notice alsothat subsidizing the consumption of the green good cannot be enough offset this
10The continuity and derivability of all functions considered gives:
∂x
∂p1=
∂x
∂δP
∂δP
∂p1=∂φ( 1
δP)
∂δP
∂δP
∂p1= −φ′
1
δ2P
∂δP
∂p1;
the definition of φ and the properties of the derivative of an inverse function gives eq. 4.11For instance, this paradoxical result provides a different, simpler rationale to justify the
joint adoption of a carbon tax and a subsidy for the green good The standard justificationis that the tax is needed for the environmetal externality, while the subsidy for the learningor knowledge externality (Jaffe et al. 2005). Mix of taxes and subsidies are also commonlyobserved in practice. The subsidy here can be used to offset the negative income effect of thetax.
9

!
"
!
"
Figure 2: The effect of a tax on the Engle’s curve.
regressive effect as long as poorer households keep buying a greater fraction ofthe dirty good. Income transfers are hence required to offset the redistributiveeffects of environmental policies.
Grounding on these analytical results, next section address the issue of theeffectiveness of environmental taxes on the diffusion of the green good in acontext of heterogeneous agents, drawn from a left-skewed distribution of in-come. Before this, next sub-section briefly summarizes the relationship betweenaggregate demand of x2 and the shape of the income distribution.
3.2 Income Distribution and Aggregate Demand
In an economy where agents are heterogeneous in their incomes, the non-linearities in the Engel’s curves imply that the diffusion of good 2 jointly dependson the average income and on the level of income inequality. With the purposeof giving preliminary insights on this process, let us consider numerical examplesdrawn from a log-normal distribution of income with a concave shaped utilityfor the basic want12. This is also the distribution of consumers’ characteristicschosen by Cantono and Silverberg (2010), which, however, do not analyse therole played by the first and second moment of the distribution13.
In Figure 3, we plot the aggregate demand X2 as a function of the variancein income distribution for different mean income levels (m1 < m2 < m3). If themean income is relatively high, an unequal distribution implies an increase in thenumber of agents with income under the threshold m−. For the characteristicsof the Engel curve for x2, steeper in (m−,m+), a redistribution would have inthis case a positive impact on the diffusion of the green good. Conversely, inrelatively poorer economies, more income dispersion enables fewer rich peopleto consume the green good, which can at most emerge as niche consumption.
This reversal effect of inequality on the diffusion of x2 is a consequence ofthe S-shaped feature of the Engel curve of the new good. In turn, the S-shaped
12In particular, we take: u(x) = ln(x) and δP = 2.13Also the functional distribution of income matters on the diffusion pattern of a new good
(see Patriarca and Vona 2009).
10

!"#$%"&
'(#%)(*&
+
+,-
&
&,-
.
.,-
/0
/.
/&
1
2
Figure 3: Variance of the income distribution and diffusion of the green goodfor different levels of the mean income
relationship depends both on the assumption of weak hierarchy between the twogoods and on the fact that very poor consumers do not buy the green good.It is interesting to note that the S-shaped feature of our Engel curve does notallow to sketch a uniform relationship between inequality and the diffusion of x2
as it would be for concave- or convex-shaped curves considered in the previousliterature on the “aggregation argument” (e.g. Heerink et al. 2001). For astandard ”aggregation argument”, if the rich buy relatively more of the greengood, higher inequality would generate more consumption of green goods. Inour model, instead, middle income households are the only ones for which anincome expansion translates in a more than proportional increase of x2. Hence,there is a reversal in the effect of inequality on the diffusion of the green goodfor sufficiently high levels of average income, i.e. a potentially larger middleclass.
4 The effect of a tax on the diffusion of greentechnologies
4.1 The dynamic setting
To analyse the effectiveness of the carbon tax, we consider an environmentwhere technology improves endogeneously. As well-documented in the literatureon demand-driven innovation (e.g. von Hippel 1988), pioneer consumers arewilling to buy initially more expensive innovative products. Their consumptionis a source of positive externalities as long as it triggers price reductions thatmay enable low-budget consumers to adopt these products (pioneer consumereffect). However, an “excessive income distance” between pioneer consumersand the remaining population prevents the process of diffusion to fully trickle
11

down (consumption polarization effect). The overall effect of the heterogeneityin consumers’ characteristics, notably the variance, on the diffusion patterndepends on which of the two effects prevails.
The simplest way of including technological spillovers from pioneer con-sumers consists in introducing a positive relationship between the growth ofdemand for X2 and technological change, i.e. a global externality. This as-sumption is a quite standard way to capture pioneer consumers’ spillovers (e.g.Matsuyama 2002, Cantono and Silverberg 2010). Let us denote with γi thetechnological level in sector i, which is equal to the inverse of pi, i.e. pi = 1/γi.We chose a particular linear form for the learning function:
γ2,t = γ2,t−1 + c(X2,t−1 −X2,t−2), (7)
where c measures the effectiveness of technological change. We now analyzethe process of diffusion of good 2 considering the initial condition in which thegreen good appears at time 1, with a technological level γ2,0 low enough as toinduce a niche demand for this good by few pioneer consumers. Clearly, we alsoassume a positive technological gap at time 0, i.e. γ1,0 − γ2,0 > 0, being thegreen technology initially less developed.
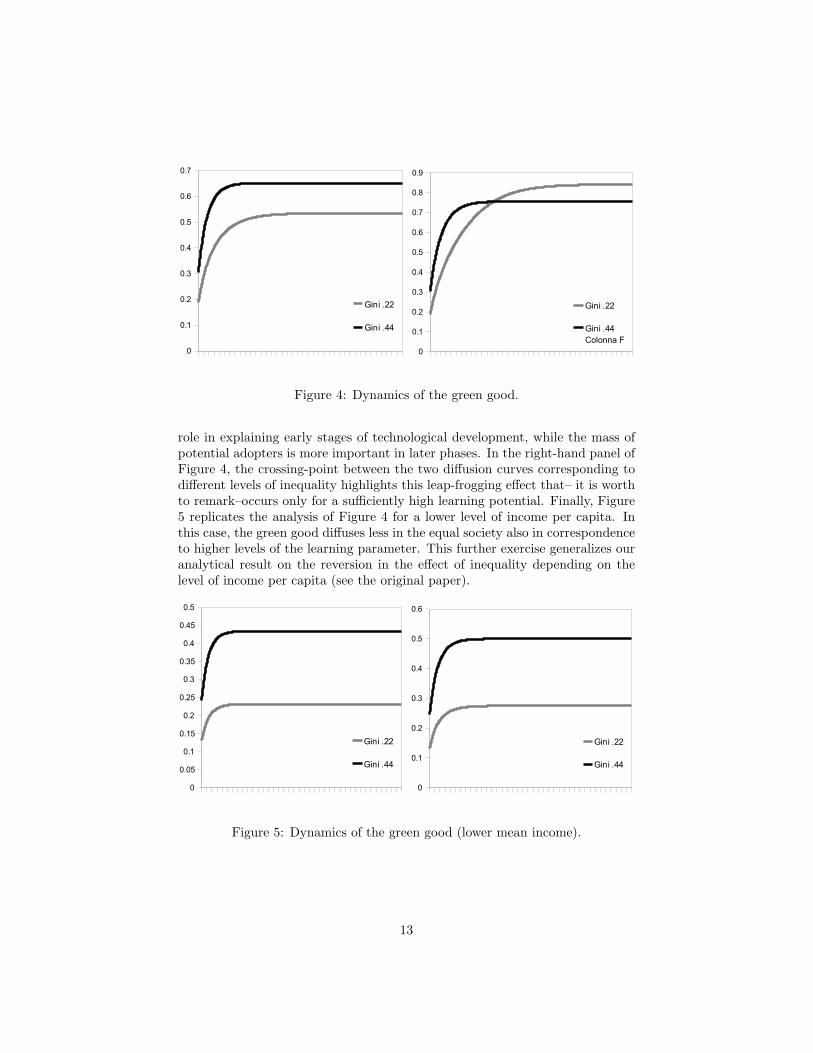
Once the niche level of demand emerges, the process of technological progressinvolves a self-reinforcing process of decrease in p2 and thus increase in thedemand of this new good. For a given mean income, the dynamics of demanddepends on the technological paramter c and on the mass of consumers that, incorrespondence to each technological improvement, increases their consumptionof x2 that is a function of the income distribution. We consider a realistic andgeneral distribution of incomes: populations of 1000 agents are extracted fromlognormal distributions. The higher complexity of this model with respect tothe original paper requires the use of simulation methods.
We compare the diffusion patterns for the new good of two random sampleswith the same mean (set at a level that allows for a niche consumption ofthe green good at time 0) but with different variances associated with a Ginicoefficient of respectively 0.22 and 0.44, which are the lower and upper bound ofGini coefficients in OECD countries14. The results of this preliminary exerciseare shown in Figure 4: the left panel considers a lower level of the learningparameter while the right one a middle level15. In the left panel, when technicalchange is too slow, the pioneer consumer effect prevails so the unequal societyguarantees greater diffusion of the green good. In the right panel, the levelof c potentially allows a full diffusion of the new good and the equal societyoutperforms the unequal one. In both cases, technological progress is initiallyfaster in less equal countries because of the stronger PC effect. When technologybecomes more mature, the more equal population recovers and overcomes theless equal one given the larger number of potential followers, i.e. the middleclass is larger. This result, jointly with the empirical evidence presented inthe original paper, seems to confirm that pioneer consumers play an important
14See Oecd on-line statistics: http://stats.oecd.org15Respectively, c = 0.16 and c = 0.2.
12
!"#$%"&
'(#%)(*&
+
+,&
+,-
+,.
+,/
+,0
+,1
+,2
3%)%*,--
*
3%)%*,//
*
!"#$%"&
'(#%)(*&
+
+,&
+,-
+,.
+,/
+,0
+,1
+,2
+,3
+,4
5%)%*,--
*
5%)%*,//
6"$"))(*!
Figure 4: Dynamics of the green good.
role in explaining early stages of technological development, while the mass ofpotential adopters is more important in later phases. In the right-hand panel ofFigure 4, the crossing-point between the two diffusion curves corresponding todifferent levels of inequality highlights this leap-frogging effect that– it is worthto remark–occurs only for a sufficiently high learning potential. Finally, Figure5 replicates the analysis of Figure 4 for a lower level of income per capita. Inthis case, the green good diffuses less in the equal society also in correspondenceto higher levels of the learning parameter. This further exercise generalizes ouranalytical result on the reversion in the effect of inequality depending on thelevel of income per capita (see the original paper).!"#$%"&
'(#%)(*&
+
+,+-
+,&
+,&-
+,.
+,.-
+,/
+,/-
+,0
+,0-
+,-
1%)%*,..
*
1%)%*,00
*
!"#$%"&
'(#%)(*&
+
+,&
+,-
+,.
+,/
+,0
+,1
2%)%*,--
*
2%)%*,//
*
Figure 5: Dynamics of the green good (lower mean income).
13

4.2 The effect of a carbon tax
To examine the effect of a carbon tax, we use a slightly different approach andextract randomly 100 couples of populations of 1000 consumers. Each coupleof populations is a random sample of two lognormal distributions having thesame mean but two different variances that correspond to the lower and upperbounds of the Gini coefficient in OECD countries, respectively .22 and .44. Forevery couple we analyze the effect of a 5% tax on the diffusion of the new good.We run the model for four cases: with or without the tax for each of the twopopulation. As we already noticed, the dynamics of the system depend on theincome distances between agents. In each sample these distances vary althoughthey are all randomly extracted from the same stochastic process. The 100replications allow to make the results independent from the income distances ofthe specific sample. First, we consider a benchmark case setting the parameterc at an intermediate level (the same as in the left panel of Figure 4), then wewill move to the more general case varying c in its relevant range16.
!"#$%"&
'(#%)(*&
!%)($*$+,+$*
-%./"0.*.(1 -%./*.(1 2+$(.%,+*%)34+(5+'"60$(.%")*& 7+() 899:8 ;;<:9 &=:=>?@A%)%*B*C:DDE 5.F:F+,: G&:;H G&:>H G&:I?H
'"60$(.%")*D 7+() =IC:9 8<;:& &C:<&?
@A%)%*B*C:99E 5.F:F+,: G&:8H G&:>H G&:8?H
Figure 6: The effect of a tax on the diffusion of the green good
The first two columns in Fig.6 represent the average final demand level of ofthe new good in the four cases. The third column shows the average relativeincrease of the final demand level involved by taxation. The result states thehigher effectiveness of the tax for the more equal population. In particular,the average improvement is 17.75% for the equal population with respect to anaverage of improvement of 10.31% for the unequal one. The difference in theeffect of the tax is highly statistically significant since standard deviations arevery low. Comparing column 1 and 2, it is evident that the tax amplifies thepositive effect of lowering inequality on the diffusion of the green good.
The final robusteness excercise consists in exploring the effect of the taxfor different learning parameters. For the seek of simplicity we first fix onecouple of populations (with Gini equal to .22 and .44 respectively) and plot thedynamics of the demand of the new good for different levels of the parameterc (c1 < c2 < c3 < c4
17). This simple graphical analysis of specific cases allowsto draw some insights of the joint role of the parameters. Results are shown inFigure 7, where the third panel is the benchmark in figure 4.
The positive effect of lowering inequality is confirmed except for high level16The parameters for the benchmark case are: c = 0.2, p1 = 1, the initial level of the price
gap is δP = 2 and the mean income is µ = 2.17We set: c1 = 0.16; c2 = 0.18, c3 = 0.20 and c4 = 0.28
14

!"#$%"&
'(#%)(*&
+
+,&
+,-
+,.
+,/
+,0
+,1
+,2
3%)%*,--
3%)%*,--*4(5
3%)%*,//
3%)%*,//*4(5
!"#$%"&
'(#%)(*&
+
+,&
+,-
+,.
+,/
+,0
+,1
+,2
+,3
4%)%*,--
4%)%*,--*5(6
4%)%*,//
4%)%*,//*5(6!"#$%"&
'(#%)(*&
+
+,-
+,.
+,/
+,0
&
&,-
1%)%*,--
1%)%*,--*2(3
1%)%*,..
1%)%*,..*2(3
!"#$%"&
'(#%)(*&
+
+,-
+,.
+,/
+,0
&
&,-
&,.
&,/
1%)%*,--
1%)%*,--*2(3
1%)%*,..
1%)%*,..*2(3
Figure 7: The effect of a tax for different learning parameter
15

of the learning parameter (Panel south-east of figure 7). Similarly to Cantonoand Silverberg (2010), a very effective technological learning renders uselessboth the carbon tax and an income redistribution. Panel north-west in thesame figure confirms that the unequal society outperforms the equal one forlow levels of the learning paramter. However, the tax is more effective in theequal society also in this scenario. Panels north-east and sourth-west stress thecontinuity of our main argument: the tax can be very effective when a lowerinequality favours the formation of a second wave of demand for the green good,while it is relatively ineffective when inequality is too high. Interestingly, too,the tax allows the more equal system to outperform the less equal one alsofor relatively low learning parameters (see north-east panel in Figure 7). Thisimportant result reinforces our result that environmental policy turns out beingsignificantly more effective in more equal societies.To conclude with a robustness analysis we take the previous 100 couples ofrandom populations and run the dynamics of the system for 20 consecutivevalues of c in its relevant range (0, .3). As in the table in figure 6, for eachvalue of c we obtain the average relative increase in the final level of the X2 dueto the tax for the two inequality cases. Figure 8 shows the result.
!"#$%"&
'(#%)(*&
+%)%*,-- +%)%*,../,&0 /,/1
/,&0 /,/1/,&. /,/1
/,&2 /,/3/,&1 /,/3
/,& /,&3 /,/3
/,&4 /,/4/,- /,/4/,-0 /,/5
/,-3 /,/5/,02 /,&/,.2 /,&
/,- /,0. /,&/,& /,&/,/. /,/5
/,/& /,/1/ /,/0
/ /,/-/ /,/&
/,0 / /
/,& /,- /,0
/
/,/2
/,&
/,&2
/,-
/,-2
/,0
/,02
/,.
/,.2
/,2
+%)%*,--
+%)%*,..
Figure 8: Tax effectiveness and learning parameters
Previous conclusions are strongly confirmed: tax effectivness is almost every-where higher for the equal case; the relation is reverted only for higher valuesof c, that is, when the effectiveness of the tax tends to zero as technologicalchange allows by itself for a wide diffusion of the new good. Furthermore, thetax exhibits a stronger impact for intermediate values of the learning parameter,especially in the equal case.
16

5 Conclusion
This paper generalizes to the case of realistic distributions of heterogeneousagents our previous theoretical and empirical findings on the reversion of theeffect of inequality on the diffusion of green goods. In correspondence to lowlevel of income per capita, high inequality maximizes the positive effect of earlyadopter and positively affects diffusion. In turn, the reverse occurs for high levelof income per capita as pioneer consumers can effectively trigger middle classconsumption, provided the income distance is sufficiently low.
The second and main result of the paper is to provide a rationale to accountfor the heterogeneity in the effect of environmental policies on green technology(e.g. Vona et al. 2012). First, notice that the policy is regressive as it increasesthe income required to buy the essential good and hence reduces residual incomethat poor households can devote to the green good. For middle- and low-incomehouseholds in the neighborhood of m−, the tax can bring a negative wealtheffect that may overcome the standard substitution effect and, under certainconditions, leads to the paradoxical result of a reduction in the overall diffusionof the green good.
In the dynamic setting, environmental taxes are generally more effectivewhen, given the level of income, technological externalities from pioneer con-sumers suffice in inducing less wealthier households to buy the green good, andthus when inequality is lower. The tax can benefit also the middle and lowclasses only if this negative income effect in the short-term is more than offsetby an effective increase in the consumption of the green good in the long-term.Another interesting result, similar to the one of Cantono and Silverberg (2010),is that the tax appears significantly more effective when learning is neither tooslow or too fast. With too slow learning, green consumption remains anywayin a niche; with too fast learning, the transition does not depend on the levelof inequality. Instead, relatively unequal societies with a larger pioneer con-sumer effect transit fastly to the new steady state characterized by fully greenconsumption.
Finally, as methodological contribution, our analytically tractable model canrepresent a useful benchmark for numerical simulations and extensions account-ing also for local interactions. Two extentions appear particularly promising.First, in the spirit of ABM, we can explicitly set local consumers’ network toexamine how the distribution of income across space shapes consumers’ habitsand technological development. Second, we can model the green good as animpure public good to investigate how agents’ implicit cooperation in the provi-sion of that good is affected by different level of income inequality and differentexpected gains from new technology.
References
[1] Antonelli, C., (1996). Localized knowledge, percolation processes and in-formation networks. Journal of Evolutionary Economics 6, 281-295.
17
[2] Beise M., Rennings K., (2005). Lead markets and regulation: a frameworkfor analyzing the international diffusion of environmental innovations. Eco-logical Economics 52, 5-17.
[3] Bertola, G., Foellmi, R., Zweimuller J., (2006). Income Distribution inMacroeconomic Models. Princeton University Press, Princeton and Oxford.
[4] Bleda, M., Valente, M., (2009). Graded eco-labels: a demand-oriented ap-proach to reduce pollution. Technological Forecasting and Social Change76, 512-524.
[5] Cantono, S., Silverberg, G., (2009) A percolation model of eco-innovationdiffusion: the relationship between diffusion, learning economies and sub-sidies. Technological Forecasting and Social Change 76, 487-496.
[6] Conrad, K., (2005). Price Competition and Product Differentiation WhenConsumers Care for the Environment. Environmental and Resource Eco-nomics 31, 1-19.
[7] Dasgupta, S., Mody, A., Roy, S., Wheeler, D., (2001). Environmental reg-ulation and development: a cross country empirical analysis. Oxford De-velopment Studies 29, 173-87.
[8] Diaz-Rainey, I., Ashton, J., (2009). Characteristics of UK consumers’ will-ingness to pay for green energy. Norwich Business School, University ofEast Anglia, mimeo.
[9] Diekmann, A., Franzen, A., (1999). The wealth of nations and environmen-tal concern. Environment and Behavior 31, 540-549.
[10] Easty, D., Porter, M., (2001). Ranking National Environmental Regulationand Performance: A Leading Indicator of Future Competitiveness?. In:The Global Competitiveness Report 2001 Porter, M., Sachs, J., (eds.),New York, Oxford University Press.
[11] Easty, D., (1998). NGOs at the World Trade Organization: Cooperation,Competition, or Exclusion. Journal of International Economic Law 1, 123–147.
[12] Eriksson, C., (2004). Can green consumerism replace environmental regu-lation? a differentiated-products example. Resource and Energy economics26, 281-293.
[13] Faber, A., Frenken, K., (2009). Models in evolutionary economics and envi-ronmental policy. Towards an evolutionary environmental economics. Tech-nological Forecasting and Social Change 76, 462-470.
[14] Frenken, K., Silverberg, G., Valente, M., 2008. A percolation model of theproduct lifecycle. UNU-MERIT Working Paper Series 073, United NationsUniversity, Maastricht.
18

[15] Frondel, M., Horbach, J., Rennings, K., (2004). End-of-Pipe or CleanerProduction? An Empirical Comparison of Environmental Innovation De-cisions Across OECD Countries. ZEW discussion paper 04-82.
[16] Gawande, K., Berrens, R., Bohara, A.K., (2001). A consumption-basedtheory of the environmental Kuznets curve. Ecological Economics 37, 101–112.
[17] Gelissen, J., (2007). Explaining popular support for environmental protec-tion. Environment and Behavior 39, 392-415.
[18] Geroski, P. , 2000. Models of technology diffusion. Research Policy 29, 603-625.
[19] Gilg, A., Barr, S., Ford, N., (2005). Green Consumption or SustainableLyfestiles? Identifying the Sustainable Consumer. Futures 37, 481-504.
[20] Heerink, N., Mulatu, A., Bulte, E., (2001). Income Inequality and the En-vironment: Aggregation Bias in Environmental Kuznets Curves. EcologicalEconomics 38, 359-367.
[21] Inglehart, R., (1995). Public support for environmental protection: Objec-tive problems and subjective values in 43 societies. PS: Political Scienceand Politics 15, 57-72.
[22] Jaffe, A., Newell, R., Stavins, R., (2005). A tale of two market failures:Technology and environmental policy. Ecological Economics 54, 164-174.
[23] Johnson, A., Jacobsson, S., (2003). The Emergence of a Growth Industry:A Comparative Analysis of the German, Dutch and Swedish Wind TurbineIndustries. in: Metcalfe, S., Cantner, U., (Eds): Change, Transformationand Development. Physica/Springer, Heidelberg, 197-228.
[24] Kahn, M., (1998). A Household Level Environmental Kuznets Curve. Eco-nomics Letters 59, 269-273.
[25] Kemp, R. , (1994). Technology and the transition to environmental sustain-ability: The problem of technological regime shifts. Futures 26, 1023-1046.
[26] Kemp, R., Schot, J., Hoogma, R., (1998). Regime shifts to sustainabil-ity through processes of niche formation: the approach of strategic nichemanagement. Technology Analysis and Strategic Management 10, 175–195.
[27] Kempf, H., Rossignol, S., (2007). Is Inequality Harmful For The Environ-ment In A Growing Economy?. Economics and Politics 19, 53-71.
[28] Kotchen, M., (2006). Green Markets and Private Provision of Public Goods.Journal of Political Economy 114, 816-845.
19

[29] Kotchen, M., (2010). Climate Policy and Voluntary Initiatives: An Eval-uation of the Connecticut Clean Energy Communities Program. NBERWorking Papers 16117.
[30] Kotchen, M., Moore, M., (2007). Private provision of environmental publicgoods: Household participation in green-electricity programs. Journal ofEnvironmental Economics and Management 53, 1-16.
[31] Lauber, V., Mez, L., (2004). Three Decades of Renewable Electricity Poli-cies in Germany. Energy & Environment 15, 599- 623.
[32] Magnani, E., (2000). The Environmental Kuznets Curve, EnvironmentalProtection Policy and Income Distribution. Ecological Economics 32, 431-443.
[33] Matsuyama, K., (2002). The Rise of Mass Consumption Societies. Journalof Political Economy 110, 1035-70.
[34] Nicolli, F., Vona, F., (2012). The evolution of renewable energy policyin Oecd countries: aggregate indicators and determinants. Documents deTravail de l’OFCE 2012-13.
[35] OECD (1994), The Distributive Effects of Economic Instruments for Envi-ronmental Policy. Paris, OECD.
[36] Oecd (2008). Household Behaviour and the Environment: Reviewing theEvidence, Paris.
[37] Patriarca, F., Vona, F., (2009). Structural Change and the Income Distribu-tion: a post-Keynesian disequilibrium model. working paper 5 departmentof Economics, University La Sapienza.
[38] Pfaff, A., Chauduri, S., Nye, H., (2004). Endowments, preferences, tech-nologies and abatement: growth-environment microfoundations. Interna-tional Journal of Global Environmental Issues 4, 209 - 228.
[39] Roca, J., 2003. Do individual preferences explain the EnvironmentalKuznets Curve? Ecological Economics, 45: 3-10.
[40] Roe, B., Teisl, M.F., Levy, A., and Russell, M., (2001). US consumers’willingness to pay for green electricity. Energy Policy 29, 917-925.
[41] Rothman, D., (1998). Environmental Kuznets curves real progress or pass-ing the buck?: a case for consumption-based approaches. Ecological Eco-nomics 25, 177–194.
[42] Schwarz, N., Ernst, A., (2009). Agent-based modeling of the diffusion of en-vironmental innovations: An empirical approach. Technological Forecastingand Social Change 76, 497- 511
20
[43] Silverberg, G., Verspagen, B., (2005) A percolation model of innovation incomplex technology spaces. Journal of Economic Dynamics and Control 29,225-244.
[44] von Hippel, E., (1988). The Sources of Innovation. New York: OxfordUniversity Press.
[45] Vona, F., Patriarca, F., (2011). ‘Income Inequality and the Developmentof Environmental Technologies’. Ecological Economics 70, 2201-13.
[46] Vona, F., Nicolli, F., Nesta, L., (2012). Determinants of Renewable EnergyInnovation: environmental policies vs. market regulation. Documents deTravail de l’OFCE 2012-05.
[47] Windrum, P.,Ciarli, T., Birchenhall, C., (2009). Consumer heterogeneityand the development of environmentally friendly technologies. Technologi-cal Forecasting and Social Change 76, 533-551.
[48] Wiser, R., (2007). Using contingent valuation to explore willingness to payfor renewable energy: A comparison of collective and Voluntary PaymentVehicles. Ecological Economics 62, 419–432.
21
Related Documents