INDONESIA 24 th June 2013

Welcome message from author
This document is posted to help you gain knowledge. Please leave a comment to let me know what you think about it! Share it to your friends and learn new things together.
Transcript
INDONESIA
24th June 2013

Country
Indonesia, officially the Republic of Indonesia, is a country in Southeast Asia and Oceania. Indonesia is an archipelago comprising approximately 17,508 islands.
Official name Republic of Indonesia
Country code ID
Government type
Presidential Constitutional Republic
National day 17 August
Area 1,919,440 km²
Population: 247 Million (2012)
Neighboring states
Malaysia, Papua New Guinea, East Timor, Singapore, Philippines, and Australia.
Language Indonesian
ReligionsMuslim (88%), Protestant (5%), Catholic (3%), and Hindu (2%)
Currency Rupiah (IDR)
Tax ratesIncome Tax (30 %), Corporate Tax (25 %), VAT rate (10 %)
Indonesia
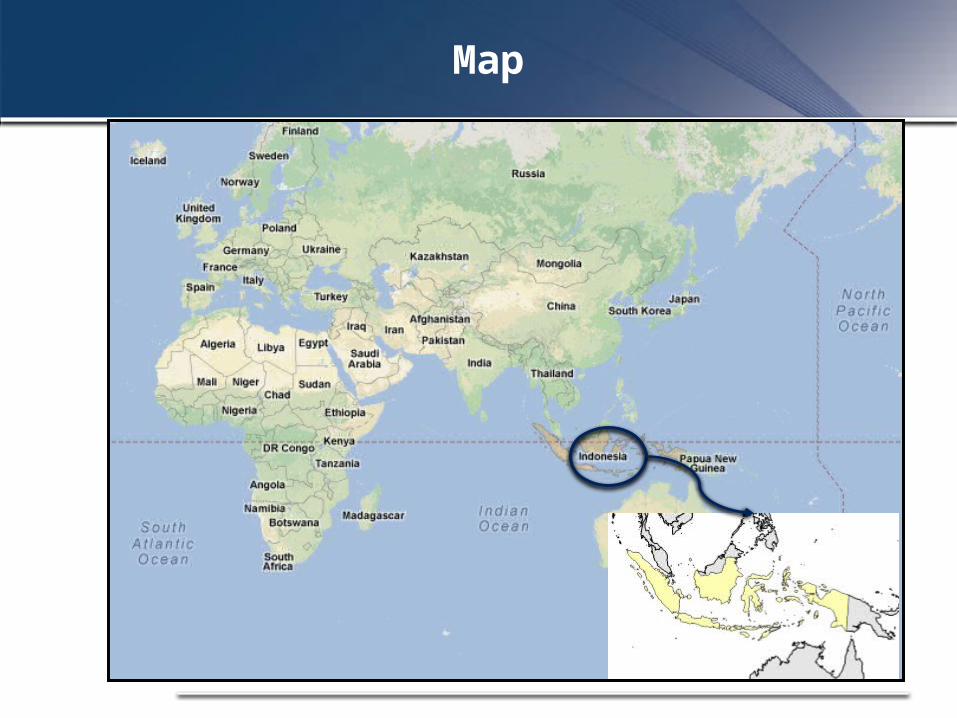
Map

Indonesia - News
• Indonesian Economic Outlook Deteriorates
• Indonesia Benchmark Interest Rate Unchanged at 5.75%
• Indonesian Economy Seems To Be Loosing Momentum
• Indonesia´s GDP Expands 6.02% in Q1 2013
• Indonesia Monetary Policy Unchanged in April

5
Main Natural Resources
Oil and gas, bauxite, silver, tin, copper, gold, and coal
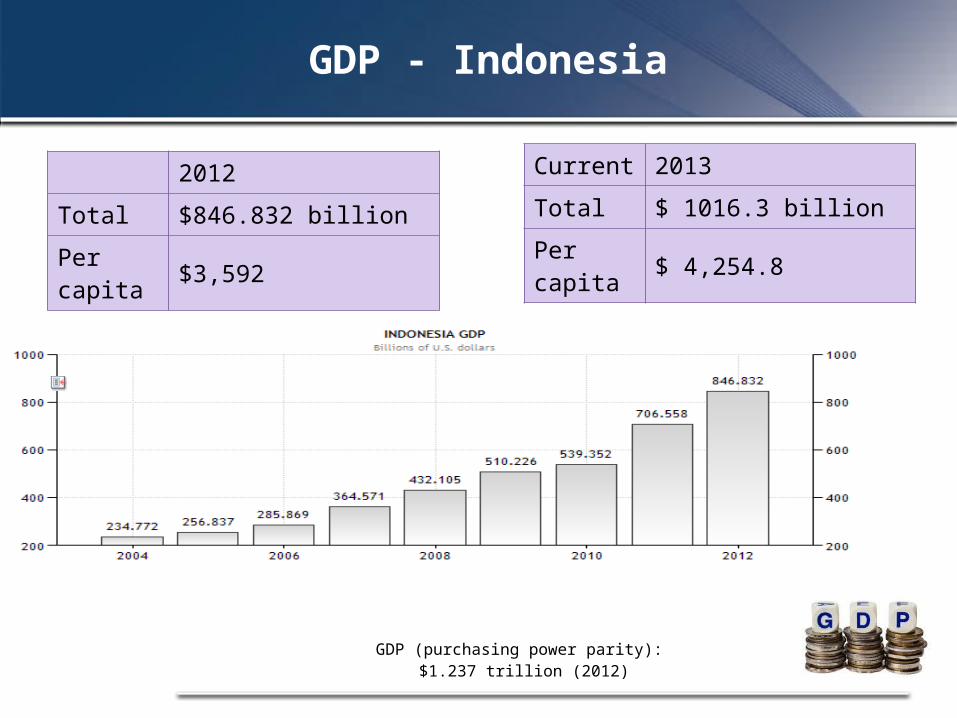
2012 Total $846.832 billionPer capita $3,592
Current 2013Total $ 1016.3 billionPer capita $ 4,254.8
GDP (purchasing power parity): $1.237 trillion (2012)
GDP - Indonesia

7
2012 Total $1847.982 billionPer capita $1,509
GDP (purchasing power parity): $4.761 trillion (2012)
GDP - India
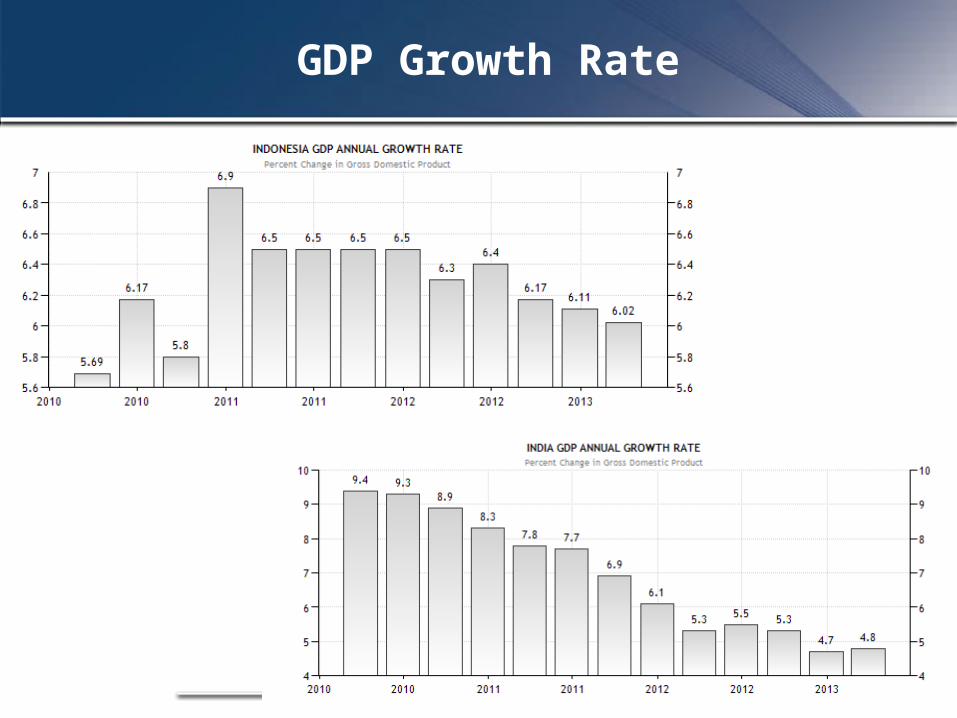
GDP Growth Rate

Stock Market
IDX
SENSEX

Inflation Rate

Unemployment Rate

Interest Rate

Indonesian Rupiah
14
Main Products
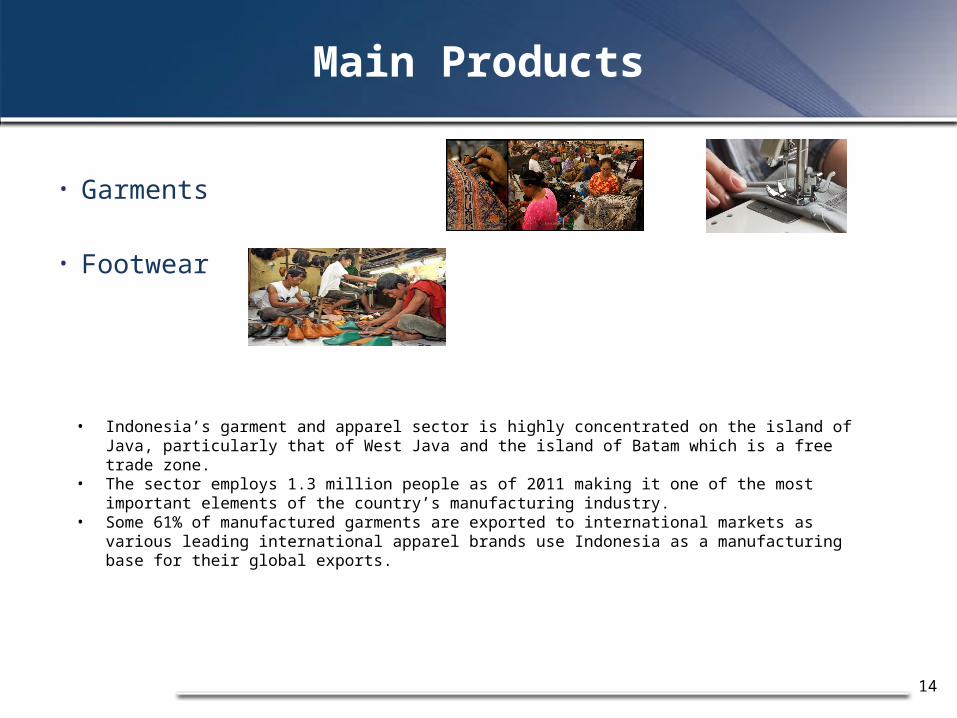
• Garments
• Footwear
• Indonesia’s garment and apparel sector is highly concentrated on the island of Java, particularly that of West Java and the island of Batam which is a free trade zone.
• The sector employs 1.3 million people as of 2011 making it one of the most important elements of the country’s manufacturing industry.
• Some 61% of manufactured garments are exported to international markets as various leading international apparel brands use Indonesia as a manufacturing base for their global exports.
15
Main Products
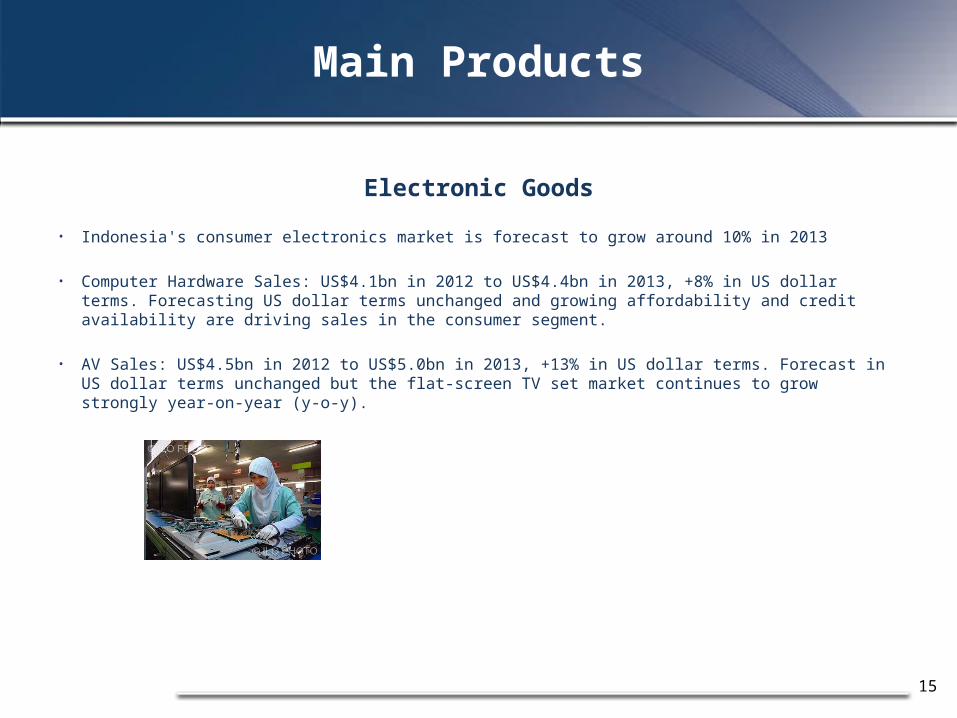
Electronic Goods
• Indonesia's consumer electronics market is forecast to grow around 10% in 2013
• Computer Hardware Sales: US$4.1bn in 2012 to US$4.4bn in 2013, +8% in US dollar terms. Forecasting US dollar terms unchanged and growing affordability and credit availability are driving sales in the consumer segment.
• AV Sales: US$4.5bn in 2012 to US$5.0bn in 2013, +13% in US dollar terms. Forecast in US dollar terms unchanged but the flat-screen TV set market continues to grow strongly year-on-year (y-o-y).

16
Main Products
• Furniture
• Paper Products
• Rubber Products
17
Indonesia Manufacturing Snapshot
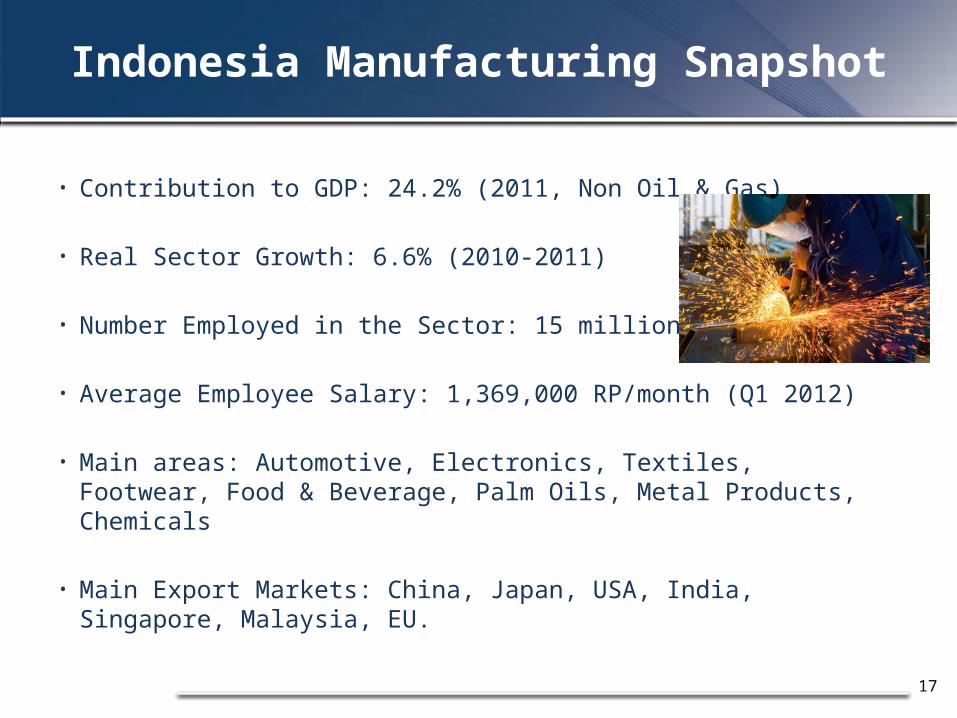
• Contribution to GDP: 24.2% (2011, Non Oil & Gas)
• Real Sector Growth: 6.6% (2010-2011)
• Number Employed in the Sector: 15 million
• Average Employee Salary: 1,369,000 RP/month (Q1 2012)
• Main areas: Automotive, Electronics, Textiles, Footwear, Food & Beverage, Palm Oils, Metal Products, Chemicals
• Main Export Markets: China, Japan, USA, India, Singapore, Malaysia, EU.

18
US Trade in Goods
-15,000.00
-10,000.00
-5,000.00
0.00
5,000.00
10,000.00
15,000.00
20,000.00
3,534.80
7,997.20 7,413.50 6,947.907,892.80
17,997.7019,111.00
16,478.30
-4,358.00
-10,000.50-11,697.50
-9,530.50
Exports
Imports
Balance
INDONESIA
2013 2012 2011 2010
-20,000.00
-10,000.00
0.00
10,000.00
20,000.00
30,000.00
40,000.00
50,000.00
8,757.00
22,105.50 21,503.5019,248.9017,939.40
40,514.10
36,155.50
29,532.90
-9,182.30
-18,408.70-14,652.00
-10,284.10
Exports
Imports
Balance
2013 2012 2011 2010
INDIA
NOTE: All figures are in millions of U.S. dollars

Major Exports
Major exports: Coal; briquettes (10%), Petroleum gases (8%), Palm oil, crude (7%), Petroleum oils, crude (6%)
1
109
8765
432
1211

20
EXPORTING COUNTRIES
Japan China United States
Singapore Korea, Rep. Malaysia India0.00%
2.00%
4.00%
6.00%
8.00%
10.00%
12.00%
14.00%
16.00%
18.00% 16.18%
10.23% 9.61%8.58%
7.80%
5.20% 4.55%

21
Major Imports
Petroleum oils,
refined
Aircraft
, space
craft &
launch
vehicle
s
Petroleum oils,
crude
Parts a
nd acce
ssorie
s of t
he moto
r vehicle
s
Automati
c data
proce
ssing m
achines
Electr
onic inte
rgate
d circu
its
Motor V
ehicles f
or tran
sporti
ngs go
ods
Transm
ission ap
paratu
s for r
adio, te
lephone & TV Cars
Electr
ic generati
ng sets
and ro
tary c
onverte
rs0%
2%
4%
6%
8%
10%
12%
14%
14%
3% 3%2% 2% 2% 2% 2% 2%
0%
% Imports

22
IMPORTING COUNTRIES
Singapore China Japan Korea, Rep. Malaysia Thailand United States
Australia India0.00%
2.00%
4.00%
6.00%
8.00%
10.00%
12.00%
14.00%
16.00%
18.00%
20.00% 18.19% 18.06%
13.27%
6.76% 6.32% 6.29%5.36%
3.35%2.48%

Q1-2012 Q1-2013 Growth (yoy)
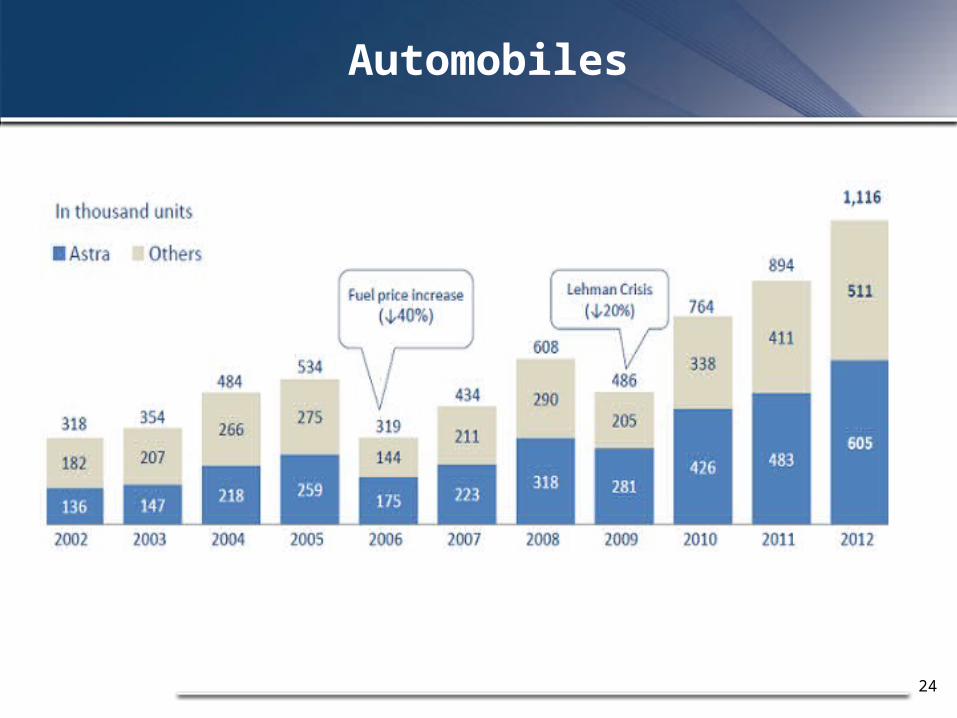
Indonesia's Car Sales(number of car units)
250,830 295,465 17.8%
January February March
Indonesia's Car Sales 2013
(number of car units)
96,705 103,284 95,936
2008 2009 2010 2011 2012
Indonesia's Car Sales(number of car units)
607,805 486,061 764,710 894,164 1,116,230
Automobiles
24
Automobiles
25
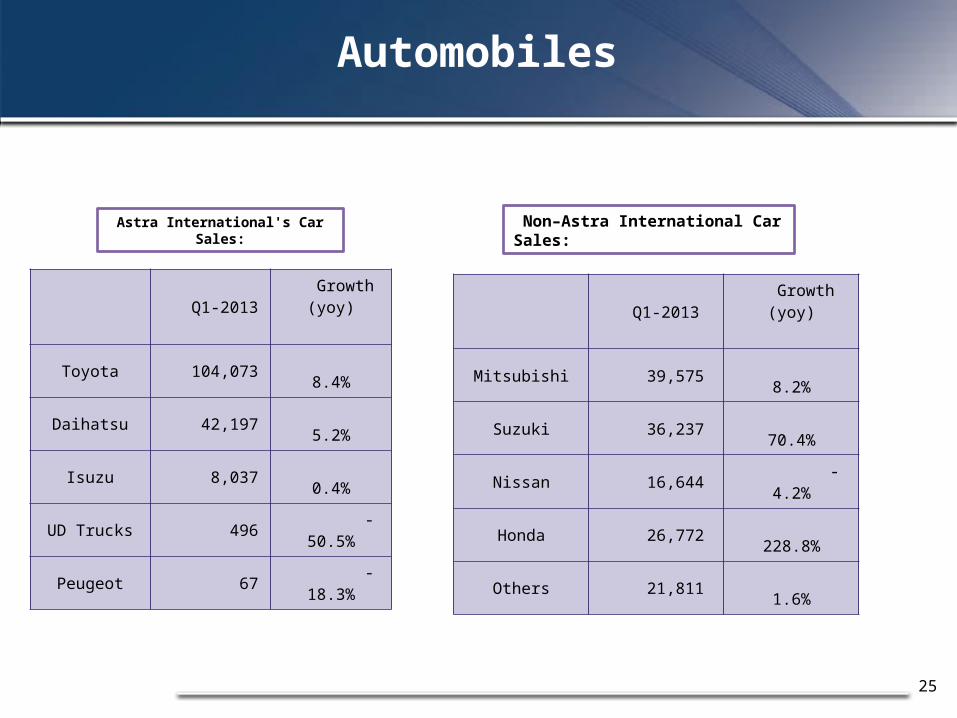
Q1-2013 Growth (yoy)
Toyota 104,073 8.4%
Daihatsu 42,197 5.2%
Isuzu 8,037 0.4%
UD Trucks 496 -50.5%
Peugeot 67 -18.3%
Q1-2013 Growth (yoy)
Mitsubishi 39,575 8.2%
Suzuki 36,237 70.4%
Nissan 16,644 -4.2%
Honda 26,772 228.8%
Others 21,811 1.6%
Astra International's Car Sales: Non–Astra International Car Sales:
Automobiles
26
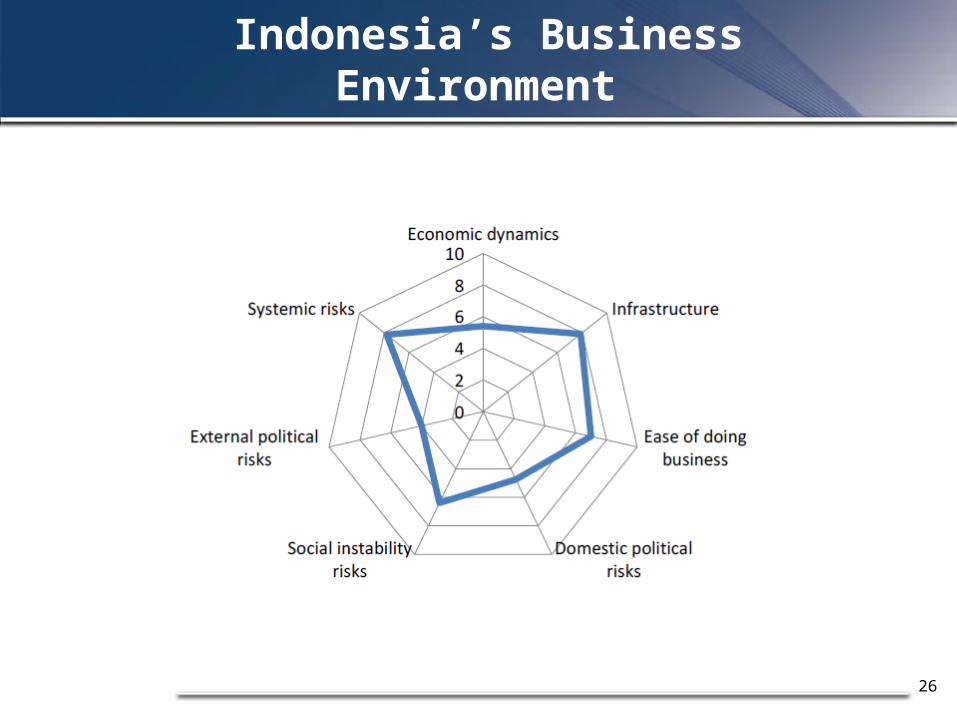
Indonesia’s Business Environment
27
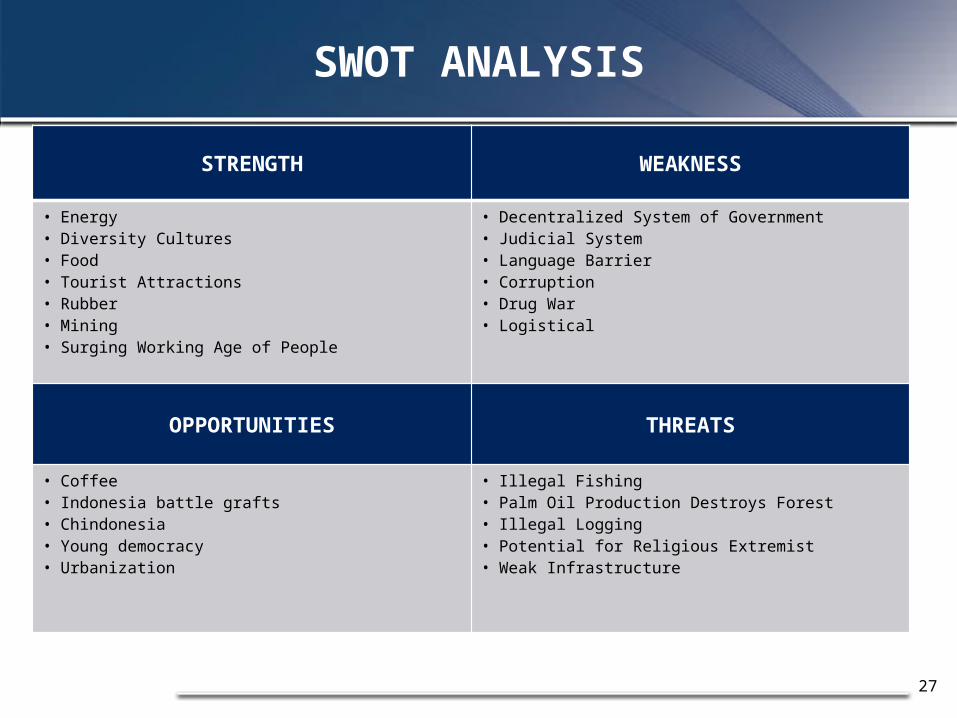
SWOT ANALYSIS
STRENGTH WEAKNESS
• Energy• Diversity Cultures• Food• Tourist Attractions• Rubber• Mining• Surging Working Age of People
• Decentralized System of Government• Judicial System• Language Barrier• Corruption• Drug War• Logistical
OPPORTUNITIES THREATS
• Coffee• Indonesia battle grafts• Chindonesia• Young democracy• Urbanization
• Illegal Fishing• Palm Oil Production Destroys Forest• Illegal Logging• Potential for Religious Extremist• Weak Infrastructure

28
Global Competitiveness Index
Rank (out of 144)
Score (1–7)
GCI 2012–2013 50 4.4
GCI 2011–2012 (out of 142) 46 4.4
GCI 2010–2011 (out of 139) 44 4.4
Basic requirements (40.0%) 58 4.7
Institutions 72 3.9
Infrastructure 78 3.7
Macroeconomic environment 25 5.7
Health and primary education 40 5.7

29
Global Competitiveness Index
Rank (out of 144)
Score (1–7)
Efficiency enhancers (50.0%) 58 4.2
Higher education and training 73 4.2
Goods market efficiency 63 4.3
Labor market efficiency 120 3.9
Financial market development 70 4.1
Technological readiness 85 3.6
Market size 16 5.3
Innovation and sophistication factors (10.0%) 40 4.0
Business sophistication 42 4.3
Innovation 39 3.6
30
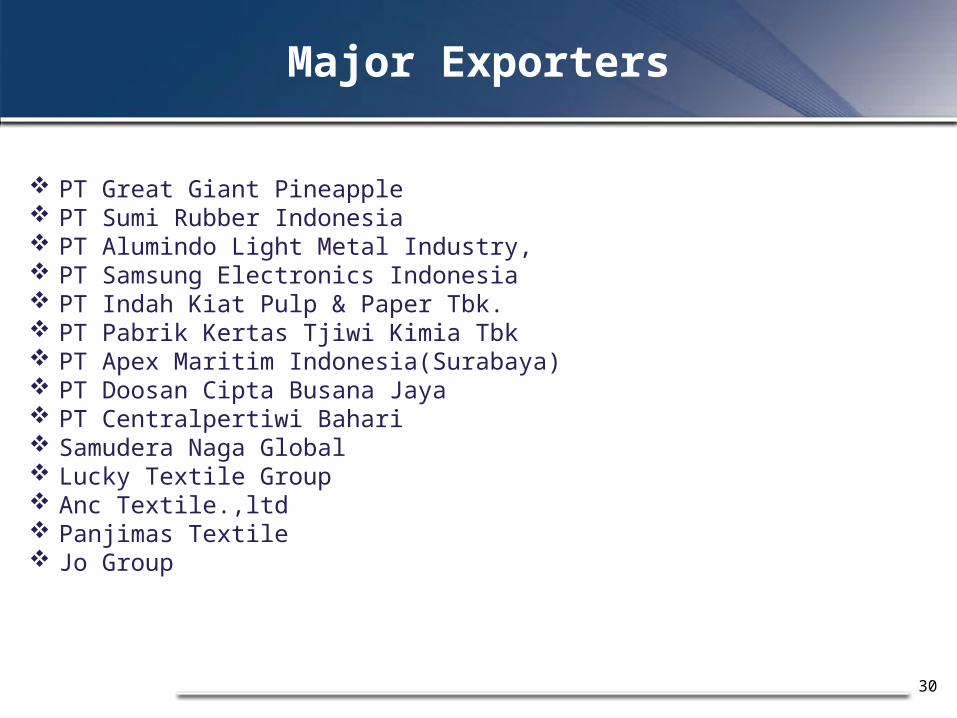
Major Exporters
PT Great Giant Pineapple PT Sumi Rubber Indonesia PT Alumindo Light Metal Industry, PT Samsung Electronics Indonesia PT Indah Kiat Pulp & Paper Tbk. PT Pabrik Kertas Tjiwi Kimia Tbk PT Apex Maritim Indonesia(Surabaya) PT Doosan Cipta Busana Jaya PT Centralpertiwi Bahari Samudera Naga Global Lucky Textile Group Anc Textile.,ltd Panjimas Textile Jo Group

Related Documents