Individual Teacher Incentives, Student Achievement and Grade Inflation Pedro S. Martins March 2010 ISSN 2045-6557

Welcome message from author
This document is posted to help you gain knowledge. Please leave a comment to let me know what you think about it! Share it to your friends and learn new things together.
Transcript

Individual Teacher Incentives, Student
Achievement and Grade Inflation
Pedro S. Martins
March 2010
ISSN 2045-6557
Published by
Centre for the Economics of Education
London School of Economics
Houghton Street
London WC2A 2AE
© Pedro S. Martins, submitted March 2010
All rights reserved. No part of this publication may be reproduced, stored in a retrieval system
or transmitted in any form or by any means without the prior permission in writing of the
publisher nor be issued to the public or circulated in any form other than that in which it is
published.
Requests for permission to reproduce any article or part of the Working Paper should be sent
to the editor at the above address.
The Centre for the Economics of Education is an independent multidisciplinary research
centre. All errors and omissions remain the authors.

Executive Summary
There is great interest in understanding the potential of teacher incentives to improve
student achievement. In fact, teacher incentives, either individual or collective, may improve
student achievement if they succeed in aligning the public or social goals with the goals of
the teacher. However, an approach in which reward is based on outputs can also be fraught
with difficulties: For instance, setting specific measurable outputs may lead to potentially
dysfunctional behaviour such as teaching to test. Moreover, while individual incentives may
disrupt collaborative work, collective incentives may also generate free riding and, in the end,
little effect on performance.
This paper sheds light into this question by examining the recent introduction of performance-
related pay in all public schools in Portugal. Our approach is based on a difference-in-
differences analysis drawing on two complementary control groups. These control groups
either were exposed to a lighter version of the intervention (the case of public schools in the
Azores and Madeira) or were not exposed at all (the case of private schools). All students in
all schools were administered the same national exams.
Our results indicate that the increased focus on individual teacher performance caused a
significant and sizable relative decline in student achievement, as measured by national exams.
However, the decline in achievement is smaller or virtually zero when considering those marks
set by teachers, suggesting an increasing importance of grade inflation. This view is consistent
with the emphasis placed by the new promotion criteria on student results. Finally, the
analysis of teacher early retirement across public schools supports the theoretical mechanisms
(and much anecdotal evidence) that predict the empirical results, namely disruption of teacher
cooperation created by tournaments for promotions and increased administrative workloads,
both resulting in job dissatisfaction.
While our results are not optimistic in terms of the value of the specific reform examined
here, the findings are reassuring in that they indicate that teachers respond to incentives
in a predictable way. In this context, we believe that future research should move from the
broad issue of whether performance-related pay has positive or negative effects to the narrower
but in our view more illuminating question of which specific performance-related pay setups
generate the best results for students.
1


Individual Teacher Incentives, Student
Achievement and Grade Inflation
Pedro S. Martins
1. Introduction 1
2. The Teacher Incentives Reform 7
3. Data 10
4. Results 12
Private schools 15
5. Robustness 17
Common trends 17
Early retirement 19
School-by-school analysis 21
Other control variables and tests 22
6. Conclusions 24
Figures 28
Tables 32
Acknowledgments
Thanks to Pedro Pita Barros, Nuno Crato, Michaela Gulemetova, Victor Lavy, Helena
Martins, Alvaro A. Novo, Thomas Piketty, Pedro Portugal, Ron Zimmer and seminar
participants at the Institute of Education (London) for helpful discussions.
Pedro Martins is Professor of Applied Economics at the School of Business and Management,
Queen Mary University of London and a CEE Associate.

1 Introduction
Recent research has emphasized the importance of teachers in terms of students’ achievement
(Rivkin et al. 2005). This line of inquiry has also shown that it is particularly difficult to
explain differences in teacher quality, at least when using teacher characteristics available
for research analysis (Aaronson et al. 2007). These results have generated increased interest
in the study of mechanisms that may raise achievement through teachers, including training,
improving pay or stregthening incentives (Lazear 2003). This paper addresses the latter policy
option.
In fact, teacher incentives, either individual or collective, may improve student achievement
if they succeed in aligning the public or social goals with the goals of the teacher. In this case,
a combination of incentive and composition effects will increase student performance (Lazear
2000, 2003). However, an approach in which reward is based on outputs can also be fraught
with difficulties, which may explain the popularity of simpler input-based rewards (Kane
& Staiger 2002). For instance, setting specific measurable outputs may lead to potentially
dysfunctional behaviour such as teaching to test. Moreover, while individual incentives may
disrupt collaborative work (Fehr & Schmidt 1999), collective incentives may also generate free
riding and, in the end, little effect on performance.
Although the theoretical analysis on the effects of teacher incentives is ambiguous, the
empirical literature in this area is particularly thin. We know of only four studies that explore
randomized or quasi-natural experiments to address the causal relationship between teacher
incentives and student achievement - Lavy (2002), Glewwe et al. (2003), Lavy (forthcoming)
and Muralidharan & Sundararaman (2009). Furthermore, the results of these three papers
are not entirely consistent: the two studies based on Israel (Lavy 2002, forthcoming) and the
one based on India (Muralidharan & Sundararaman 2009) are supportive of the potential of
collective and individual teacher incentives, while the randomized experiment based on Kenya
(Glewwe et al. 2003) is not.1
While the literature above focuses on case studies, in our contribution we examine the
effects of the recent introduction of individual teacher incentives in all public-sector schools
in a given country, Portugal. The main aspects of this reform, described in more detail1See also Figlio & Kenny (2007) for a study of the US based on cross-sectional data and Atkinson et al.
(2009) for a recent analysis of the introduction of performance-related pay for teachers in England.
5
in Section 2, are the breaking up of the until then single pay scale for teachers into two
and the tournament-like structure for progression between the pay scales. While before the
reform progression (and wage growth) depended almost only on tenure, the new incentives
placed considerable emphasis on the school-level and national-exam results of the students
taught by each teacher. However, as any progressions between the two pay scales could not
exceed a given number of upper-scale teacher vacancies per school determined centrally by
the Ministry of Education, the incentive structure amounted to a form of tournament (Lazear
& Rosen 1981). Overall, these changes established a clear contrast in the incentives faced by
public-school teachers, from input- to output-based.
We study the effects of these reforms in terms of students’ school-level and national-
exam results. Specifically, we draw on freely-available matched student-school data covering
the population of secondary school students that sat national exams from 2002 to 2009 in
Portugal. We then conduct a difference-in-differences (DID) analysis based on two comple-
mentary control groups. In the first control group, we consider public schools in the Azores
and Madeira. These are two autonomous regions of Portugal that were exposed to lighter
versions of the reform than the rest of the country, as their pay scale remained unchanged
and progression was less restricted. In the second control group, we consider private schools.
These schools are again subject to the same national exams as the treatment group but their
teachers were not affected by the reform, as pay and any incentives remained freely set by
each private school, subject only to wage floors determined by collective bargaining.
Our research contributes to the literature on the effects of teacher incentives in different
ways. First, this is the first paper that examines a reform that was applied across a country
(rather than a pilot study, for instance) and that conducts the analysis drawing on population
data. We are therefore able to address issues of external validity that arise in experimental
settings and that typically receive little attention due to data constraints, particularly in the
emerging empirical literature on incentives (Lazear 2000, Bandiera et al. 2005). Indeed, our
population data also contrast with the case of the papers mentioned above that draw on
randomized or quasi-experimental studies (Lavy 2002, Glewwe et al. 2003, Lavy forthcoming,
Muralidharan & Sundararaman 2009), since ”[a] weakness of natural experiments is that their
results may not be generalizable beyond the group of individuals or firms or the setting used in
the study” Meyer (1995). In fact, these papers do not claim to present representative evidence
6
of the countries examined as their research design generates average-treatment-on-the-treated
effects instead. Moreover, our analysis of systematically-collected official data throughtout
the period will alleviate measurement error bias and Hawthorne effects compared to the case
of a typical experiment.
A second important aspect of our study is that, as the assignment of schools to treatment
is not random, we conduct several robustness tests, on top of our consideration of two comple-
mentary control groups. For instance, our analysis of a long period of up to five years before
the reform allows us to test the common trends hypothesis in some detail. Furthermore, we
consider a number of different specifications that control for different sets of variables, includ-
ing school and school-exam fixed effects, and different data subsets or aggregation levels. We
also exploit the introduction of voluntary but costly early retirement in the public sector in the
end of the period to study any possible correlation between reform-related job disatisfaction
(proxied by early-retirement take-up) and student achievement.
Finally, we pay particular attention to the potential for grade inflation (Jacob & Levitt
2003). This may result from the fact that the progression criteria are affected by student
results that are determined at least in part by the teachers themselves. As we have individual
student data on both school- and national-level results, we can examine grade inflation from a
triple-differences perspective by considering, for each student-module pair, both the internal
and external marks. These results complement our evidence on the effects of the reform in
terms of internal and external grades.
Overall, we find that the increased focus on individual teacher performance caused a sizable
and statistically significant decline in student achievement. This decline in achievement is also
much more pronounced in the case of national exams, with an effect of about half a standard
deviation. Consistently with the different effects in terms of internal and external results, our
triple-difference evidence also documents a significant increase of grade inflation. In addition,
in support of a causal interpretation of our results, we find that in most cases there are no
significant differences between the treatment and control groups before the introduction of
merit pay and that the negative effects upon national exams are cumulative in the period
after the reform is introduced. Moreover, we present evidence that teachers in those public
schools that exhibit bigger falls in performance after the reform are more likely to take costly
early retirement when it becomes available at the end of the period. This is consistent with
7
the potential negative effects of the incentives in terms of cooperation amongst teachers,
administrative workload and, in the end, overall job satisfaction, as suggested by theory.
Finally, the inclusion of different control variables or the consideration of different subsets of
the data makes only very minor differences to the size of our estimates, as would be the case
if assignment to treatment were random.
The structure of the paper is as follows: Section 2 describes the main characteristics of
the education reform studied in the paper and discusses some of its theoretical implications.
Section 3 presents the data used in the paper, a matched school-student panel data set; Section
4 describes the main results, while Section 5 presents the robustness analysis. Finally, Section
6 concludes.
2 The teacher incentives reform
A new government that came into office in 2005 decided to respond to the evidence of relatively
poor performance levels in the Portuguese education system (OECD 2001). Indeed, when
measured in terms of international comparisons such as the OECD’s PISA tests, students in
Portugal do not fare well. This is particularly true when taking into account the relatively
high public expenditure levels in education in the country, of which relatively high average
teacher salaries are an important component.
A key aspect of the education reform was the breaking up of the until then single pay
scale for teachers into two separate scales. This and other aspects of the reform became
law in January 2007, after having been subject to public discussion for several months and
approved by the government in November 2006. The breakup of the pay scale marked an
important contrast with the period before the 2006/07 school year as teachers were no longer
ensured of virtually automatic, tenure-related progression from the bottom to the top of the
pay scale over their careers. In particular, the gap between the last point in the lower scale
and the first point of the higher scale was particularly large, at around 25%, from about
�2,000 to about �2,500 per month (gross). On the other hand, those teachers in the higher
pay scale were supposed to play a special role in management and pedagogical tasks in their
schools.
Another key aspect of the reform is that the new system conditioned progression from the
lower to the upper pay scale on a number of individual teacher performance variables. These
8
broadly measurable criteria were virtually inexistent until them. One such criterion for teacher
progression, which received by far most media attention, was the academic performance of the
students taught by each teacher. Another criterion that also received considerable attention
was the feedback from the students’ parents about the teacher. The remaining criteria included
the teacher’s attendance record, attendance at training sessions, management and pedagogical
duties, and involvement in research projects.
According to the new law, these criteria for progression were to be assessed at each school,
by those teachers in the higher pay scale. Moreover, detailed assessment sheets were made
available by the Ministry of Education to be used when gathering information on the above-
mentioned criteria. However, even if the teacher did well along these criteria, progression
between the two pay scales was still conditional on a given number of (upper-scale) teacher
vacancies per school, determined centrally every two years by the Ministry of Education as a
function of the number of students in the school.2
On the political economy side, the reform generated heated debate and opposition from
teacher unions and many teachers, including two national strikes. The extensive bargaining
between government and unions that ensued created some confusion about the ultimate format
of the incentive system, which is not yet absolutely clear at the time of writing. Moreover,
there are reports of different levels of compliance both across and within schools, over time.
However, different sources indicate that teachers acknowledged the change in incentives and
adapted their behaviour to the new system. Additionally, a large number of teachers without
tenure or with intermediate levels of tenure have already been assessed for the purpose of
progression in the terms of new law and their assessment includes the period covered by our
data (see Section 3). New assessment rounds (which are to take place every two years) are
envisioned and the period of time that will be taken into account for the purpose of that
assessment again includes our data.
From the above, we conclude that the reform under study involves a stark contrast in
terms of teacher assessment and incentives. In particular, the new framework introduces
several aspects which can be characterised not only as performance-related pay but also more
specifically as tournaments (Lazear & Rosen 1981). Doing extremely well may not be enough2According to the law, those teachers that did particularly well along the progression criteria and met
centrally-determined quotas would also receive a one-off financial award. However, this aspect of the newsystem was not yet put into practice.
9

for a promotion if one’s colleagues do even better and take all promotion vacancies available.
In this context, and turning to a theoretical discussion of the predicted effects of this reform,
there are different arguments to take into account. On the one hand, the greater weight
placed on performance indicators will presumably induce teachers to focus their effort on
those criteria highlighted in the law. This is expected to increase student achievement, which
is measured by national exams and, to a less extent, school-level results.
On the other hand, tournaments are known to be potentially disruptive in terms of the
collaborative work amongst agents involved in a competition (see Martins (2008) and the
references therein). Moreover, collaborative work may be particularly important in the public
sector and, in particular, in the education context. Fairness concerns may come to the fore
and undermine teacher morale (Fehr & Schmidt 1999, 2004), given the difficulties in assessing
teacher contribution (Jacob & Lefgren 2008). Moreover, setting broadly measurable outputs
may lead to dysfunctional behaviour such as grade inflation, particularly in terms of internal
(school-level) marks, which are direclty determined by teachers.3 Finally, the administrative
burden involved in this or any other teacher assessment process may also be considerable.
For instance, the time spent handling the formal aspects of applying for progression and
gathering the required supporting documents may reduce the effort that teachers put into
teaching activities. Indeed, teachers and other stakeholders complained frequently about this
aspect of the reform.4
One important final aspect in terms of the education reform studied here is that it applied
only to a smaller extent in the cases of the two autonomous regions in Portugal, the Azores
and Madeira islands. Indeed, these two regions have special legislative powers in some do-
mains, including education, and they have decided not to follow fully the education reform
in the mainland.5 Specifically, the two regions also introduced greater emphasis on teacher
assessment, under broadly the same criteria as in the mainland, although less so in the case of
Madeira. However, one important difference that applied to both Azores and Madeira is that3Tournaments will also generate extra risk in pay which would need to be compensated by higher wages in
competitive markets but not necessarily in the regulated, public-sector labour market we study here.4For instance, a national parents’ association expressed publicly its concern about the negative effects of
the reform in terms of student learning, as observed by their members. See ’Teachers’ evaluation compromisesstudents learning, say parents’ (our translation), in newspaper Publico, 7 Nov 2008. There are also hundredsof internet blog entries written by aggrieved teachers complaining about the increased administrative workloadand diminished collegiality in their schools.
5The relevant legal documents are Law (Decreto-Leis) 17/2007, of January 19th and 200/2007, of May22nd, and Regional Laws (Decretos Legislativos Regionais) 28/2006/A, of August 8th; 21/2007/A, of August30th; and 6/2008/M, of February 25th.
10
they did not break up their pay scale. These differences in the intensity of the treatment are
exploited in our empirical analysis. The relatively long geographical distance between these
two regions and the mainland (about 1600km and 950km, respectively) also minimises any
possible spillover effects from the treated to the control groups (e.g. teacher mobility).
Furthermore, the reform did not apply at all to private schools, which account for almost
one fifth of all secondary schools in the country. More importantly, teachers in private schools
are rewarded independently according to the practices adopted by each school, following wage
floors set by collective bargaining between private-sector school employer associations and
national teacher unions.6 In particular, we could not find any evidence of systematic changes
to the personnel policies of private schools over the period or of any effect from the new
teacher incentives in public schools upon the functioning of private schools.
3 Data
Our data cover the population of high-school national exams in Portugal over eight school
years, from 2001/02 to 2008/09. The data are made available by the National Exams Com-
mittee (JNE, Jurı Nacional de Exames), an agency of the Ministry of Education which is
responsible for all matters regarding the national exams carried out in the country. The high-
school national exams, studied in this paper, are required for the award of the high-school
diploma and also for university entry (European Commission 2007).
The data include information about the internal grades obtained by students in each
module (a specific discipline of study, such as Portuguese or Maths) from their schools, which
are based on test results and other criteria adopted by each teacher. There is also information
about the students’ final result in each module, after taking into account each student’s
internal and national-exam grades (with weights of 70% and 30%, respectively). Internal
grades are truncated below 10, the pass level, in a scale of 0 to 20, in which case the student
cannot sit the national exam, except in special circumstances. All data used in the paper are
freely available from the JNE website.7
Each observation concerns a unique student-module-school-year combination. Typically,6Only about one fourth of these private schools are religious, virtually all of them catholic. See Neal (1997)
for an analysis of these schools in the US context.7Link: http://sitio.dgidc.min-edu.pt/JNE/Paginas/estatistica.aspx (in Portuguese). The
data were originally released openly so that the media could compile school rankings. As far as we know, thedata have never been used for other purposes until now.
11
there will be several observations for each student but it will not be possible to match them as
the data do not include any individual student identifier. However, all schools and all modules
are identified by name and unique time-invariant codes. Importantly, there is also information
on the school’s location at the concelho level (up to 300 different geographical areas) and the
school’s public or private status. There are several variables for each student-module-school-
year combination: if the exam is a resit (either because the student failed before or because the
student wants to improve their grade), if the student is applying for admission to university,
and if the student is sitting the exam but is not enrolled in the school. The data also include
the student’s gender and age, but only for the last four years (2005/06-2008/09); and the
student’s school year when taking the module (typically 12th, which is the last in secondary
education in Portugal, but also the 11th, as some modules are subject to national exams at
that stage).
We create our main sample of analysis by drawing on all student-exam pairs that meet the
following five conditions: a first sit in the first call of a student that is applying to university
and is also enrolled in the module of the exam in the school where they are sitting the exam;
and schools that are present in the data in all eight years. These criteria are similar to those
adopted by most media when compiling school rankings. Our criteria are also imposed in
order to ensure that the effect in terms of internal and external grades are based on the same
sample and thus are strictly comparable. The resulting 1,638,895 observations are distributed
across 557 schools, of which 466 are public schools and subject to the reforms described in
the previous section.8
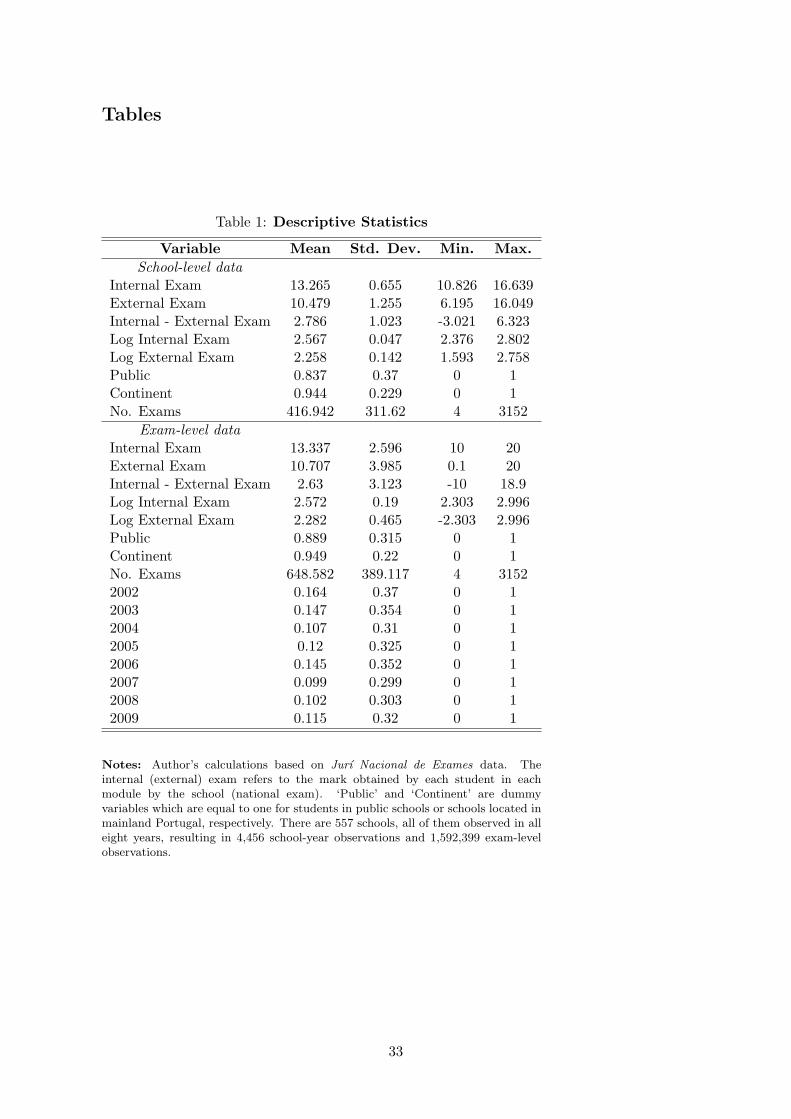
Table 1 presents descriptive statistics based on school (top panel) or student-exam (bottom
panel) data. Amongst other results, we find that the mean internal exam is larger than 13
while the mean external result is less than 11, both at the school- and student-module-level,
in a scale of 0 to 20. This leads to an average gap between the two marks of more than 2,
which is suggestive of considerable grade inflation or simply of different standards between
school and national assessment. We also find that, on average, there are 417 exams per year8The original size of the data is 3,487,026. 29.05% of these observations refer to second calls; 31.53% are not
enrolled in the school; 7.10% are not applying for university admission; and 27.39% are resitting the exam. Ofcourse, these exclusion categories overlap for many observations. (Extensive robustness analysis was conductedand the results presented below in Section 4 are not sensitive to different sample definitions as discussed inSection 5.) We also find that only one school is not present in the data in all years, a result that highlightsthe stability of the education sector in Portugal and rules out composition effects. No school switches betweenpublic and private status. There are 91 private schools and 30 public schools in Azores and Madeira.
12
per school. Of interest for the interpretation of the relative magnitude of our main results,
the standard deviations of the logarithms of the internal and external exams are 0.05 and
0.14, respectively.
About 11% of the exams pertain to private schools and about 5% are from schools in the
Azores and Madeira regions. Moreover, there is a downward trend in the number of exams
in the period covered, which is consistent with the declining number of students enrolled in
secondary school as indicated by national statistics. The exception to the trend is 2006, when
new exams were introduced while some of the older exams were still sat by students.
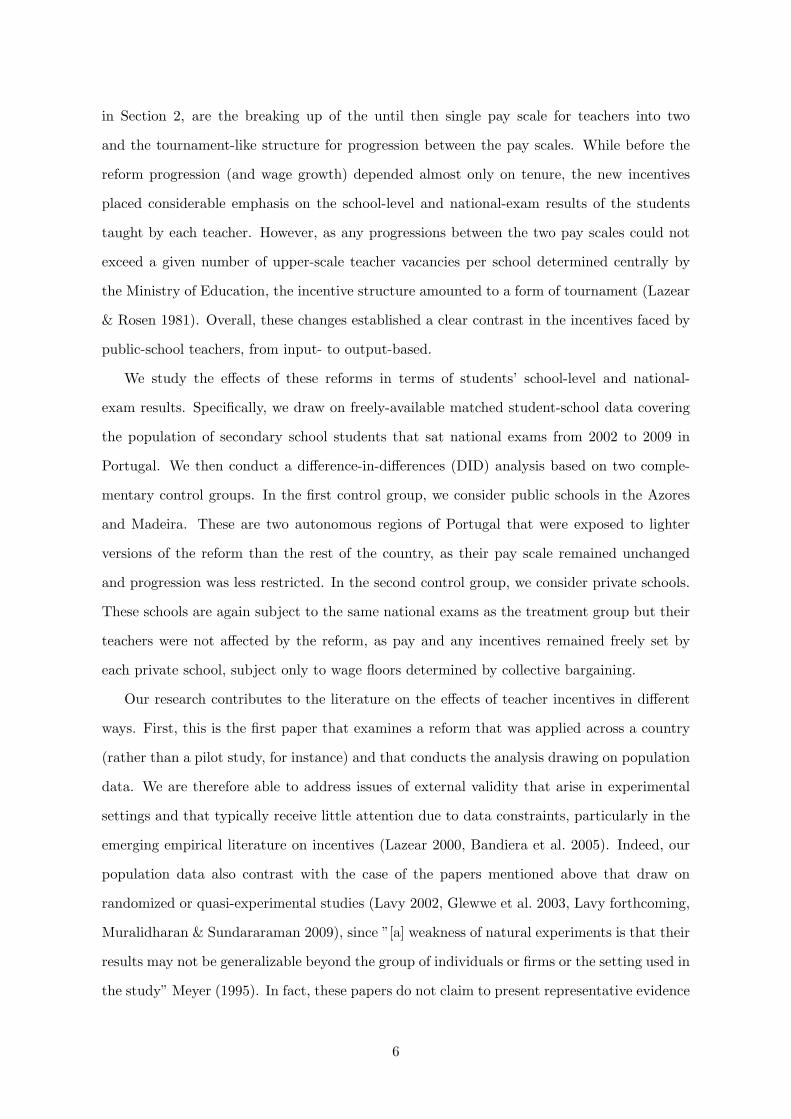
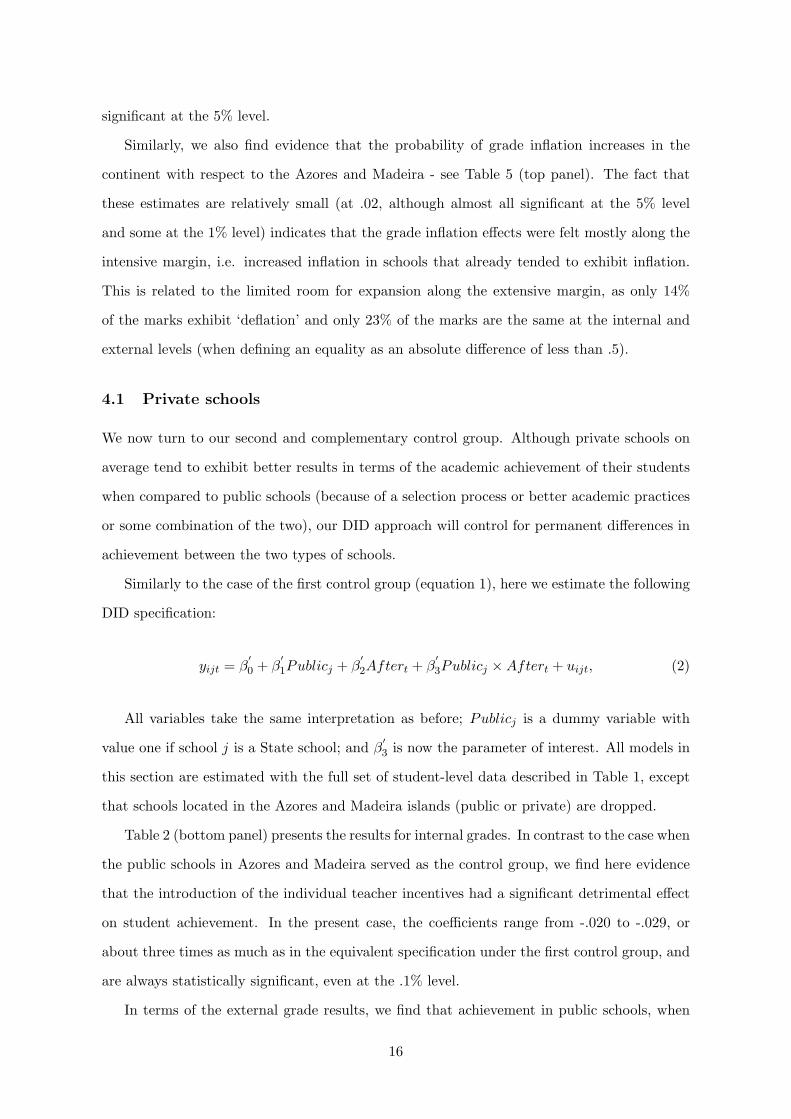
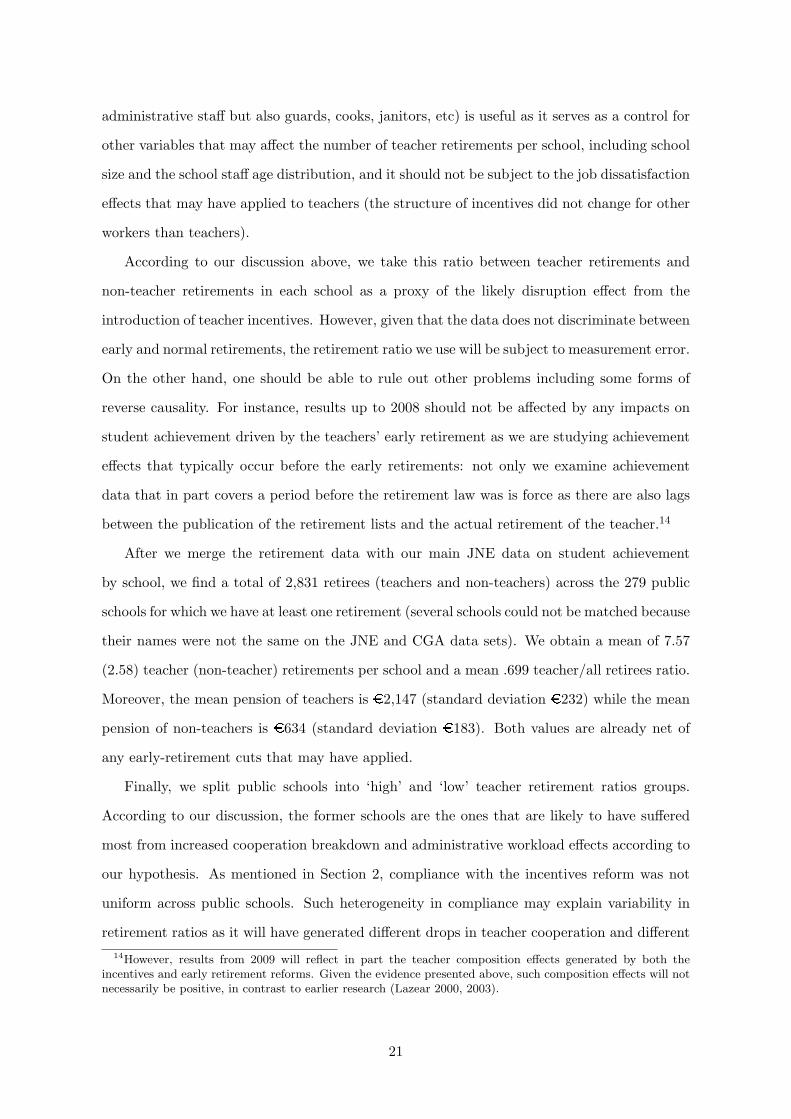
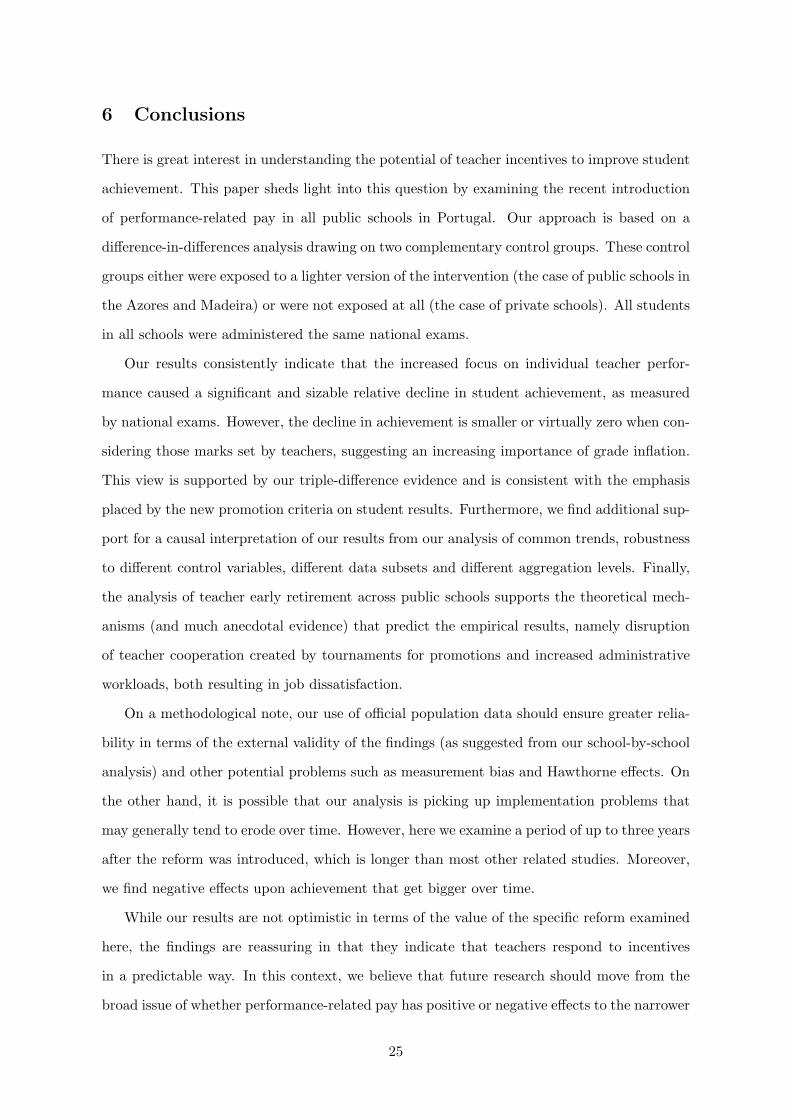
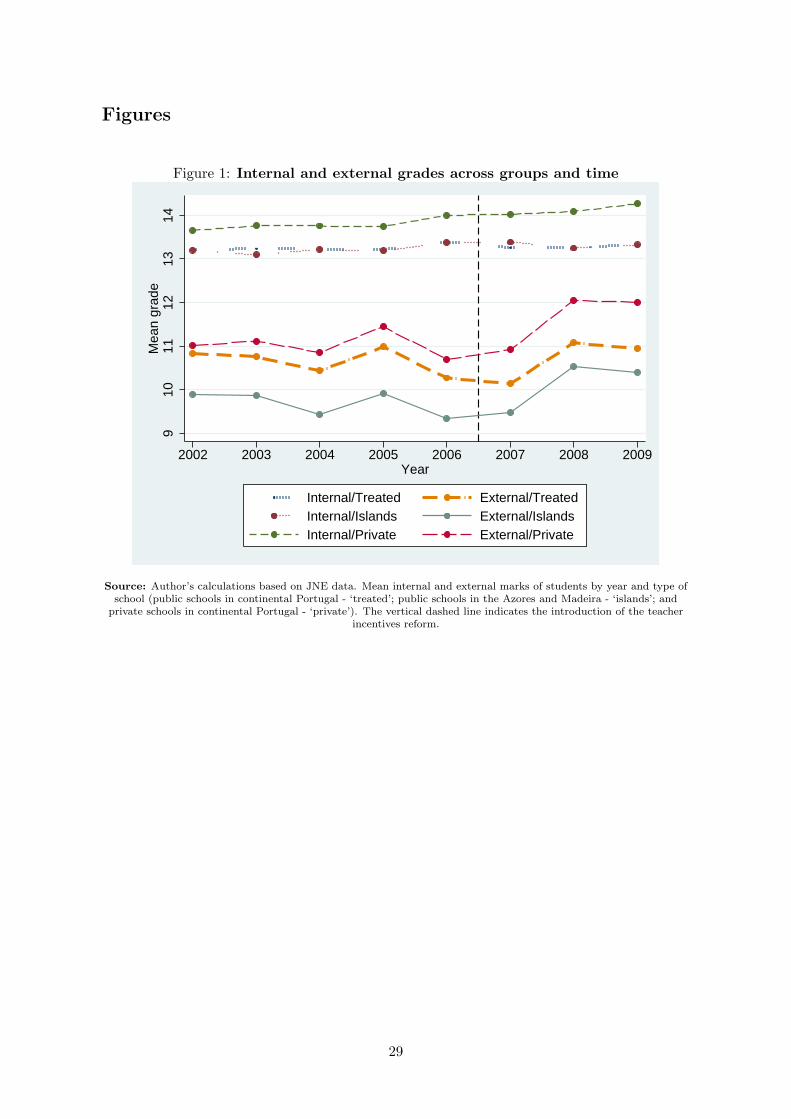
Given that our DID estimates rely on variation over time across different groups of stu-
dents, we present in Figure 1 the mean internal and external grades in each year from 2002 to
2009 at the three groups of schools we consider in our analysis: public schools in continental
Portugal, public schools in the Azores and Madeira, and private schools (in the continent).
We find that internal grades are very stable over the period in public schools (either in the
continent or in the islands), while private schools exhibit an upward trend at the second part
of the period. On the other hand, external marks are not only considerably lower - as docu-
mented before - but also exhibit greater fluctuation over time, including a pronounced increase
across the three groups of schools from 2007 to 2008. However, the increase in external marks
is more pronounced in the cases of private and public/islands schools. In particular, it can
be seen in Figure 1 that while the gap between internal and external marks was higher for
private schools than for continent public schools in 2002-2006, this is reversed by 2007.
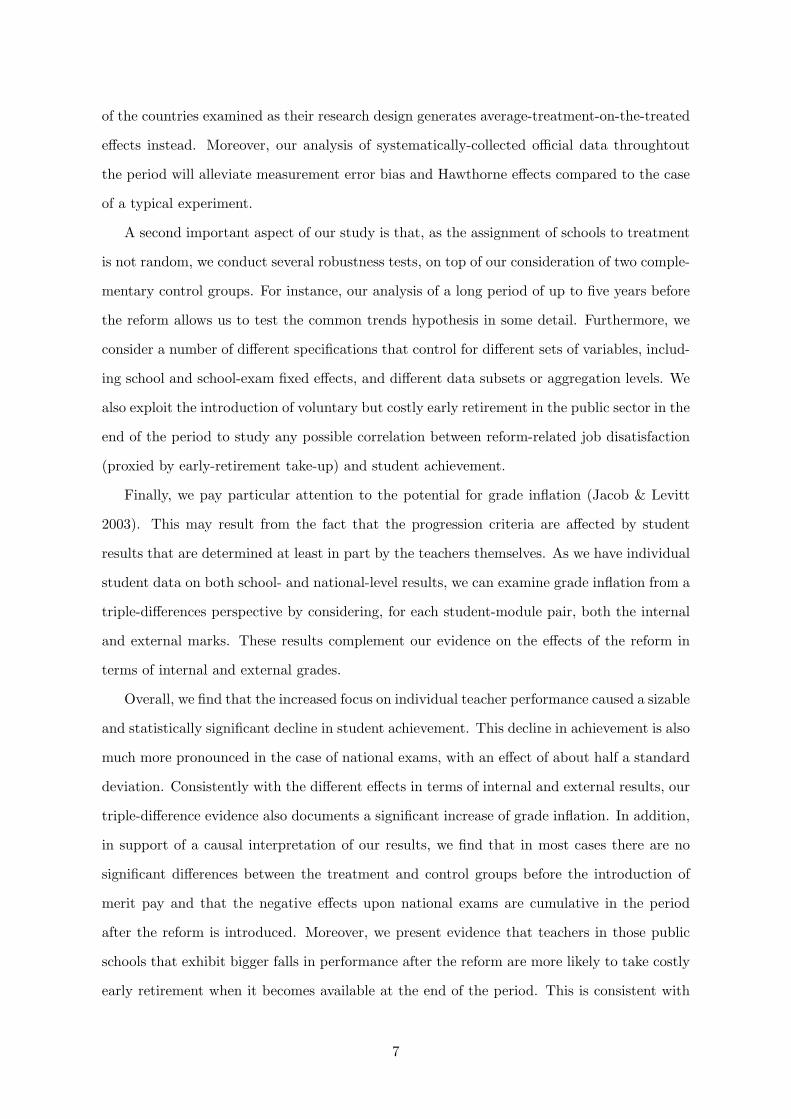
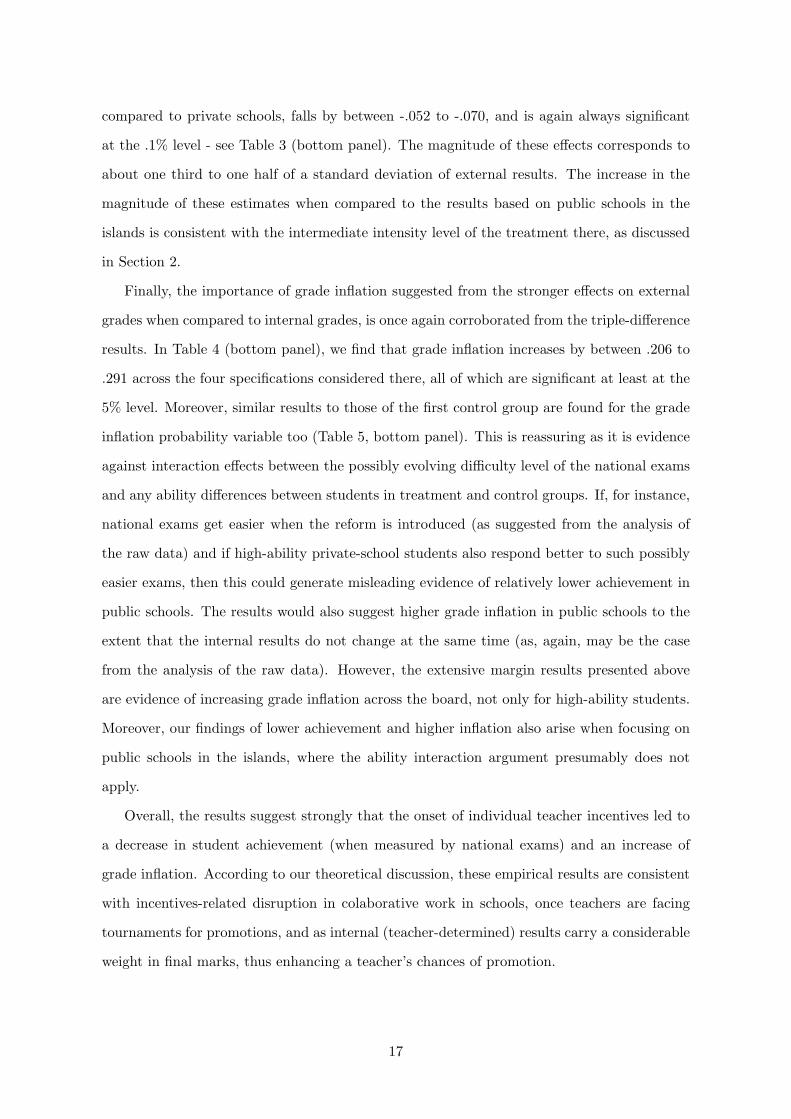
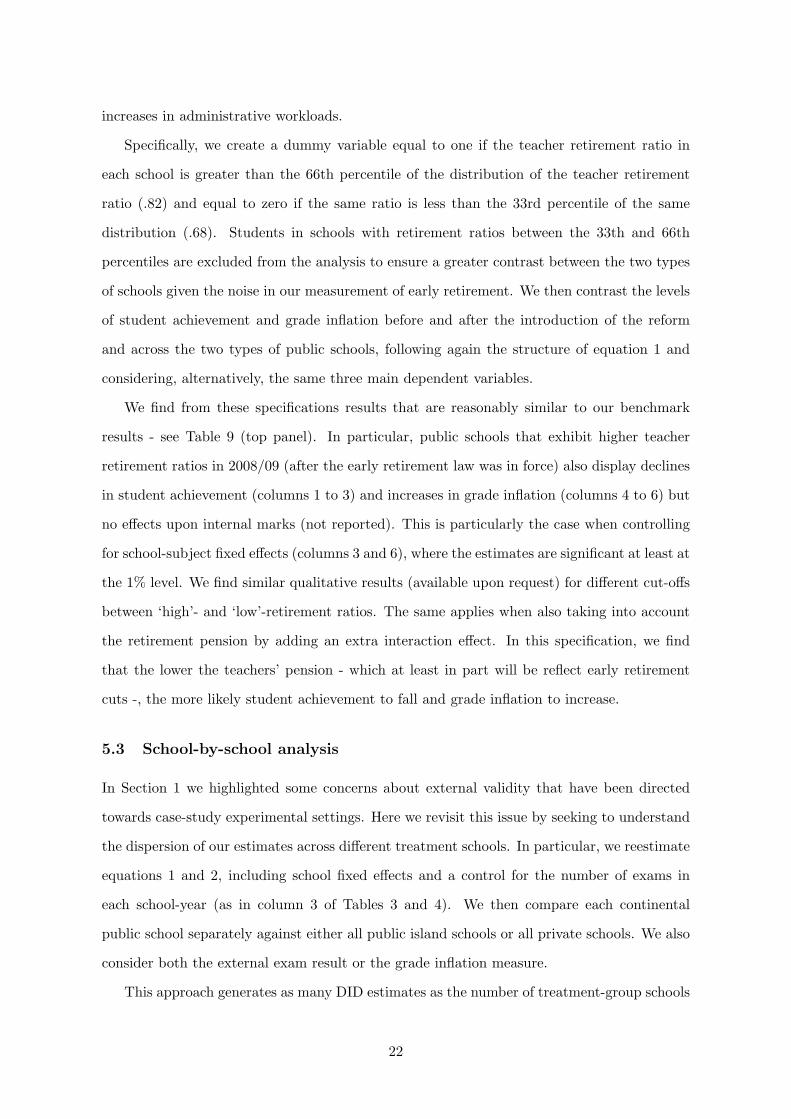
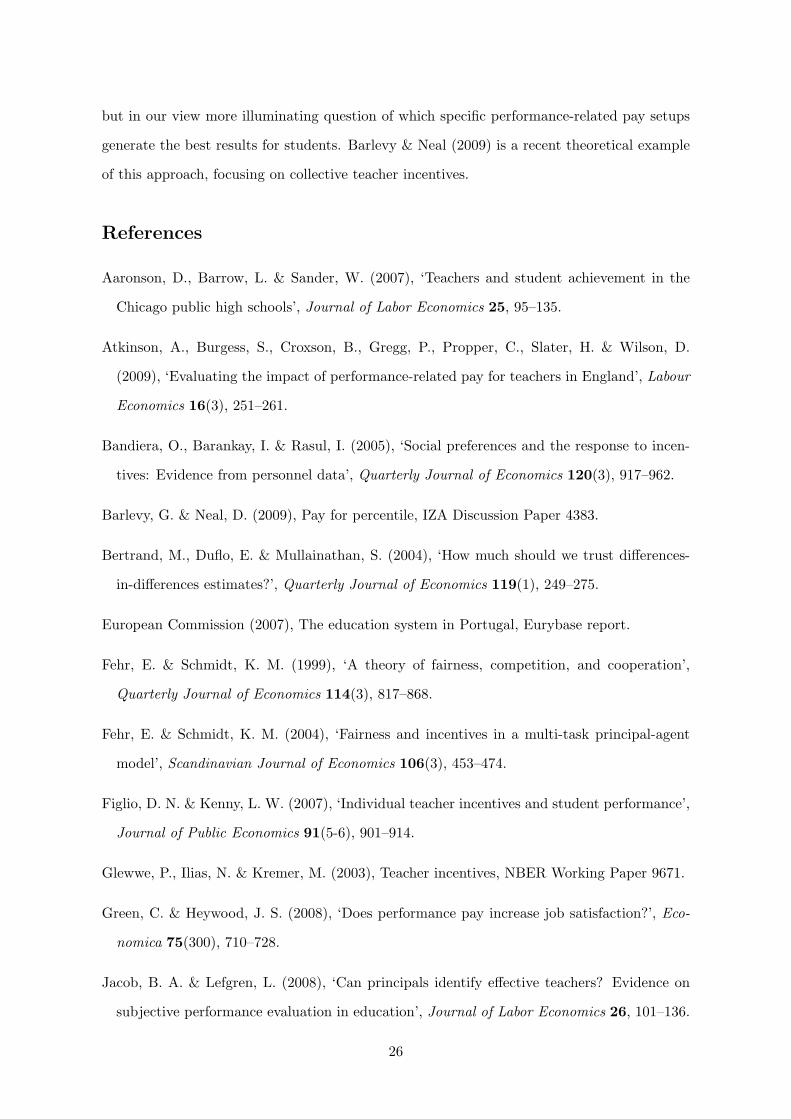
For additional information, Figure 2 presents the distributions of internal and external
grades, focusing on the cases of the Azores and Madeira and the continent subsets, in 2005
(before the reform) and 2009 (after the reform) - results for other years are similar. We find
that these distributions do not change in a pronounced way over the period, except perhaps
for some evidence of relatively fewer very low pass internal marks. Moreover the distributions
for private schools (not reported but available upon request) are again very similar except
that internal grades tend to follow a more uniform distribution in those schools.
4 Results
We estimate the effects of the introduction of performance-related pay from DID models
of student grade equations. Our identification assumption is that there is no effect upon
13

achievement specific to public schools (in the continent) with respect to the control group
from the 2006/07 school year onwards other than anything that results from the education
reform. Specifically, in the case of our first control group, schools located in the Azores and
Madeira, we estimate equations as follows:
yijt = β0 + β1Continentj + β2Aftert + β3Continentj ×Aftert + uijt. (1)
Depending on the specification, yijt denotes the logarithm of the grade (internal or exter-
nal) of the student-exam pair i in school j in year t. Alternatively, the dependent variable
is a measure of grade inflation, namely the difference between the internal and the external
grade of the same student-exam pair (a triple differences specification) or a dummy variable
taking value one if the internal grade exceeds the external grade.
Our analysis of different nonlinear functions of grade inflation also serves a useful ro-
bustness purpose. Indeed, if there are other relevant interaction effects that break down the
identification assumption, our results are less likely to hold across different dependent vari-
ables. More important, the triple-difference specification is based on a weaker identifying
assumption: it simply requires that there are no shocks that affect the relative outcomes of
the treatment group in the same years as the education reform.
In all cases, Continentj is a dummy variable with value one if school j is located in main-
land, continental Portugal (henceforth the continent): this variable will pick up permanent
differences in terms of the dependent variable between those schools located in the continent
and those located in the Azores or Madeira. Aftert is another dummy variable, with value
one if year t is 2007 (i.e. school year 2006-2007) or later, the period when the incentives
reforms was in force, as discussed in Section 2: this variable will pick up across-the-board
differences between the period before the intervention and the period after the intervention.
This is important particularly in the case of national grades, as their standards may have
varied over time.
Finally, Continentj ×Aftert is the product of the two previous dummy variables and its
parameter, β3, is the object of interest in this paper. Its estimate will pick up the effect of the
education reforms upon student achievement or grade inflation, i.e. any additional difference
between the two types of schools that emerges after the intervention.
From the benchmark specification in equation 1, we consider three extended versions with
14
different additional controls. The first version includes controls for school size (the total
number of exams sat in each year) and regions (distritos, or up to 20 fixed effects). The
second specification includes school size and school fixed effects. Finally, the third additional
specification includes school size and school-exam fixed effects. Because the structure of exams
changes over the period, we focus on a subset of four of the most important topics covered in
these tests: Portuguese, Maths, Biology, and Physics/Chemistry. Importantly, all models are
estimated with robust standard errors, allowing for clustering at the school level.
The first set of results, based on internal grades, are presented in Table 2 (top panel).
These results draw on the student-level data described in Table 1, except that private schools
are dropped. Across all four specifications, we find negative point estimates, indicating that
the levels of achievement of public schools in the continent fell with respect to public schools
in the Azores and Madeira after the introduction of the incentives reform. The magnitude of
the estimates is very similar across the specifications, but also very small, ranging from -.006
to -.007, or about one seventh of the standard deviation of the dependent variable. On the
other hand, the statistical significance of the coefficients is poor, as it does not meet the 5%
threshold.
However, when we turn to Table 3 (top panel), which presents similar specifications but
considering external grades instead, we find much higher effects, ranging from -.044 to -.064.
These correspond to almost half of a standard deviation of the log average grade across schools.
In addition, all estimates here are also significant, even at the .1% level. The comparison of
the two sets of results (internal and external grades) therefore indicates that while national-
exam results of public schools in the continent fall significantly and by a meaningful size with
respect to the same change for public schools in the Azores and Madeira, the equivalent effect
for internal marks is insignificant.9
The contrast between the internal and external results suggests that grade inflation in
the public schools in the continent is a presumably unintended consequence of the reform.
Indeed, our triple-difference estimates - see Table 4 (top panel) - indicate precisely that. We
find that the average gap between internal and external marks increases by .271 to .352 (or
about one third of a standard deviation of the average gap) in public schools in the continent
with respect to their counterparts in the Azores and Madeira. In all cases the coefficients are9We also find, both in Table 2 and in Table 3, that the isolated After coefficients are always significantly
positive, suggesting a trend towards higher marks, particularly in national exams.
15
significant at the 5% level.
Similarly, we also find evidence that the probability of grade inflation increases in the
continent with respect to the Azores and Madeira - see Table 5 (top panel). The fact that
these estimates are relatively small (at .02, although almost all significant at the 5% level
and some at the 1% level) indicates that the grade inflation effects were felt mostly along the
intensive margin, i.e. increased inflation in schools that already tended to exhibit inflation.
This is related to the limited room for expansion along the extensive margin, as only 14%
of the marks exhibit ‘deflation’ and only 23% of the marks are the same at the internal and
external levels (when defining an equality as an absolute difference of less than .5).
4.1 Private schools
We now turn to our second and complementary control group. Although private schools on
average tend to exhibit better results in terms of the academic achievement of their students
when compared to public schools (because of a selection process or better academic practices
or some combination of the two), our DID approach will control for permanent differences in
achievement between the two types of schools.
Similarly to the case of the first control group (equation 1), here we estimate the following
DID specification:
yijt = β′0 + β
′1Publicj + β
′2Aftert + β
′3Publicj ×Aftert + uijt, (2)
All variables take the same interpretation as before; Publicj is a dummy variable with
value one if school j is a State school; and β′3 is now the parameter of interest. All models in
this section are estimated with the full set of student-level data described in Table 1, except
that schools located in the Azores and Madeira islands (public or private) are dropped.
Table 2 (bottom panel) presents the results for internal grades. In contrast to the case when
the public schools in Azores and Madeira served as the control group, we find here evidence
that the introduction of the individual teacher incentives had a significant detrimental effect
on student achievement. In the present case, the coefficients range from -.020 to -.029, or
about three times as much as in the equivalent specification under the first control group, and
are always statistically significant, even at the .1% level.
In terms of the external grade results, we find that achievement in public schools, when
16
compared to private schools, falls by between -.052 to -.070, and is again always significant
at the .1% level - see Table 3 (bottom panel). The magnitude of these effects corresponds to
about one third to one half of a standard deviation of external results. The increase in the
magnitude of these estimates when compared to the results based on public schools in the
islands is consistent with the intermediate intensity level of the treatment there, as discussed
in Section 2.
Finally, the importance of grade inflation suggested from the stronger effects on external
grades when compared to internal grades, is once again corroborated from the triple-difference
results. In Table 4 (bottom panel), we find that grade inflation increases by between .206 to
.291 across the four specifications considered there, all of which are significant at least at the
5% level. Moreover, similar results to those of the first control group are found for the grade
inflation probability variable too (Table 5, bottom panel). This is reassuring as it is evidence
against interaction effects between the possibly evolving difficulty level of the national exams
and any ability differences between students in treatment and control groups. If, for instance,
national exams get easier when the reform is introduced (as suggested from the analysis of
the raw data) and if high-ability private-school students also respond better to such possibly
easier exams, then this could generate misleading evidence of relatively lower achievement in
public schools. The results would also suggest higher grade inflation in public schools to the
extent that the internal results do not change at the same time (as, again, may be the case
from the analysis of the raw data). However, the extensive margin results presented above
are evidence of increasing grade inflation across the board, not only for high-ability students.
Moreover, our findings of lower achievement and higher inflation also arise when focusing on
public schools in the islands, where the ability interaction argument presumably does not
apply.
Overall, the results suggest strongly that the onset of individual teacher incentives led to
a decrease in student achievement (when measured by national exams) and an increase of
grade inflation. According to our theoretical discussion, these empirical results are consistent
with incentives-related disruption in colaborative work in schools, once teachers are facing
tournaments for promotions, and as internal (teacher-determined) results carry a considerable
weight in final marks, thus enhancing a teacher’s chances of promotion.
17
5 Robustness
5.1 Common trends
One important test of the strength of a causal interpretation of DID estimates concerns
common trends. Indeed, if there are no interactions between treatment and other variables,
as assumed for identification purposes, one would expect parallel movement between the
treatment and control groups before the treatment began. We conduct this test here by
considering more flexible versions of equations 1 and 2. Specifically, we allow the difference
in the outcomes between treatment and control groups to vary during the period prior to the
intervention. If our earlier estimates are indeed capturing a causal effect, then we expect that
there will be no statistically significant differences between the two groups until the occurrence
of the treatment. Moreover, we also allow the effect of the education reform to vary over the
After period. This serves as another robustness test, as it allows us to investigate any
cumulative effects of the reform.
In this context, the first equation we estimate is as follows:
yijt = α0 +α1Continentj +2009∑
k=2003
δkI(yeart = k) +2009∑
k=2003
γkContinentj × I(yeart = k) +uijt.
(3)
All variables have the same meaning as before; and I() is the indicator function. The
parameters of interest are now the γk (k=2003, ..., 2009), which will indicate any differences
in the yearly effects of the treatment group with respect to the benchmark year (2002). As
before, we consider specifications without any controls (column 1) or with school or school-
exam fixed effects (columns 2 and 3, respectively).
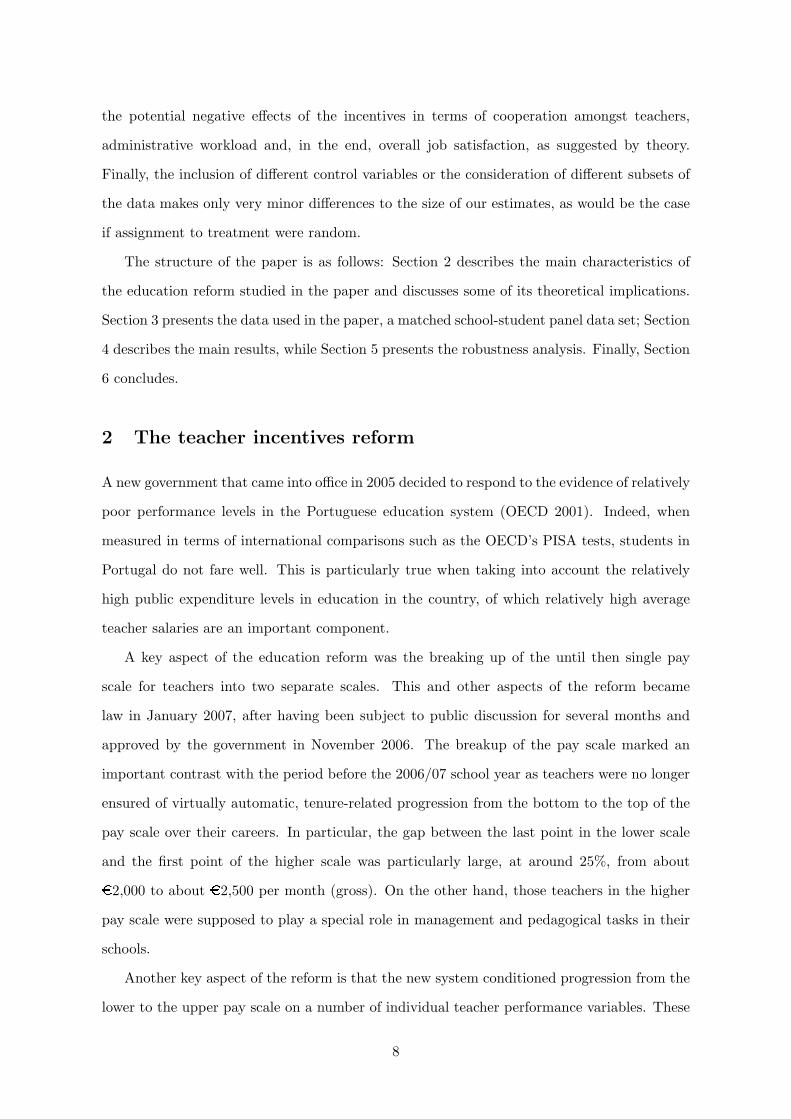
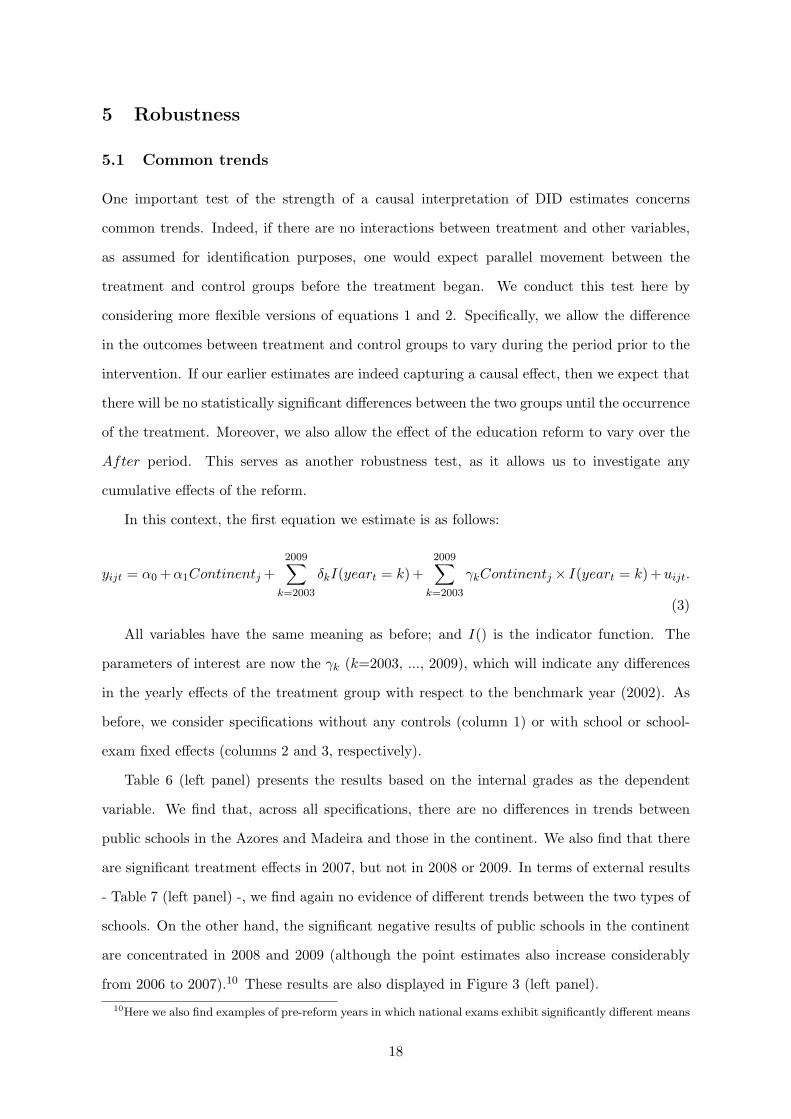
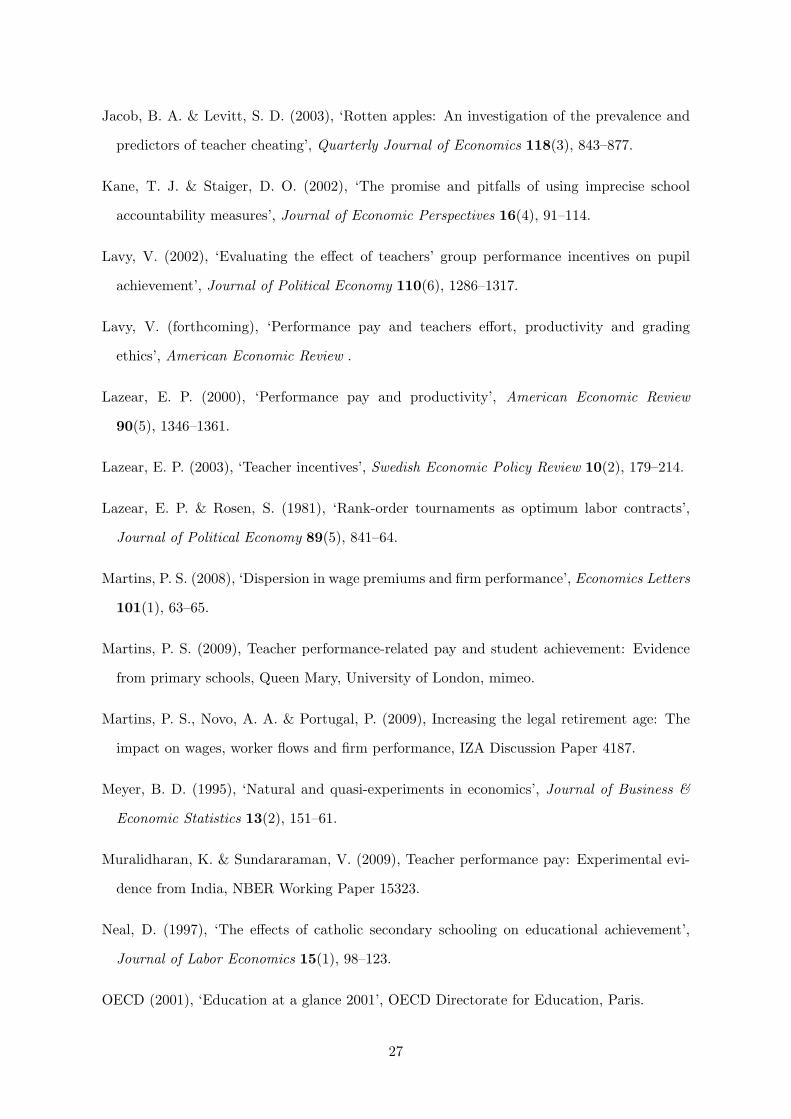
Table 6 (left panel) presents the results based on the internal grades as the dependent
variable. We find that, across all specifications, there are no differences in trends between
public schools in the Azores and Madeira and those in the continent. We also find that there
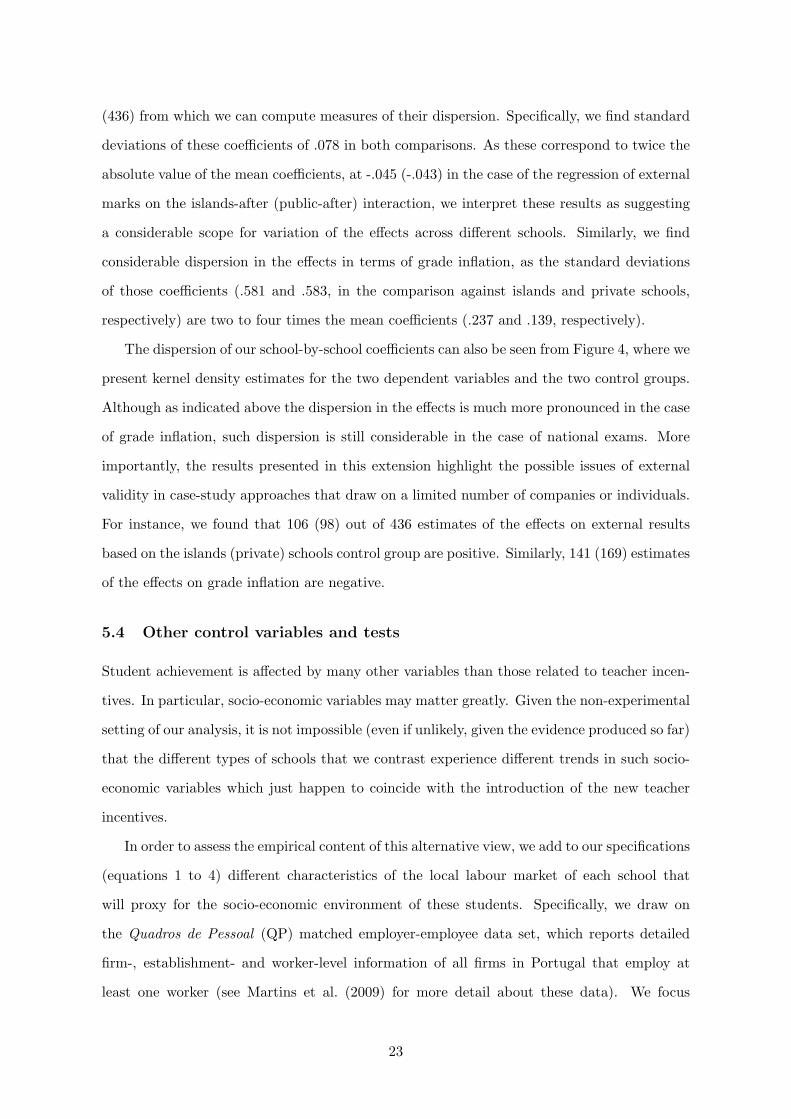
are significant treatment effects in 2007, but not in 2008 or 2009. In terms of external results
- Table 7 (left panel) -, we find again no evidence of different trends between the two types of
schools. On the other hand, the significant negative results of public schools in the continent
are concentrated in 2008 and 2009 (although the point estimates also increase considerably
from 2006 to 2007).10 These results are also displayed in Figure 3 (left panel).10Here we also find examples of pre-reform years in which national exams exhibit significantly different means
18

The analysis of grade inflation is again consistent with the earlier findings. Table 8 (left
panel) indicates no systematic differences between the two types of schools until 2008, when
grade inflation effects jump in magnitude and become statistically significant in all cases
except one. Before that, in 2007, point estimates are already typically higher than before. In
any case, grade inflation jumps even further in 2009, when all effects are significant at least
at the 5% level. (The results on the grade inflation probability are again similar and are
available upon request.)
Overall, we regard these results are supportive of a causal interpretation of our main find-
ings. Furthermore, the cumulative nature of the effects is also consistent with the cumulative
nature of the reform, in the sense that the cohorts that take their exams later (in 2008 rather
than in 2007, for instance) are also typically cohorts that have been exposed to the treatment
for a longer period. The relative consistency of the effects on the external marks over the
‘after’ period in both control groups is also evidence against any possible one-off disruption
across public schools or amongst their teachers that coincided with exam time, even if we are
unaware of any example of such an event.11
We also test the common trends assumption (and the cumulativeness of the effects) in
terms of the public vs private schools comparison:
yijt = α′0 + α
′1Publicj +
2009∑k=2003
δkI(yeart = k) +2009∑
k=2003
γ′kPublicj × I(yeart = k) + uijt. (4)
Here we generally find evidence of no statistically significant differences during the before
period for all three variables considered and across the three specifications estimated for each
variable - see the right panels of Tables 6 and 7 (and of Figure 3) for the results on internal
and external marks and of Table 8 for the results on grade inflation. The only exception to
this pattern is some evidence of lower external results and higher inflation in 2004 and 2005.
However, those point estimates are generally quite smaller than their 2007, 2008 and 2009
counterparts. Moreover, without exception, all point estimates in 2008 or 2009 are bigger (in
absolute terms) than in 2007 (even if their differences are typically not statistically significant),
but without correspondence in terms of a differential effect between continent and islands school. This is furtherevidence against a spurious relationship driven by interactions between student ability and exam difficulty.
11The results indicate a time gap between the effects on internal marks (which are circumscribed to 2007)and to the effects on external marks (2008 and 2009). This time gap could result from teachers learning how toplay the tournament by inflating internal marks, of which there is only evidence in 2008 and 2009. Alternativelyor complementarily, the time gap in these effects could be a consequence of the fact that external marks reflectthe learning of students over a three-year period while internal marks can be adjusted quickly by teachers.
19
which we take as further evidence of cumulative effects of the reform.
5.2 Early retirement
According to our theoretical discussion, the negative effects upon student achievement docu-
mented above would be driven by a combination of decreased cooperation amongst teachers
and increased administrative workloads, both of which would shift resources away from teach-
ing with a potentially detrimental effect upon student learning. Another likely consequence
of less cooperation and more administration would be increased job dissatisfaction.
This subsection offers some indirect evidence about the importance of these mechanisms,
by studying the effects of a recent early retirement law that applied to all public servants
in Portugal. The retirement law we exploit here (Law 11/2008) was introduced in February
2008 and allowed workers in all branches of the public sector to retire before the statutory
retirement age of 61.5 (and at least 33 years of service). (See Martins et al. (2009) and the
references there for more on the Portuguese retirement law.) However, public servants that
took early retirement faced a hefty penalty of 4.5% of their final (defined-benefit) pension per
each year of early retirement.
We exploit this additional reform to argue that if the new teacher incentives decreased
both job satisfaction (because of the above-mentioned cooperation and administrative effects)
and student achievement, then, ceteris paribus, the take-up of early retirement made possible
by the 2008 law will be higher in schools where student achievement fell the most.12 We then
test this hypothesis by merging the JNE data with information on the number of retirements
by school that ocurred after the early retirement law was introduced and assessing the extent
to which schools with a greater proportion of retirements are also schools where student
achievement falls the most.
Our data comes from the monthly lists of public-sector retirements which are published
by the agency responsible for handling the retirements of public servants, CGA (Caixa Geral
de Pensoes). The data include information about the ministry and establishment where the
retiree last worked and the retiree’s pension.13 We then computed the ratio between the
total number of teachers and the total number of non-teachers that retired over the March
2008-August 2009 period, in each public school. The information about non-teachers (mostly12See Green & Heywood (2008) for a study of the correlation between performance pay and job satisfaction.13These data are again freely available, at http://www.cga.pt/listamensalDR.asp (in Portuguese).
20
administrative staff but also guards, cooks, janitors, etc) is useful as it serves as a control for
other variables that may affect the number of teacher retirements per school, including school
size and the school staff age distribution, and it should not be subject to the job dissatisfaction
effects that may have applied to teachers (the structure of incentives did not change for other
workers than teachers).
According to our discussion above, we take this ratio between teacher retirements and
non-teacher retirements in each school as a proxy of the likely disruption effect from the
introduction of teacher incentives. However, given that the data does not discriminate between
early and normal retirements, the retirement ratio we use will be subject to measurement error.
On the other hand, one should be able to rule out other problems including some forms of
reverse causality. For instance, results up to 2008 should not be affected by any impacts on
student achievement driven by the teachers’ early retirement as we are studying achievement
effects that typically occur before the early retirements: not only we examine achievement
data that in part covers a period before the retirement law was is force as there are also lags
between the publication of the retirement lists and the actual retirement of the teacher.14
After we merge the retirement data with our main JNE data on student achievement
by school, we find a total of 2,831 retirees (teachers and non-teachers) across the 279 public
schools for which we have at least one retirement (several schools could not be matched because
their names were not the same on the JNE and CGA data sets). We obtain a mean of 7.57
(2.58) teacher (non-teacher) retirements per school and a mean .699 teacher/all retirees ratio.
Moreover, the mean pension of teachers is �2,147 (standard deviation �232) while the mean
pension of non-teachers is �634 (standard deviation �183). Both values are already net of
any early-retirement cuts that may have applied.
Finally, we split public schools into ‘high’ and ‘low’ teacher retirement ratios groups.
According to our discussion, the former schools are the ones that are likely to have suffered
most from increased cooperation breakdown and administrative workload effects according to
our hypothesis. As mentioned in Section 2, compliance with the incentives reform was not
uniform across public schools. Such heterogeneity in compliance may explain variability in
retirement ratios as it will have generated different drops in teacher cooperation and different14However, results from 2009 will reflect in part the teacher composition effects generated by both the
incentives and early retirement reforms. Given the evidence presented above, such composition effects will notnecessarily be positive, in contrast to earlier research (Lazear 2000, 2003).
21
increases in administrative workloads.
Specifically, we create a dummy variable equal to one if the teacher retirement ratio in
each school is greater than the 66th percentile of the distribution of the teacher retirement
ratio (.82) and equal to zero if the same ratio is less than the 33rd percentile of the same
distribution (.68). Students in schools with retirement ratios between the 33th and 66th
percentiles are excluded from the analysis to ensure a greater contrast between the two types
of schools given the noise in our measurement of early retirement. We then contrast the levels
of student achievement and grade inflation before and after the introduction of the reform
and across the two types of public schools, following again the structure of equation 1 and
considering, alternatively, the same three main dependent variables.
We find from these specifications results that are reasonably similar to our benchmark
results - see Table 9 (top panel). In particular, public schools that exhibit higher teacher
retirement ratios in 2008/09 (after the early retirement law was in force) also display declines
in student achievement (columns 1 to 3) and increases in grade inflation (columns 4 to 6) but
no effects upon internal marks (not reported). This is particularly the case when controlling
for school-subject fixed effects (columns 3 and 6), where the estimates are significant at least at
the 1% level. We find similar qualitative results (available upon request) for different cut-offs
between ‘high’- and ‘low’-retirement ratios. The same applies when also taking into account
the retirement pension by adding an extra interaction effect. In this specification, we find
that the lower the teachers’ pension - which at least in part will be reflect early retirement
cuts -, the more likely student achievement to fall and grade inflation to increase.
5.3 School-by-school analysis
In Section 1 we highlighted some concerns about external validity that have been directed
towards case-study experimental settings. Here we revisit this issue by seeking to understand
the dispersion of our estimates across different treatment schools. In particular, we reestimate
equations 1 and 2, including school fixed effects and a control for the number of exams in
each school-year (as in column 3 of Tables 3 and 4). We then compare each continental
public school separately against either all public island schools or all private schools. We also
consider both the external exam result or the grade inflation measure.
This approach generates as many DID estimates as the number of treatment-group schools
22
(436) from which we can compute measures of their dispersion. Specifically, we find standard
deviations of these coefficients of .078 in both comparisons. As these correspond to twice the
absolute value of the mean coefficients, at -.045 (-.043) in the case of the regression of external
marks on the islands-after (public-after) interaction, we interpret these results as suggesting
a considerable scope for variation of the effects across different schools. Similarly, we find
considerable dispersion in the effects in terms of grade inflation, as the standard deviations
of those coefficients (.581 and .583, in the comparison against islands and private schools,
respectively) are two to four times the mean coefficients (.237 and .139, respectively).
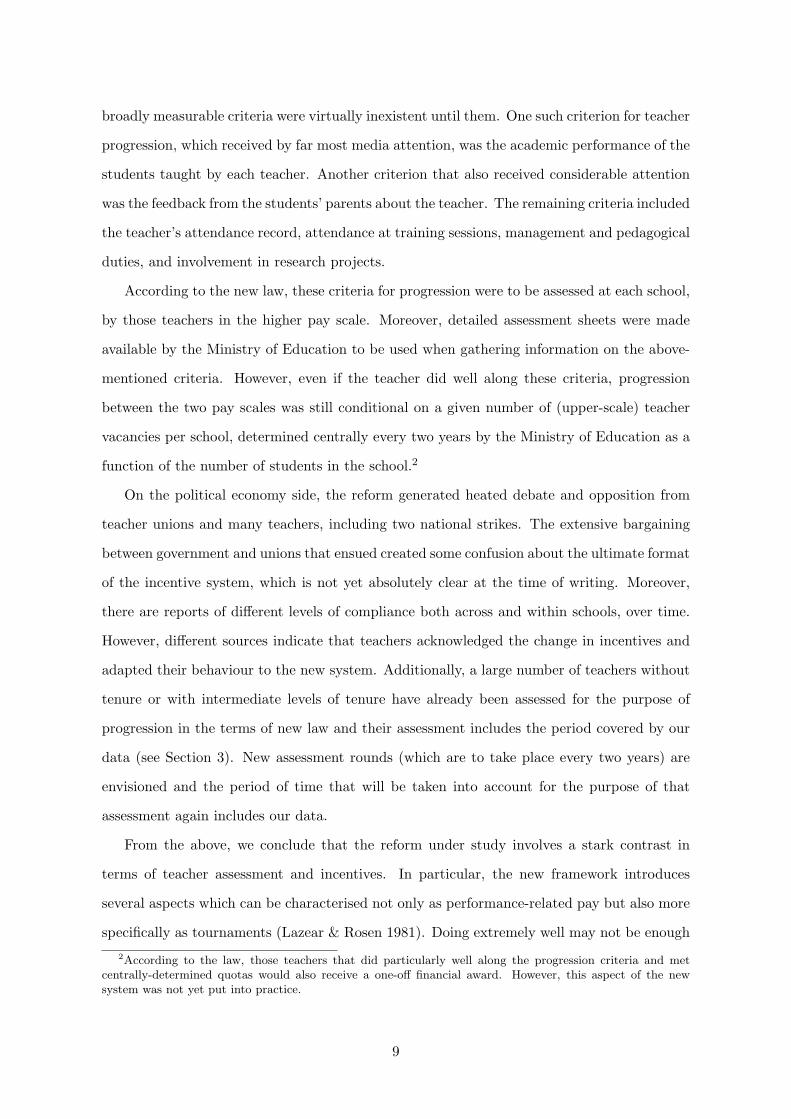
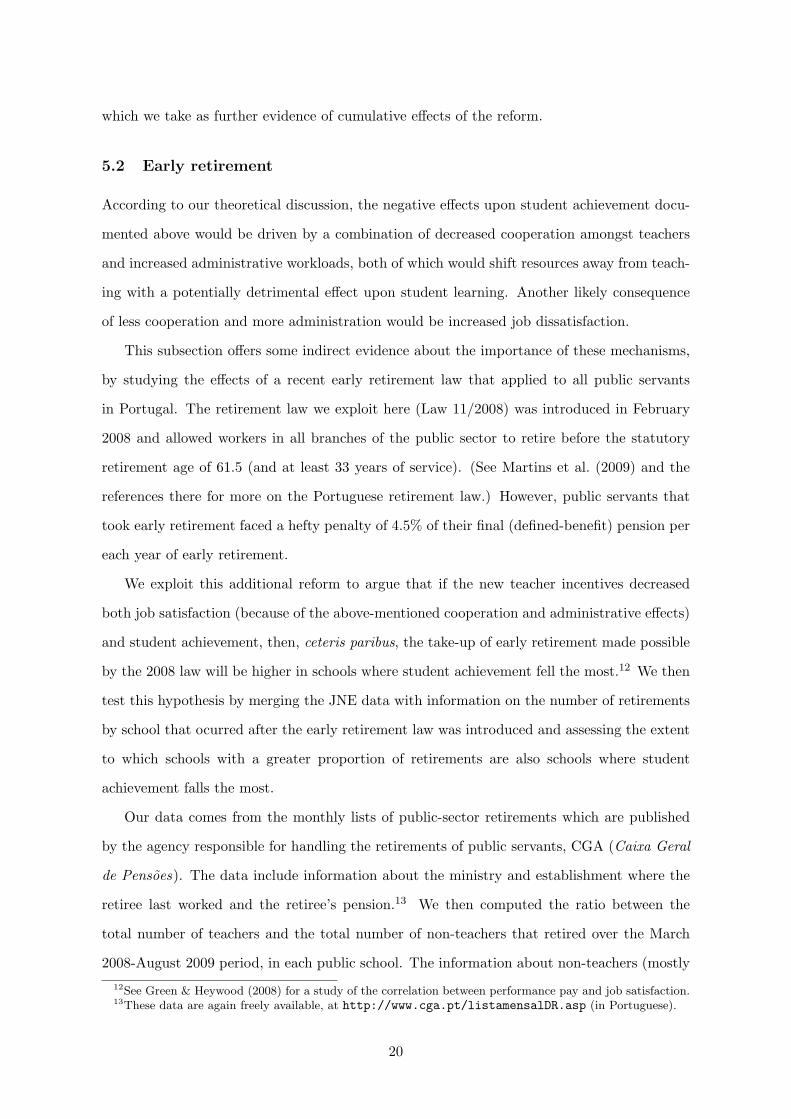
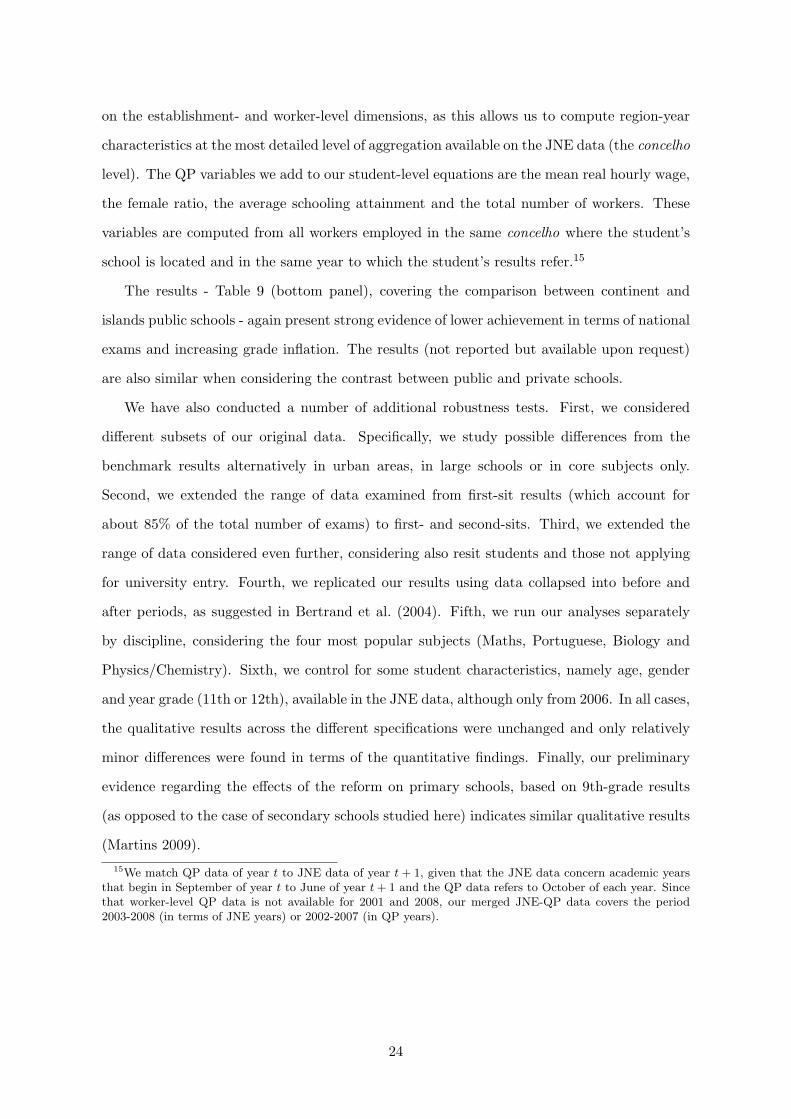
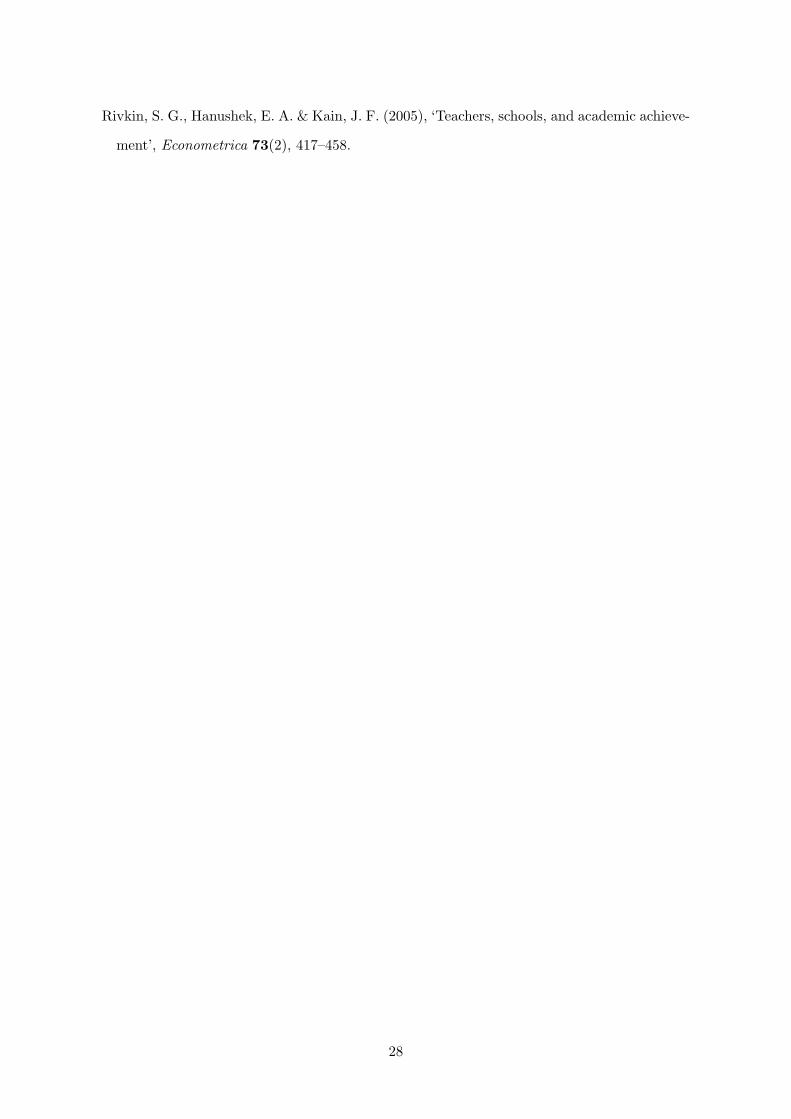
The dispersion of our school-by-school coefficients can also be seen from Figure 4, where we
present kernel density estimates for the two dependent variables and the two control groups.
Although as indicated above the dispersion in the effects is much more pronounced in the case
of grade inflation, such dispersion is still considerable in the case of national exams. More
importantly, the results presented in this extension highlight the possible issues of external
validity in case-study approaches that draw on a limited number of companies or individuals.
For instance, we found that 106 (98) out of 436 estimates of the effects on external results
based on the islands (private) schools control group are positive. Similarly, 141 (169) estimates
of the effects on grade inflation are negative.
5.4 Other control variables and tests
Student achievement is affected by many other variables than those related to teacher incen-
tives. In particular, socio-economic variables may matter greatly. Given the non-experimental
setting of our analysis, it is not impossible (even if unlikely, given the evidence produced so far)
that the different types of schools that we contrast experience different trends in such socio-
economic variables which just happen to coincide with the introduction of the new teacher
incentives.
In order to assess the empirical content of this alternative view, we add to our specifications
(equations 1 to 4) different characteristics of the local labour market of each school that
will proxy for the socio-economic environment of these students. Specifically, we draw on
the Quadros de Pessoal (QP) matched employer-employee data set, which reports detailed
firm-, establishment- and worker-level information of all firms in Portugal that employ at
least one worker (see Martins et al. (2009) for more detail about these data). We focus
23
on the establishment- and worker-level dimensions, as this allows us to compute region-year
characteristics at the most detailed level of aggregation available on the JNE data (the concelho
level). The QP variables we add to our student-level equations are the mean real hourly wage,
the female ratio, the average schooling attainment and the total number of workers. These
variables are computed from all workers employed in the same concelho where the student’s
school is located and in the same year to which the student’s results refer.15
The results - Table 9 (bottom panel), covering the comparison between continent and
islands public schools - again present strong evidence of lower achievement in terms of national
exams and increasing grade inflation. The results (not reported but available upon request)
are also similar when considering the contrast between public and private schools.
We have also conducted a number of additional robustness tests. First, we considered
different subsets of our original data. Specifically, we study possible differences from the
benchmark results alternatively in urban areas, in large schools or in core subjects only.
Second, we extended the range of data examined from first-sit results (which account for
about 85% of the total number of exams) to first- and second-sits. Third, we extended the
range of data considered even further, considering also resit students and those not applying
for university entry. Fourth, we replicated our results using data collapsed into before and
after periods, as suggested in Bertrand et al. (2004). Fifth, we run our analyses separately
by discipline, considering the four most popular subjects (Maths, Portuguese, Biology and
Physics/Chemistry). Sixth, we control for some student characteristics, namely age, gender
and year grade (11th or 12th), available in the JNE data, although only from 2006. In all cases,
the qualitative results across the different specifications were unchanged and only relatively
minor differences were found in terms of the quantitative findings. Finally, our preliminary
evidence regarding the effects of the reform on primary schools, based on 9th-grade results
(as opposed to the case of secondary schools studied here) indicates similar qualitative results
(Martins 2009).15We match QP data of year t to JNE data of year t + 1, given that the JNE data concern academic years
that begin in September of year t to June of year t + 1 and the QP data refers to October of each year. Sincethat worker-level QP data is not available for 2001 and 2008, our merged JNE-QP data covers the period2003-2008 (in terms of JNE years) or 2002-2007 (in QP years).
24
6 Conclusions
There is great interest in understanding the potential of teacher incentives to improve student
achievement. This paper sheds light into this question by examining the recent introduction
of performance-related pay in all public schools in Portugal. Our approach is based on a
difference-in-differences analysis drawing on two complementary control groups. These control
groups either were exposed to a lighter version of the intervention (the case of public schools in
the Azores and Madeira) or were not exposed at all (the case of private schools). All students
in all schools were administered the same national exams.
Our results consistently indicate that the increased focus on individual teacher perfor-
mance caused a significant and sizable relative decline in student achievement, as measured
by national exams. However, the decline in achievement is smaller or virtually zero when con-
sidering those marks set by teachers, suggesting an increasing importance of grade inflation.
This view is supported by our triple-difference evidence and is consistent with the emphasis
placed by the new promotion criteria on student results. Furthermore, we find additional sup-
port for a causal interpretation of our results from our analysis of common trends, robustness
to different control variables, different data subsets and different aggregation levels. Finally,
the analysis of teacher early retirement across public schools supports the theoretical mech-
anisms (and much anecdotal evidence) that predict the empirical results, namely disruption
of teacher cooperation created by tournaments for promotions and increased administrative
workloads, both resulting in job dissatisfaction.
On a methodological note, our use of official population data should ensure greater relia-
bility in terms of the external validity of the findings (as suggested from our school-by-school
analysis) and other potential problems such as measurement bias and Hawthorne effects. On
the other hand, it is possible that our analysis is picking up implementation problems that
may generally tend to erode over time. However, here we examine a period of up to three years
after the reform was introduced, which is longer than most other related studies. Moreover,
we find negative effects upon achievement that get bigger over time.
While our results are not optimistic in terms of the value of the specific reform examined
here, the findings are reassuring in that they indicate that teachers respond to incentives
in a predictable way. In this context, we believe that future research should move from the
broad issue of whether performance-related pay has positive or negative effects to the narrower
25
but in our view more illuminating question of which specific performance-related pay setups
generate the best results for students. Barlevy & Neal (2009) is a recent theoretical example
of this approach, focusing on collective teacher incentives.
References
Aaronson, D., Barrow, L. & Sander, W. (2007), ‘Teachers and student achievement in the
Chicago public high schools’, Journal of Labor Economics 25, 95–135.
Atkinson, A., Burgess, S., Croxson, B., Gregg, P., Propper, C., Slater, H. & Wilson, D.
(2009), ‘Evaluating the impact of performance-related pay for teachers in England’, Labour
Economics 16(3), 251–261.
Bandiera, O., Barankay, I. & Rasul, I. (2005), ‘Social preferences and the response to incen-
tives: Evidence from personnel data’, Quarterly Journal of Economics 120(3), 917–962.
Barlevy, G. & Neal, D. (2009), Pay for percentile, IZA Discussion Paper 4383.
Bertrand, M., Duflo, E. & Mullainathan, S. (2004), ‘How much should we trust differences-
in-differences estimates?’, Quarterly Journal of Economics 119(1), 249–275.
European Commission (2007), The education system in Portugal, Eurybase report.
Fehr, E. & Schmidt, K. M. (1999), ‘A theory of fairness, competition, and cooperation’,
Quarterly Journal of Economics 114(3), 817–868.
Fehr, E. & Schmidt, K. M. (2004), ‘Fairness and incentives in a multi-task principal-agent
model’, Scandinavian Journal of Economics 106(3), 453–474.
Figlio, D. N. & Kenny, L. W. (2007), ‘Individual teacher incentives and student performance’,
Journal of Public Economics 91(5-6), 901–914.
Glewwe, P., Ilias, N. & Kremer, M. (2003), Teacher incentives, NBER Working Paper 9671.
Green, C. & Heywood, J. S. (2008), ‘Does performance pay increase job satisfaction?’, Eco-
nomica 75(300), 710–728.
Jacob, B. A. & Lefgren, L. (2008), ‘Can principals identify effective teachers? Evidence on
subjective performance evaluation in education’, Journal of Labor Economics 26, 101–136.
26
Jacob, B. A. & Levitt, S. D. (2003), ‘Rotten apples: An investigation of the prevalence and
predictors of teacher cheating’, Quarterly Journal of Economics 118(3), 843–877.
Kane, T. J. & Staiger, D. O. (2002), ‘The promise and pitfalls of using imprecise school
accountability measures’, Journal of Economic Perspectives 16(4), 91–114.
Lavy, V. (2002), ‘Evaluating the effect of teachers’ group performance incentives on pupil
achievement’, Journal of Political Economy 110(6), 1286–1317.
Lavy, V. (forthcoming), ‘Performance pay and teachers effort, productivity and grading
ethics’, American Economic Review .
Lazear, E. P. (2000), ‘Performance pay and productivity’, American Economic Review
90(5), 1346–1361.
Lazear, E. P. (2003), ‘Teacher incentives’, Swedish Economic Policy Review 10(2), 179–214.
Lazear, E. P. & Rosen, S. (1981), ‘Rank-order tournaments as optimum labor contracts’,
Journal of Political Economy 89(5), 841–64.
Martins, P. S. (2008), ‘Dispersion in wage premiums and firm performance’, Economics Letters
101(1), 63–65.
Martins, P. S. (2009), Teacher performance-related pay and student achievement: Evidence
from primary schools, Queen Mary, University of London, mimeo.
Martins, P. S., Novo, A. A. & Portugal, P. (2009), Increasing the legal retirement age: The
impact on wages, worker flows and firm performance, IZA Discussion Paper 4187.
Meyer, B. D. (1995), ‘Natural and quasi-experiments in economics’, Journal of Business &
Economic Statistics 13(2), 151–61.
Muralidharan, K. & Sundararaman, V. (2009), Teacher performance pay: Experimental evi-
dence from India, NBER Working Paper 15323.
Neal, D. (1997), ‘The effects of catholic secondary schooling on educational achievement’,
Journal of Labor Economics 15(1), 98–123.
OECD (2001), ‘Education at a glance 2001’, OECD Directorate for Education, Paris.
27
Rivkin, S. G., Hanushek, E. A. & Kain, J. F. (2005), ‘Teachers, schools, and academic achieve-
ment’, Econometrica 73(2), 417–458.
28
Figures
Figure 1: Internal and external grades across groups and time9
1011
1213
14M
ean
grad
e
2002 2003 2004 2005 2006 2007 2008 2009Year
Internal/Treated External/TreatedInternal/Islands External/IslandsInternal/Private External/Private
Source: Author’s calculations based on JNE data. Mean internal and external marks of students by year and type ofschool (public schools in continental Portugal - ‘treated’; public schools in the Azores and Madeira - ‘islands’; and
private schools in continental Portugal - ‘private’). The vertical dashed line indicates the introduction of the teacherincentives reform.
29

Figure 2: Distribution of grades: Islands and Continent, 2005 and 2009
0.0
5.1
.15
.2
0 5 10 15 20
Internal External
Continental schools, 2005
0.0
5.1
.15
.2
0 5 10 15 20
Internal External
Continental schools, 20090
.05
.1.1
5.2
0 5 10 15 20
Internal External
Island schools, 2005
0.0
5.1
.15
.2
0 5 10 15 20
Internal External
Island schools, 2009
Source: Author’s calculations based on JNE data. The external marks result from kernel estimation.
30
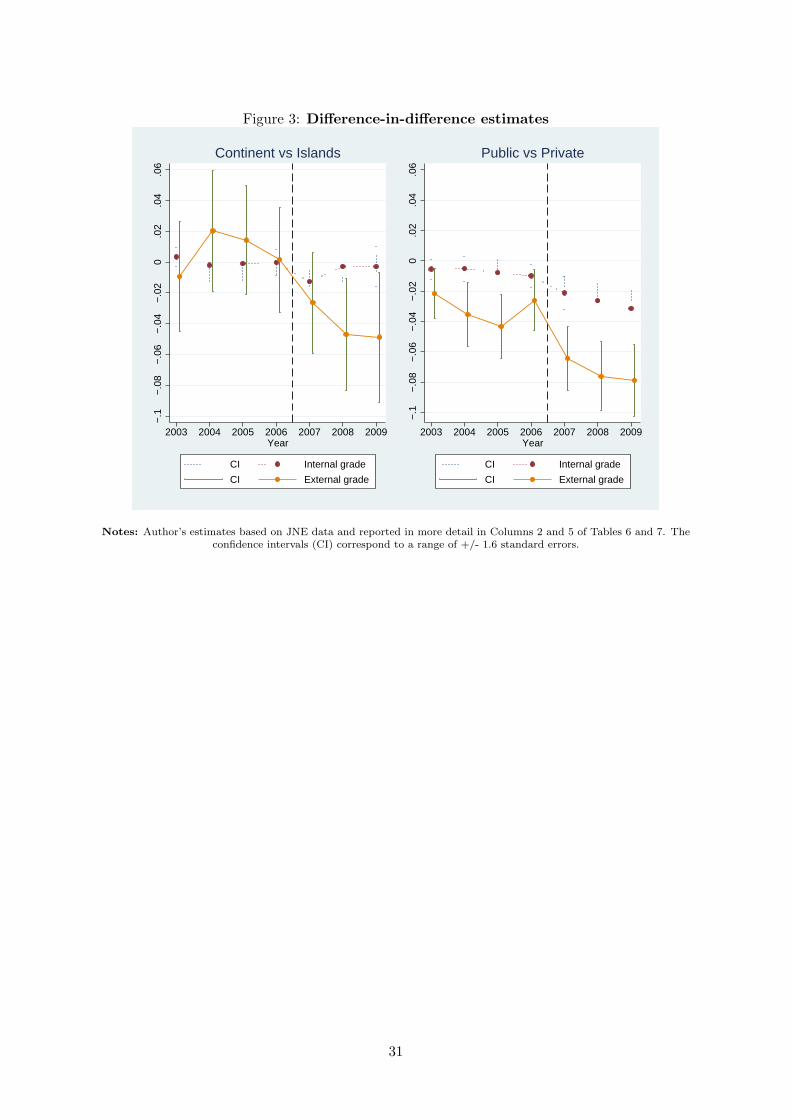
Figure 3: Difference-in-difference estimates
−.1
−.0
8−
.06
−.0
4−
.02
0.0
2.0
4.0
6
2003 2004 2005 2006 2007 2008 2009Year
CI Internal grade
CI External grade
Continent vs Islands
−.1
−.0
8−
.06
−.0
4−
.02
0.0
2.0
4.0
6
2003 2004 2005 2006 2007 2008 2009Year
CI Internal grade
CI External grade
Public vs Private
Notes: Author’s estimates based on JNE data and reported in more detail in Columns 2 and 5 of Tables 6 and 7. Theconfidence intervals (CI) correspond to a range of +/- 1.6 standard errors.
31

Figure 4: School-by-school estimates
02
46
Den
sity
−.4 −.2 0 .2 .4School effects
vs Island S. vs Private S.
National exams
0.2
.4.6
.8D
ensi
ty
−2 −1 0 1 2School effects
vs Island S. vs Private S.
Grade inflation
Notes: Author’s estimates based on JNE data.
32
Tables
Table 1: Descriptive Statistics
Variable Mean Std. Dev. Min. Max.School-level data
Internal Exam 13.265 0.655 10.826 16.639External Exam 10.479 1.255 6.195 16.049Internal - External Exam 2.786 1.023 -3.021 6.323Log Internal Exam 2.567 0.047 2.376 2.802Log External Exam 2.258 0.142 1.593 2.758Public 0.837 0.37 0 1Continent 0.944 0.229 0 1No. Exams 416.942 311.62 4 3152
Exam-level dataInternal Exam 13.337 2.596 10 20External Exam 10.707 3.985 0.1 20Internal - External Exam 2.63 3.123 -10 18.9Log Internal Exam 2.572 0.19 2.303 2.996Log External Exam 2.282 0.465 -2.303 2.996Public 0.889 0.315 0 1Continent 0.949 0.22 0 1No. Exams 648.582 389.117 4 31522002 0.164 0.37 0 12003 0.147 0.354 0 12004 0.107 0.31 0 12005 0.12 0.325 0 12006 0.145 0.352 0 12007 0.099 0.299 0 12008 0.102 0.303 0 12009 0.115 0.32 0 1
Notes: Author’s calculations based on Jurı Nacional de Exames data. Theinternal (external) exam refers to the mark obtained by each student in eachmodule by the school (national exam). ‘Public’ and ‘Continent’ are dummyvariables which are equal to one for students in public schools or schools located inmainland Portugal, respectively. There are 557 schools, all of them observed in alleight years, resulting in 4,456 school-year observations and 1,592,399 exam-levelobservations.
33
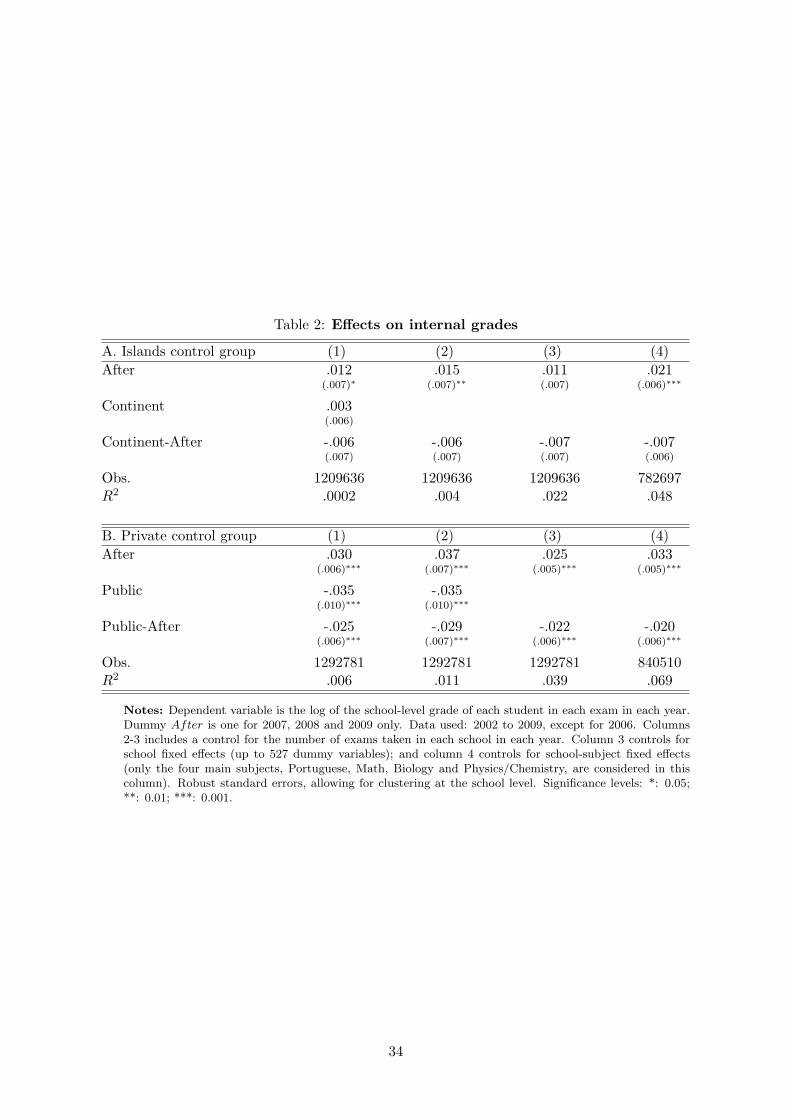
Table 2: Effects on internal grades
A. Islands control group (1) (2) (3) (4)After .012 .015 .011 .021
(.007)∗ (.007)∗∗ (.007) (.006)∗∗∗
Continent .003(.006)
Continent-After -.006 -.006 -.007 -.007(.007) (.007) (.007) (.006)
Obs. 1209636 1209636 1209636 782697R2 .0002 .004 .022 .048
B. Private control group (1) (2) (3) (4)After .030 .037 .025 .033
(.006)∗∗∗ (.007)∗∗∗ (.005)∗∗∗ (.005)∗∗∗
Public -.035 -.035(.010)∗∗∗ (.010)∗∗∗
Public-After -.025 -.029 -.022 -.020(.006)∗∗∗ (.007)∗∗∗ (.006)∗∗∗ (.006)∗∗∗
Obs. 1292781 1292781 1292781 840510R2 .006 .011 .039 .069
Notes: Dependent variable is the log of the school-level grade of each student in each exam in each year.Dummy After is one for 2007, 2008 and 2009 only. Data used: 2002 to 2009, except for 2006. Columns2-3 includes a control for the number of exams taken in each school in each year. Column 3 controls forschool fixed effects (up to 527 dummy variables); and column 4 controls for school-subject fixed effects(only the four main subjects, Portuguese, Math, Biology and Physics/Chemistry, are considered in thiscolumn). Robust standard errors, allowing for clustering at the school level. Significance levels: *: 0.05;**: 0.01; ***: 0.001.
34

Table 3: Effects on external grades
A. Islands control group (1) (2) (3) (4)After .050 .063 .047 .103
(.012)∗∗∗ (.014)∗∗∗ (.014)∗∗∗ (.017)∗∗∗
Continent .115(.019)∗∗∗
Continent-After -.044 -.048 -.048 -.064(.013)∗∗∗ (.015)∗∗∗ (.014)∗∗∗ (.017)∗∗∗
Obs. 1209055 1209055 1209055 782261R2 .002 .015 .044 .117
B. Private control group (1) (2) (3) (4)After .068 .082 .049 .088
(.012)∗∗∗ (.014)∗∗∗ (.011)∗∗∗ (.011)∗∗∗
Public -.030 -.016(.017)∗ (.019)
Public-After -.061 -.070 -.052 -.052(.012)∗∗∗ (.015)∗∗∗ (.012)∗∗∗ (.013)∗∗∗
Obs. 1292162 1292162 1292162 840043R2 .002 .014 .05 .12
Notes: Dependent variable is the log of the national exam grade of each student in each exam in each year.Dummy After is one for 2007, 2008 and 2009 only. Data used: 2002 to 2009, except for 2006. Columns2-3 includes a control for the number of exams taken in each school in each year. Column 3 controls forschool fixed effects (up to 527 dummy variables); and column 4 controls for school-subject fixed effects(only the four main subjects, Portuguese, Math, Biology and Physics/Chemistry, are considered in thiscolumn). Robust standard errors, allowing for clustering at the school level. Significance levels: *: 0.05;**: 0.01; ***: 0.001.
35

Table 4: Effects on grade inflation
A. Islands control group (1) (2) (3) (4)After -.181 -.255 -.176 -.374
(.107)∗ (.117)∗∗ (.118) (.139)∗∗∗
Continent -.916(.129)∗∗∗
Continent-After .271 .301 .305 .352(.111)∗∗ (.120)∗∗ (.119)∗∗ (.141)∗∗
Obs. 1209636 1209636 1209636 782697R2 .004 .018 .049 .16
B. Private control group (1) (2) (3) (4)After -.169 -.223 -.069 -.269
(.096)∗ (.096)∗∗ (.083) (.084)∗∗∗
Public -.159 -.267(.132) (.147)∗
Public-After .259 .291 .206 .260(.100)∗∗∗ (.104)∗∗∗ (.089)∗∗ (.090)∗∗∗
Obs. 1292781 1292781 1292781 840510R2 .0003 .013 .051 .158
Notes: Dependent variable is the difference between the internal (school) grade and the external (nationalexam) grade of each student in each exam in each year. Dummy After is one for 2007, 2008 and 2009 only.Data used: 2002 to 2009, except for 2006. Columns 2-3 includes a control for the number of exams takenin each school in each year. Column 3 controls for school fixed effects (up to 527 dummy variables); andcolumn 4 controls for school-subject fixed effects (only the four main subjects, Portuguese, Math, Biologyand Physics/Chemistry, are considered in this column). Robust standard errors, allowing for clustering atthe school level. Significance levels: *: 0.05; **: 0.01; ***: 0.001.
36
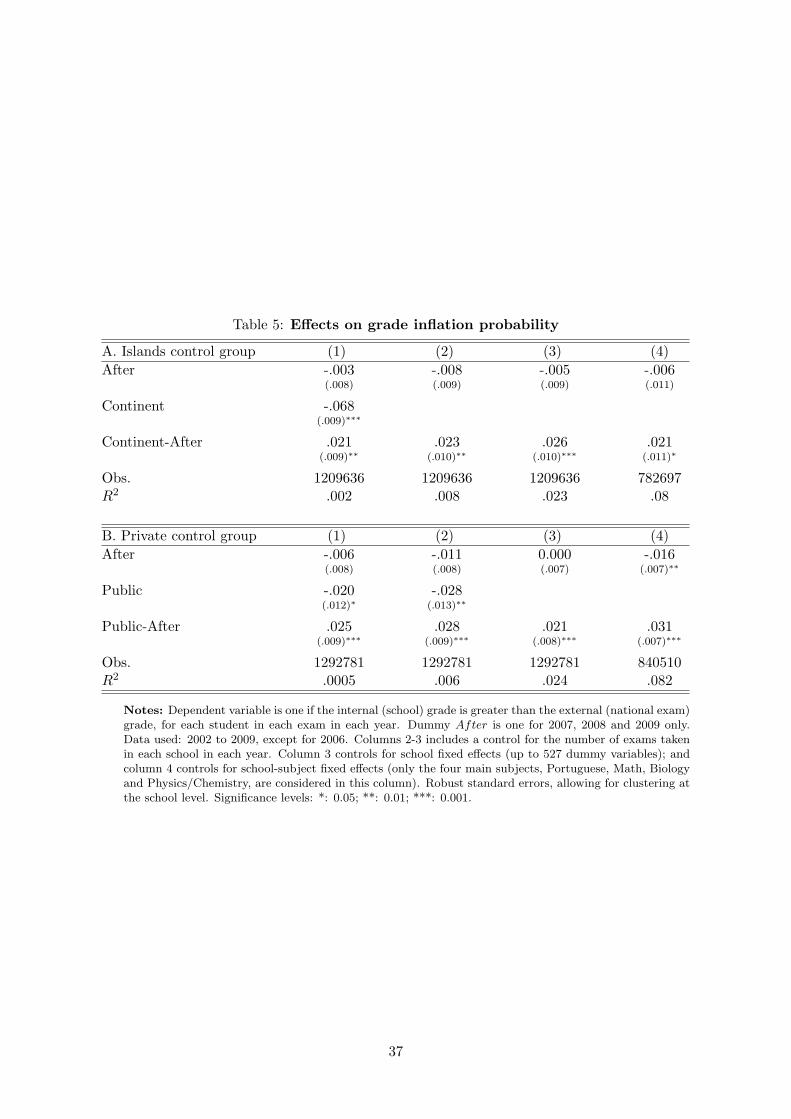
Table 5: Effects on grade inflation probability
A. Islands control group (1) (2) (3) (4)After -.003 -.008 -.005 -.006
(.008) (.009) (.009) (.011)
Continent -.068(.009)∗∗∗
Continent-After .021 .023 .026 .021(.009)∗∗ (.010)∗∗ (.010)∗∗∗ (.011)∗
Obs. 1209636 1209636 1209636 782697R2 .002 .008 .023 .08
B. Private control group (1) (2) (3) (4)After -.006 -.011 0.000 -.016
(.008) (.008) (.007) (.007)∗∗
Public -.020 -.028(.012)∗ (.013)∗∗
Public-After .025 .028 .021 .031(.009)∗∗∗ (.009)∗∗∗ (.008)∗∗∗ (.007)∗∗∗
Obs. 1292781 1292781 1292781 840510R2 .0005 .006 .024 .082
Notes: Dependent variable is one if the internal (school) grade is greater than the external (national exam)grade, for each student in each exam in each year. Dummy After is one for 2007, 2008 and 2009 only.Data used: 2002 to 2009, except for 2006. Columns 2-3 includes a control for the number of exams takenin each school in each year. Column 3 controls for school fixed effects (up to 527 dummy variables); andcolumn 4 controls for school-subject fixed effects (only the four main subjects, Portuguese, Math, Biologyand Physics/Chemistry, are considered in this column). Robust standard errors, allowing for clustering atthe school level. Significance levels: *: 0.05; **: 0.01; ***: 0.001.
37

Table 6: Effects on internal grades, year by year
Treated group: Continent public schools Continent public schoolsControl group: Azores and Madeira schools Private schools
(1) (2) (3) (4) (5) (6)2003 -.008 -.003 .0002 .006 .005 .006
(.006) (.004) (.004) (.004) (.004) (.004)
2004 .0009 .001 .013 .011 .002 .004(.008) (.007) (.007)∗∗ (.006)∗ (.005) (.006)
2005 -.002 -.001 .005 .009 .004 .006(.008) (.008) (.007) (.006)∗ (.005) (.006)
2006 .013 .011 .019 .027 .020 .025(.005)∗∗ (.005)∗∗ (.006)∗∗∗ (.006)∗∗∗ (.004)∗∗∗ (.005)∗∗∗
2007 .015 .014 .031 .036 .020 .031(.005)∗∗∗ (.004)∗∗∗ (.006)∗∗∗ (.007)∗∗∗ (.005)∗∗∗ (.006)∗∗∗
2008 .004 .003 .023 .040 .024 .033(.007) (.007) (.009)∗∗∗ (.008)∗∗∗ (.006)∗∗∗ (.007)∗∗∗
2009 .009 .010 .024 .051 .036 .046(.007) (.008) (.009)∗∗∗ (.009)∗∗∗ (.007)∗∗∗ (.007)∗∗∗
Treated .0005 -.035(.006) (.010)∗∗∗
Treated-2003 .009 .003 .002 -.003 -.005 -.005(.006) (.004) (.005) (.004) (.004) (.005)
Treated-2004 -.0005 -.002 -.006 -.004 -.005 -.0003(.008) (.007) (.007) (.006) (.005) (.006)
Treated-2005 .001 -.001 -.002 -.005 -.008 -.005(.009) (.008) (.007) (.005) (.005) (.006)
Treated-2006 .0004 -.0002 -.001 -.013 -.010 -.008(.005) (.005) (.006) (.006)∗∗ (.005)∗∗ (.006)
Treated-2007 -.011 -.013 -.015 -.025 -.021 -.019(.005)∗∗ (.004)∗∗∗ (.006)∗∗ (.007)∗∗∗ (.007)∗∗∗ (.007)∗∗
Treated-2008 -.001 -.003 -.008 -.030 -.026 -.021(.007) (.007) (.009) (.008)∗∗∗ (.007)∗∗∗ (.008)∗∗
Treated-2009 .0002 -.003 -.003 -.037 -.031 -.028(.008) (.008) (.009) (.008)∗∗∗ (.007)∗∗∗ (.008)∗∗∗
Obs. 1415829 1415829 918573 1512173 1512173 985754R2 .0007 .022 .05 .009 .039 .07
Notes: Dependent variable is the log of the school-level grade of each student in each exam in each year.Columns 2-3 and 5-6 include a control for the number of exams taken in each school in each year. Columns2 and 5 control for school fixed effects (up to 527 dummy variables); and columns 3 and 6 control for school-subject fixed effects (only the four main subjects, Portuguese, Math, Biology and Physics/Chemistry, areconsidered in this column). Robust standard errors, allowing for clustering at the school level. Significancelevels: *: 0.05; **: 0.01; ***: 0.001.
38

Table 7: Effects on external grades, year by year
Treated group: Continent public schools Continent public schoolsControl group: Azores and Madeira schools Private schools
(1) (2) (3) (4) (5) (6)2003 .005 .003 -.040 .009 .014 -.007
(.021) (.022) (.023)∗ (.013) (.010) (.012)
2004 -.058 -.076 -.073 .0004 -.024 -.010(.020)∗∗∗ (.025)∗∗∗ (.030)∗∗ (.016) (.012)∗ (.018)
2005 -.007 -.017 -.034 .054 .037 .043(.018) (.022) (.028) (.014)∗∗∗ (.012)∗∗∗ (.015)∗∗∗
2006 -.059 -.065 -.065 -.018 -.038 -.036(.022)∗∗∗ (.021)∗∗∗ (.028)∗∗ (.016) (.012)∗∗∗ (.014)∗∗
2007 -.040 -.066 -.025 .025 -.032 .006(.018)∗∗ (.020)∗∗∗ (.024) (.019) (.012)∗∗∗ (.014)
2008 .088 .060 .115 .140 .085 .136(.020)∗∗∗ (.023)∗∗∗ (.029)∗∗∗ (.020)∗∗∗ (.013)∗∗∗ (.014)∗∗∗
2009 .071 .051 .102 .129 .078 .112(.020)∗∗∗ (.026)∗ (.032)∗∗∗ (.020)∗∗∗ (.014)∗∗∗ (.016)∗∗∗
Treated .108 -.025(.027)∗∗∗ (.021)
Treated-2003 -.007 -.009 .010 -.005 -.022 -.024(.021) (.022) (.023) (.013) (.010)∗∗ (.013)∗
Treated-2004 .019 .020 .027 -.019 -.035 -.040(.020) (.025) (.030) (.016) (.013)∗∗∗ (.018)∗∗
Treated-2005 .019 .014 .026 -.027 -.043 -.053(.018) (.022) (.028) (.015)∗ (.013)∗∗∗ (.016)∗∗∗
Treated-2006 .007 .002 .003 -.030 -.026 -.028(.023) (.021) (.028) (.017)∗ (.013)∗∗ (.015)∗
Treated-2007 -.025 -.026 -.028 -.070 -.064 -.064(.019) (.021) (.024) (.020)∗∗∗ (.013)∗∗∗ (.015)∗∗∗
Treated-2008 -.048 -.047 -.052 -.080 -.076 -.077(.021)∗∗ (.023)∗∗ (.029)∗ (.021)∗∗∗ (.014)∗∗∗ (.015)∗∗∗
Treated-2009 -.046 -.049 -.074 -.091 -.079 -.087(.021)∗∗ (.026)∗ (.033)∗∗ (.021)∗∗∗ (.015)∗∗∗ (.017)∗∗∗
Obs. 1415164 1415164 918075 1511472 1511472 985227R2 .008 .048 .135 .011 .054 .137
Notes: Dependent variable is the log of the national exam grade of each student in each exam in each year.Columns 2-3 and 5-6 include a control for the number of exams taken in each school in each year. Columns2 and 5 control for school fixed effects (up to 527 dummy variables); and columns 3 and 6 control for school-subject fixed effects (only the four main subjects, Portuguese, Math, Biology and Physics/Chemistry, areconsidered in this column). Robust standard errors, allowing for clustering at the school level. Significancelevels: *: 0.05; **: 0.01; ***: 0.001.
39
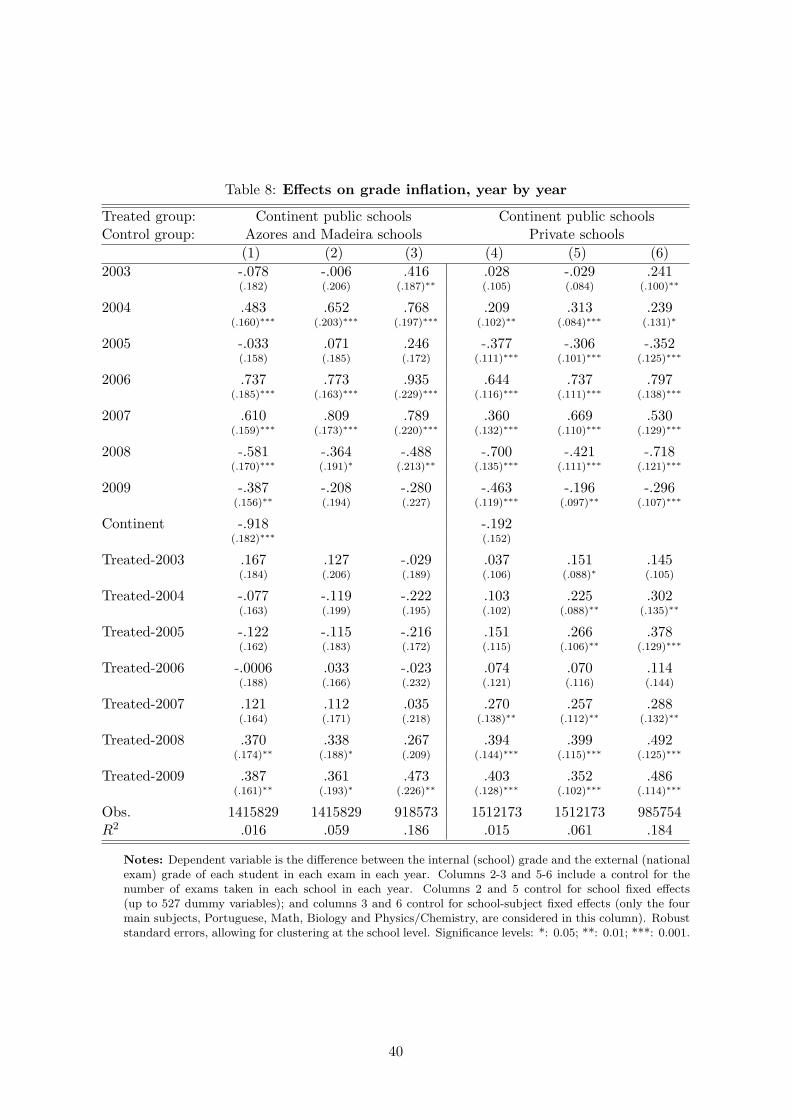
Table 8: Effects on grade inflation, year by year
Treated group: Continent public schools Continent public schoolsControl group: Azores and Madeira schools Private schools
(1) (2) (3) (4) (5) (6)2003 -.078 -.006 .416 .028 -.029 .241
(.182) (.206) (.187)∗∗ (.105) (.084) (.100)∗∗
2004 .483 .652 .768 .209 .313 .239(.160)∗∗∗ (.203)∗∗∗ (.197)∗∗∗ (.102)∗∗ (.084)∗∗∗ (.131)∗
2005 -.033 .071 .246 -.377 -.306 -.352(.158) (.185) (.172) (.111)∗∗∗ (.101)∗∗∗ (.125)∗∗∗
2006 .737 .773 .935 .644 .737 .797(.185)∗∗∗ (.163)∗∗∗ (.229)∗∗∗ (.116)∗∗∗ (.111)∗∗∗ (.138)∗∗∗
2007 .610 .809 .789 .360 .669 .530(.159)∗∗∗ (.173)∗∗∗ (.220)∗∗∗ (.132)∗∗∗ (.110)∗∗∗ (.129)∗∗∗
2008 -.581 -.364 -.488 -.700 -.421 -.718(.170)∗∗∗ (.191)∗ (.213)∗∗ (.135)∗∗∗ (.111)∗∗∗ (.121)∗∗∗
2009 -.387 -.208 -.280 -.463 -.196 -.296(.156)∗∗ (.194) (.227) (.119)∗∗∗ (.097)∗∗ (.107)∗∗∗
Continent -.918 -.192(.182)∗∗∗ (.152)
Treated-2003 .167 .127 -.029 .037 .151 .145(.184) (.206) (.189) (.106) (.088)∗ (.105)
Treated-2004 -.077 -.119 -.222 .103 .225 .302(.163) (.199) (.195) (.102) (.088)∗∗ (.135)∗∗
Treated-2005 -.122 -.115 -.216 .151 .266 .378(.162) (.183) (.172) (.115) (.106)∗∗ (.129)∗∗∗
Treated-2006 -.0006 .033 -.023 .074 .070 .114(.188) (.166) (.232) (.121) (.116) (.144)
Treated-2007 .121 .112 .035 .270 .257 .288(.164) (.171) (.218) (.138)∗∗ (.112)∗∗ (.132)∗∗
Treated-2008 .370 .338 .267 .394 .399 .492(.174)∗∗ (.188)∗ (.209) (.144)∗∗∗ (.115)∗∗∗ (.125)∗∗∗
Treated-2009 .387 .361 .473 .403 .352 .486(.161)∗∗ (.193)∗ (.226)∗∗ (.128)∗∗∗ (.102)∗∗∗ (.114)∗∗∗
Obs. 1415829 1415829 918573 1512173 1512173 985754R2 .016 .059 .186 .015 .061 .184
Notes: Dependent variable is the difference between the internal (school) grade and the external (nationalexam) grade of each student in each exam in each year. Columns 2-3 and 5-6 include a control for thenumber of exams taken in each school in each year. Columns 2 and 5 control for school fixed effects(up to 527 dummy variables); and columns 3 and 6 control for school-subject fixed effects (only the fourmain subjects, Portuguese, Math, Biology and Physics/Chemistry, are considered in this column). Robuststandard errors, allowing for clustering at the school level. Significance levels: *: 0.05; **: 0.01; ***: 0.001.
40
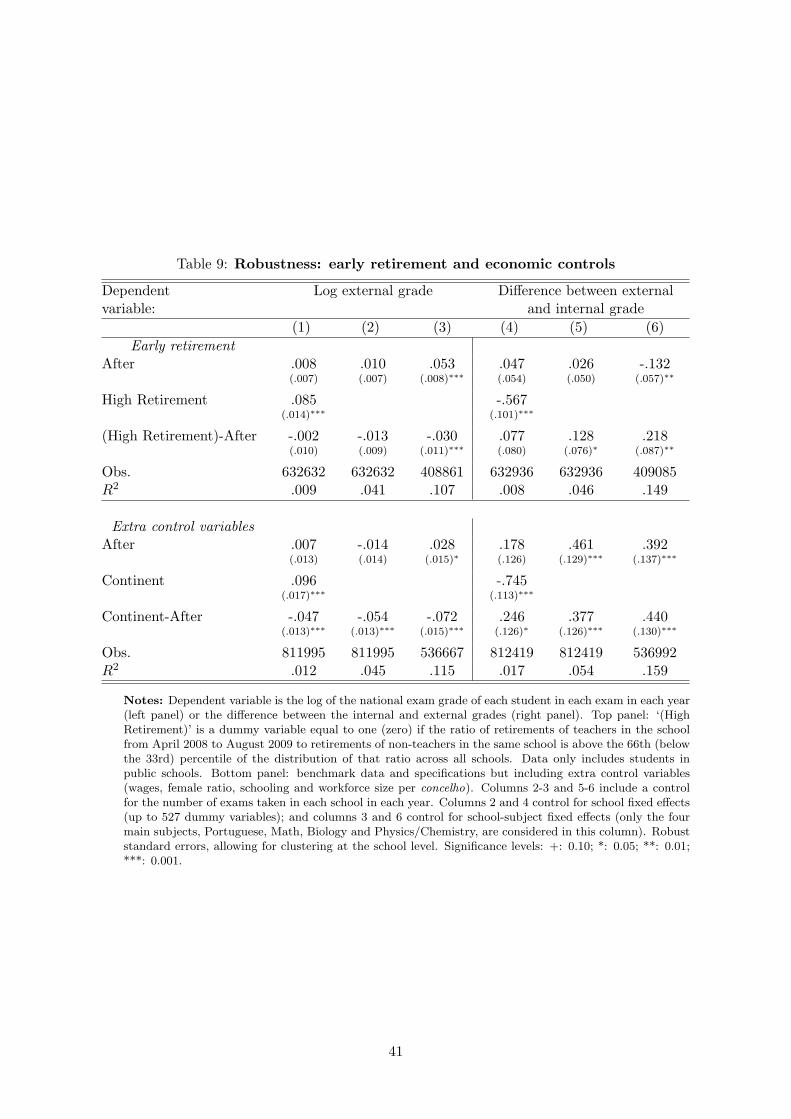
Table 9: Robustness: early retirement and economic controls
Dependent Log external grade Difference between externalvariable: and internal grade
(1) (2) (3) (4) (5) (6)Early retirement
After .008 .010 .053 .047 .026 -.132(.007) (.007) (.008)∗∗∗ (.054) (.050) (.057)∗∗
High Retirement .085 -.567(.014)∗∗∗ (.101)∗∗∗
(High Retirement)-After -.002 -.013 -.030 .077 .128 .218(.010) (.009) (.011)∗∗∗ (.080) (.076)∗ (.087)∗∗
Obs. 632632 632632 408861 632936 632936 409085R2 .009 .041 .107 .008 .046 .149
Extra control variablesAfter .007 -.014 .028 .178 .461 .392
(.013) (.014) (.015)∗ (.126) (.129)∗∗∗ (.137)∗∗∗
Continent .096 -.745(.017)∗∗∗ (.113)∗∗∗
Continent-After -.047 -.054 -.072 .246 .377 .440(.013)∗∗∗ (.013)∗∗∗ (.015)∗∗∗ (.126)∗ (.126)∗∗∗ (.130)∗∗∗
Obs. 811995 811995 536667 812419 812419 536992R2 .012 .045 .115 .017 .054 .159
Notes: Dependent variable is the log of the national exam grade of each student in each exam in each year(left panel) or the difference between the internal and external grades (right panel). Top panel: ‘(HighRetirement)’ is a dummy variable equal to one (zero) if the ratio of retirements of teachers in the schoolfrom April 2008 to August 2009 to retirements of non-teachers in the same school is above the 66th (belowthe 33rd) percentile of the distribution of that ratio across all schools. Data only includes students inpublic schools. Bottom panel: benchmark data and specifications but including extra control variables(wages, female ratio, schooling and workforce size per concelho). Columns 2-3 and 5-6 include a controlfor the number of exams taken in each school in each year. Columns 2 and 4 control for school fixed effects(up to 527 dummy variables); and columns 3 and 6 control for school-subject fixed effects (only the fourmain subjects, Portuguese, Math, Biology and Physics/Chemistry, are considered in this column). Robuststandard errors, allowing for clustering at the school level. Significance levels: +: 0.10; *: 0.05; **: 0.01;***: 0.001.
41
Related Documents