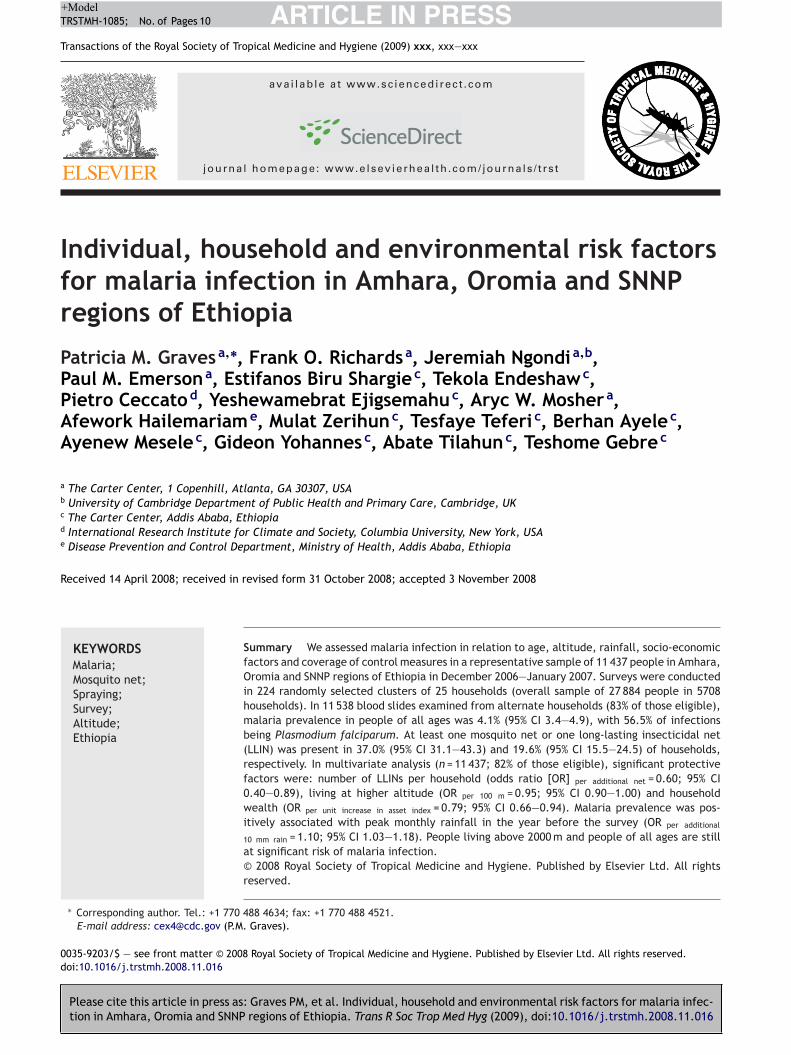
Please cite this article in press as: Graves PM, et al. Individual, household and environmental risk factors for malaria infec- tion in Amhara, Oromia and SNNP regions of Ethiopia. Trans R Soc Trop Med Hyg (2009), doi:10.1016/j.trstmh.2008.11.016 ARTICLE IN PRESS +Model TRSTMH-1085; No. of Pages 10 Transactions of the Royal Society of Tropical Medicine and Hygiene (2009) xxx, xxx—xxx available at www.sciencedirect.com journal homepage: www.elsevierhealth.com/journals/trst Individual, household and environmental risk factors for malaria infection in Amhara, Oromia and SNNP regions of Ethiopia Patricia M. Graves a,∗ , Frank O. Richards a , Jeremiah Ngondi a,b , Paul M. Emerson a , Estifanos Biru Shargie c , Tekola Endeshaw c , Pietro Ceccato d , Yeshewamebrat Ejigsemahu c , Aryc W. Mosher a , Afework Hailemariam e , Mulat Zerihun c , Tesfaye Teferi c , Berhan Ayele c , Ayenew Mesele c , Gideon Yohannes c , Abate Tilahun c , Teshome Gebre c a The Carter Center, 1 Copenhill, Atlanta, GA 30307, USA b University of Cambridge Department of Public Health and Primary Care, Cambridge, UK c The Carter Center, Addis Ababa, Ethiopia d International Research Institute for Climate and Society, Columbia University, New York, USA e Disease Prevention and Control Department, Ministry of Health, Addis Ababa, Ethiopia Received 14 April 2008; received in revised form 31 October 2008; accepted 3 November 2008 KEYWORDS Malaria; Mosquito net; Spraying; Survey; Altitude; Ethiopia Summary We assessed malaria infection in relation to age, altitude, rainfall, socio-economic factors and coverage of control measures in a representative sample of 11 437 people in Amhara, Oromia and SNNP regions of Ethiopia in December 2006—January 2007. Surveys were conducted in 224 randomly selected clusters of 25 households (overall sample of 27 884 people in 5708 households). In 11 538 blood slides examined from alternate households (83% of those eligible), malaria prevalence in people of all ages was 4.1% (95% CI 3.4—4.9), with 56.5% of infections being Plasmodium falciparum. At least one mosquito net or one long-lasting insecticidal net (LLIN) was present in 37.0% (95% CI 31.1—43.3) and 19.6% (95% CI 15.5—24.5) of households, respectively. In multivariate analysis (n = 11 437; 82% of those eligible), significant protective factors were: number of LLINs per household (odds ratio [OR] per additional net = 0.60; 95% CI 0.40—0.89), living at higher altitude (OR per 100 m = 0.95; 95% CI 0.90—1.00) and household wealth (OR per unit increase in asset index = 0.79; 95% CI 0.66—0.94). Malaria prevalence was pos- itively associated with peak monthly rainfall in the year before the survey (OR per additional 10 mm rain = 1.10; 95% CI 1.03—1.18). People living above 2000 m and people of all ages are still at significant risk of malaria infection. © 2008 Royal Society of Tropical Medicine and Hygiene. Published by Elsevier Ltd. All rights reserved. ∗ Corresponding author. Tel.: +1 770 488 4634; fax: +1 770 488 4521. E-mail address: [email protected] (P.M. Graves). 0035-9203/$ — see front matter © 2008 Royal Society of Tropical Medicine and Hygiene. Published by Elsevier Ltd. All rights reserved. doi:10.1016/j.trstmh.2008.11.016

Welcome message from author
This document is posted to help you gain knowledge. Please leave a comment to let me know what you think about it! Share it to your friends and learn new things together.
Transcript
ARTICLE IN PRESS+ModelTRSTMH-1085; No. of Pages 10
Transactions of the Royal Society of Tropical Medicine and Hygiene (2009) xxx, xxx—xxx
avai lab le at www.sc iencedi rec t .com
journa l homepage: www.e lsev ierhea l th .com/ journa ls / t rs t
Individual, household and environmental risk factorsfor malaria infection in Amhara, Oromia and SNNPregions of Ethiopia
Patricia M. Gravesa,∗, Frank O. Richardsa, Jeremiah Ngondia,b,Paul M. Emersona, Estifanos Biru Shargiec, Tekola Endeshawc,Pietro Ceccatod, Yeshewamebrat Ejigsemahuc, Aryc W. Moshera,Afework Hailemariame, Mulat Zerihunc, Tesfaye Teferi c, Berhan Ayelec,Ayenew Meselec, Gideon Yohannesc, Abate Tilahunc, Teshome Gebrec
a The Carter Center, 1 Copenhill, Atlanta, GA 30307, USAb University of Cambridge Department of Public Health and Primary Care, Cambridge, UKc The Carter Center, Addis Ababa, Ethiopiad International Research Institute for Climate and Society, Columbia University, New York, USAe Disease Prevention and Control Department, Ministry of Health, Addis Ababa, Ethiopia
Received 14 April 2008; received in revised form 31 October 2008; accepted 3 November 2008
KEYWORDSMalaria;Mosquito net;Spraying;Survey;Altitude;Ethiopia
Summary We assessed malaria infection in relation to age, altitude, rainfall, socio-economicfactors and coverage of control measures in a representative sample of 11 437 people in Amhara,Oromia and SNNP regions of Ethiopia in December 2006—January 2007. Surveys were conductedin 224 randomly selected clusters of 25 households (overall sample of 27 884 people in 5708households). In 11 538 blood slides examined from alternate households (83% of those eligible),malaria prevalence in people of all ages was 4.1% (95% CI 3.4—4.9), with 56.5% of infectionsbeing Plasmodium falciparum. At least one mosquito net or one long-lasting insecticidal net(LLIN) was present in 37.0% (95% CI 31.1—43.3) and 19.6% (95% CI 15.5—24.5) of households,respectively. In multivariate analysis (n = 11 437; 82% of those eligible), significant protectivefactors were: number of LLINs per household (odds ratio [OR] per additional net = 0.60; 95% CI0.40—0.89), living at higher altitude (OR per 100 m = 0.95; 95% CI 0.90—1.00) and household
Please cite this article in press as: Graves PM, et al. Individual, htion in Amhara, Oromia and SNNP regions of Ethiopia. Trans R So
wealth (OR per unit increase in asset index = 0.79; 95% CI 0.66—0.94). Malaria prevalence was pos-itively associated with peak m10 mm rain = 1.10; 95% CI 1.03—1.1at significant risk of malaria infe© 2008 Royal Society of Tropicareserved.
∗ Corresponding author. Tel.: +1 770 488 4634; fax: +1 770 488 4521.E-mail address: [email protected] (P.M. Graves).
0035-9203/$ — see front matter © 2008 Royal Society of Tropical Medicindoi:10.1016/j.trstmh.2008.11.016
ousehold and environmental risk factors for malaria infec-c Trop Med Hyg (2009), doi:10.1016/j.trstmh.2008.11.016
onthly rainfall in the year before the survey (OR per additional
8). People living above 2000 m and people of all ages are stillction.l Medicine and Hygiene. Published by Elsevier Ltd. All rights
e and Hygiene. Published by Elsevier Ltd. All rights reserved.
INT
2
1
Mcnaee
>iiSwi‘p
vsemml
ae(vEgpT(tmspetmt
aatabzmsatanrcnouet
aiaCcsttbrawocctaALmiR
lrprpa
2
2
TrTeomfr
s(sbrwt
pwmt
ARTICLE+ModelRSTMH-1085; No. of Pages 10
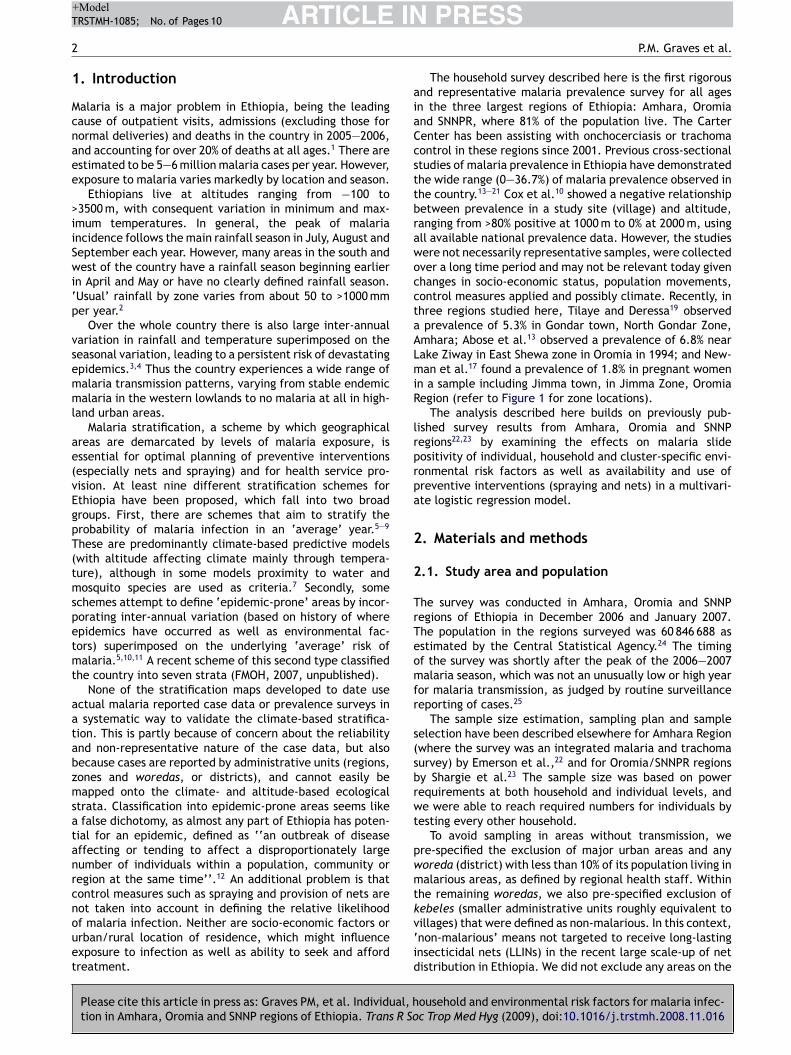
. Introduction
alaria is a major problem in Ethiopia, being the leadingause of outpatient visits, admissions (excluding those forormal deliveries) and deaths in the country in 2005—2006,nd accounting for over 20% of deaths at all ages.1 There arestimated to be 5—6 million malaria cases per year. However,xposure to malaria varies markedly by location and season.
Ethiopians live at altitudes ranging from −100 to3500 m, with consequent variation in minimum and max-mum temperatures. In general, the peak of malariancidence follows the main rainfall season in July, August andeptember each year. However, many areas in the south andest of the country have a rainfall season beginning earlier
n April and May or have no clearly defined rainfall season.Usual’ rainfall by zone varies from about 50 to >1000 mmer year.2
Over the whole country there is also large inter-annualariation in rainfall and temperature superimposed on theeasonal variation, leading to a persistent risk of devastatingpidemics.3,4 Thus the country experiences a wide range ofalaria transmission patterns, varying from stable endemicalaria in the western lowlands to no malaria at all in high-
and urban areas.Malaria stratification, a scheme by which geographical
reas are demarcated by levels of malaria exposure, isssential for optimal planning of preventive interventionsespecially nets and spraying) and for health service pro-ision. At least nine different stratification schemes forthiopia have been proposed, which fall into two broadroups. First, there are schemes that aim to stratify therobability of malaria infection in an ‘average’ year.5—9
hese are predominantly climate-based predictive modelswith altitude affecting climate mainly through tempera-ure), although in some models proximity to water andosquito species are used as criteria.7 Secondly, some
chemes attempt to define ‘epidemic-prone’ areas by incor-orating inter-annual variation (based on history of wherepidemics have occurred as well as environmental fac-ors) superimposed on the underlying ‘average’ risk ofalaria.5,10,11 A recent scheme of this second type classified
he country into seven strata (FMOH, 2007, unpublished).None of the stratification maps developed to date use
ctual malaria reported case data or prevalence surveys insystematic way to validate the climate-based stratifica-
ion. This is partly because of concern about the reliabilitynd non-representative nature of the case data, but alsoecause cases are reported by administrative units (regions,ones and woredas, or districts), and cannot easily beapped onto the climate- and altitude-based ecological
trata. Classification into epidemic-prone areas seems likefalse dichotomy, as almost any part of Ethiopia has poten-
ial for an epidemic, defined as ‘‘an outbreak of diseaseffecting or tending to affect a disproportionately largeumber of individuals within a population, community oregion at the same time’’.12 An additional problem is thatontrol measures such as spraying and provision of nets are
Please cite this article in press as: Graves PM, et al. Individual, htion in Amhara, Oromia and SNNP regions of Ethiopia. Trans R So
ot taken into account in defining the relative likelihoodf malaria infection. Neither are socio-economic factors orrban/rural location of residence, which might influencexposure to infection as well as ability to seek and affordreatment.
kv‘id
PRESSP.M. Graves et al.
The household survey described here is the first rigorousnd representative malaria prevalence survey for all agesn the three largest regions of Ethiopia: Amhara, Oromiand SNNPR, where 81% of the population live. The Carterenter has been assisting with onchocerciasis or trachomaontrol in these regions since 2001. Previous cross-sectionaltudies of malaria prevalence in Ethiopia have demonstratedhe wide range (0—36.7%) of malaria prevalence observed inhe country.13—21 Cox et al.10 showed a negative relationshipetween prevalence in a study site (village) and altitude,anging from >80% positive at 1000 m to 0% at 2000 m, usingll available national prevalence data. However, the studiesere not necessarily representative samples, were collectedver a long time period and may not be relevant today givenhanges in socio-economic status, population movements,ontrol measures applied and possibly climate. Recently, inhree regions studied here, Tilaye and Deressa19 observedprevalence of 5.3% in Gondar town, North Gondar Zone,
mhara; Abose et al.13 observed a prevalence of 6.8% nearake Ziway in East Shewa zone in Oromia in 1994; and New-an et al.17 found a prevalence of 1.8% in pregnant women
n a sample including Jimma town, in Jimma Zone, Oromiaegion (refer to Figure 1 for zone locations).
The analysis described here builds on previously pub-ished survey results from Amhara, Oromia and SNNPegions22,23 by examining the effects on malaria slideositivity of individual, household and cluster-specific envi-onmental risk factors as well as availability and use ofreventive interventions (spraying and nets) in a multivari-te logistic regression model.
. Materials and methods
.1. Study area and population
he survey was conducted in Amhara, Oromia and SNNPegions of Ethiopia in December 2006 and January 2007.he population in the regions surveyed was 60 846 688 asstimated by the Central Statistical Agency.24 The timingf the survey was shortly after the peak of the 2006—2007alaria season, which was not an unusually low or high year
or malaria transmission, as judged by routine surveillanceeporting of cases.25
The sample size estimation, sampling plan and sampleelection have been described elsewhere for Amhara Regionwhere the survey was an integrated malaria and trachomaurvey) by Emerson et al.,22 and for Oromia/SNNPR regionsy Shargie et al.23 The sample size was based on powerequirements at both household and individual levels, ande were able to reach required numbers for individuals by
esting every other household.To avoid sampling in areas without transmission, we
re-specified the exclusion of major urban areas and anyoreda (district) with less than 10% of its population living inalarious areas, as defined by regional health staff. Within
he remaining woredas, we also pre-specified exclusion of
ousehold and environmental risk factors for malaria infec-c Trop Med Hyg (2009), doi:10.1016/j.trstmh.2008.11.016
ebeles (smaller administrative units roughly equivalent toillages) that were defined as non-malarious. In this context,non-malarious’ means not targeted to receive long-lastingnsecticidal nets (LLINs) in the recent large scale-up of netistribution in Ethiopia. We did not exclude any areas on the

ARTICLE IN PRESS+ModelTRSTMH-1085; No. of Pages 10
Risk factors for malaria infection in Ethiopia 3
ma
Bratmt(
Figure 1 Map of the survey sites and
basis of altitude. Overall, the percentage of the populationexcluded due to residing in non-malarious areas was 27% ofthe total.
Clusters were defined as kebeles. The multistage clusterrandom sampling design used zones and woredas in Amharaand ‘quadrants’ (groups of woredas) in Oromia/SNNPR aspreliminary sampling stages. The strategy was designed to
Please cite this article in press as: Graves PM, et al. Individual, htion in Amhara, Oromia and SNNP regions of Ethiopia. Trans R So
select 160 clusters (16 per zone) in Amhara and 64 clus-ters (8 per quadrant) in Oromia/SNNPR, giving 224 clustersin total, each targeted to include 25 households. Clusterswere randomly selected from among the malarious kebelesin each woreda or quadrant. After selection, one cluster in
hpFvi
laria prevalence estimates by cluster.
orena Zone of Oromia Region was replaced due to secu-ity concerns. Within clusters, five state teams (divisions of
kebele) were randomly selected, and within each stateeam, five households were selected by the random walkethod. Households within a cluster were assigned sequen-
ial numbers as they were sampled. All eligible participantsall age groups and both sexes) in even-numbered house-
ousehold and environmental risk factors for malaria infec-c Trop Med Hyg (2009), doi:10.1016/j.trstmh.2008.11.016
olds were invited to participate in testing for malariaarasites. Locations of the selected clusters are shown inigure 1. Verbal informed consent to participate in inter-iews was sought from the heads of the household. Signednformed consent for blood testing was sought from each

INT
4
iPa
2
Ttccaiits(p1t
sbanaphteth[
2
MRmb—tfsai2pmi
2
AhdiNgiC
ffheaatwT9n
2
Fidc(wTtotPttp
tfmtwasvsaP
3
3
T5vpw(aoptw
ARTICLE+ModelRSTMH-1085; No. of Pages 10
ndividual and parents of children aged 17 years and younger.ersonal identifiers were removed from the data set beforenalyses were undertaken.
.2. Household questionnaire
he survey questionnaire was based on the Malaria Indica-or Survey Household Questionnaire, modified for the localonditions as previously described.22,23,26 A wealth index wasonstructed for each household using principal componentsnalysis using the methods of Vyas and Kumaranayake.27 Thisndex was based on possession of assets (having electricityn the household, a functioning radio and/or a functioningelevision), type and location of usual water source, pos-ession of and type of latrine, house construction materialswall, roof and floor), number of rooms and density of peo-le per room. The first principal component (representing0.3% of the variance in the sample) was used to generatehe asset index, which was then divided into quintiles.
Respondents were also asked about: indoor residualpraying; presence and type of mosquito net (verifiedy observation); demographic information on residents;nd where people slept. Interviewers asked to see eachet by room in the house, determined whether it wasn LLIN or not, and asked who had slept under it therevious night. It was also determined whether anyousehold residents slept outside, and if so whetherhey used a net or LLIN. Altitude and location ofach household was recorded using the Global Posi-ioning System (Garmin eTrex GPS Personal Navigator;ttps://buy.garmin.com/shop/shop.do?cID=144&pID=8705accessed 4 November 2008]).
.3. Rainfall data
onthly rainfall data were obtained from the Internationalesearch Institute for Climate and Society. The rainfall esti-ate products are derived from satellite images producedy the National Oceanic and Atmospheric AdministrationClimate Prediction Centre using the African rainfall estima-
ion algorithm. The rainfall products are provided every 10 drom December 1999 to the present. The 10 d products wereummed to monthly data and averaged over woreda bound-ries. Rainfall was quantified by woreda in various ways,ncluding the annual mean of 2000—2007, the total rain in006 (the year prior to the survey), the total rain during theeak season of 2006 (June to October), and the maximumonthly rain in 2006. The latter two variables were included
n the regression analysis.
.4. Malaria parasite prevalence
ll consenting eligible persons (those in even-numberedouseholds) were tested by a rapid diagnostic test, whichetects all malaria species (ParaScreen; Zephyr Biomed-
Please cite this article in press as: Graves PM, et al. Individual, htion in Amhara, Oromia and SNNP regions of Ethiopia. Trans R So
cal Systems; http://www.tulipgroup.com [accessed 4ovember 2008]) and had duplicate blood slides taken by fin-erprick. Participants with positive rapid tests were offeredmmediate treatment according to national guidelines:28
oArtem for Plasmodium falciparum infection, chloroquine
b1r
o
PRESSP.M. Graves et al.
or other malaria infection and clinic-based quinine therapyor self-reported pregnant women. The analysis reportedere is based on the results from blood slides stained andxamined as described by Emerson et al.22 and Shargie etl.23 Parasite density was not quantified. To ensure accuracy,ll positive slides and a random sample of 5% of the nega-ive slides were re-examined by a separate microscopist,ho was blinded to the diagnosis of the first slide-reader.he overall agreement between the two microscopists was9.4%. Comparison of the results obtained with rapid diag-ostic tests and slides will be reported separately.
.5. Quality control, data entry and analysis
orms were checked by the supervisor in the field andnconsistencies verified with the respondents. Data wereouble-entered by different entry clerks and compared foronsistency using the Census and Survey Processing SystemUS Census Bureau, Washington DC, USA). Statistical analysisas conducted using Stata 9.2 (Stata Corp., College Station,X, USA). Sampling probabilities were calculated for clus-ers (kebeles), and sampling weights derived as the inversef the product of sampling probabilities. Descriptive statis-ics were used to examine the characteristics of the sample.oint estimates and confidence intervals were derived usinghe SURVEY (SVY) routine in Stata, which controlled for clus-ering in the sample design as well as weighting for samplingrobability.29
To investigate the association between malaria infec-ion and risk factors, univariate analysis was first conductedor each potentially explanatory risk factor. Multivariableodels were then developed by backwards stepwise logis-
ic regression analysis in Stata using weighted data. Startingith all potentially significant variables, explanatory vari-bles were sequentially removed if they satisfied the >15%ignificance level for exit. After determining the significantariables, the final model was then run with adjustment forurvey design. Age and sex were retained in all multivari-ble models to control for any potential confounding effects.< 0.05 was considered statistically significant.
. Results
.1. Characteristics of study population
he total number of households selected for the survey was708 in 224 clusters, and overall 27 884 people were sur-eyed. In the even-numbered households, there were 13 960eople eligible for malaria testing, of whom 12 212 (87.5%)ere tested. Of these, 513 had missing or unreadable slides
including all slides from one cluster in Amhara Region)nd 98 had missing age or sex data, leaving a sample sizef 11 601 (83.1% of those eligible) for analysis of malariarevalence by individual characteristics. Household charac-eristics data were not linkable for a further 63 people,hich gave a sample size of 11 538 (82.7% of those eligi-
ousehold and environmental risk factors for malaria infec-c Trop Med Hyg (2009), doi:10.1016/j.trstmh.2008.11.016
le) with blood slide results. Due to missing risk factor data,64 people were excluded, leaving 11 437 people in the finalegression analysis.
The mean household size was 4.9 people. The mean agef individuals tested was 20.7 years, with 46.1% being male.

ARTICLE IN PRESS+ModelTRSTMH-1085; No. of Pages 10
Risk factors for malaria infection in Ethiopia 5
Figure 3 Malaria prevalence (slide positivity) by species andage group. LLIN: long-lasting insecticidal net; bars represent95% CI.
Fnh
(p
Figure 2 Household net possession and use by people of allages, and proportion of houses sprayed. LLIN: long-lasting insec-ticidal net; bars represent 95% CI.
The design effect in this survey ranged from 1.6 for thevariable representing age group to 4.1 for altitude.
3.2. Coverage of malaria control measures
The mean number of nets or LLINs owned per house was 0.6(95% CI 0.4—0.7) and 0.3 (95% CI 0.2—0.4), respectively. Weestimated that 37.0% (95%CI 31.1—43.3) of households hadat least one net of any type and 19.6% (95%CI 15.5—24.5)had at least one LLIN (Figure 2). Overall, 27.8% (95% CI23.5—32.7) of people reported sleeping under a net theprevious night, while 15.3% (95% CI 12.0—19.2) slept underan LLIN (Table 1 and Figure 2). The proportions were onlyslightly higher for under-fives (31.8% net and 17.4% LLIN) andfor pregnant women (35.9% net and 18.9% LLIN) (Table 1).Within the last 12 months and 6 months, respectively, 15.5%(95% CI 11.2—20.9) and 5.7% (95% CI 3.7—8.9) of houseshad been sprayed (Figure 2). The type of insecticide usedis unknown, but DDT is the most commonly used chemi-cal.
3.3. Prevalence of malaria infection
The locations and proportions of people positive for malariain the sampled clusters are shown in Figure 1. Malaria preva-
Please cite this article in press as: Graves PM, et al. Individual, htion in Amhara, Oromia and SNNP regions of Ethiopia. Trans R So
lence was 4.1% (95% CI 3.4—4.9) overall. There were 1.3times as many people infected with P. falciparum (2.5%)as P. vivax (1.9%) infections, with 0.3% of infections beingmixed. There was no difference in parasite prevalence bygender.
ec(
a
Table 1 Percentage of sampled individuals sleeping under mosqu
n
All age groups 27 884Children aged <5 years 4387Women aged 15—49 years 6510Self-reported pregnant women 489
LLIN: long-lasting insecticidal net.
igure 4 Malaria prevalence (slide positivity) by number ofets (any type) and long-lasting insecticidal nets (LLIN) perousehold. Bars represent 95% CI.
There was no difference in prevalence by age groupFigure 3): the apparent declining trend of P. falciparumrevalence by age was not statistically significant. How-
ousehold and environmental risk factors for malaria infec-c Trop Med Hyg (2009), doi:10.1016/j.trstmh.2008.11.016
ver, there was a declining trend of prevalence (both speciesombined) with increasing numbers of LLINs in the houseFigure 4).
There was a decline in prevalence with altitude (Table 2),lthough people infected with malaria were found in all
ito nets on the night prior to the survey.
Any net % (95% CI) LLIN % (95% CI)
27.8 (23.5—32.7) 15.3 (12.0—19.2)31.8 (26.8—37.4) 17.4 (13.6—22.0)29.0 (24.4—34.0) 16.0 (12.6—20.1)35.9 (28.8—43.7) 18.9 (14.0—25.0)

ARTICLE IN PRESS+ModelTRSTMH-1085; No. of Pages 10
6 P.M. Graves et al.
Table 2 Malaria (species-specific) prevalence by slide, by altitude, all regions combined.
Altitude class (m) n Any positive slide Pf Pv Pf+Pv Pf:Pv ratio
n (%) (95% CI) n (%) n (%) n (%)
≤1000 125 11 (7.3) (1.9—23.8) 5 (4.1) 4 (2.2) 2 (1.1) 1.61000—1500 1529 67 (4.7) (3.1—7.2) 42 (2.7) 17 (1.5) 8 (0.6) 1.61500—2000 5640 232 (4.2) (3.3—5.4) 122 (2.4) 102 (1.7) 8 (0.2) 1.42000—2500 3661 121 (3.8) (2.6—5.4) 67 (2.0) 48 (1.5) 6 (0.3) 1.22500—3000 543 18 (3.2) (2.0—5.1) 7 (1.0) 8 (1.6) 3 (0.6) 0.7>3000 103 7a (7.3) (1.4—30.1) 6a (6.3) 1 (1.1) 0 6.0
.9)
adb3mslt
3
Iaah9[aTpw1Powttbwfipit
iiimp(iai9i
t(aPtLbt
psnaoCLtri
4
TbEsaasmgtmt
tmatr
Total 11601 456 (4.1) (3.4—4
Pf: Plasmodium falciparum; Pv: Plasmodium vivax.a Malaria cases clustered in one family.
ltitude bands tested. Surprisingly, although prevalenceropped with altitude in general, the percent positiveetween 2500 and 3000 m was 3.2% (95% CI 2.0—5.1). Above000 m there was one household in which all six householdembers were infected with P. falciparum, accounting for
ix of the seven positive people in this altitude band andeading to an anomalously high prevalence (the other posi-ive case in a different household had P. vivax).
.4. Risk factors for malaria infection
nitial univariate analysis (weighted for sampling probabilitynd adjusted for clustering) suggested the following factorsssociated with reduction in malaria prevalence (Table 3):aving at least one LLIN in the house [odds ratio (OR) = 0.66,5% CI 0.43—0.96, P = 0.03], the number of LLINs per houseOR = 0.76 (95% CI 0.60—0.95) per additional LLIN, P = 0.02]nd the asset index (OR = 0.80, 95% CI 0.67—0.95, P = 0.01).he richest wealth quintile had significantly lower malariarevalence (OR = 0.44, 95% CI 0.25—0.77, P = 0.004). Thereas a suggestion that house spraying within the previous2 months reduced prevalence (OR = 0.66, 95% CI 0.42—1.03,= 0.07). Surprisingly, although sleeping under either a netf any type or an LLIN the previous night was associatedith reduction in prevalence, the relationship was not sta-
istically significant in either case. Rainfall, expressed ashe maximum monthly rain per woreda in 2006 (the yearefore the survey), was significantly positively associatedith malaria (OR = 1.09, 95% CI 1.02—1.17). The analysis con-rmed the absence of association between age and malariaositivity shown in Figure 3. As Table 3 shows, while increas-ng altitude reduced malaria positivity in the expected way,he effect was not significant in univariate analysis.
When all potentially important variables were enterednto a multivariate logistic regression with stepwise elim-nation, the significant variables remaining were as shownn Table 4. This shows the effect of altitude in reducingalaria prevalence (OR = 0.95, 95% CI 0.90—1.00, P = 0.049,er 100 m increase in altitude) and rainfall in increasing itOR 1.10, 95% CI 1.03—1.18, P = 0.007, per additional 10 mm
Please cite this article in press as: Graves PM, et al. Individual, htion in Amhara, Oromia and SNNP regions of Ethiopia. Trans R So
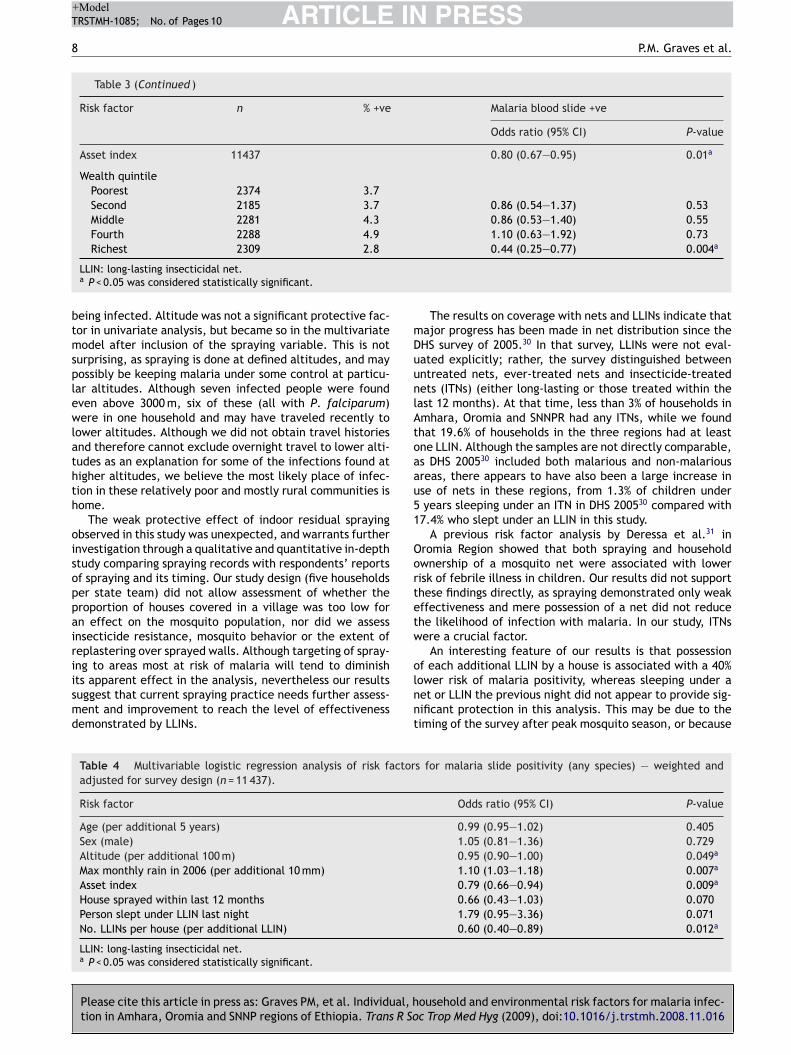
n the peak rain month prior to the survey). Increase in thesset index (which ranged from —1.90 to 6.29) was signif-cantly associated with reduction in prevalence (OR = 0.79,5% CI 0.66—0.94, P = 0.009). Malaria prevalence was lowerf the house had been sprayed within the previous 12 months
tOcta
249 (2.2) 180 (1.6) 27 (0.3) 1.3
han if it had not, but this was not statistically significantP = 0.072). The number of LLINs in the house was associ-ted with lower prevalence (OR = 0.60, 95% CI 0.40—0.89,= 0.012, per additional net). It was notable that in con-
rast to the univariate analysis, the variable ‘slept underLIN last night’ was associated with increased likelihood ofeing infected after adjusting for other factors, althoughhis was not statistically significant (P = 0.070).
The model was repeated using infection with P. falci-arum or P. vivax as the outcome. Results were generallyimilar for P. falciparum as for any parasite species (dataot shown), although only household possession of an LLINnd the asset index remained statistically significant. Thedds ratio for ‘at least one LLIN per house’ was 0.55 (95%I 0.32—0.95, P = 0.03). For P. vivax, by contrast, having anLIN in the house did not reduce the odds of positivity forhis species (OR = 0.84, 95% CI 0.11—1.38, P = 0.50), and onlyainfall remained a significant factor increasing likelihood ofnfection with P. vivax.
. Discussion
his study uses results from the first extensive population-ased malaria prevalence survey in three large regions ofthiopia. The results provide important information on age-pecific and altitude-specific malaria infection rates, as wells an estimate of current (early 2007) intervention cover-ge and the effectiveness of those interventions. Notably,atellite-derived rainfall estimates were included in ourodel to control for climate factors in addition to age,
ender, altitude, socio-economic status and use of interven-ions. The survey results can be used to validate suggestedalaria stratification schemes and improve the malaria con-
rol program’s targeting of interventions.The overall malaria prevalence was low (4.1%), even
hough the survey was done shortly after the peak trans-ission season. There was no difference in prevalence by
ge group or gender. Malaria positivity declined with alti-ude, but not as steeply as expected based on the previouseview by Cox et al.10, and the results refuted the suggestion
ousehold and environmental risk factors for malaria infec-c Trop Med Hyg (2009), doi:10.1016/j.trstmh.2008.11.016
herein that 2000 m is the cutoff for malaria transmission.ur sampling frame (which excluded non-malarious areasompletely) may have biased the estimate of the protec-ive effect of altitude, but positive individuals were foundt all altitudes, with 3.2% of people living at 2500—3000 m

Please cite this article in press as: Graves PM, et al. Individual, household and environmental risk factors for malaria infec-tion in Amhara, Oromia and SNNP regions of Ethiopia. Trans R Soc Trop Med Hyg (2009), doi:10.1016/j.trstmh.2008.11.016
ARTICLE IN PRESS+ModelTRSTMH-1085; No. of Pages 10
Risk factors for malaria infection in Ethiopia 7
Table 3 Univariate logistic regression analysis of individual, household and cluster risk factors for malaria slide positivity (anyspecies); weighted and adjusted for survey design.
Risk factor n % +ve Malaria blood slide +ve
Odds ratio (95% CI) P-value
Age (per 5 year age group) 11437 0.99 (0.96—1.02) 0.47Age (per year) 11437 1.00 (0.99—1.00) 0.44
SexMale 5270 3.7Female 6167 4.0 1.05 (0.80—1.36) 0.74
Currently pregnant (of eligible women, n = 2549)No 2342 3.9Yes 207 4.4 1.34 (0.60—2.98) 0.48
Slept under any net last nightNo 7849 4.1Yes 3588 3.4 0.86 (0.60—1.22) 0.39
Slept under LLIN last nightNo 9319 4.1Yes 2118 3.1 0.76 (0.50—1.15) 0.19
Household size (per additional person) 11437 0.99 (0.93—1.06) 0.81No. rooms in house (per additional room) 11437 0.84 (0.57—1.22) 0.36
At least one net (any type) in houseNo 6252 4.1Yes 5185 3.7 0.91 (0.63—1.33) 0.63
At least one LLIN in houseNo 8322 4.3Yes 3115 2.8 0.66 (0.43—0.96) 0.03a
No. nets (any type) in house (per additional net) 11437 0.88 (0.74—1.05) 0.14No. LLINs in house (per additional net) 11437 0.76 (0.60—0.95) 0.02a
Household net statusNone 6252 4.1≥1 any net 2070 4.9 1.21 (0.78—1.89) 0.40≥1 LLIN 3115 2.8 0.67 (0.44—1.04) 0.07
House sprayed <12 months agoNo 9470 4.0Yes 1967 3.5 0.66 (0.42—1.03) 0.07
House sprayed <6 months agoNo 10454 3.8Yes 983 4.5 0.82 (0.48—1.40) 0.46
Altitude (per additional 100 m) 11437 0.98 (0.93—1.03) 0.38
Altitude group (m)<1000 122 8.2>1000—1500 1510 4.4 0.68 (0.17—2.75) 0.59>1500—2000 5577 3.9 0.57 (0.14—2.34) 0.44>2000—2500 3598 3.3 0.53 (0.13—2.23) 0.39>2500 630 4.0 0.55 (0.12—2.48) 0.44
Rainfall (by woreda, per additional 10 mm)Total rain Jul—Oct 2006 11437 1.02 (1.00—1.04) 0.082006 max monthly rain 11437 1.09 (1.02—1.17) 0.02a
ARTICLE IN PRESS+ModelTRSTMH-1085; No. of Pages 10
8 P.M. Graves et al.
Table 3 (Continued )
Risk factor n % +ve Malaria blood slide +ve
Odds ratio (95% CI) P-value
Asset index 11437 0.80 (0.67—0.95) 0.01a
Wealth quintilePoorest 2374 3.7Second 2185 3.7 0.86 (0.54—1.37) 0.53Middle 2281 4.3 0.86 (0.53—1.40) 0.55Fourth 2288 4.9 1.10 (0.63—1.92) 0.73
btmsplewlathth
oisoppairiismd
mDuunlAtoaau51
Oortetw
Richest 2309 2.8
LLIN: long-lasting insecticidal net.a P < 0.05 was considered statistically significant.
eing infected. Altitude was not a significant protective fac-or in univariate analysis, but became so in the multivariateodel after inclusion of the spraying variable. This is not
urprising, as spraying is done at defined altitudes, and mayossibly be keeping malaria under some control at particu-ar altitudes. Although seven infected people were foundven above 3000 m, six of these (all with P. falciparum)ere in one household and may have traveled recently to
ower altitudes. Although we did not obtain travel historiesnd therefore cannot exclude overnight travel to lower alti-udes as an explanation for some of the infections found atigher altitudes, we believe the most likely place of infec-ion in these relatively poor and mostly rural communities isome.
The weak protective effect of indoor residual sprayingbserved in this study was unexpected, and warrants furthernvestigation through a qualitative and quantitative in-depthtudy comparing spraying records with respondents’ reportsf spraying and its timing. Our study design (five householdser state team) did not allow assessment of whether theroportion of houses covered in a village was too low forn effect on the mosquito population, nor did we assessnsecticide resistance, mosquito behavior or the extent ofeplastering over sprayed walls. Although targeting of spray-
Please cite this article in press as: Graves PM, et al. Individual, htion in Amhara, Oromia and SNNP regions of Ethiopia. Trans R So
ng to areas most at risk of malaria will tend to diminishts apparent effect in the analysis, nevertheless our resultsuggest that current spraying practice needs further assess-ent and improvement to reach the level of effectivenessemonstrated by LLINs.
olnnt
Table 4 Multivariable logistic regression analysis of risk factoradjusted for survey design (n = 11 437).
Risk factor
Age (per additional 5 years)Sex (male)Altitude (per additional 100 m)Max monthly rain in 2006 (per additional 10 mm)Asset indexHouse sprayed within last 12 monthsPerson slept under LLIN last nightNo. LLINs per house (per additional LLIN)
LLIN: long-lasting insecticidal net.a P < 0.05 was considered statistically significant.
0.44 (0.25—0.77) 0.004a
The results on coverage with nets and LLINs indicate thatajor progress has been made in net distribution since theHS survey of 2005.30 In that survey, LLINs were not eval-ated explicitly; rather, the survey distinguished betweenntreated nets, ever-treated nets and insecticide-treatedets (ITNs) (either long-lasting or those treated within theast 12 months). At that time, less than 3% of households inmhara, Oromia and SNNPR had any ITNs, while we foundhat 19.6% of households in the three regions had at leastne LLIN. Although the samples are not directly comparable,s DHS 200530 included both malarious and non-malariousreas, there appears to have also been a large increase inse of nets in these regions, from 1.3% of children underyears sleeping under an ITN in DHS 200530 compared with
7.4% who slept under an LLIN in this study.A previous risk factor analysis by Deressa et al.31 in
romia Region showed that both spraying and householdwnership of a mosquito net were associated with lowerisk of febrile illness in children. Our results did not supporthese findings directly, as spraying demonstrated only weakffectiveness and mere possession of a net did not reducehe likelihood of infection with malaria. In our study, ITNsere a crucial factor.
An interesting feature of our results is that possession
ousehold and environmental risk factors for malaria infec-c Trop Med Hyg (2009), doi:10.1016/j.trstmh.2008.11.016
f each additional LLIN by a house is associated with a 40%ower risk of malaria positivity, whereas sleeping under aet or LLIN the previous night did not appear to provide sig-ificant protection in this analysis. This may be due to theiming of the survey after peak mosquito season, or because
s for malaria slide positivity (any species) — weighted and
Odds ratio (95% CI) P-value
0.99 (0.95—1.02) 0.4051.05 (0.81—1.36) 0.7290.95 (0.90—1.00) 0.049a
1.10 (1.03—1.18) 0.007a
0.79 (0.66—0.94) 0.009a
0.66 (0.43—1.03) 0.0701.79 (0.95—3.36) 0.0710.60 (0.40—0.89) 0.012a

IN
ADTDTEHHHUcat
FCvb
C
Ef1bt
R
ARTICLE+ModelTRSTMH-1085; No. of Pages 10
Risk factors for malaria infection in Ethiopia
the question regarding net use the single night before thesurvey did not accurately capture the net use over a longerperiod. It may also be that the mere presence of an LLINin the house gives protection. In multivariate analysis, useof an LLIN the previous night was in fact associated withincreased malaria prevalence, suggesting that net use isinfluenced by the householder’s estimation of the risk (i.e.nets tend to be used more in areas of greater exposure tomalaria).
There may be additional risk factors that we did notaddress in this study. A study in Tigray region by Gebreyesuset al.16 is very relevant, although it estimated incidence ofmalaria in children under 10 rather than prevalence. In mul-tivariate regression there were seven significant risk factorsfor malaria incidence (earth roof, open eaves, windows, sin-gle sleeping rooms, no separate kitchen, animals sleeping inthe house and use of irrigated land). Deressa et al.31 alsoshowed that sharing the house with livestock increased therisk of fever. Some of these factors may be captured in oursocio-economic index, but these studies16,31 suggest that thehousehold asset-related questions in the standard DHS/MISquestionnaire should be evaluated and possibly modifiedto include additional relevant items. Tilaye and Deressa19
observed that proximity to breeding sites increased the riskof malaria in Gondar town, Amhara Region, a factor that isdifficult to assess in large household surveys but could beinvestigated further in future.
There was no evidence that increased age reduced therisk of being infected with malaria. Thus control measuresin Ethiopia should be targeted to all age groups and notrestricted to small children or pregnant women. In addi-tion, people living above 2000 m are still at significant risk ofmalaria infection even in ‘non-epidemic’ years. The resultsindicate that while there has been great progress in net dis-tribution since 2005, there is still a further need, given thatwe found an average of only 0.3 LLINs per household. Thisneed is being met by additional net distribution to all agegroups in 2007 and beyond.
The survey results presented here also contribute toimproving and evaluating the malaria control program inEthiopia. Prevalence survey data can help to validate thestratification systems discussed in the Introduction, andrefine the relationship between stratification levels andtargeting of appropriate malaria control methods withinadministrative planning units. Surveys such as this one alsoassess in a rigorous way the coverage of interventions suchas net distribution and spraying, and indicate gaps needingto be filled. Finally, the results provide much-needed clearbaselines for follow-up surveys of intervention coverage andprevalence in order to demonstrate the decline of malariain Ethiopia.
Authors’ contributions: PMG, FOR, PME, EBS, TG, AWM andAH planned and designed the survey; EBS, TE, YE, AWM,MZ, TT, BA, AM, GY and AT carried out the survey; YE,JN, EBS and AWM managed the data; PC extracted andprovided climate data; PMG and JN analyzed the data;
Please cite this article in press as: Graves PM, et al. Individual, htion in Amhara, Oromia and SNNP regions of Ethiopia. Trans R So
PMG and JN wrote the first and subsequent drafts ofthe manuscript; FOR, EBS, TE, PME, TG, PC, YE and AHcommented on drafts. All authors read and approved thefinal manuscript. PMG, JN and EBS are guarantors for thepaper.
PRESS9
cknowledgements: We thank: Mrs Sirgut Mulatu, Mr Frewemeke, Ms Kelly Callahan and Ms Elizabeth Cromwell fromhe Carter Center for considerable logistical support; Dronald R Hopkins of The Carter Center and Dr Zerihunadesse, Head of Disease Prevention and Control, FMOH,thiopia for support; Mr Asrat Genet from Amhara Regionalealth Bureau, Mr Dereje Olana from Oromia Regionalealth Bureau and Mr Asrat W/Meskel from SNNP Regionalealth Bureau; and Dr Eshetu Gurmu from Addis Ababaniversity Population Studies and Research Center for theoordination of data entry and cleaning. We are indebted toll the survey participants who gave freely of their time inhe survey.
unding: The work was funded by The Carter Center Malariaontrol Program, and staff were allocated to the sur-ey by the Amhara, Oromia and SNNP regional healthureaux.
onflicts of interest: None declared.
thical approval: The protocol received ethical approvalrom the Emory University Institutional Review Board (IRB816) and the Amhara, Oromia and SNNPR regional healthureaux. Informed consent was sought in accordance withhe tenets of the declaration of Helsinki.
eferences
1. FMOH. Health and health related indicators, Ethiopian calen-dar 1998 (2005/06). Addis Ababa: Federal Democratic Republicof Ethiopia, Ministry of Health; 2006.
2. Malaria Early Warning System (MEWS). http://iridl.ldeo.columbia.edu/maproom/.Health/.Regional/.Africa/.Malaria/.MEWS/ [accessed 1 August 2008].
3. Checchi F, Cox J, Balkan S, Tamrat A, Priotto G, Alberti KP, et al.Malaria epidemics and interventions, Kenya, Burundi, South-ern Sudan and Ethiopia, 1999—2004. Emerg Inf Dis 2006;12:1477—85.
4. Negash K, Kebede A, Medhin A, Argaw D, Babaniyi O, GuintranJO, et al. Malaria epidemics in the highlands of Ethiopia. EastAfr Med J 2005;82:186—92.
5. Abeku TA, van Oortmarssen GJ, Borsboom G, de Vlas SJ,Habbema JDF. Spatial and temporal variation of malaria epi-demic risk in Ethiopia: factors involved and implications. ActaTrop 2003;87:331—40.
6. Craig MH, Snow RW, le Sueur D. A climate-based distributionmodel of malaria transmission in sub-Saharan Africa. ParasitolToday 1999;15:105—11.
7. FMOH. Guidelines for malaria vector control in Ethiopia. AddisAbaba: Malaria and Other Vector-Borne Diseases Control Unit,Epidemiology and AIDS Control Department, Ministry of Health;2002.
8. Schaller KF, Kuls W. Äthiopien. Berlin: Springer Verlag; 1972.9. Woube M. Geographical distribution and dramatic increases
in incidences of malaria: consequences of the resettlementscheme in Gambela, SW Ethiopia. Indian J Malariol 1997;34:140—63.
ousehold and environmental risk factors for malaria infec-c Trop Med Hyg (2009), doi:10.1016/j.trstmh.2008.11.016
10. Cox J, Craig M, Le Sueur D, Sharp B. Mapping malaria risk inthe highlands of Africa. MARA/HIMAL Technical Report. Lon-don: Disease Control and Vector Biology Unit, Department ofInfectious and Tropical Diseases, London School of Hygiene andTropical Medicine; 1999.
INT
1
2006.31. Deressa W, Ali A, Berhane Y. Household and socioeconomic
ARTICLE+ModelRSTMH-1085; No. of Pages 10
0
11. FMOH. Guidelines for malaria epidemic prevention and controlin Ethiopia. 2nd ed. Addis Ababa: Federal Democratic Republicof Ethiopia, Ministry of Health; 2004.
12. Merriam-Webster. Merriam-Webster’s collegiate dictionary.10th ed. Springfield, MA: Merriam-Webster; 2000.
13. Abose T, Yeebiyo Y, Olana D, Alamirew D, Beyene Y, RegassaL, et al. Re-orientation and definition of the role ofmalaria vector control in Ethiopia. The epidemiology andcontrol of malaria with special emphasis on the distribu-tion, behaviour and susceptibility of insecticides of anophelinevectors and chloroquine resistance in Zwai, central Ethiopiaand other areas. Geneva: World Health Organization; 1998,WHO/MAL/98.1085.
14. Adish AA, Esrey SA, Gyorkos TW, Johns T. Risk factors for irondeficiency anaemia in preschool children in northern Ethiopia.Public Health Nutr 1999;2:243—52.
15. Collins WE, Warren M, Skinner JC. Serological malaria survey inthe Ethiopian highlands. Am J Trop Med Hyg 1971;20:199—205.
16. Ghebreyesus TA, Haile M, Witten KH, Getachew A, YohannesM, Lindsay S, et al. Household risk factors for malaria amongchildren in the Ethiopian Highlands. Trans R Soc Trop Med Hyg2000;94:17—21.
17. Newman RD, Hailemariam A, Jimma D, Degiffe A, Kebede D,Rietveld AEC, et al. Burden of malaria during pregnancy inareas of stable and unstable transmission in Ethiopia duringa nonepidemic year. J Infect Dis 2003;187:1765—72.
18. Nigatu W, Abebe M, Dejene A. Plasmodium vivax and P. fal-ciparum epidemiology in Gambella, south-west Ethiopia. TropMed Parasitol 1992;43:181—5.
19. Tilaye T, Deressa W. Prevalence of urban malaria and associ-ated factors in Gondar Town, Northwest Ethiopia. Ethiop MedJ 2007;45:151—8.
20. Wezam A. Malaria survey at Humera, northwestern Ethiopia.
Please cite this article in press as: Graves PM, et al. Individual, htion in Amhara, Oromia and SNNP regions of Ethiopia. Trans R So
Ethiop Med J 1994;32:41—7.21. Yohannes M, Haile M, Ghebreyesus TA, Witten KH, Getachew A,
Byass P, et al. Can source reduction of mosquito larval habitatreduce malaria transmission in Tigray, Ethiopia? Trop Med IntHealth 2005;10:1274—85.
PRESSP.M. Graves et al.
22. Emerson PM, Ngondi J, Shargie EB, Graves PM, Ejigsemahu Y,Gebre T, et al. Integrating an NTD with one of ‘the big three’:combined malaria and trachoma survey in Amhara region ofEthiopia. PLoS Negl Trop Dis 2008;2:e197.
23. Shargie EB, Gebre T, Ngondi J, Graves PM, Mosher AW, Emer-son PM, et al. Malaria prevalence and mosquito net coveragein Oromia and SNNPR regions of Ethiopia. BMC Public Health2008;8:321.
24. Central Statistical Agency of Ethiopia. National Data Archiveof Ethiopia. Ethiopia Population 2006 [updated 16 September2007]. http://www.csa.gov.et [accessed 1 August 2008].
25. FMOH. Health and health related indicators, Ethiopian calen-dar 1999 (2006/07). Addis Ababa: Federal Democratic Republicof Ethiopia, Ministry of Health; 2007.
26. WHO. Malaria indicator survey: basic documentation for sur-vey design and implementation. Calverton, MD: Roll BackMalaria Monitoring and Evaluation Reference Group, WorldHealth Organization, United Nations Children’s Fund, MEASUREDHS, MEASURE Evaluation and US Centers for Disease Controland Prevention; 2005.
27. Vyas S, Kumaranayake L. Constructing socio-economic indices:how to use principal components analysis. Health Policy Plan2006;21:459—68.
28. FMOH. Malaria diagnosis and treatment: guidelines for healthworkers in Ethiopia. 2nd ed. Addis Ababa: Federal DemocraticRepublic of Ethiopia, Ministry of Health; 2004.
29. Stata. Stata survey data reference manual. College Station,TX: StataCorp LP; 2005.
30. Central Statistical Agency of Ethiopia and ORC Macro. Ethiopiademographic and health survey 2005. Addis Ababa andCalverton, MD: Central Statistical Agency and ORC Macro;
ousehold and environmental risk factors for malaria infec-c Trop Med Hyg (2009), doi:10.1016/j.trstmh.2008.11.016
factors associated with childhood febrile illnesses and treat-ment seeking behaviour in an area of epidemic malaria in ruralEthiopia. Trans R Soc Trop Med Hyg 2007;101:939—47.
Related Documents