Confidential. © 2017 IHS Markit TM . All Rights Reserved. Presentation Indiana Economic Forecast Update December 18, 2017 Tom Jackson, Principal Economist, +1 215 789 7432 [email protected] IHS Markit Economics

Welcome message from author
This document is posted to help you gain knowledge. Please leave a comment to let me know what you think about it! Share it to your friends and learn new things together.
Transcript

Confidential. © 2017 IHS MarkitTM. All Rights Reserved.
Presentation
Indiana Economic Forecast UpdateDecember 18, 2017
Tom Jackson, Principal Economist, +1 215 789 7432 [email protected]
IHS Markit Economics
Confidential. © 2017 IHS MarkitTM. All Rights Reserved.
The US economy will sustain above-trend growth
Indiana Economic Forecast Update / December 2017
• The US economy began 2017 on a weak note – since then growth has averaged nearly 3.0%.
• With the strong momentum at the end of the year, IHS Markit expects growth in calendar year 2018 to be 2.6%, above the 2.3% in 2017 and well above the 1.5% in 2016.
• Strong economic fundamentals will sustain this above-trend growth.
• Financial conditions remain supportive, household balance sheets are improving, the US dollar is off its peak, and capacity utilization rates are high.
• Moreover, there are no obvious imbalances that could threaten the expansion.
• With trend growth estimated to be around 2.0%, this means the unemployment rate will be pushed below 4.0%.
• If the Republican Tax Cuts and Jobs Act is passed by the full Congress, it would raise growth 0.3 percentage points per year from 2018 to 2020, push down the unemployment rate even lower, and push up interest rates and the dollar even more.
2
Confidential. © 2017 IHS MarkitTM. All Rights Reserved.
Changes to forecast since April update
Indiana Economic Forecast Update / December 2017
• Higher manufacturing employment, production• State-level employment data revised higher for Indiana
• National outlook has improved
• Demand for durables is improving, especially from fixed business investment
• Global economy has been much better than expected, from the European Union to emerging markets; this has lowered the dollar, increased exports
• Wage levels for Indiana and the US were revised down for 2016, which lowered the baseline moving forward
• Overall employment growth rate slightly higher, as national economy better than expected
3

Confidential. © 2017 IHS MarkitTM. All Rights Reserved.
Indiana’s real GSP growth outpaces payroll growth, indicating higher productivity
4
-6
-3
0
3
6
9
12
15
18
2010 2012 2014 2016 2018 2020
Real GSP Employment
Indiana real GSP and payroll employment
Perc
ent c
hang
e, a
nnua
l rat
e
Source: IHS Markit © 2017 IHS
Confidential. © 2017 IHS MarkitTM. All Rights Reserved.
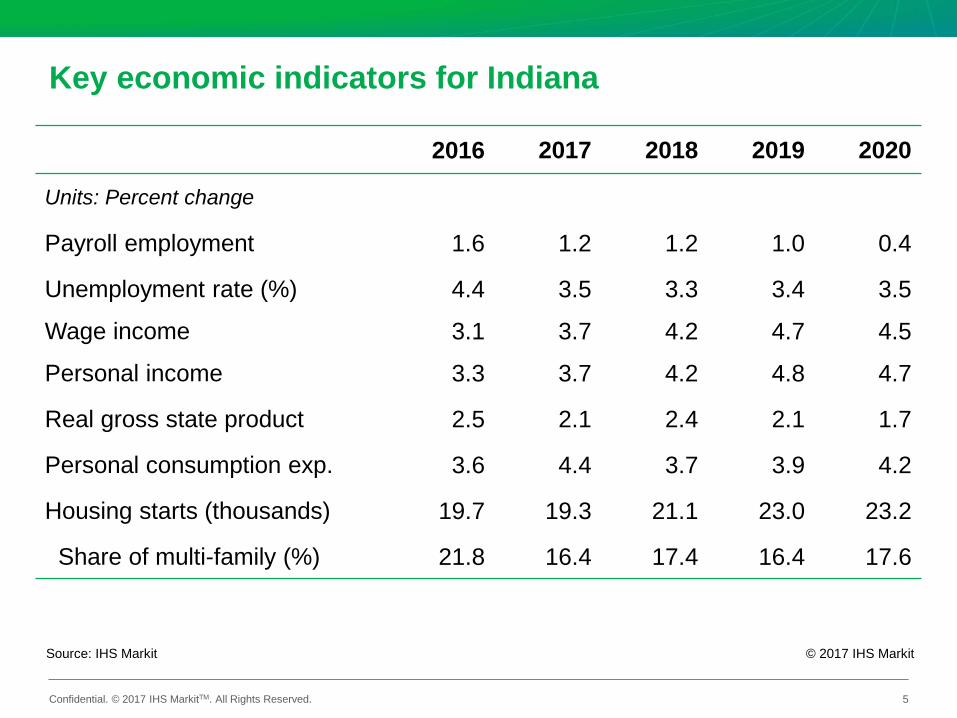
Key economic indicators for Indiana
5
2016 2017 2018 2019 2020
Units: Percent change
Payroll employment 1.6 1.2 1.2 1.0 0.4
Unemployment rate (%) 4.4 3.5 3.3 3.4 3.5
Wage income 3.1 3.7 4.2 4.7 4.5
Personal income 3.3 3.7 4.2 4.8 4.7
Real gross state product 2.5 2.1 2.4 2.1 1.7
Personal consumption exp. 3.6 4.4 3.7 3.9 4.2
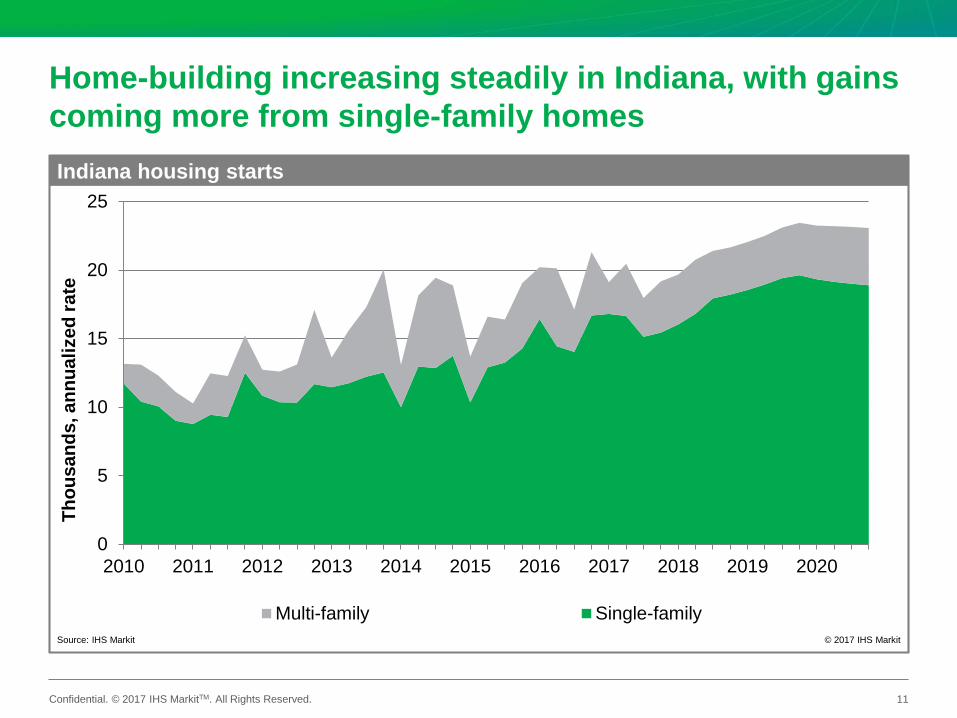
Housing starts (thousands) 19.7 19.3 21.1 23.0 23.2
Share of multi-family (%) 21.8 16.4 17.4 16.4 17.6
Source: IHS Markit © 2017 IHS Markit
Confidential. © 2017 IHS MarkitTM. All Rights Reserved.
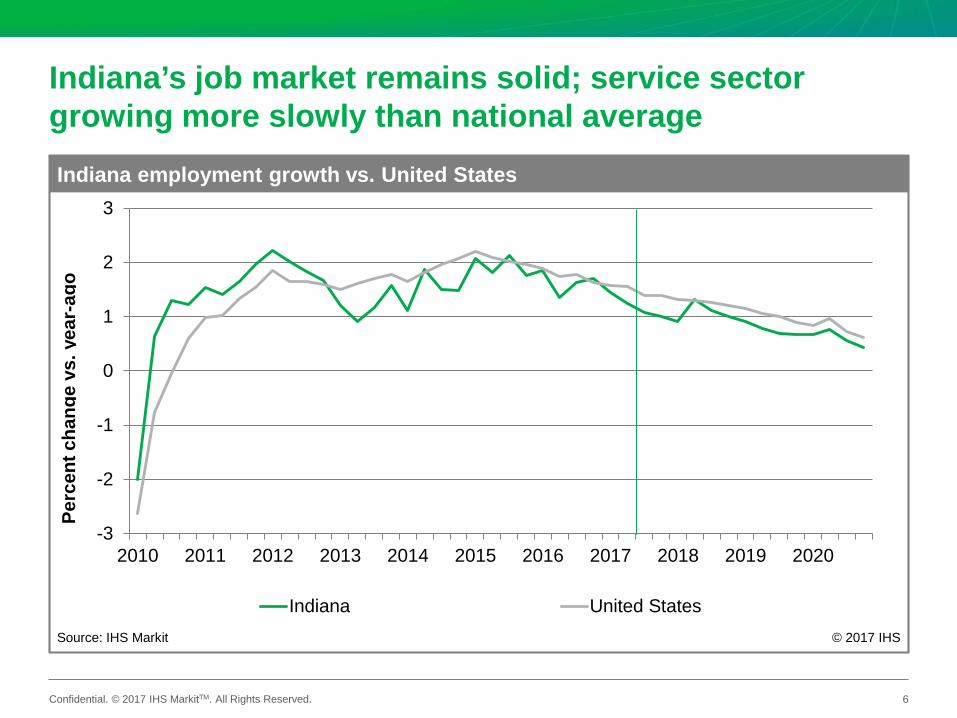
Indiana’s job market remains solid; service sector growing more slowly than national average
6
-3
-2
-1
0
1
2
3
2010 2011 2012 2013 2014 2015 2016 2017 2018 2019 2020
Indiana United States
Indiana employment growth vs. United States
Perc
ent c
hang
e vs
. yea
r-ag
o
Source: IHS Markit © 2017 IHS
Confidential. © 2017 IHS MarkitTM. All Rights Reserved.
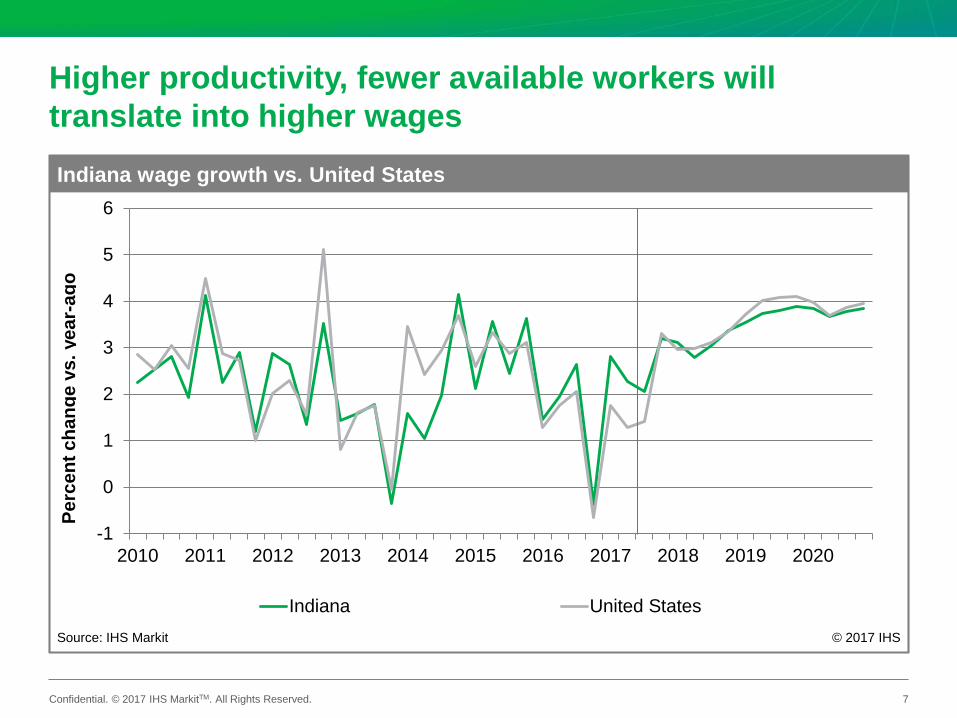
Higher productivity, fewer available workers will translate into higher wages
7
-1
0
1
2
3
4
5
6
2010 2011 2012 2013 2014 2015 2016 2017 2018 2019 2020
Indiana United States
Indiana wage growth vs. United States
Perc
ent c
hang
e vs
. yea
r-ag
o
Source: IHS Markit © 2017 IHS
Confidential. © 2017 IHS MarkitTM. All Rights Reserved.
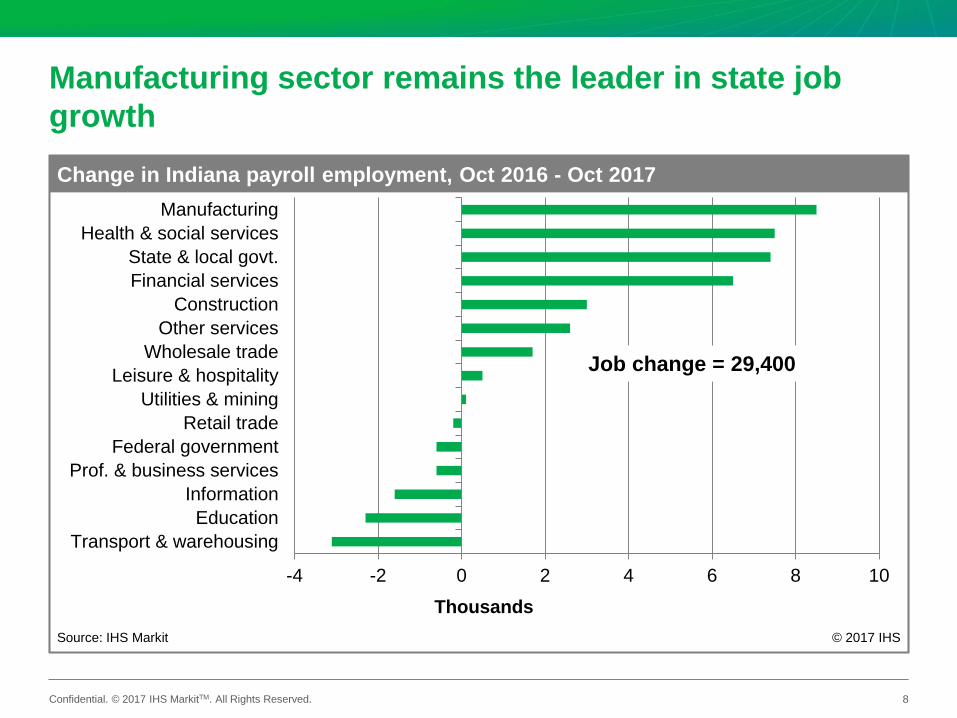
Manufacturing sector remains the leader in state job growth
8
-4 -2 0 2 4 6 8 10
Transport & warehousingEducation
InformationProf. & business services
Federal governmentRetail trade
Utilities & miningLeisure & hospitality
Wholesale tradeOther services
ConstructionFinancial servicesState & local govt.
Health & social servicesManufacturing
Change in Indiana payroll employment, Oct 2016 - Oct 2017
ThousandsSource: IHS Markit © 2017 IHS
Job change = 29,400
Confidential. © 2017 IHS MarkitTM. All Rights Reserved.
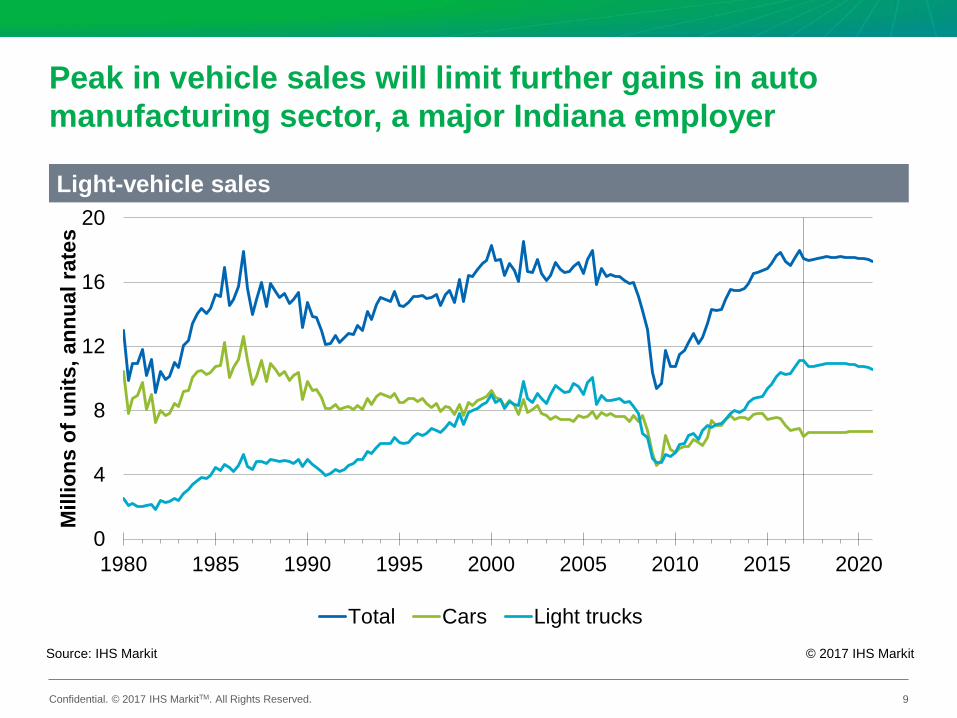
Peak in vehicle sales will limit further gains in auto manufacturing sector, a major Indiana employer
9
Source: IHS Markit © 2017 IHS Markit
Light-vehicle sales
0
4
8
12
16
20
1980 1985 1990 1995 2000 2005 2010 2015 2020
Mill
ions
of u
nits
, ann
ual r
ates
Total Cars Light trucks
Confidential. © 2017 IHS MarkitTM. All Rights Reserved.
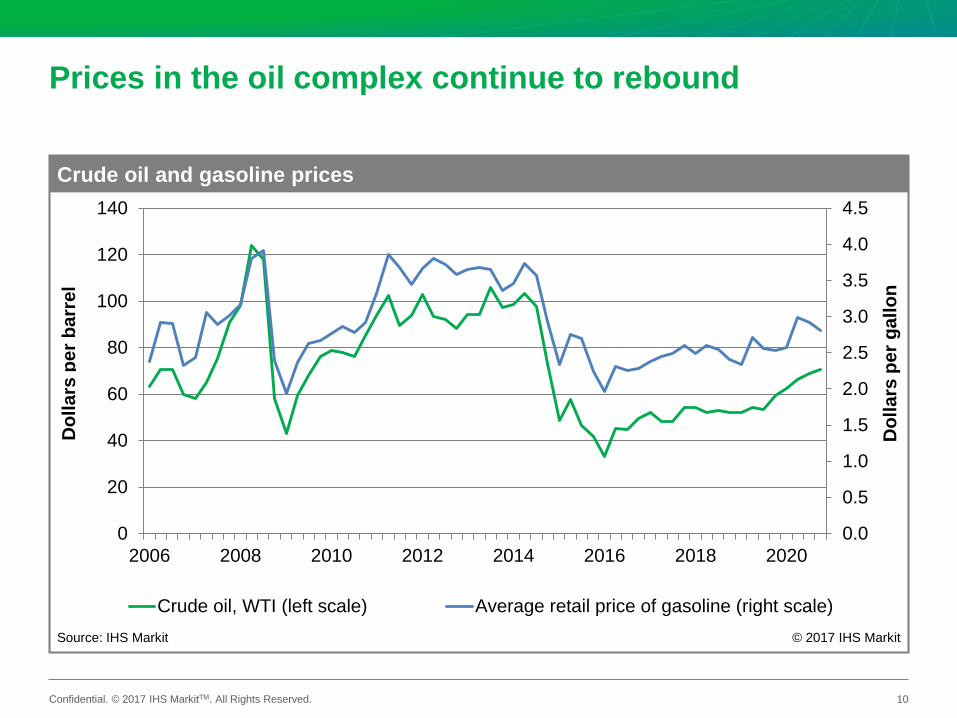
Prices in the oil complex continue to rebound
10
0.0
0.5
1.0
1.5
2.0
2.5
3.0
3.5
4.0
4.5
0
20
40
60
80
100
120
140
2006 2008 2010 2012 2014 2016 2018 2020
Crude oil, WTI (left scale) Average retail price of gasoline (right scale)
Crude oil and gasoline prices
Dol
lars
per
bar
rel
Dol
lars
per g
allo
n
Source: IHS Markit © 2017 IHS Markit
Confidential. © 2017 IHS MarkitTM. All Rights Reserved.
Home-building increasing steadily in Indiana, with gains coming more from single-family homes
11
0
5
10
15
20
25
2010 2011 2012 2013 2014 2015 2016 2017 2018 2019 2020
Multi-family Single-family
Indiana housing starts
Thou
sand
s,an
nual
ized
rate
Source: IHS Markit © 2017 IHS Markit
Confidential. © 2017 IHS MarkitTM. All Rights Reserved.
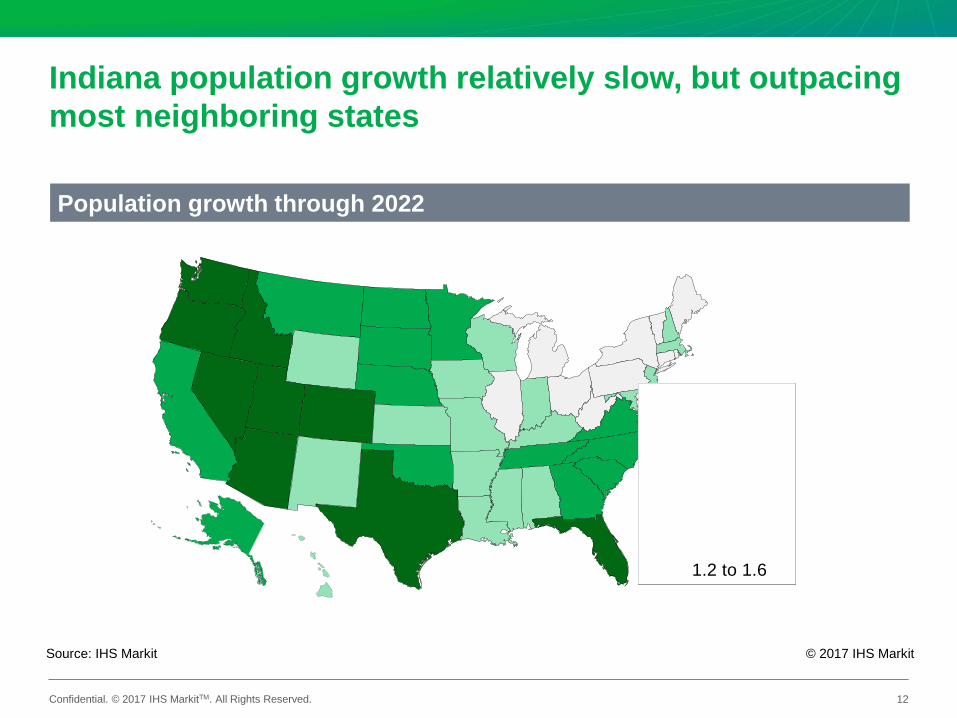
Indiana population growth relatively slow, but outpacing most neighboring states
12
Source: IHS Markit © 2017 IHS Markit
Population growth through 2022
Percent-0.1 to 0.2 0.3 to 0.6 0.7 to 1.1 1.2 to 1.6
Confidential. © 2017 IHS MarkitTM. All Rights Reserved.
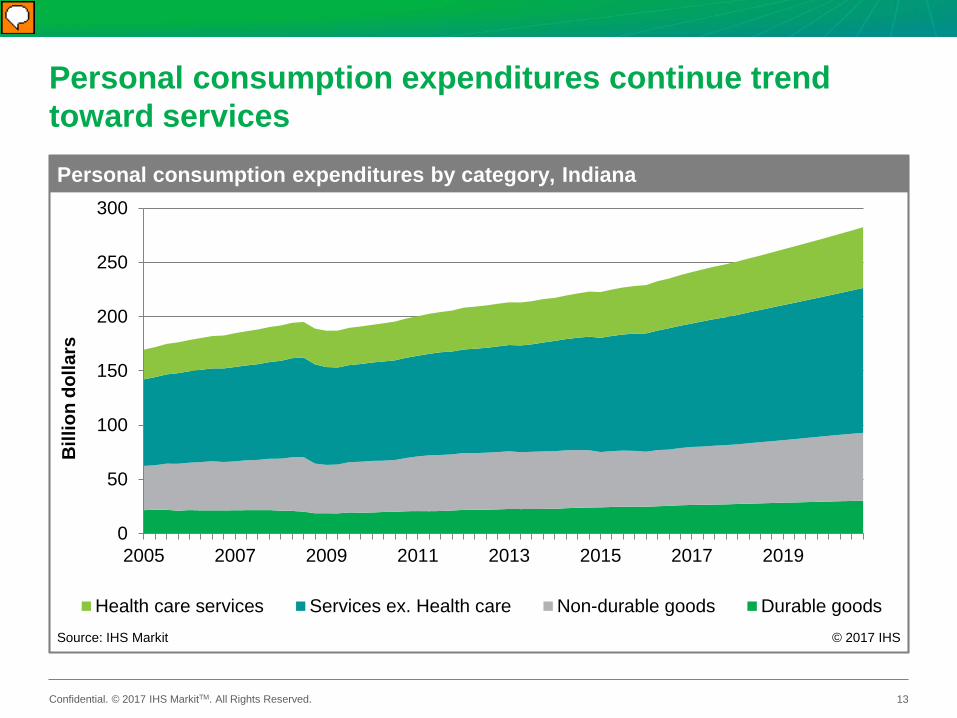
Personal consumption expenditures continue trend toward services
13
0
50
100
150
200
250
300
2005 2007 2009 2011 2013 2015 2017 2019
Health care services Services ex. Health care Non-durable goods Durable goods
Personal consumption expenditures by category, Indiana
Bill
ion
dolla
rs
Source: IHS Markit © 2017 IHS
Presenter
Presentation Notes
Average annual growth rates from 2005-2020: Health care: 4.8% Other services: 3.2% Non-durables: 2.5% Durables: 1.8%
Confidential. © 2017 IHS MarkitTM. All Rights Reserved.
Bottom line for Indiana• Wage and salary income continues steady growth, even with downward
revision in 2016• Gains will need to come from wage rates more than payroll growth as state
approaches full employment• Manufacturing still has some room to grow, even as auto sales level off
• Out-migration of jobs is an ongoing risks factor, while automation looms• Continued increase in labor force is key to attracting and retaining employers
and sustaining state economic growth• This is difficult for states with low population growth• Achieved through in-migration and increased participation
• Service sector can be supported by strong education system, attractive business environment• High-tech sectors a bright spot in diversifying state’s economic base• Some sectors are dependent on local population growth as demand base
14
Source: IHS Markit © 2017 IHS Markit
Confidential. © 2017 IHS MarkitTM. All Rights Reserved.
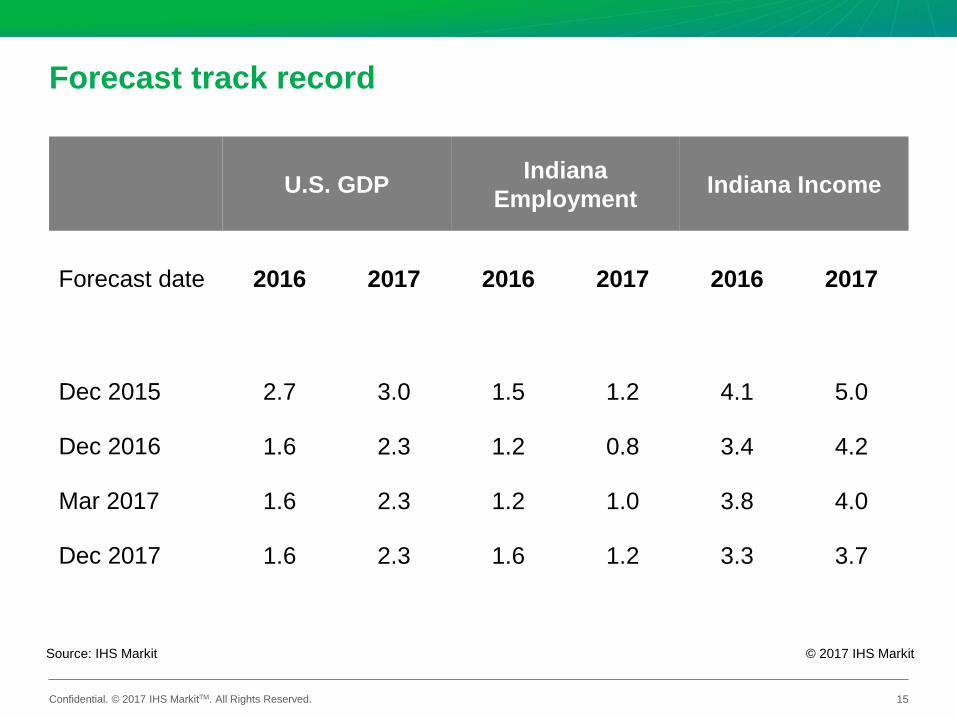
Forecast track record
U.S. GDP Indiana Employment Indiana Income
Forecast date 2016 2017 2016 2017 2016 2017
Dec 2015 2.7 3.0 1.5 1.2 4.1 5.0
Dec 2016 1.6 2.3 1.2 0.8 3.4 4.2
Mar 2017 1.6 2.3 1.2 1.0 3.8 4.0
Dec 2017 1.6 2.3 1.6 1.2 3.3 3.7
15
Source: IHS Markit © 2017 IHS Markit

Confidential. © 2017 IHS MarkitTM. All Rights Reserved.
US Economy Appendix
Indiana Economic Forecast Update / December 2017
16
Confidential. © 2017 IHS MarkitTM. All Rights Reserved.
The US economy on a solid growth path
Indiana Economic Forecast Update / December 2017
• The US economy has solid momentum after 3.3% annualized real GDP growth in the third quarter. Fourth-quarter growth is estimated at 2.6%.
• Consumer spending continues to drive US economic growth, supported by rising employment, real incomes, and household wealth.
• Business fixed investment will benefit from expanding global markets and an easing of regulatory policies, although commercial building is slowing.
• Increasing household formation by young adults, low supplies of homes for sale, and rising prices will encourage more homebuilding.
• The baseline forecast assumes no significant changes in US tax, infrastructure, healthcare, or international trade policies.
• The Federal Reserve is expected to gradually raise the federal funds rate to a high of 3.2% in 2021, overshooting its long-run equilibrium of 2.75%.
17
Confidential. © 2017 IHS MarkitTM. All Rights Reserved.
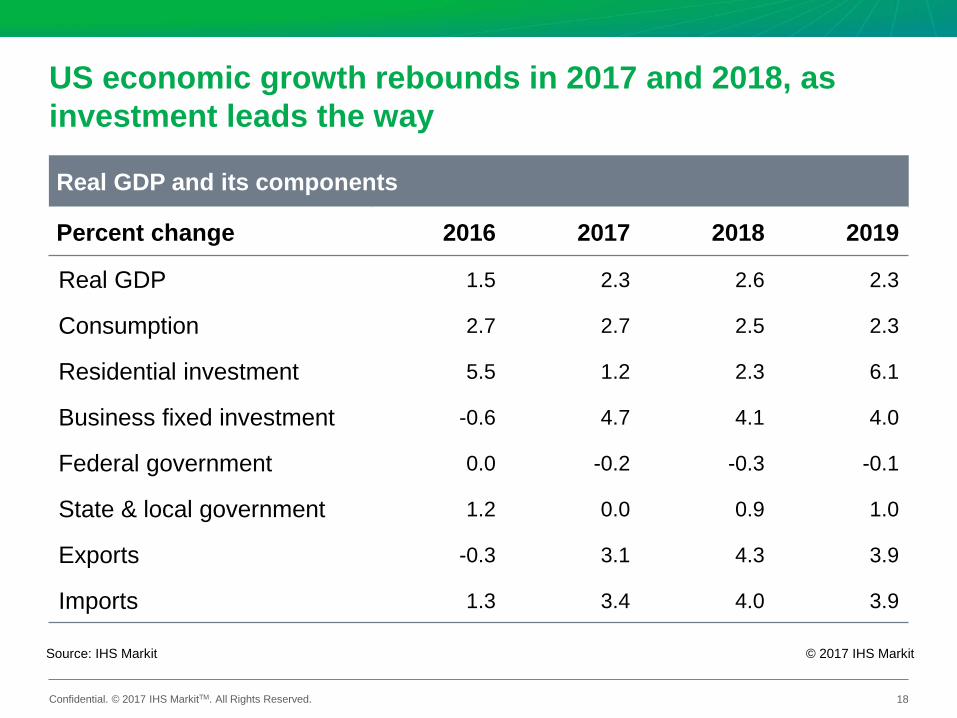
US economic growth rebounds in 2017 and 2018, as investment leads the way
18
Source: IHS Markit © 2017 IHS Markit
Real GDP and its components
Percent change 2016 2017 2018 2019
Real GDP 1.5 2.3 2.6 2.3
Consumption 2.7 2.7 2.5 2.3
Residential investment 5.5 1.2 2.3 6.1
Business fixed investment -0.6 4.7 4.1 4.0
Federal government 0.0 -0.2 -0.3 -0.1
State & local government 1.2 0.0 0.9 1.0
Exports -0.3 3.1 4.3 3.9
Imports 1.3 3.4 4.0 3.9
Confidential. © 2017 IHS MarkitTM. All Rights Reserved.
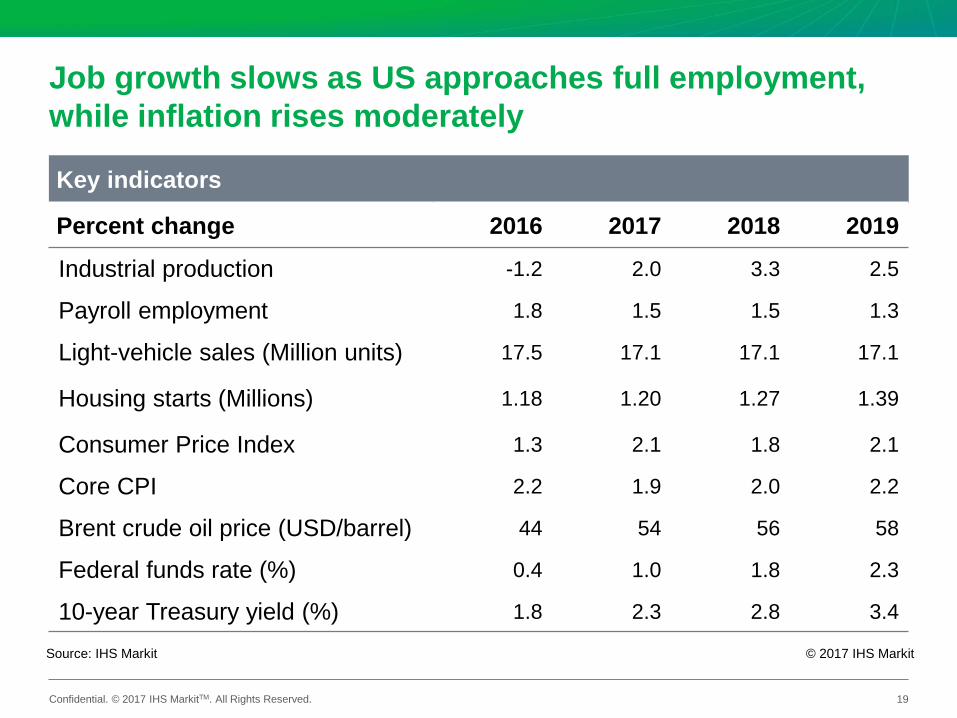
Job growth slows as US approaches full employment, while inflation rises moderately
19
Source: IHS Markit © 2017 IHS Markit
Key indicators
Percent change 2016 2017 2018 2019
Industrial production -1.2 2.0 3.3 2.5
Payroll employment 1.8 1.5 1.5 1.3
Light-vehicle sales (Million units) 17.5 17.1 17.1 17.1
Housing starts (Millions) 1.18 1.20 1.27 1.39
Consumer Price Index 1.3 2.1 1.8 2.1
Core CPI 2.2 1.9 2.0 2.2
Brent crude oil price (USD/barrel) 44 54 56 58
Federal funds rate (%) 0.4 1.0 1.8 2.3
10-year Treasury yield (%) 1.8 2.3 2.8 3.4
Confidential. © 2017 IHS MarkitTM. All Rights Reserved.
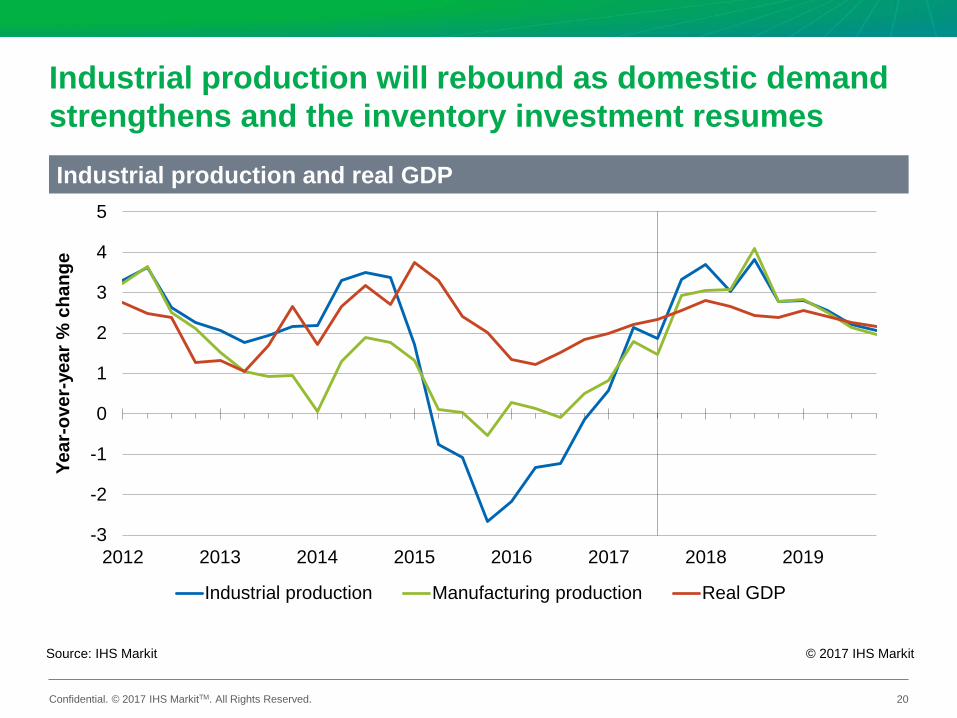
Industrial production will rebound as domestic demand strengthens and the inventory investment resumes
20
Source: IHS Markit © 2017 IHS Markit
Industrial production and real GDP
-3
-2
-1
0
1
2
3
4
5
2012 2013 2014 2015 2016 2017 2018 2019
Year
-ove
r-ye
ar %
cha
nge
Industrial production Manufacturing production Real GDP
Confidential. © 2017 IHS MarkitTM. All Rights Reserved.
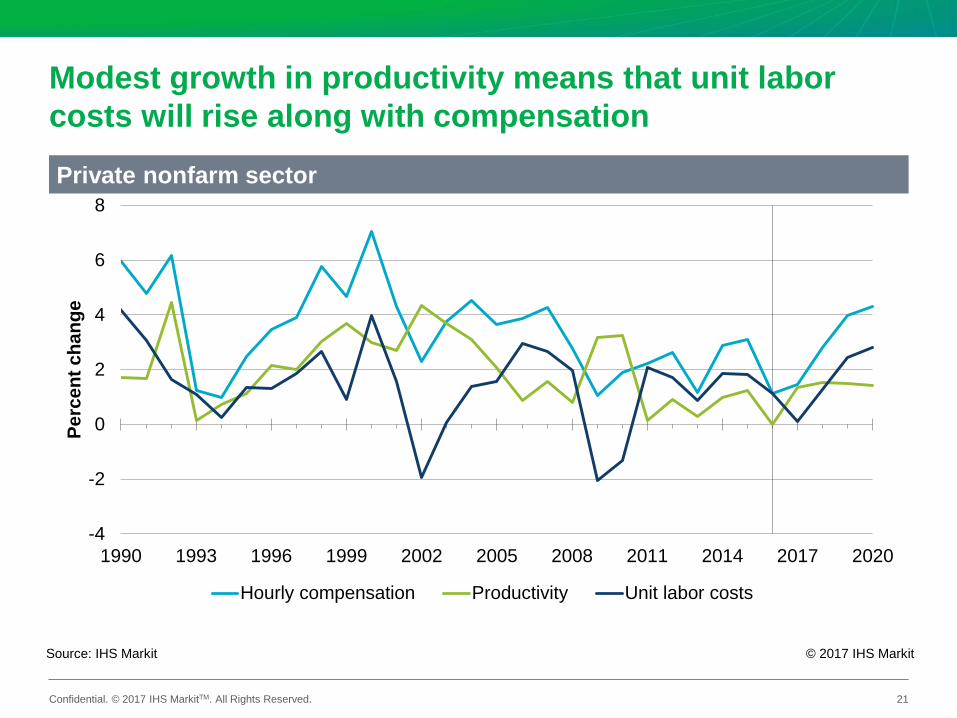
Modest growth in productivity means that unit labor costs will rise along with compensation
21
Source: IHS Markit © 2017 IHS Markit
Private nonfarm sector
-4
-2
0
2
4
6
8
1990 1993 1996 1999 2002 2005 2008 2011 2014 2017 2020
Perc
ent c
hang
e
Hourly compensation Productivity Unit labor costs
Confidential. © 2017 IHS MarkitTM. All Rights Reserved.
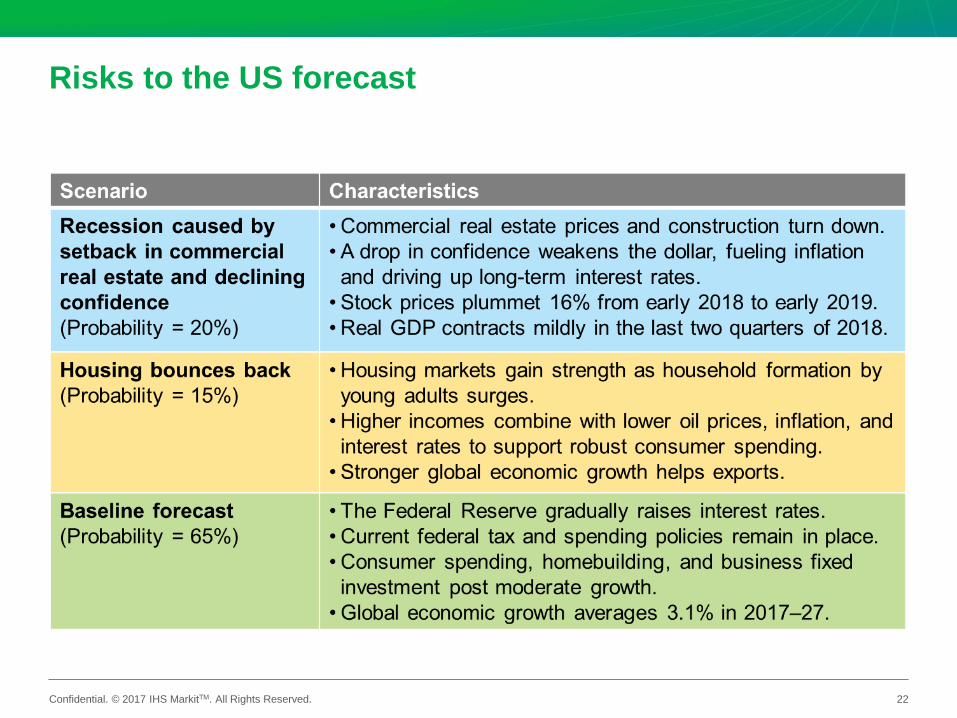
Risks to the US forecast
22
Related Documents


![10 5 09 Forecast Results Update[1]](https://static.cupdf.com/doc/110x72/54974103b47959143a8b4574/10-5-09-forecast-results-update1.jpg)