Mark Nowell Cisco 6/24/19 Cisco VNI Forecast update

Welcome message from author
This document is posted to help you gain knowledge. Please leave a comment to let me know what you think about it! Share it to your friends and learn new things together.
Transcript

Mark NowellCisco6/24/19
Cisco VNI Forecast update
© 2018 Cisco and/or its affiliates. All rights reserved. Cisco Public
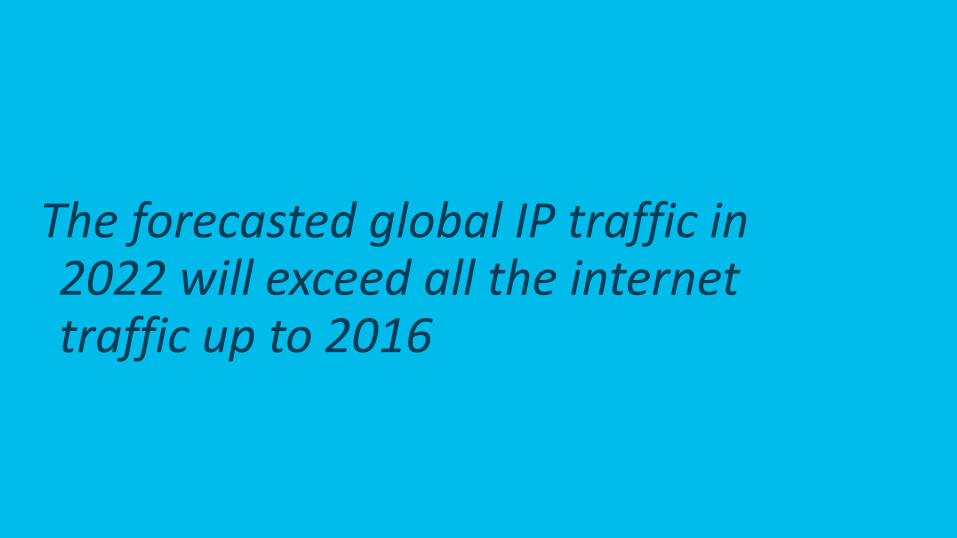
The forecasted global IP traffic in 2022 will exceed all the internet traffic up to 2016

© 2018 Cisco and/or its affiliates. All rights reserved. Cisco Public
• Started in 2006
• Broad distillation of numerous information sources to provide an aggregate view of traffic trends.
• Numerous subset analysis (eg region specific, mobile specific) available
Cisco’s public VNI site:
https://www.cisco.com/c/en/us/solutions/service-provider/visual-networking-index-vni/index.html
Includes a forecast tool to perform your own analysis.
Cisco VNI

Thomas Barnett, Jr. | Director, SP Thought LeadershipShruti Jain | Senior AnalystUsha Andra | Senior AnalystTaru Khurana | Senior Analyst
November 2018
2018 Global Presentation
Cisco Visual Networking Index (VNI) Complete Forecast Update, 2017–2022

© 2018 Cisco and/or its affiliates. All rights reserved. Cisco Public
Global Internet Growth and Trends
Source: Cisco VNI Global IP Traffic Forecast, 2017–2022
Key Digital Transformers
By 2022
2017
2022
3.4 Billion
4.8 Billion
18.0 Billion
28.5 Billion
39.0 Mbps
75.4 Mbps
75% of Traffic
82% of Traffic
More Devices &
Connections
Faster Broadband Speeds
More Video Viewing
More Internet
Users

© 2018 Cisco and/or its affiliates. All rights reserved. Cisco Public
Overview

© 2018 Cisco and/or its affiliates. All rights reserved. Cisco Public
4.8 zettabytes is equal to:
• Nearly 11X more than all IP traffic generated in 2012 (437 exabytes)
• All movies ever made crossing global IP networks in less than a minute (53 seconds)
By 2022, global IP traffic will reach an annual run rate of 4.8 zettabytes per year
Establishing the Zettabyte Era
Source: Cisco VNI Global IP Traffic Forecast, 2017–2022
• One trillion gigabytes
• Approximately 1021
(1,000,000,000,000,000,000,000 bytes)
What is a zettabyte?

© 2018 Cisco and/or its affiliates. All rights reserved. Cisco Public
VNI Projections and Actuals (Global)Actual growth has been within ±10% of projected growth
22.6%
27.4%
0%
5%
10%
15%
20%
25%
30%
2012-2017 CAGR
Projected in 2013
Actual (Reported in 2018)
Compound Annual
Growth Rate (CAGR)
Source: Cisco VNI Global IP Traffic Forecast, 2017–2022
© 2018 Cisco and/or its affiliates. All rights reserved. Cisco Public
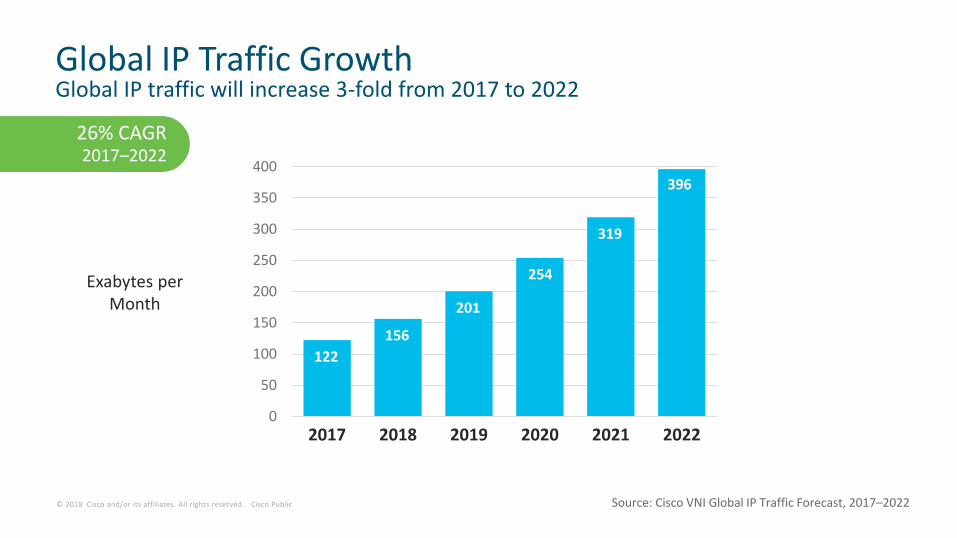
26% CAGR 2017–2022
Global IP Traffic Growth Global IP traffic will increase 3-fold from 2017 to 2022
122 156
201
254
319
396
0
50
100
150
200
250
300
350
400
2017 2018 2019 2020 2021 2022
Source: Cisco VNI Global IP Traffic Forecast, 2017–2022
Exabytes per Month

© 2018 Cisco and/or its affiliates. All rights reserved. Cisco Public
Global IP Traffic Growth by RegionMEA has the highest growth rate (41%) from 2017 to 2022APAC will generate 44% of all IP traffic by 2022
0
50
100
150
200
250
300
350
400
450
2017 2018 2019 2020 2021 2022
Latin America (LATAM) (21% CAGR)
Middle East and Africa (MEA) (41% CAGR)
Central and Eastern Europe (CEE) (26% CAGR)
Western Europe (WE) (22% CAGR)
North America (NA) (21% CAGR)
Asia Pacific (APAC) (32% CAGR)
Exabytes per Month
27.4%
43.6%
5.3%
12.6%
6.4%
4.8%
26% CAGR 2017–2022
Source: Cisco VNI Global IP Traffic Forecast, 2017–2022

© 2018 Cisco and/or its affiliates. All rights reserved. Cisco Public
Fixed and Mobile Growth in 2017Most countries have higher mobile than fixed growthBut there are a growing number of exceptions
AustraliaCanada
China
France
India
IndonesiaJapan
KoreaUK
US0%
20%40%60%80%
100%120%140%160%180%200%
0% 5% 10% 15% 20% 25% 30% 35% 40%
Mobile Growth in 2017
Fixed Internet Growth in 2017
Source: Cisco VNI Global IP Traffic Forecast, 2017–2022

© 2018 Cisco and/or its affiliates. All rights reserved. Cisco Public
Top Trends

© 2018 Cisco and/or its affiliates. All rights reserved. Cisco Public
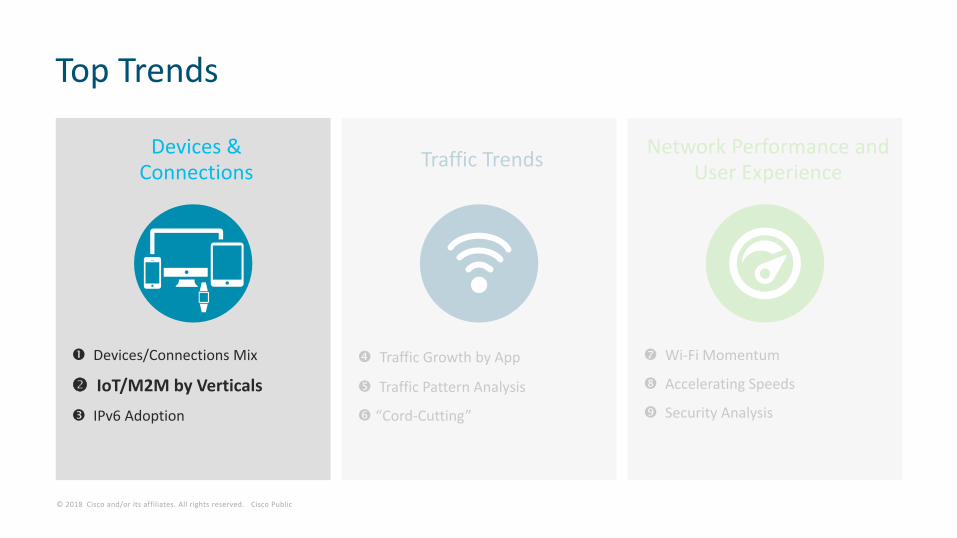
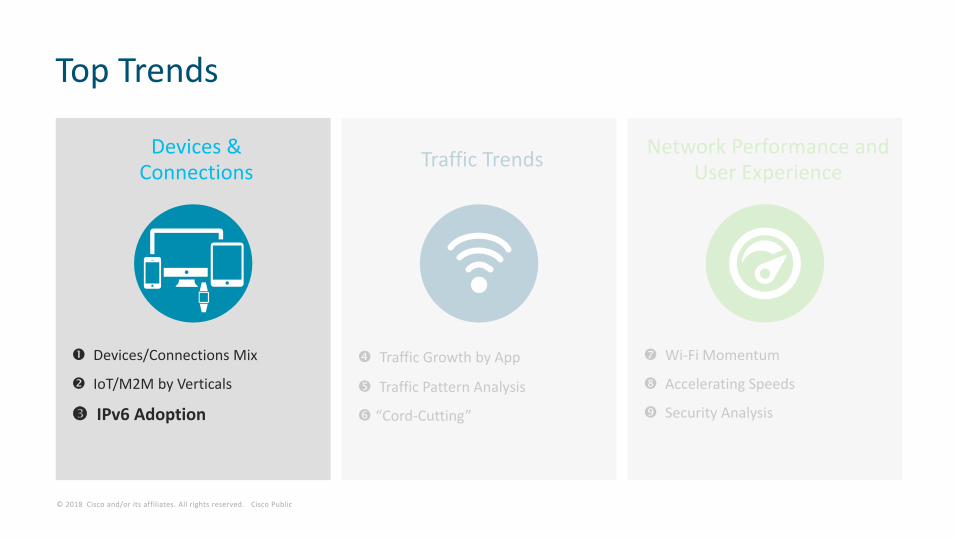
Top Trends
Devices & Connections
Devices/Connections Mix
IoT/M2M by Verticals
IPv6 Adoption
Traffic Trends
Traffic Growth by App
Traffic Pattern Analysis
“Cord-Cutting”
Network Performance and User Experience
Wi-Fi Momentum
Accelerating Speeds
Security Analysis

© 2018 Cisco and/or its affiliates. All rights reserved. Cisco Public
Global Device/Connection Growth by TypeBy 2022, M2M connections will be more than half of total connections
0
5
10
15
20
25
30
2017 2018 2019 2020 2021 2022
Other (1.6%,2.6%)
Tablets (3%,3%)
PCs (8%,4%)
TVs (13%,11%)
Non-Smartphones (16%,4%)
Smartphones (24%,24%)
M2M (34%, 51%)
Billions of Devices
* Figures (n) refer to 2017, 2022 device share
10% CAGR 2017–2022
Source: Cisco VNI Global IP Traffic Forecast, 2017–2022
© 2018 Cisco and/or its affiliates. All rights reserved. Cisco Public
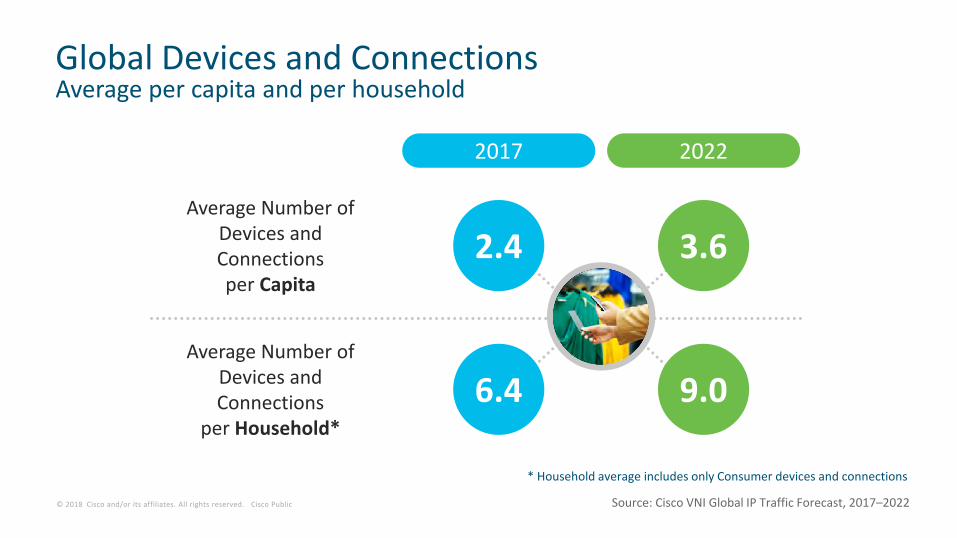
Global Devices and ConnectionsAverage per capita and per household
* Household average includes only Consumer devices and connections
Source: Cisco VNI Global IP Traffic Forecast, 2017–2022
Average Number of Devices and Connections per Capita
Average Number of Devices and Connections
per Household*
2017 2022
2.4
6.4
3.6
9.0

© 2018 Cisco and/or its affiliates. All rights reserved. Cisco Public
Global Video Capable Device Growth by TypeBy 2022, nearly half (48%) of total devices and connections will be video capable
0
2
4
6
8
10
12
14
16
2017 2018 2019 2020 2021 2022
Other (0.3%,0.2%)
Tablets (7%,6%)
PCs (15%,9%)
TVs (25%,24%)
Smartphones (47%,49%)
M2M (6%, 12%)
Billions of Devices
* Figures (n) refer to 2017, 2022 device share
8% CAGR 2017–2022
Source: Cisco VNI Global IP Traffic Forecast, 2017–2022
© 2018 Cisco and/or its affiliates. All rights reserved. Cisco Public
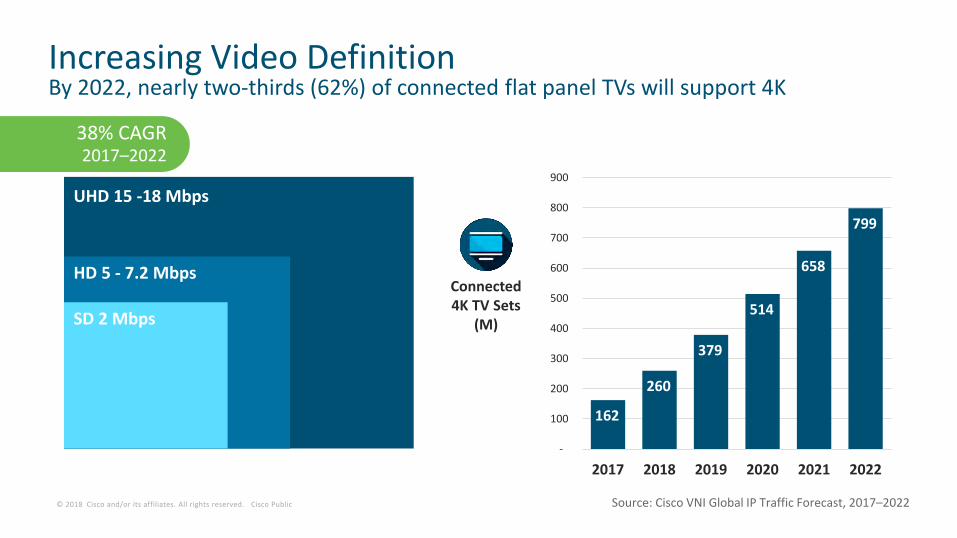
SD 2 Mbps
HD 5 - 7.2 Mbps
UHD 15 -18 Mbps
Connected 4K TV Sets
(M)
Increasing Video DefinitionBy 2022, nearly two-thirds (62%) of connected flat panel TVs will support 4K
162
260
379
514
658
799
-
100
200
300
400
500
600
700
800
900
2017 2018 2019 2020 2021 2022
Source: Cisco VNI Global IP Traffic Forecast, 2017–2022
38% CAGR 2017–2022
© 2018 Cisco and/or its affiliates. All rights reserved. Cisco Public
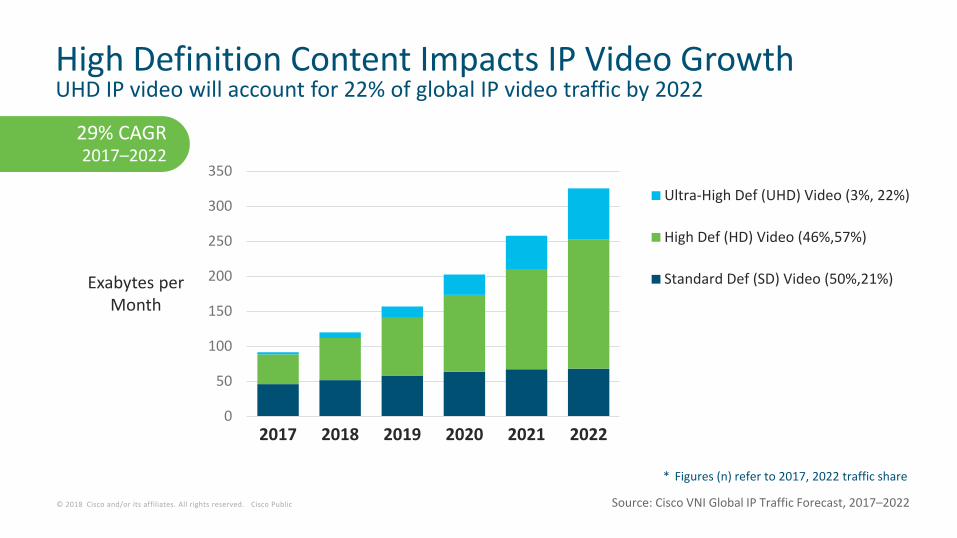
High Definition Content Impacts IP Video GrowthUHD IP video will account for 22% of global IP video traffic by 2022
0
50
100
150
200
250
300
350
2017 2018 2019 2020 2021 2022
Ultra-High Def (UHD) Video (3%, 22%)
High Def (HD) Video (46%,57%)
Standard Def (SD) Video (50%,21%)
* Figures (n) refer to 2017, 2022 traffic share
29% CAGR 2017–2022
Source: Cisco VNI Global IP Traffic Forecast, 2017–2022
Exabytes per Month

© 2018 Cisco and/or its affiliates. All rights reserved. Cisco Public
High Definition Content Impacts IP VoD GrowthUHD VoD will account for 35% of global IP VoD traffic by 2022
0
5
10
15
20
25
30
35
40
45
2017 2018 2019 2020 2021 2022
Ultra-High Def (UHD) VOD (2%, 35%)
High Def (HD) VOD (75%,61%)
Standard Def (SD) VOD (23%,4%)
* Figures (n) refer to 2017, 2022 traffic share
12% CAGR 2017–2022
Source: Cisco VNI Global IP Traffic Forecast, 2017–2022
Exabytes per Month
© 2018 Cisco and/or its affiliates. All rights reserved. Cisco Public
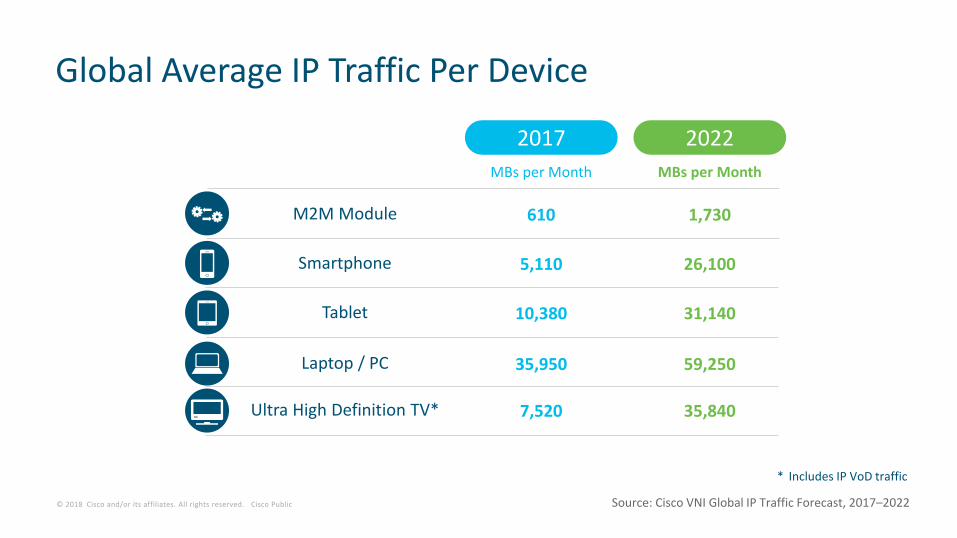
Global Average IP Traffic Per Device
MBs per Month MBs per Month
5,110 26,100
10,380 31,140
35,950 59,250
7,520 35,840
M2M Module
Tablet
Smartphone
Laptop / PC
610 1,730
Ultra High Definition TV*
* Includes IP VoD traffic
Source: Cisco VNI Global IP Traffic Forecast, 2017–2022
2017 2022

© 2018 Cisco and/or its affiliates. All rights reserved. Cisco Public
Global IP Traffic by Device TypeBy 2022, non-PC devices will drive 81% of global IP traffic
0
50
100
150
200
250
300
350
400
450
2017 2018 2019 2020 2021 2022
Other (0.01%,0.02%)
Non-Smartphones (0.1%,0.1%)
Tablets (5%,6%)
M2M (3%, 6%)
PCs (41%,19%)
TVs (32%,24%)
Smartphones (18%,44%)
* Figures (n) refer to 2017, 2022 traffic share
26% CAGR 2017–2022
Source: Cisco VNI Global IP Traffic Forecast, 2017–2022
Exabytes per Month

© 2018 Cisco and/or its affiliates. All rights reserved. Cisco Public
Global Internet Traffic by Device TypeBy 2022, non-PC devices will drive 81% of global Internet traffic
0
50
100
150
200
250
300
350
400
2017 2018 2019 2020 2021 2022
Other (0.01%,0.03%)
Non-Smartphones (0.2%,0.1%)
Tablets (7%,7%)
M2M (4%, 7%)
TVs (17%,16%)
PCs (49%,19%)
Smartphones (23%,50%)
Exabytes per Month
* Figures (n) refer to 2017, 2022 traffic share
30% CAGR 2017–2022
Source: Cisco VNI Global IP Traffic Forecast, 2017–2022
© 2018 Cisco and/or its affiliates. All rights reserved. Cisco Public
Top Trends
Devices & Connections
Devices/Connections Mix
IoT/M2M by Verticals
IPv6 Adoption
Traffic Trends
Traffic Growth by App
Traffic Pattern Analysis
“Cord-Cutting”
Network Performance and User Experience
Wi-Fi Momentum
Accelerating Speeds
Security Analysis
© 2018 Cisco and/or its affiliates. All rights reserved. Cisco Public
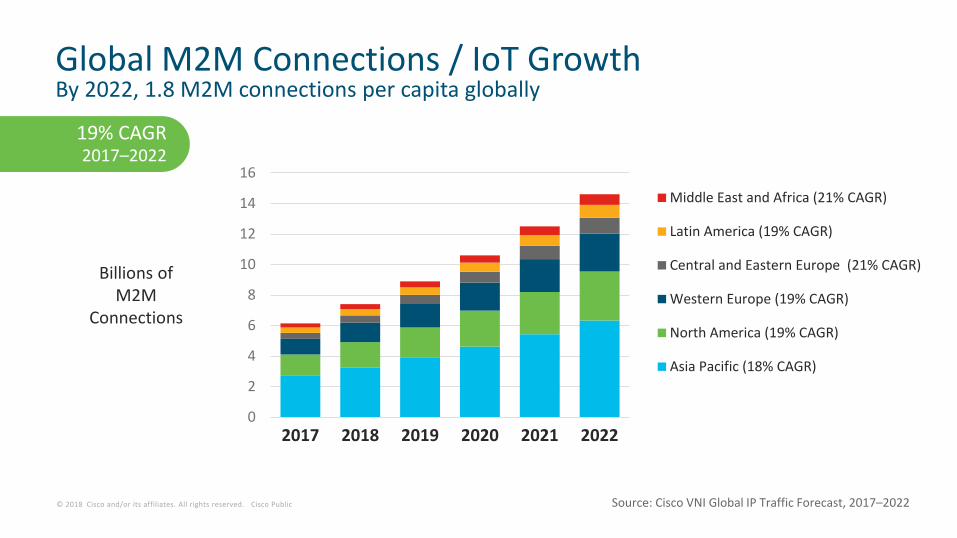
Global M2M Connections / IoT GrowthBy 2022, 1.8 M2M connections per capita globally
0
2
4
6
8
10
12
14
16
2017 2018 2019 2020 2021 2022
Middle East and Africa (21% CAGR)
Latin America (19% CAGR)
Central and Eastern Europe (21% CAGR)
Western Europe (19% CAGR)
North America (19% CAGR)
Asia Pacific (18% CAGR)
Billions of M2M
Connections
19% CAGR 2017–2022
Source: Cisco VNI Global IP Traffic Forecast, 2017–2022

© 2018 Cisco and/or its affiliates. All rights reserved. Cisco Public
47% CAGR 2017–2022
Global M2M Traffic GrowthM2M traffic will grow more than 7-fold from 2017 to 2022
0
5
10
15
20
25
30
2017 2018 2019 2020 2021 2022
Middle East and Africa (51% CAGR)
Latin America (52% CAGR)
Central and Eastern Europe (57% CAGR)
Western Europe (45% CAGR)
North America (42% CAGR)
Asia Pacific (49% CAGR)
Exabytesper Month
5.6%
Source: Cisco VNI Global IP Traffic Forecast, 2017–2022

© 2018 Cisco and/or its affiliates. All rights reserved. Cisco Public© 2018 Cisco and/or its affiliates. All rights reserved. Cisco Public
By 2022, M2M modules will be 51% (14.6 billion) of total global devices and connections and will account for 6% (25.3 EBs/month) of total global IP traffic.
Source: Cisco VNI Global IP Traffic Forecast, 2017–2022
© 2018 Cisco and/or its affiliates. All rights reserved. Cisco Public
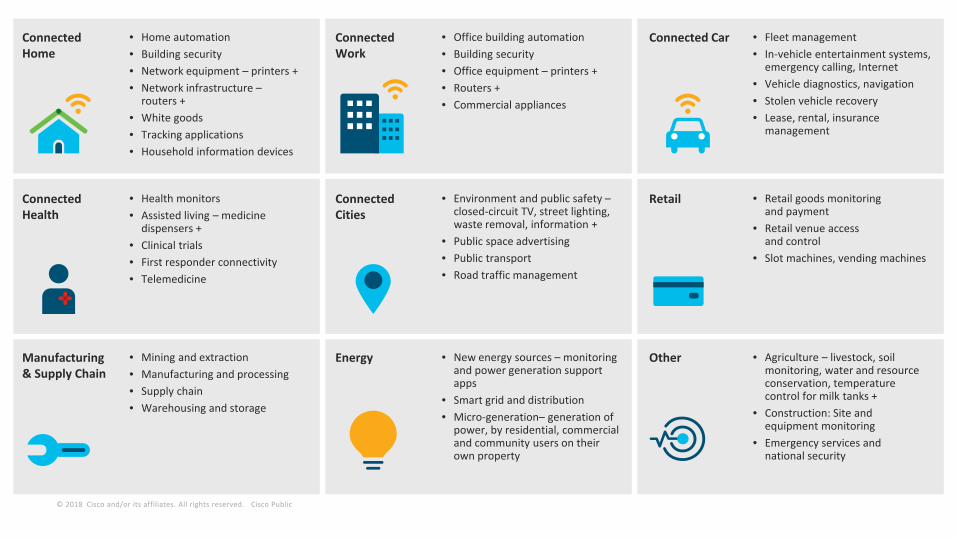
Connected Home
• Home automation• Building security• Network equipment – printers +• Network infrastructure –
routers +• White goods• Tracking applications• Household information devices
Connected Health
• Health monitors• Assisted living – medicine
dispensers +• Clinical trials• First responder connectivity• Telemedicine
Manufacturing & Supply Chain
• Mining and extraction• Manufacturing and processing• Supply chain• Warehousing and storage
Connected Work
• Office building automation• Building security• Office equipment – printers +• Routers +• Commercial appliances
Connected Cities
• Environment and public safety –closed-circuit TV, street lighting, waste removal, information +
• Public space advertising• Public transport• Road traffic management
Energy • New energy sources – monitoring and power generation support apps
• Smart grid and distribution• Micro-generation– generation of
power, by residential, commercial and community users on their own property
Connected Car • Fleet management• In-vehicle entertainment systems,
emergency calling, Internet • Vehicle diagnostics, navigation• Stolen vehicle recovery• Lease, rental, insurance
management
Retail • Retail goods monitoring and payment
• Retail venue access and control
• Slot machines, vending machines
Other • Agriculture – livestock, soil monitoring, water and resource conservation, temperature control for milk tanks +
• Construction: Site and equipment monitoring
• Emergency services and national security

© 2018 Cisco and/or its affiliates. All rights reserved. Cisco Public
Global M2M Connections / IoT Growth by VerticalBy 2022, connected home largest, connected car fastest growth
0
2
4
6
8
10
12
14
16
2017 2018 2019 2020 2021 2022
Other (30% CAGR)
Energy (24% CAGR)
Retail (10% CAGR)
Mfg & Supply Chain (10% CAGR)
Connected Car (28% CAGR)
Connected Cities (26% CAGR)
Connected Health (22% CAGR)
Connected Work (15% CAGR)
Connected Home (20% CAGR)
Billions of M2M
Connections
19% CAGR 2017–2022
Source: Cisco VNI Global IP Traffic Forecast, 2017–2022
© 2018 Cisco and/or its affiliates. All rights reserved. Cisco Public
Top Trends
Devices & Connections
Devices/Connections Mix
IoT/M2M by Verticals
IPv6 Adoption
Traffic Trends
Traffic Growth by App
Traffic Pattern Analysis
“Cord-Cutting”
Network Performance and User Experience
Wi-Fi Momentum
Accelerating Speeds
Security Analysis

© 2018 Cisco and/or its affiliates. All rights reserved. Cisco Public
0
2
4
6
8
10
12
14
16
18
20
2017 2018 2019 2020 2021 2022
IPv6 Capable Mobile Devices
IPv6 Capable Fixed Devices
4 B
8.9 B
1.8 B
Global IPv6-Capable Devices/Connections By 2022, 64% of devices/connections will be IPv6-capable
9.4 B
Number of Devices (Billions)
Source: Cisco VNI Global IP Traffic Forecast, 2017–2022
26% CAGR 2017–2022
© 2018 Cisco and/or its affiliates. All rights reserved. Cisco Public
0
20
40
60
80
100
120
140
2017 2018 2019 2020 2021 2022
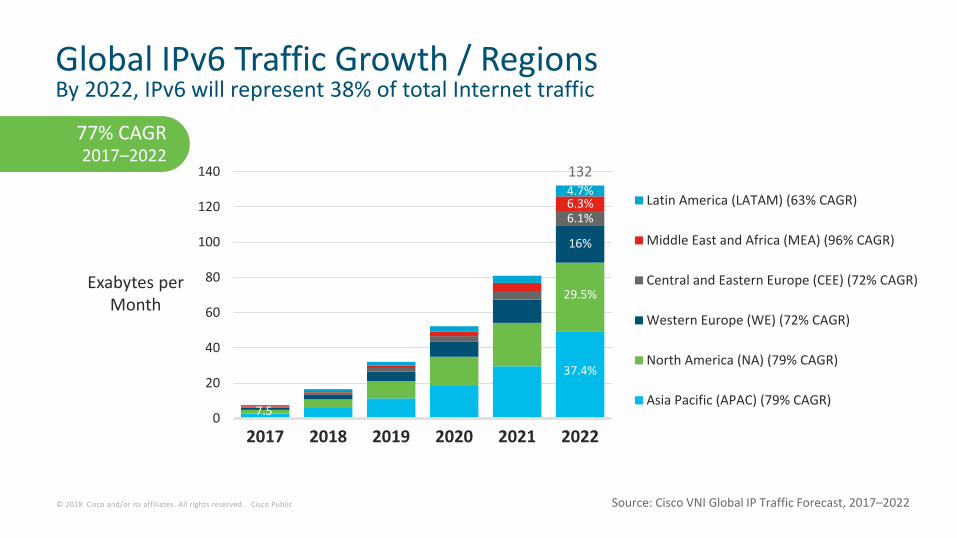
Latin America (LATAM) (63% CAGR)
Middle East and Africa (MEA) (96% CAGR)
Central and Eastern Europe (CEE) (72% CAGR)
Western Europe (WE) (72% CAGR)
North America (NA) (79% CAGR)
Asia Pacific (APAC) (79% CAGR)
Global IPv6 Traffic Growth / RegionsBy 2022, IPv6 will represent 38% of total Internet traffic
37.4%
Exabytes per Month
7.5
29.5%
16%
6.1%
4.7%6.3%
132
Source: Cisco VNI Global IP Traffic Forecast, 2017–2022
77% CAGR 2017–2022

© 2018 Cisco and/or its affiliates. All rights reserved. Cisco Public
Top Trends
Devices & Connections
Devices/Connections Mix
IoT/M2M by Verticals
IPv6 Adoption
Traffic Trends
Traffic Growth by App
Traffic Pattern Analysis
“Cord-Cutting”
Network Performance and User Experience
Wi-Fi Momentum
Accelerating Speeds
Security Analysis
© 2018 Cisco and/or its affiliates. All rights reserved. Cisco Public
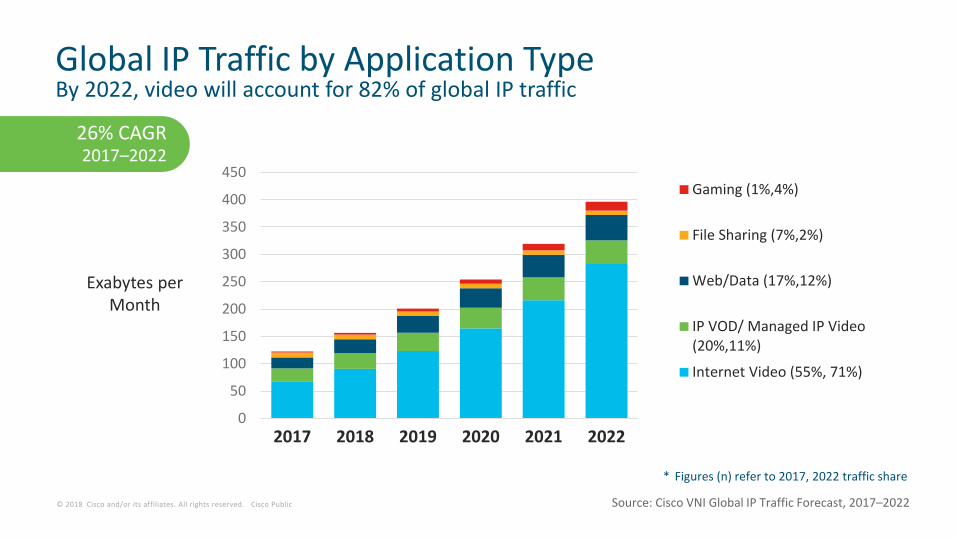
Global IP Traffic by Application TypeBy 2022, video will account for 82% of global IP traffic
0
50
100
150
200
250
300
350
400
450
2017 2018 2019 2020 2021 2022
Gaming (1%,4%)
File Sharing (7%,2%)
Web/Data (17%,12%)
IP VOD/ Managed IP Video(20%,11%)
Internet Video (55%, 71%)
Source: Cisco VNI Global IP Traffic Forecast, 2017–2022
26% CAGR 2017–2022
* Figures (n) refer to 2017, 2022 traffic share
Exabytes per Month

© 2018 Cisco and/or its affiliates. All rights reserved. Cisco Public
Global Internet Video Traffic by TypeBy 2022, live video will increase 15-fold and reach 17% of Internet video traffic
0
50
100
150
200
250
300
2017 2018 2019 2020 2021 2022
Video Surveillance (2%,3%)
Live Internet Video (5%,17%)
Long-Form Internet VoD (61%,62%)
Short-Form Internet VoD (32%, 18%)
Exabytes per Month
Source: Cisco VNI Global IP Traffic Forecast, 2017–2022
33% CAGR 2017–2022
* Figures (n) refer to 2017, 2022 traffic share
© 2018 Cisco and/or its affiliates. All rights reserved. Cisco Public© 2018 Cisco and/or its affiliates. All rights reserved. Cisco Public
Source: Cisco VNI Global IP Traffic Forecast, 2017–2022
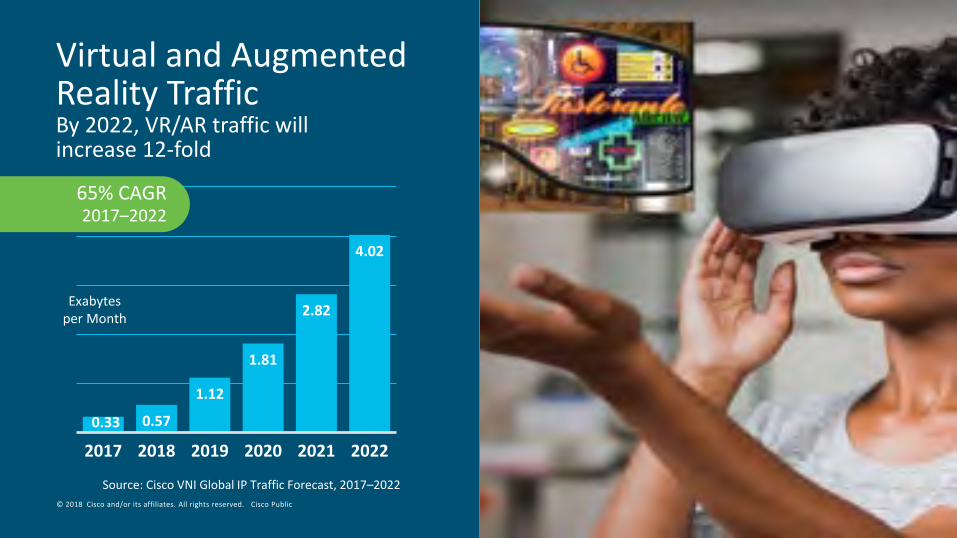
Virtual and Augmented Reality TrafficBy 2022, VR/AR traffic will increase 12-fold
0.33 0.57
1.12
1.81
2.82
4.02
2017 2018 2019 2020 2021 2022
Exabytesper Month
65% CAGR 2017–2022

© 2018 Cisco and/or its affiliates. All rights reserved. Cisco Public
Top Trends
Devices & Connections
Devices/Connections Mix
IoT/M2M by Verticals
IPv6 Adoption
Traffic Trends
Traffic Growth by App
Traffic Pattern Analysis
“Cord-Cutting”
Network Performance and User Experience
Wi-Fi Momentum
Accelerating Speeds
Security Analysis

© 2018 Cisco and/or its affiliates. All rights reserved. Cisco Public
Average Global Internet Bandwidth Usage
Average Trafficper User
per Month
Average Traffic per Household*per Month
2017 2022 Future?
29GB
82GB
85GB
240GB
Source: Cisco VNI Global IP Traffic Forecast, 2017–2022
200GB
500GB

© 2018 Cisco and/or its affiliates. All rights reserved. Cisco Public
Internet Households Reshape Usage LimitsInternet households exceeding 1 TB more than doubled in 2017
4.2
8.5
0.0
1.0
2.0
3.0
4.0
5.0
6.0
7.0
8.0
9.0
2016 2017
Source: Cisco VNI Global IP Traffic Forecast, 2017–2022
Terabyte Households
(Millions)
© 2018 Cisco and/or its affiliates. All rights reserved. Cisco Public
0
1
2
3
4
5
6
7
2017 2018 2019 2020 2021 2022
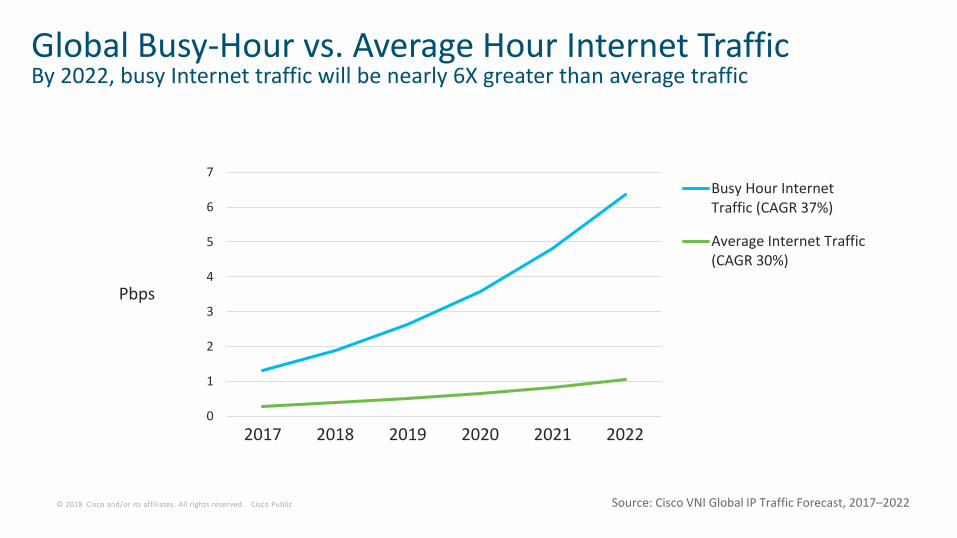
Busy Hour InternetTraffic (CAGR 37%)
Average Internet Traffic(CAGR 30%)
Global Busy-Hour vs. Average Hour Internet TrafficBy 2022, busy Internet traffic will be nearly 6X greater than average traffic
Source: Cisco VNI Global IP Traffic Forecast, 2017–2022
Pbps
© 2018 Cisco and/or its affiliates. All rights reserved. Cisco Public
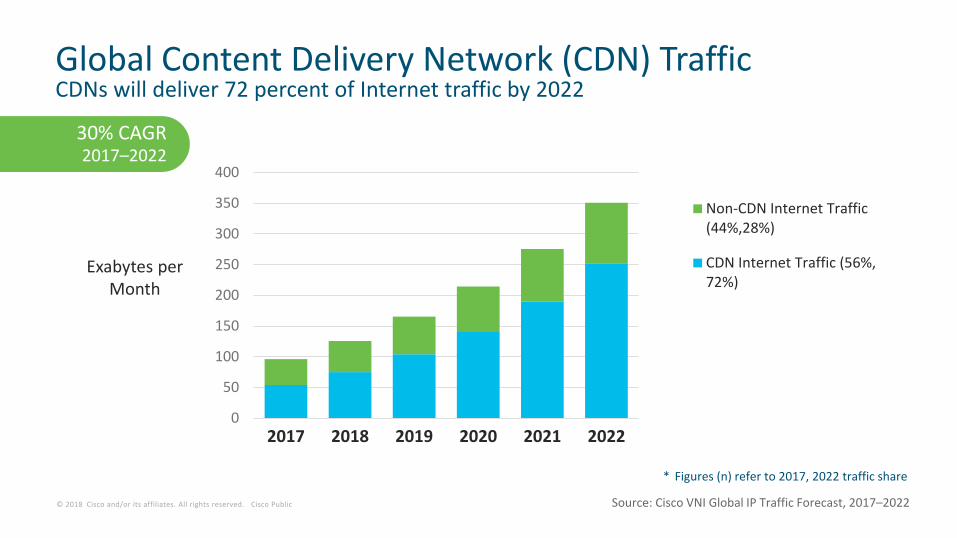
Global Content Delivery Network (CDN) TrafficCDNs will deliver 72 percent of Internet traffic by 2022
0
50
100
150
200
250
300
350
400
2017 2018 2019 2020 2021 2022
Non-CDN Internet Traffic(44%,28%)
CDN Internet Traffic (56%,72%)
Exabytes per Month
Source: Cisco VNI Global IP Traffic Forecast, 2017–2022
30% CAGR 2017–2022
* Figures (n) refer to 2017, 2022 traffic share

© 2018 Cisco and/or its affiliates. All rights reserved. Cisco Public
SP Network Capacity Moving Closer to the EdgeOver one-third of capacity will bypass core completely by 2022
Within Metro27% in 201733% by 2022
Core – Regional25% by 201724% by 2022
Core – Cross-Country48% in 201743% by 2022

© 2018 Cisco and/or its affiliates. All rights reserved. Cisco Public
Global Enterprise SD-WAN TrafficSD-WAN traffic will grow at a CAGR of 37% compared to 3% for traditional WAN SD-WAN will increase 5x and will be 29% of WAN traffic by 2022
0
1
2
3
4
5
6
2017 2018 2019 2020 2021 2022
SD-WAN Traffic (8.9%,28.8%)
Traditional IP WAN Traffic (91%,71.2%)Exabytes per
Month
Source: Cisco VNI Global IP Traffic Forecast, 2017–2022
9% CAGR 2017–2022
* Figures (n) refer to 2017, 2022 traffic share
© 2018 Cisco and/or its affiliates. All rights reserved. Cisco Public
Top Trends
Devices & Connections
Devices/Connections Mix
IoT/M2M by Verticals
IPv6 Adoption
Traffic Trends
Traffic Growth by App
Traffic Pattern Analysis
“Cord-Cutting”
Network Performance and User Experience
Wi-Fi Momentum
Accelerating Speeds
Security Analysis

© 2018 Cisco and/or its affiliates. All rights reserved. Cisco Public
Global Digital Media Adapters* GrowthBy 2022, DMAs will represent 9% of global Internet connected TVby 2022, DMAs will represent 18% of global Internet connected TV traffic
Digital Media Adapters
(M)173.0
204.6 231.8
252.0 265.2 273.7
0
50
100
150
200
250
300
2017 2018 2019 2020 2021 2022
6.3
8.5
10.9
13.2
15.3
17.1
0
2
4
6
8
10
12
14
16
18
2017 2018 2019 2020 2021 2022
DMA Traffic (EB/Month)
Source: Cisco VNI Global IP Traffic Forecast, 2017–2022
10% CAGR 2017–2022
* DMAs include devices such as Roku, Apple TV, Chromecast
22% CAGR 2017–2022
© 2018 Cisco and/or its affiliates. All rights reserved. Cisco Public
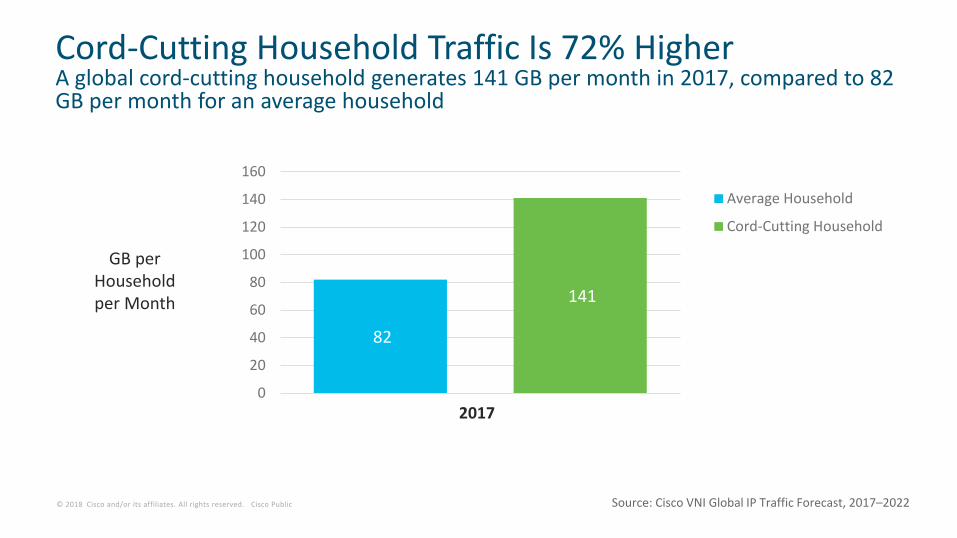
Cord-Cutting Household Traffic Is 72% HigherA global cord-cutting household generates 141 GB per month in 2017, compared to 82 GB per month for an average household
82
141
0
20
40
60
80
100
120
140
160
2017
Average Household
Cord-Cutting Household
GB per Household per Month
Source: Cisco VNI Global IP Traffic Forecast, 2017–2022

© 2018 Cisco and/or its affiliates. All rights reserved. Cisco Public
Top Trends
Devices & Connections
Devices/Connections Mix
IoT/M2M by Verticals
IPv6 Adoption
Traffic Trends
Traffic Growth by App
Traffic Pattern Analysis
“Cord-Cutting”
Network Performance and User Experience
Wi-Fi Momentum
Accelerating Speeds
Security Analysis

© 2018 Cisco and/or its affiliates. All rights reserved. Cisco Public
Global Wi-Fi Hotspot Coverage and AvailabilityExisting Growth Future
• Cellular offload (carrier driven)
• Community Wi-Fi/ homespots
• Carrier-grade VoWiFi
• TV everywhere
• Large events
• Big data analytics
• Public transportation Wi-Fi
• Wi-Fi Capacity trading
• Transaction platform
• Internet of things
• Context awareness
• HetNet Wi-Fi + mobile
• Connected car (in-car Wi-Fi)
Back to Trends Menu
Total Public WLAN + Community Hotspots
2017 2022
124 M 549 MTotal Incremental Hotspots ?
Source: Maravedis, Cisco VNI Global IP Traffic Forecast, 2017–2022
• Pay-as-you-go
• Free access promoting other services (Retail free Wi-Fi)
• Managed services (venues and outdoor)
• Cellular offload (user promoted)
• Added value for broadband subscription
• Advertising & sponsorship

© 2018 Cisco and/or its affiliates. All rights reserved. Cisco Public
35% CAGR 2017–2022
Global Public Wi-Fi HotspotsAsia Pacific leads with 261 Million (47%) Hotspots by 2022
0
100
200
300
400
500
600
2017 2018 2019 2020 2021 2022
Middle East and Africa (26% CAGR)
Central and Eastern Europe (30% CAGR)
Latin America (75% CAGR)
North America (26% CAGR)
Western Europe (17% CAGR)
Asia Pacific (57% CAGR)
Millions of Hotspots
23%
45%
4%
17%
9%
124
549
Source: Maravedis, Cisco VNI Global IP Traffic Forecast, 2017–2022
* Middle East and Africa represents 1% of global public Wi-Fi hotspots by 2022
© 2018 Cisco and/or its affiliates. All rights reserved. Cisco Public© 2018 Cisco and/or its affiliates. All rights reserved. Cisco Public
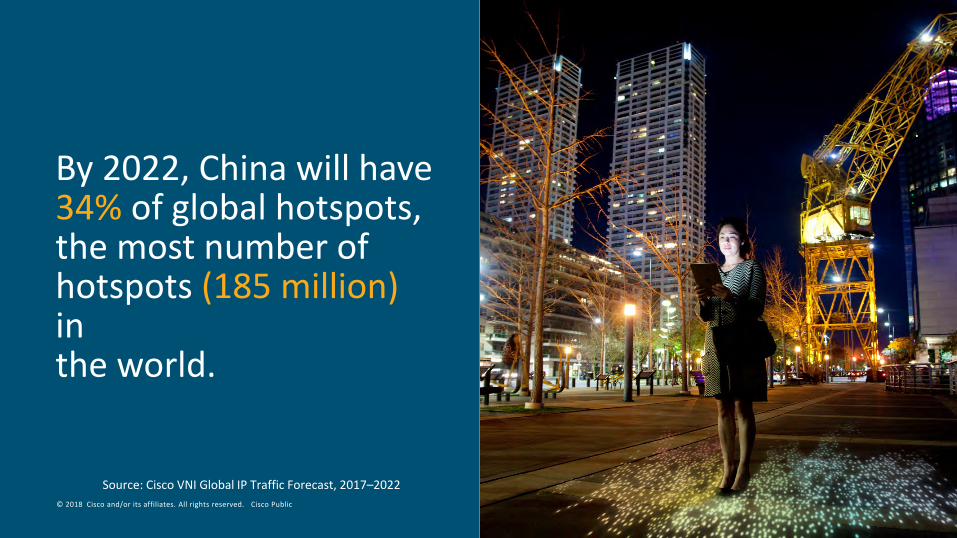
By 2022, China will have 34% of global hotspots, the most number of hotspots (185 million)in the world.
Source: Cisco VNI Global IP Traffic Forecast, 2017–2022
© 2018 Cisco and/or its affiliates. All rights reserved. Cisco Public
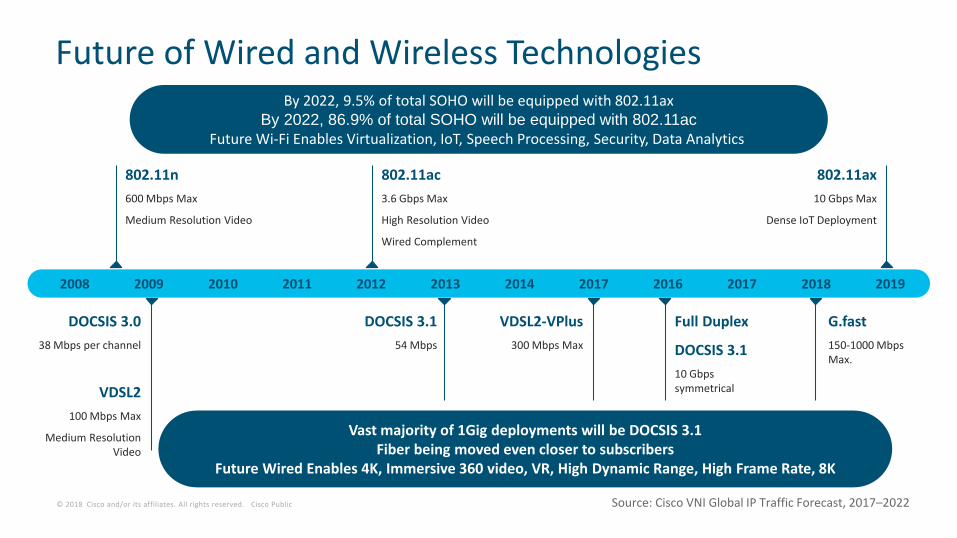
802.11n600 Mbps Max
Medium Resolution Video
802.11ac3.6 Gbps Max
High Resolution Video
Wired Complement
802.11ax10 Gbps Max
Dense IoT Deployment
DOCSIS 3.038 Mbps per channel
VDSL2100 Mbps Max
Medium Resolution Video
DOCSIS 3.154 Mbps
VDSL2-VPlus300 Mbps Max
G.fast150-1000 Mbps Max.
2008 2009 2010 2011 2012 2013 2014 2017 2016 2017 2018 2019
Future of Wired and Wireless Technologies
Full Duplex
DOCSIS 3.110 Gbps symmetrical
Source: Cisco VNI Global IP Traffic Forecast, 2017–2022
By 2022, 9.5% of total SOHO will be equipped with 802.11axBy 2022, 86.9% of total SOHO will be equipped with 802.11ac
Future Wi-Fi Enables Virtualization, IoT, Speech Processing, Security, Data Analytics
Vast majority of 1Gig deployments will be DOCSIS 3.1Fiber being moved even closer to subscribers
Future Wired Enables 4K, Immersive 360 video, VR, High Dynamic Range, High Frame Rate, 8K

© 2018 Cisco and/or its affiliates. All rights reserved. Cisco Public
Global IP Traffic by Local Access TechnologyBy 2022, 71% of total IP traffic will be wireless*
0
50
100
150
200
250
300
350
400
450
2017 2018 2019 2020 2021 2022
Mobile (46% CAGR)
Fixed/Wi-Fi from Wi-Fi-Only Devices (18%CAGR)
Fixed/Wi-Fi from Mobile Devices (53%CAGR)
Fixed/Wired (15% CAGR)
Exabytes per Month
28.1%
29.4%
22.9%
19.6%
Source: Cisco VNI Global IP Traffic Forecast, 2017–2022
26% CAGR 2017–2022
* Wireless traffic includes Wi-Fi and mobile

© 2018 Cisco and/or its affiliates. All rights reserved. Cisco Public
Global Internet Traffic by Local Access TechnologyBy 2022, 79% of total Internet traffic will be wireless*
0
50
100
150
200
250
300
350
400
2017 2018 2019 2020 2021 2022
Mobile (46% CAGR)
Fixed/Wi-Fi from Wi-Fi-Only Devices (17%CAGR)
Fixed/Wi-Fi from Mobile Devices (53%CAGR)
Fixed/Wired (18% CAGR)
31.8%
21.1%
25.0%
22.1%
Source: Cisco VNI Global IP Traffic Forecast, 2017–2022
30% CAGR 2017–2022
* Wireless traffic includes Wi-Fi and mobile
Exabytes per Month
© 2018 Cisco and/or its affiliates. All rights reserved. Cisco Public
Top Trends
Devices & Connections
Devices/Connections Mix
IoT/M2M by Verticals
IPv6 Adoption
Traffic Trends
Traffic Growth by App
Traffic Pattern Analysis
“Cord-Cutting”
Network Performance and User Experience
Wi-Fi Momentum
Accelerating Speeds
Security Analysis

© 2018 Cisco and/or its affiliates. All rights reserved. Cisco Public
Global Average Fixed Broadband SpeedsDoubling in speeds from 2017–2022
Global
BY REGIONAsia PacificLatin America
Central and Eastern Europe
North America
Middle East & Africa
39.0
46.211.7
37.932.8
43.2
7.8
75.4
98.828.1
76.046.7
94.2
20.2
Western Europe
GLOBALIn Mbps
Source: Cisco VNI Global IP Traffic Forecast, 2017–2022
2017 2022
© 2018 Cisco and/or its affiliates. All rights reserved. Cisco Public
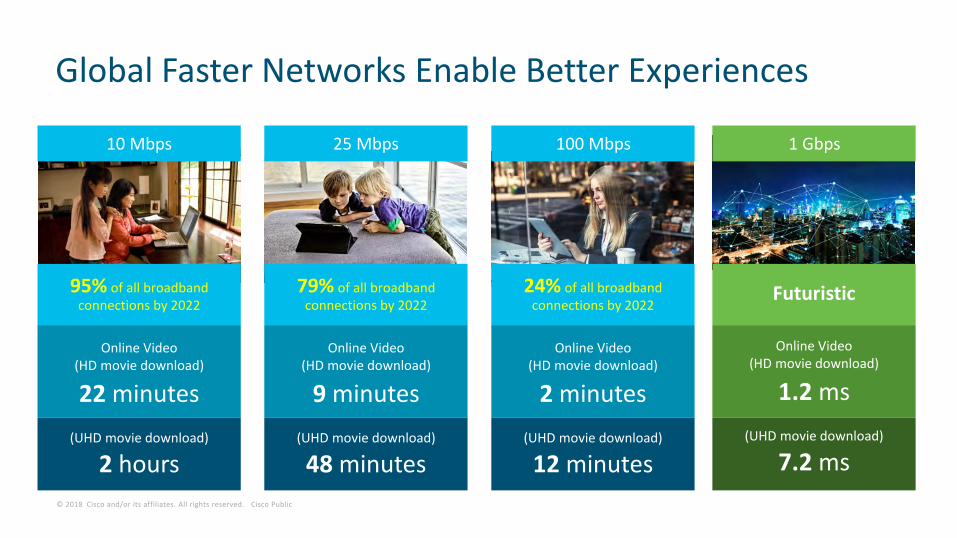
Global Faster Networks Enable Better Experiences
95% of all broadband connections by 2022
Online Video (HD movie download)
22 minutes(UHD movie download)
2 hours
79% of all broadband connections by 2022
Online Video (HD movie download)
9 minutes(UHD movie download)
48 minutes
24% of all broadband connections by 2022
Online Video (HD movie download)
2 minutes(UHD movie download)
12 minutes
10 Mbps 25 Mbps 100 Mbps
Futuristic
Online Video (HD movie download)
1.2 ms(UHD movie download)
7.2 ms
1 Gbps

© 2018 Cisco and/or its affiliates. All rights reserved. Cisco Public
2 8 8 16 1751
100
167
500
HD Camera
IP Video
2 UHD Cameras
UHD Streaming
VR
UHD IP Video
8K Wall TV
HD VR
UHD VR
Video in the Home of Today and the FutureSignificant demand for video in the home of the future
Application requirements In Mbps
Today
Future
Today
Future

© 2018 Cisco and/or its affiliates. All rights reserved. Cisco Public
Global Average Wi-Fi SpeedsWi-Fi speeds double from 2017–2022
Global
BY REGIONAsia PacificLatin America
Central and Eastern Europe
North America
Middle East & Africa
24.4
26.79.0
25.019.5
37.1
6.2
54.2
63.316.8
49.532.8
83.8
11.2
Western Europe
GLOBALIn Mbps
Source: Cisco VNI Global IP Traffic Forecast, 2017–2022
2017 2022

© 2018 Cisco and/or its affiliates. All rights reserved. Cisco Public
Global Average Cellular SpeedsMobile/Cellular speeds double from 2017–2022
Global
BY REGIONAsia PacificLatin America
Central and Eastern Europe
North America
Middle East & Africa
8.7
10.64.9
16.010.1
16.3
4.4
28.5
28.817.7
50.526.2
42.0
15.3
Western Europe
GLOBALIn Mbps
Source: Cisco VNI Global IP Traffic Forecast, 2017–2022
2017 2022

© 2018 Cisco and/or its affiliates. All rights reserved. Cisco Public
Top Trends
Devices & Connections
Devices/Connections Mix
IoT/M2M by Verticals
IPv6 Adoption
Traffic Trends
Traffic Growth by App
Traffic Pattern Analysis
“Cord-Cutting”
Network Performance and User Experience
Wi-Fi Momentum
Accelerating Speeds
Security Analysis

© 2018 Cisco and/or its affiliates. All rights reserved. Cisco Public© 2018 Cisco and/or its affiliates. All rights reserved. Cisco Public
Peak attack size increased 174% Y/Y.*
DDoS attacks can represent up to 25% of a country’s total Internet traffic while they are occurring.
Average DDoS attack size between 1-2 Gbpsincreased 50% Y/Y which is faster than Internet traffic at 33% Y/Y.
DDoS Attack Size and Traffic Increasing
* 1H2017- 1H2018
Source: Arbor Networks, Cisco VNI Global IP Traffic Forecast, 2017–2022
© 2018 Cisco and/or its affiliates. All rights reserved. Cisco Public
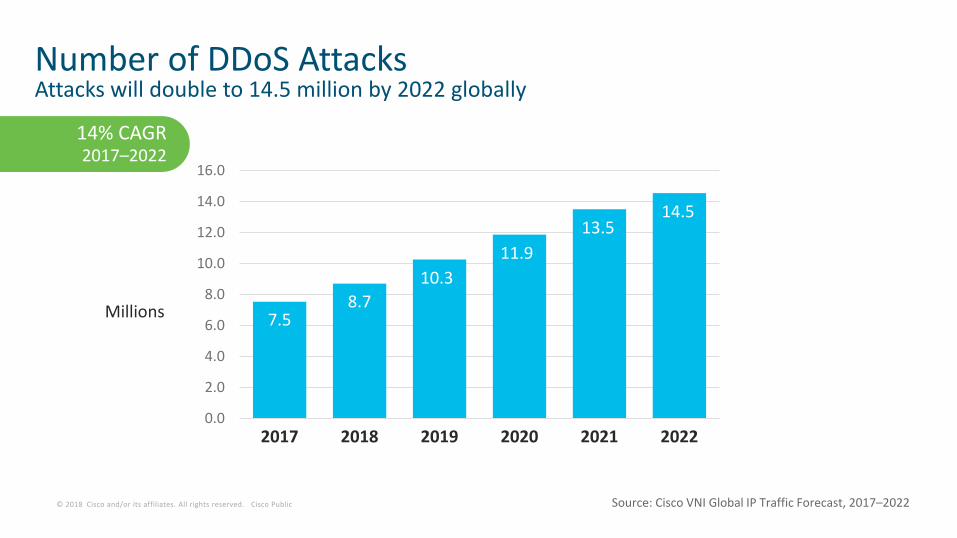
Number of DDoS AttacksAttacks will double to 14.5 million by 2022 globally
7.58.7
10.311.9
13.514.5
0.0
2.0
4.0
6.0
8.0
10.0
12.0
14.0
16.0
2017 2018 2019 2020 2021 2022
Millions
Source: Cisco VNI Global IP Traffic Forecast, 2017–2022
14% CAGR 2017–2022

© 2018 Cisco and/or its affiliates. All rights reserved. Cisco Public
39,554 Records Exposed per BreachTotal Breaches: 864 Records Exposed: 34.2 Million
Highest in Business: 46.8% Highest in Business: 63.7%
Source: 2018 Identity Theft Resource Center

© 2018 Cisco and/or its affiliates. All rights reserved. Cisco Public
Call to ActionCisco VNI Web Site
• Press Release
• White Paper / FAQ
• Cisco VNI Web-based Tools
Cisco VNI Forecast inquiries: [email protected]
Complete VNI Forecast: http://www.cisco.com/go/vni
Related Documents