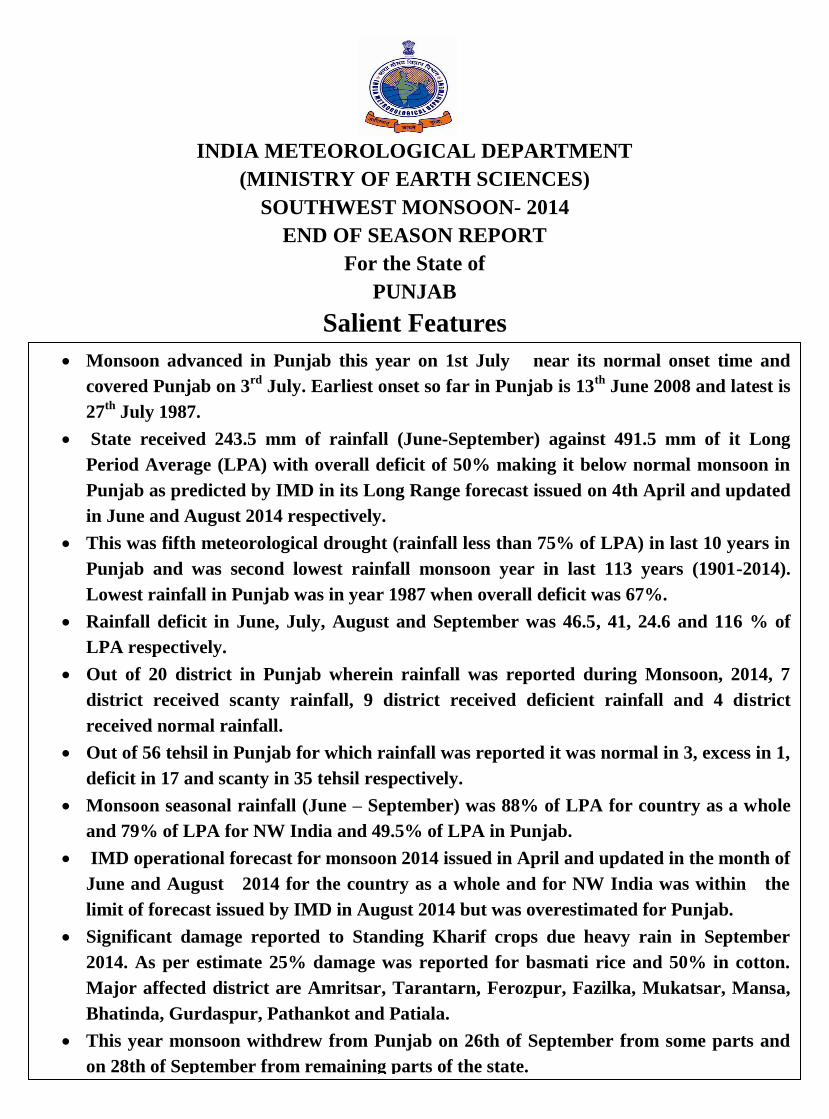
INDIA METEOROLOGICAL DEPARTMENT (MINISTRY OF EARTH SCIENCES) SOUTHWEST MONSOON- 2014 END OF SEASON REPORT For the State of PUNJAB Salient Features Monsoon advanced in Punjab this year on 1st July near its normal onset time and covered Punjab on 3 rd July. Earliest onset so far in Punjab is 13 th June 2008 and latest is 27 th July 1987. State received 243.5 mm of rainfall (June-September) against 491.5 mm of it Long Period Average (LPA) with overall deficit of 50% making it below normal monsoon in Punjab as predicted by IMD in its Long Range forecast issued on 4th April and updated in June and August 2014 respectively. This was fifth meteorological drought (rainfall less than 75% of LPA) in last 10 years in Punjab and was second lowest rainfall monsoon year in last 113 years (1901-2014). Lowest rainfall in Punjab was in year 1987 when overall deficit was 67%. Rainfall deficit in June, July, August and September was 46.5, 41, 24.6 and 116 % of LPA respectively. Out of 20 district in Punjab wherein rainfall was reported during Monsoon, 2014, 7 district received scanty rainfall, 9 district received deficient rainfall and 4 district received normal rainfall. Out of 56 tehsil in Punjab for which rainfall was reported it was normal in 3, excess in 1, deficit in 17 and scanty in 35 tehsil respectively. Monsoon seasonal rainfall (June – September) was 88% of LPA for country as a whole and 79% of LPA for NW India and 49.5% of LPA in Punjab. IMD operational forecast for monsoon 2014 issued in April and updated in the month of June and August 2014 for the country as a whole and for NW India was within the limit of forecast issued by IMD in August 2014 but was overestimated for Punjab. Significant damage reported to Standing Kharif crops due heavy rain in September 2014. As per estimate 25% damage was reported for basmati rice and 50% in cotton. Major affected district are Amritsar, Tarantarn, Ferozpur, Fazilka, Mukatsar, Mansa, Bhatinda, Gurdaspur, Pathankot and Patiala. This year monsoon withdrew from Punjab on 26th of September from some parts and on 28th of September from remaining parts of the state.

Welcome message from author
This document is posted to help you gain knowledge. Please leave a comment to let me know what you think about it! Share it to your friends and learn new things together.
Transcript
INDIA METEOROLOGICAL DEPARTMENT
(MINISTRY OF EARTH SCIENCES)
SOUTHWEST MONSOON- 2014
END OF SEASON REPORT
For the State of
PUNJAB
Salient Features
Monsoon advanced in Punjab this year on 1st July near its normal onset time and
covered Punjab on 3rd
July. Earliest onset so far in Punjab is 13th
June 2008 and latest is
27th
July 1987.
State received 243.5 mm of rainfall (June-September) against 491.5 mm of it Long
Period Average (LPA) with overall deficit of 50% making it below normal monsoon in
Punjab as predicted by IMD in its Long Range forecast issued on 4th April and updated
in June and August 2014 respectively.
This was fifth meteorological drought (rainfall less than 75% of LPA) in last 10 years in
Punjab and was second lowest rainfall monsoon year in last 113 years (1901-2014).
Lowest rainfall in Punjab was in year 1987 when overall deficit was 67%.
Rainfall deficit in June, July, August and September was 46.5, 41, 24.6 and 116 % of
LPA respectively.
Out of 20 district in Punjab wherein rainfall was reported during Monsoon, 2014, 7
district received scanty rainfall, 9 district received deficient rainfall and 4 district
received normal rainfall.
Out of 56 tehsil in Punjab for which rainfall was reported it was normal in 3, excess in 1,
deficit in 17 and scanty in 35 tehsil respectively.
Monsoon seasonal rainfall (June – September) was 88% of LPA for country as a whole
and 79% of LPA for NW India and 49.5% of LPA in Punjab.
IMD operational forecast for monsoon 2014 issued in April and updated in the month of
June and August 2014 for the country as a whole and for NW India was within the
limit of forecast issued by IMD in August 2014 but was overestimated for Punjab.
Significant damage reported to Standing Kharif crops due heavy rain in September
2014. As per estimate 25% damage was reported for basmati rice and 50% in cotton.
Major affected district are Amritsar, Tarantarn, Ferozpur, Fazilka, Mukatsar, Mansa,
Bhatinda, Gurdaspur, Pathankot and Patiala.
This year monsoon withdrew from Punjab on 26th of September from some parts and
on 28th of September from remaining parts of the state.
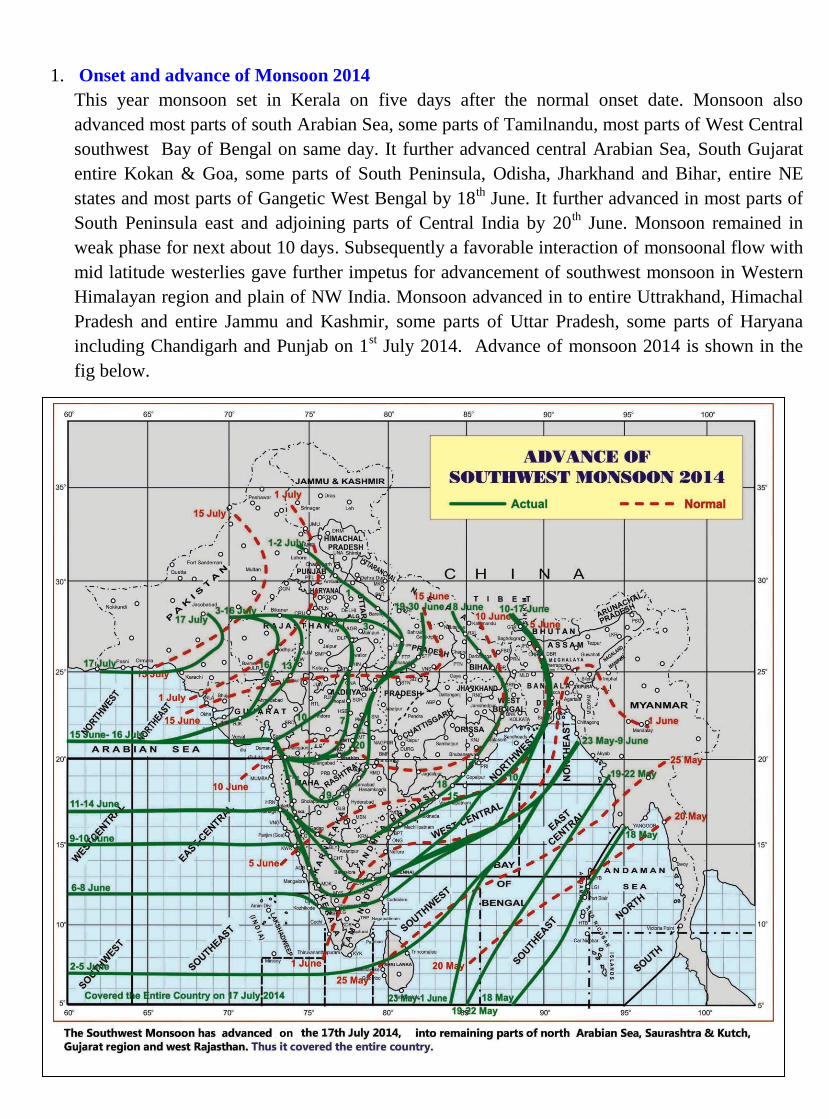
1. Onset and advance of Monsoon 2014
This year monsoon set in Kerala on five days after the normal onset date. Monsoon also
advanced most parts of south Arabian Sea, some parts of Tamilnandu, most parts of West Central
southwest Bay of Bengal on same day. It further advanced central Arabian Sea, South Gujarat
entire Kokan & Goa, some parts of South Peninsula, Odisha, Jharkhand and Bihar, entire NE
states and most parts of Gangetic West Bengal by 18th June. It further advanced in most parts of
South Peninsula east and adjoining parts of Central India by 20th June. Monsoon remained in
weak phase for next about 10 days. Subsequently a favorable interaction of monsoonal flow with
mid latitude westerlies gave further impetus for advancement of southwest monsoon in Western
Himalayan region and plain of NW India. Monsoon advanced in to entire Uttrakhand, Himachal
Pradesh and entire Jammu and Kashmir, some parts of Uttar Pradesh, some parts of Haryana
including Chandigarh and Punjab on 1st July 2014. Advance of monsoon 2014 is shown in the
fig below.
2. Performance of Monson 2014:-
This year monsoon advanced in Punjab on 1st July in some parts and on 3
rd July in remaining
parts and facilitated transplanting /sowing of paddy. Timely and advanced forecast issued by
Meteorological Centre, Chandigarh on 30th May and subsequent update about poor and erratic
monsoon rainfall in Punjab helped the state administration to optimise various resources such as
Irrigation, Power, Agriculture, Health which in turn helped the state administration in planning.
Prevalent feature of monsoon 2014 in Punjab was erratic spread of rainfall on temporal and
spatial scale during entire monsoon season embedded with few heavy/extreme rainfall events in
first fortnight of August and 1st week of September but overall rainfall remained below normal in
Punjab during monsoon 2014. Spatial and temporal distribution of rainfall was poorly defined in
Punjab in the month of June, July and August however stress was significant due very poor
rainfall in the month of July & August.
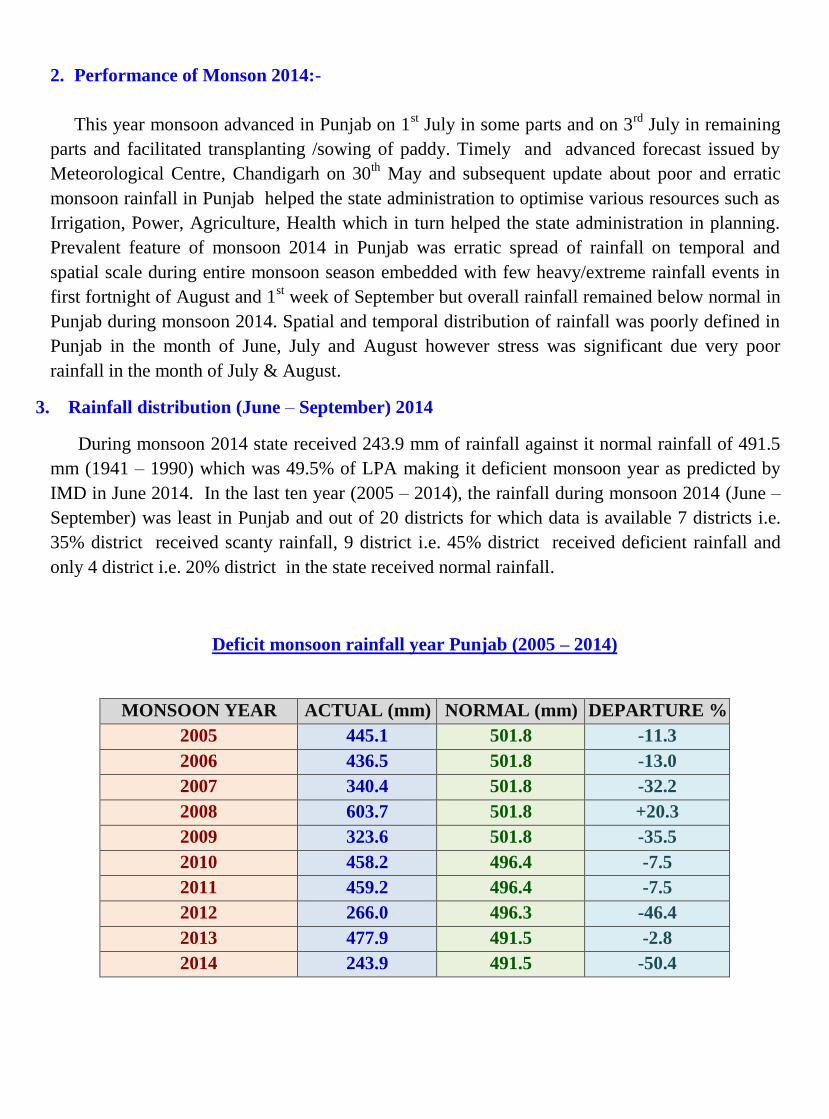
3. Rainfall distribution (June – September) 2014
During monsoon 2014 state received 243.9 mm of rainfall against it normal rainfall of 491.5
mm (1941 – 1990) which was 49.5% of LPA making it deficient monsoon year as predicted by
IMD in June 2014. In the last ten year (2005 – 2014), the rainfall during monsoon 2014 (June –
September) was least in Punjab and out of 20 districts for which data is available 7 districts i.e.
35% district received scanty rainfall, 9 district i.e. 45% district received deficient rainfall and
only 4 district i.e. 20% district in the state received normal rainfall.
Deficit monsoon rainfall year Punjab (2005 – 2014)
MONSOON YEAR ACTUAL (mm) NORMAL (mm) DEPARTURE %
2005 445.1 501.8 -11.3
2006 436.5 501.8 -13.0
2007 340.4 501.8 -32.2
2008 603.7 501.8 +20.3
2009 323.6 501.8 -35.5
2010 458.2 496.4 -7.5
2011 459.2 496.4 -7.5
2012 266.0 496.3 -46.4
2013 477.9 491.5 -2.8
2014 243.9 491.5 -50.4
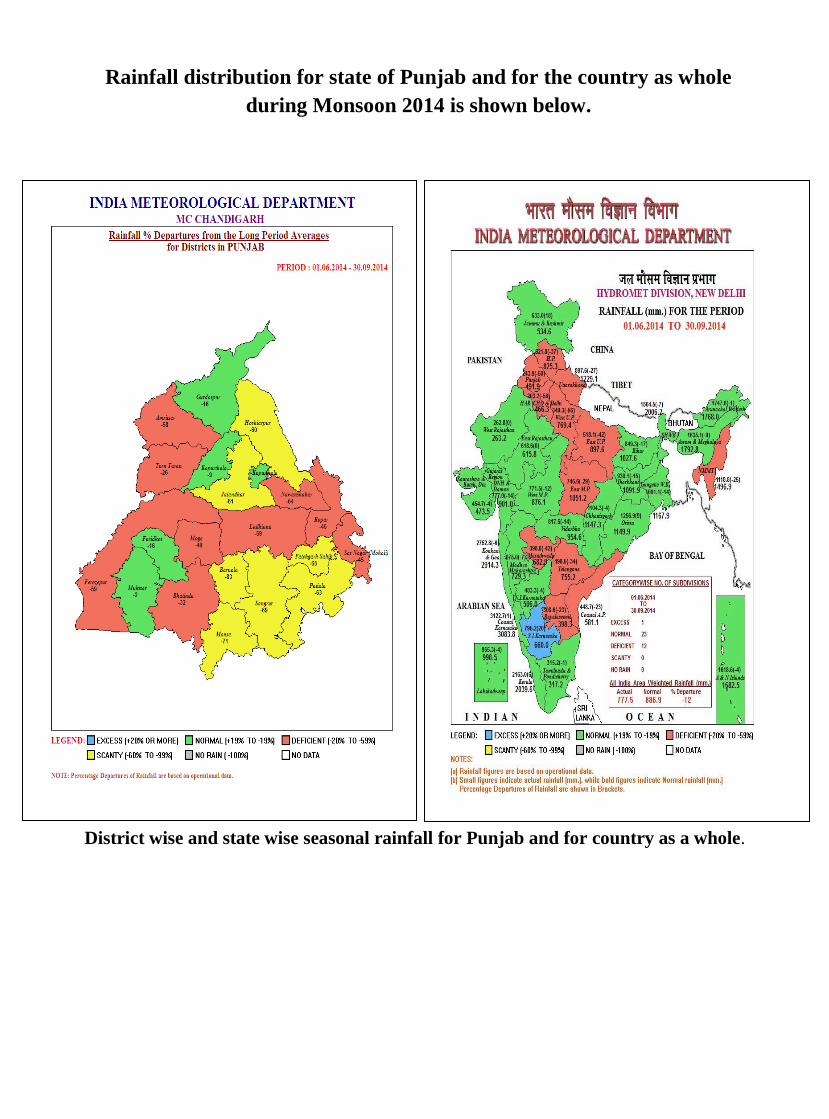
Rainfall distribution for state of Punjab and for the country as whole
during Monsoon 2014 is shown below.
District wise and state wise seasonal rainfall for Punjab and for country as a whole.
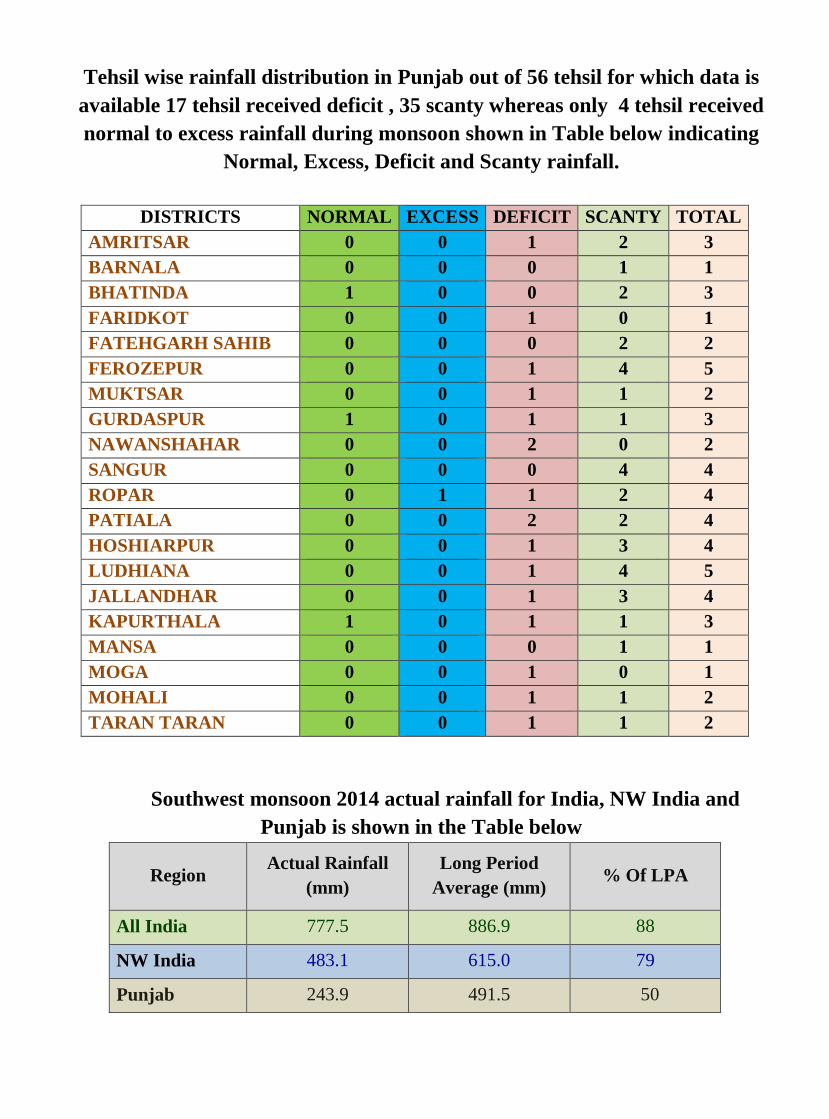
Tehsil wise rainfall distribution in Punjab out of 56 tehsil for which data is
available 17 tehsil received deficit , 35 scanty whereas only 4 tehsil received
normal to excess rainfall during monsoon shown in Table below indicating
Normal, Excess, Deficit and Scanty rainfall.
DISTRICTS NORMAL EXCESS DEFICIT SCANTY TOTAL
AMRITSAR 0 0 1 2 3
BARNALA 0 0 0 1 1
BHATINDA 1 0 0 2 3
FARIDKOT 0 0 1 0 1
FATEHGARH SAHIB 0 0 0 2 2
FEROZEPUR 0 0 1 4 5
MUKTSAR 0 0 1 1 2
GURDASPUR 1 0 1 1 3
NAWANSHAHAR 0 0 2 0 2
SANGUR 0 0 0 4 4
ROPAR 0 1 1 2 4
PATIALA 0 0 2 2 4
HOSHIARPUR 0 0 1 3 4
LUDHIANA 0 0 1 4 5
JALLANDHAR 0 0 1 3 4
KAPURTHALA 1 0 1 1 3
MANSA 0 0 0 1 1
MOGA 0 0 1 0 1
MOHALI 0 0 1 1 2
TARAN TARAN 0 0 1 1 2
Southwest monsoon 2014 actual rainfall for India, NW India and
Punjab is shown in the Table below
Region Actual Rainfall
(mm)
Long Period
Average (mm) % Of LPA
All India 777.5 886.9 88
NW India 483.1 615.0 79
Punjab 243.9 491.5 50

4. Monthly rainfall distribution
Monthly rainfall distribution for the month of June, July August and September and for first
& second half of monsoon 2014 for Punjab is shown the Tabular and graphical view given
below.
Months Actual (mm) Normal (mm) % of LPA
June 20.7 44.5 46.5
July 76.0 185.9 40.8
August 41.9 170.3 25
September 105.3 90.8 115
June – July (1st Half) 96.7 230.4 42
August – September (2nd
Half) 147.2 261.1 56.3
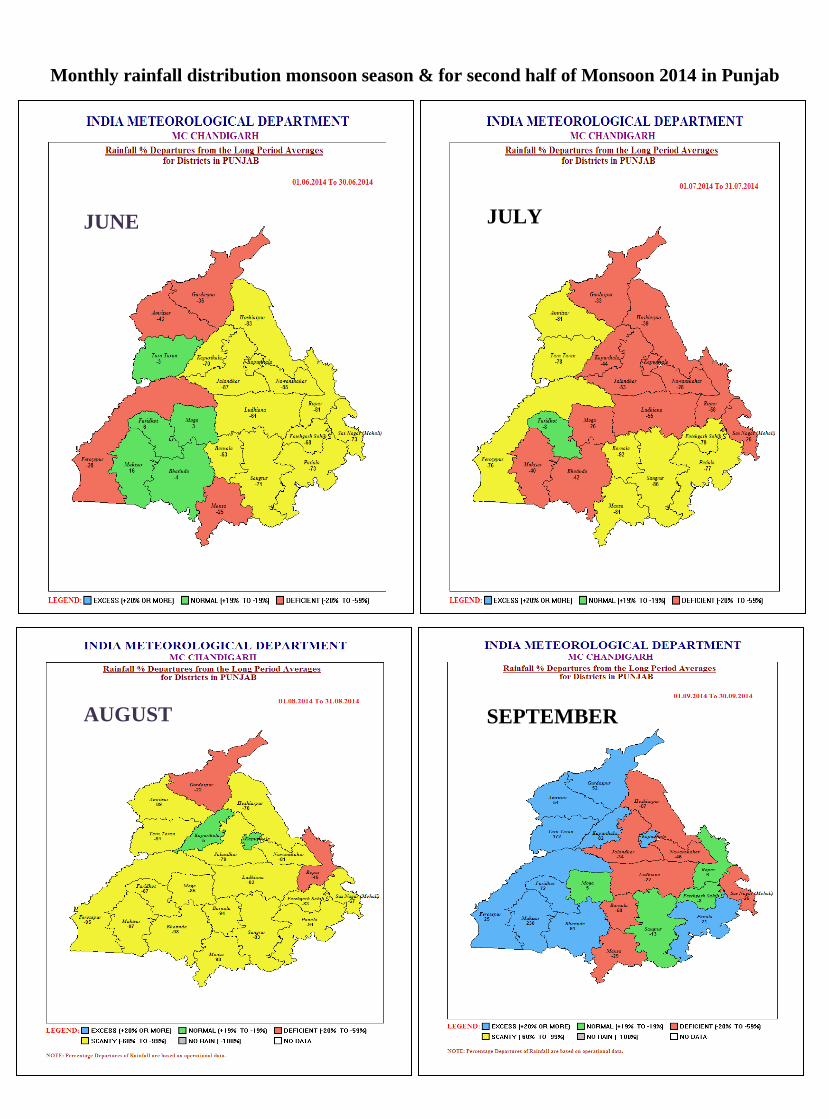
Monthly rainfall distribution monsoon season & for second half of Monsoon 2014 in Punjab
JUNE JULY
AUGUST SEPTEMBER

Details of number of districts with excess, normal, deficient, scanty and no rainfall during
the months of June, July, August, September, June-July (First Half) & August-September
(Second half) is shown in tabular form in the given below table.
MONTHS EXCESS NORMAL DEFICIENT SCANTY NO RAIN
June 0 5 4 11 0
July 0 1 11 8 0
August 0 1 2 17 0
September 9 4 7 0 0
June-July (First Half) 0 1 9 10 0
August-September
(Second half) 2 2 6 10 0
Season 0 4 9 7 0
First half Second half

June 2014 Punjab
State received 20.7 mm of rainfall against its normal long period Average which was
44.9 of LPA.
Highest rainfall in Punjab during last 113 (1901–2014) is 203.3 mm in 2008 which was
452 % of LPA followed by year 1996 and 1986 with rainfall of 158 mm and 151 mm
respectively.
The rainfall during June 2014 was deficient by 53.5% in the state. No heavy spell of
rainfall occurred during June 2014 in the state. Daily time series of rainfall in Punjab
during June 2014 is shown the fig below.
0.0
1.0
2.0
3.0
4.0
5.0
6.0
7.0
1 3 5 7 9 11 13 15 17 19 21 23 25 27 29
RA
INF
AL
L (
in m
m)
DATE
DAILY RAINFALL IN PUNJAB - JUNE 2014
ACTUAL
NORMAL

July 2014 Punjab
State received 76.0 mm of rainfall in July 2014 against its normal rainfall of 185.9 mm
with overall deficit of 59.1% which is 41% of LPA.
Highest rainfall received in Punjab during July month during (1901–2014) was in year
1988 when state received 455.1 mm of rainfall against its LPA of 190.5 mm followed by
1980 and 1993 when state received 443.8 mm and 413.9 mm of rainfall respectively.
Lowest rainfall in July during (1901-2014) was in 1911 when state received 25.0 mm of
rainfall against 158.4 mm with deficit of 84% followed by year 1987 and 1964 when
rainfall was 31.8 mm and 35.4 mm respectively.
During the last decade lowest rainfall was in year 2012 followed by year 2014 wherein
state received 67.7 mm and 76.0 mm rainfall with overall deficit of 63.7% and 59.1%
respectively. Daily time series of rainfall in Punjab during July 2014 is shown the fig
below.
State received spells of very heavy rainfall (More than 12cm) in July 2014 is shown in
table 1.
0.0
2.0
4.0
6.0
8.0
10.0
12.0
14.0
1 3 5 7 9 11 13 15 17 19 21 23 25 27 29 31
RA
INF
AL
L (
in m
m)
DATE
DAILY RAINFALL IN PUNJAB - JULY 2014
ACTUAL
NORMAL
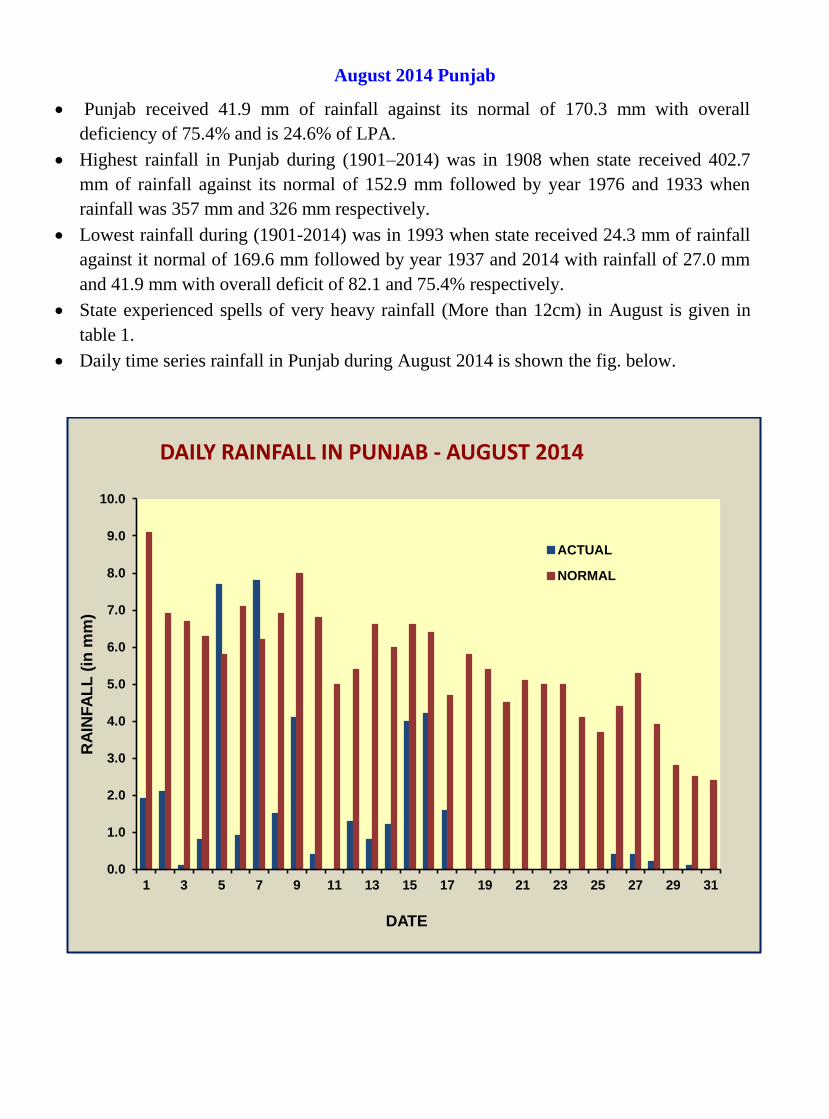
August 2014 Punjab
Punjab received 41.9 mm of rainfall against its normal of 170.3 mm with overall
deficiency of 75.4% and is 24.6% of LPA.
Highest rainfall in Punjab during (1901–2014) was in 1908 when state received 402.7
mm of rainfall against its normal of 152.9 mm followed by year 1976 and 1933 when
rainfall was 357 mm and 326 mm respectively.
Lowest rainfall during (1901-2014) was in 1993 when state received 24.3 mm of rainfall
against it normal of 169.6 mm followed by year 1937 and 2014 with rainfall of 27.0 mm
and 41.9 mm with overall deficit of 82.1 and 75.4% respectively.
State experienced spells of very heavy rainfall (More than 12cm) in August is given in
table 1.
Daily time series rainfall in Punjab during August 2014 is shown the fig. below.
0.0
1.0
2.0
3.0
4.0
5.0
6.0
7.0
8.0
9.0
10.0
1 3 5 7 9 11 13 15 17 19 21 23 25 27 29 31
RA
INF
AL
L (
in m
m)
DATE
DAILY RAINFALL IN PUNJAB - AUGUST 2014
ACTUAL
NORMAL

September 2014 Punjab
State received 105.3 mm of rainfall against its normal rainfall of 90.8 mm and was 115 %
of LPA.
During the last decade rainfall was highest in the year 2014 followed by year 2011
wherein state received 12.6% excess rainfall from normal.
State experienced spells of very heavy rainfall (More than 12cm) in September 2014 is
shown in Table 1.
Daily time series of rainfall in Punjab during September 2014 is shown the fig below.
0
5
10
15
20
25
30
35
1 3 5 7 9 11 13 15 17 19 21 23 25 27 29
RA
INF
AL
L (
in m
m)
DATE
DAILY RAINFALL IN PUNJAB - SEPTEMBER 2014
ACTUAL
NORMAL

Chief Amounts Rainfall 12 cm and above – July, August & September 2014
Table.1
MONTH DATE DISTRICT STATIONRAINFALL (in
cm)
2 ROPAR Ropar 14
GURDASPUR Phangota 14
GURDASPUR Gurdaspur (AWS) 12
17 NAWANSHAHR Nawanshahr 15
NAWANSHAHR Balachaur 18
LUDHIANA Ludhiana 13
KAPURTHALA Phagwara 13
HOSHIARPUR Hoshiarpur 12
7 ROPAR Nangal 14
15 GURDASPUR Malakpur 19
16 ROPAR Nangal 14
1 ROPAR Nangal 21
AMRITSAR Amritsar 15
PATIALA Rajpura 15
PATIALA Rauni (AWS) 12
PATIALA Patiala (Revenue) 12
PATIALA Patiala 12
JULY
AUGUST
September6
16
28

5. Daily and weekly rainfall distribution:-
Daily rainfall distribution indicates that monsoon was active during third week of July,
vigorous during first week of September. It was below normal for most part of June except
couple of days in the last week. It remained above normal in first, third week of July and
below normal remaining period. In August it remained below normal for most part except
couple of days in the first week. In September rainfall was above normal during first and
second week and remained below normal for rest period. Daily time series of monsoon
rainfall (June – September) is shown in fig below.
-300
-200
-100
0
100
200
300
400
500
600
700
800
900
1000
1100
1200
0.0
5.0
10.0
15.0
20.0
25.0
30.0
35.0
1-J
un
5-J
un
9-J
un
13-J
un
17-J
un
21-J
un
25-J
un
29-J
un
3-J
ul
7-J
ul
11-J
ul
15-J
ul
19-J
ul
23-J
ul
27-J
ul
31-J
ul
4-A
ug
8-A
ug
12-A
ug
16-A
ug
20-A
ug
24-A
ug
28-A
ug
1-S
ep
5-S
ep
9-S
ep
13-S
ep
17-S
ep
21-S
ep
25-S
ep
29-S
ep
% D
EP
AR
TU
RE
RA
INF
AL
L (
in m
m)
DATE
DAILY TIME SERIES OF MONSOON RAINFALL PUNJAB (JUNE - SEPTEMBER) - 2014
ACTUAL NORMAL % DEPARTURE

Weekly rainfall departure in shown fig below which shows rainfall remained below
normal for all weeks during monsoon season except in the last week of June when it
remained near normal and 2nd
week of September when it remained above normal.
-125
-100
-75
-50
-25
0
25
50
75
100
125
150
175
200
225
04.0
6.2
01
4
11.0
6.2
01
4
18.0
6.2
01
4
25.0
6.2
01
4
02.0
7.2
01
4
09.0
7.2
01
4
16.0
7.2
01
4
23.0
7.2
01
4
30.0
7.2
01
4
06.0
8.2
01
4
13.0
8.2
01
4
20.0
8.2
01
4
27.0
8.2
01
4
03.0
9.2
01
4
10.0
9.2
01
4
17.0
9.2
01
4
24.0
9.2
01
5
01.1
0.2
01
4
% D
EP
AR
TU
RE
FR
OM
NO
RM
AL
WEEK ENDING DATE
Weekly Rainfall % Departure - Monsoon 2014 Punjab State
% DEPARTURE

Weekly cumulative rainfall departure indicates that they remained below normal
during the monsoon season and is shown in fig below.
-100
-90
-80
-70
-60
-50
-40
-30
-20
-10
0
10
20
30
40
50
04 J
un
11 J
un
18 J
un
25 J
un
02 J
ul
09 J
ul
16 J
ul
23 J
ul
30 J
ul
06 A
ug
13 A
ug
20 A
ug
27 A
ug
03 S
ep
10 S
ep
17 S
ep
24 S
ep
25 S
ep
26 S
ep
27 S
ep
28 S
ep
29 S
ep
30 S
ep
CO
MM
UL
AT
IVE
RA
INF
AL
L
% D
EP
AR
TU
RE
WEEK ENDING DATE
WEEKLY COMMULATIVE RAINFALL (% DEPARTURE) MONSOON 2014 - PUNJAB
COMMULATIVE % DEPARTURE

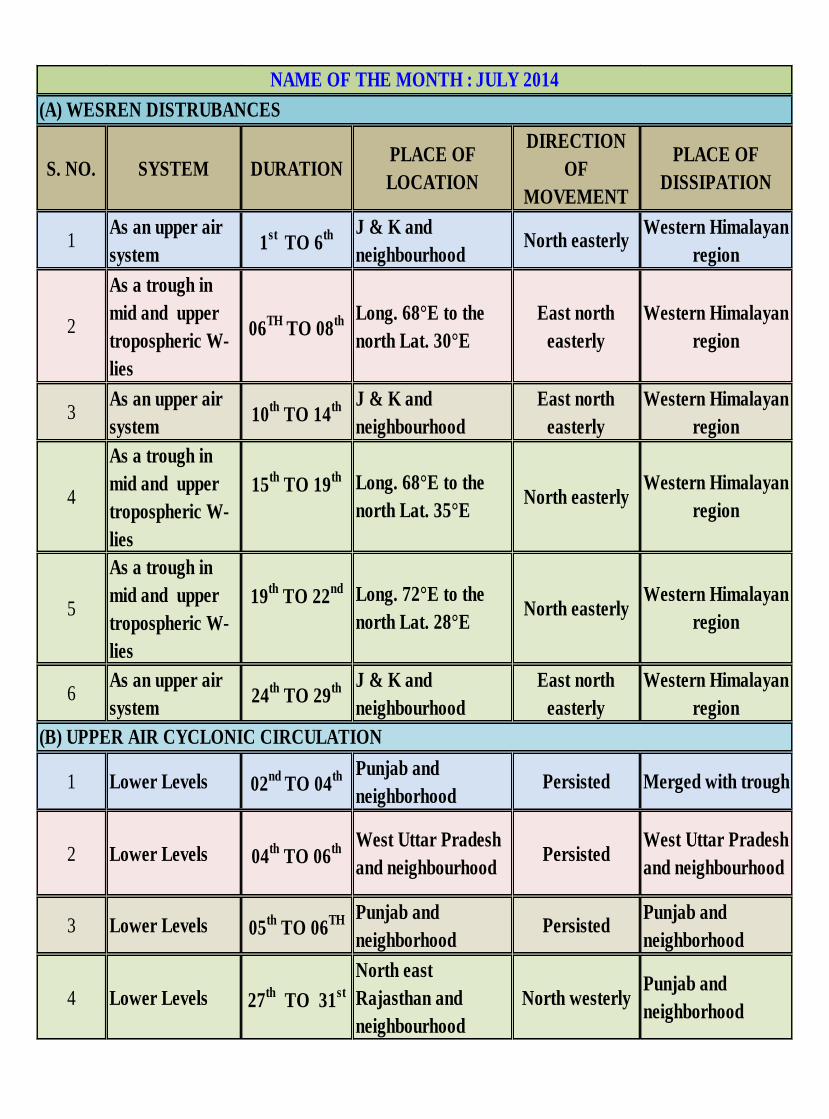
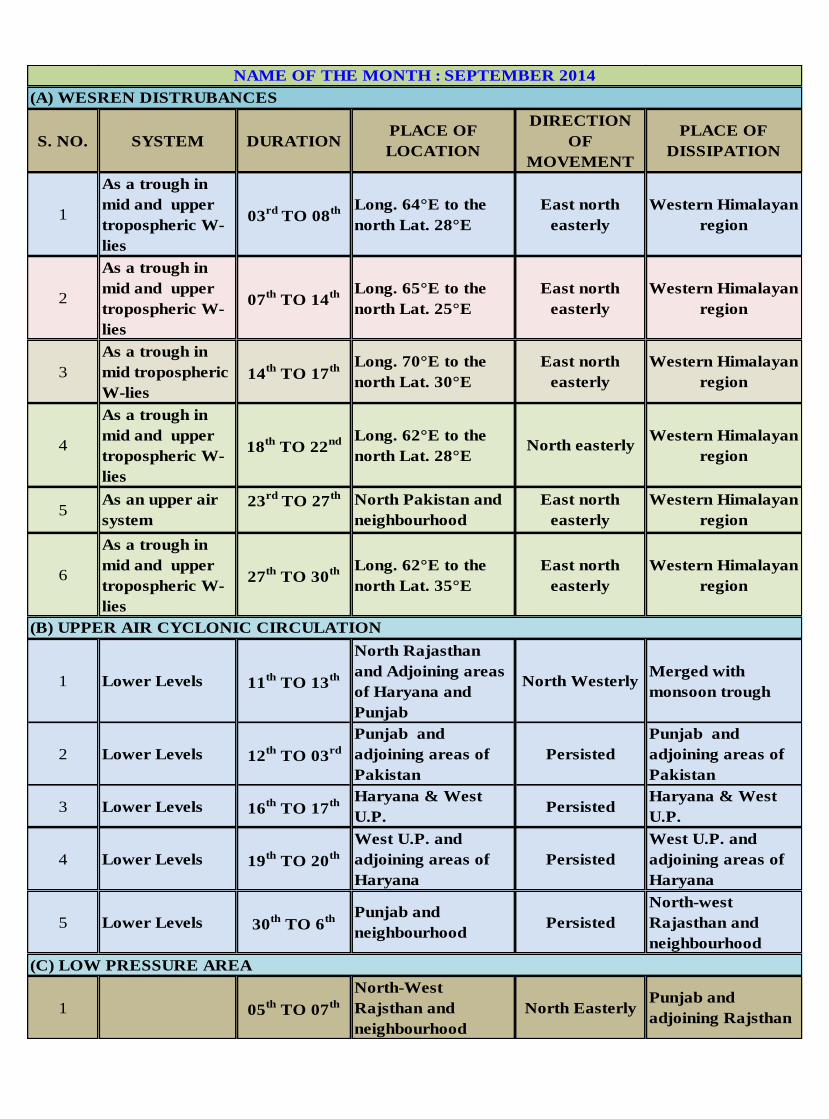
6. Main synoptic weather system monsoon 2014
During current monsoon season 24 western disturbance viz upper air system, Trough in
westerly’s, Induced cyclonic circulation travelled eastward and were also in interaction
phase with monsoonal flow. One Low pressure area travelled west/northwest ward along
monsoon trough affected this region, 16 upper air cyclonic circulations embedded in the
region of monsoon trough were also observed. Month wise location and dissipation of
weather system during monsoon 2014 is given below.
Main synoptic System:
S. NO. SYSTEM DURATIONPLACE OF
LOCATION
DIRECTION
OF
MOVEMENT
PLACE OF
DISSIPATION
1As an upper air
system1
ST TO 3
RD J & K and adjoining
PakistanNorth easterly
Western Himalayan
region
2As an upper air
system16
TH TO 22
ND
North east
Afghanistan and
adjoining Pakistan
East north
easterly
Western Himalayan
region
3As an upper air
system21
ST TO 26
TH Afghanistan and
neighbourhoodNorth easterly
Western Himalayan
region
4As an upper air
system26
TH TO 28
TH North Pakistan and
adjoining J & K North easterly
Western Himalayan
region
1 Lower Levels 1ST
AND 2ND
West Uttar Pradesh
and neighbourhoodEastward
West Uttar Pradesh
and neighbourhood
2 Lower Levels 12TH
TO 14TH Uttar Pradesh and
neighborhoodPersisted
Uttar Pradesh and
neighborhood
3 Lower Levels 14TH
TO 16TH South Punjab Persisted South Punjab
4 Mid Levels15
TH AND
16TH
West Rajasthan and
Adjoining PakistanPersisted
West Rajasthan
and Adjoining
Pakistan
5 Lower Levels23
RD AND
24TH
West Uttar Pradesh
and neighbourhoodPersisted
West Uttar Pradesh
and neighbourhood
6 Mid Levels 28TH
TO 30TH West Uttar Pradesh
and neighbourhoodNorth westerly
Merged with
monsoon trough
(B) UPPER AIR CYCLONIC CIRCULATION
NAME OF THE MONTH : JUNE 2014
(A) WESREN DISTRUBANCES
S. NO. SYSTEM DURATIONPLACE OF
LOCATION
DIRECTION
OF
MOVEMENT
PLACE OF
DISSIPATION
1As an upper air
system1
st TO 6
th J & K and
neighbourhood North easterly
Western Himalayan
region
2
As a trough in
mid and upper
tropospheric W-
lies
06TH
TO 08th Long. 68°E to the
north Lat. 30°E
East north
easterly
Western Himalayan
region
3As an upper air
system10
th TO 14
th J & K and
neighbourhood
East north
easterly
Western Himalayan
region
15th
TO 19th
19th
TO 22nd
6As an upper air
system24
th TO 29
th J & K and
neighbourhood
East north
easterly
Western Himalayan
region
1 Lower Levels 02nd
TO 04th Punjab and
neighborhoodPersisted Merged with trough
2 Lower Levels 04th
TO 06th
West Uttar Pradesh
and neighbourhoodPersisted
West Uttar Pradesh
and neighbourhood
3 Lower Levels 05th
TO 06TH Punjab and
neighborhoodPersisted
Punjab and
neighborhood
4 Lower Levels 27th
TO 31st
North east
Rajasthan and
neighbourhood
North westerlyPunjab and
neighborhood
5
As a trough in
mid and upper
tropospheric W-
lies
Long. 72°E to the
north Lat. 28°ENorth easterly
Western Himalayan
region
(B) UPPER AIR CYCLONIC CIRCULATION
NAME OF THE MONTH : JULY 2014
(A) WESREN DISTRUBANCES
4
As a trough in
mid and upper
tropospheric W-
lies
Long. 68°E to the
north Lat. 35°ENorth easterly
Western Himalayan
region

S. NO. SYSTEM DURATIONPLACE OF
LOCATION
DIRECTION
OF
MOVEMENT
PLACE OF
DISSIPATION
1
As a trough in
mid and upper
tropospheric W-
lies
03rd
TO 07th Long. 65°E to the
north Lat. 30°E
East north
easterly
Western Himalayan
region
2
As a trough in
mid and upper
tropospheric W-
lies
08th
TO 11th Long. 72°E to the
north Lat. 30°E
East north
easterly
Western Himalayan
region
3
As a trough in
mid tropospheric
W-lies
15th
TO 16th
Long. 70°E to the
north Lat. 30°E
East north
easterly
Western Himalayan
region
16th
TO 20th
23rd
TO 26th
6As an upper air
system25
th TO 27
th J & K and
neighbourhood
East north
easterly
Western Himalayan
region
7As an upper air
system26
th TO 01
st W-Afganistan and
adj-Pakistan
East north
easterly
Western Himalayan
region
8As an upper air
system31
st TO 04
th Afganistan and
neighbourhood
East north
easterly
Western Himalayan
region
1Lower & middle
Levels 01
st TO 03
rd
NW-Madhya
Pradesh and
neighborhood
North Westerly
North east
Rajasthan and
neighbourhood
5As an upper air
system
J & K and
neighbourhood
East north
easterly
Western Himalayan
region
(B) UPPER AIR CYCLONIC CIRCULATION
NAME OF THE MONTH : AUGUST 2014
(A) WESREN DISTRUBANCES
4
As a trough in
mid and upper
tropospheric W-
lies
Long. 66°E to the
north Lat. 28°ENorth easterly
Western Himalayan
region
S. NO. SYSTEM DURATIONPLACE OF
LOCATION
DIRECTION
OF
MOVEMENT
PLACE OF
DISSIPATION
1
As a trough in
mid and upper
tropospheric W-
lies
03rd
TO 08th Long. 64°E to the
north Lat. 28°E
East north
easterly
Western Himalayan
region
2
As a trough in
mid and upper
tropospheric W-
lies
07th
TO 14th Long. 65°E to the
north Lat. 25°E
East north
easterly
Western Himalayan
region
3
As a trough in
mid tropospheric
W-lies
14th
TO 17th
Long. 70°E to the
north Lat. 30°E
East north
easterly
Western Himalayan
region
4
As a trough in
mid and upper
tropospheric W-
lies
18th
TO 22nd Long. 62°E to the
north Lat. 28°ENorth easterly
Western Himalayan
region
23rd
TO 27th
6
As a trough in
mid and upper
tropospheric W-
lies
27th
TO 30th Long. 62°E to the
north Lat. 35°E
East north
easterly
Western Himalayan
region
1 Lower Levels 11th
TO 13th
North Rajasthan
and Adjoining areas
of Haryana and
Punjab
North WesterlyMerged with
monsoon trough
2 Lower Levels 12th
TO 03rd
Punjab and
adjoining areas of
Pakistan
Persisted
Punjab and
adjoining areas of
Pakistan
3 Lower Levels 16th
TO 17th
Haryana & West
U.P.Persisted
Haryana & West
U.P.
4 Lower Levels 19th
TO 20th
West U.P. and
adjoining areas of
Haryana
Persisted
West U.P. and
adjoining areas of
Haryana
5 Lower Levels 30th
TO 6th
Punjab and
neighbourhoodPersisted
North-west
Rajasthan and
neighbourhood
(C) LOW PRESSURE AREA
1 05th
TO 07th
North-West
Rajsthan and
neighbourhood
North EasterlyPunjab and
adjoining Rajsthan
(B) UPPER AIR CYCLONIC CIRCULATION
NAME OF THE MONTH : SEPTEMBER 2014
(A) WESREN DISTRUBANCES
5As an upper air
system
North Pakistan and
neighbourhood
East north
easterly
Western Himalayan
region

7. Withdrawal of Monsoon
In view of dry weather conditions and decreased moisture contents as seen from water
vapour imageries over Northwest region during 17th
September 2014 and also change in
the lower level tropospheric circulation pattern over the region from cyclonic to anticyclonic
during 16-17 made condition favourable for withdrawal of monsoon over the region.
Subsequently withdrawal of monsoon over North-western parts of the country commenced on
23rd
September. Monsoon withdrew from some parts of West Rajasthan and parts of Kutch
on 23rd
September and from some parts of Punjab, Haryana and Gujarat region, some more
parts of kutch and remaining parts of West Rajasthan on 26th. During This year monsoon
withdrew from Punjab on 26th
September 2014. It further withdrew from remaining parts of
Punjab, Haryana including Chandigarh on 28th September 2014. Withdrawal of monsoon
2014 is shown in fig given below.

8. Verification of monsoon long range rainfall forecast 2014
IMD predicted below normal rainfall in April which was further updated in June and August
2014. Forecast for country as a whole was predicted below normal this year quantitatively it
was expected to be 95% of LPA with model error ±5% for the country. Forecast was further
updated to 93% and 87 % of LPA in June and August 2014respectively. Forecast for NW
India was predicted 87 and 76% of LPA. Actual rainfall for the country as a whole was 88%
of LPA as predicted. Actual rainfall realized for NW India was 79% of LPA and which was
within in the forecast limit issued by IMD and was correct. Realized rainfall for Punjab was
49.5% of LPA hence model overestimated the rainfall for Punjab. In probabilistic forecast
the probability of below normal rainfall for NW India was more than 70%. Monthly forecast
Issued by IMD in June for the month of July and August was 93% and 96% of LPA for the
country as a whole with model error of ±9% .Forecast for August and September was 95%
of LPA with model error of ± 8%.The actual rainfall realized in Punjab for the month of
July, August was 41, 25 % of LPA hence model overestimated rainfall for smaller region.
Monsoon forecast issued by IMD for second half of monsoon (August-September) was
predicted to be 95 % of LPA for the country with model error of ±8%. Actual rainfall
realized in Punjab was 56% of LPA which was below the expected rainfall.
Monsoons long range rainfall forecast issued and realized in Punjab during monsoon 2014
Region Period Stage of forecast Forecast %
of LPA
Actual rainfall
%LPA
All India June-Sept 1st Stage 9
th April 95±5 88
All India June-Sept 2nd Stage 9th June 93±4 88
NW India June-Sept 9th
June 85±8 79
Punjab June-Sept do 85±8 50
Punjab July do 93±9 41
Punjab August do 96±9 24.6
Punjab August & September 2nd
August 96±5 56
Verification of short range forecast and Nowcast issued by Meteorological Centre,
Chandigarh based upon all IMD/state rainfall reporting stations during June-September in
Punjab during monsoon 2014 is given below.
Verification of short range forecast and Nowcast issued by Meteorological Centre,
Chandigarh for Punjab is given below
Months Intensity % Distribution%
June 100 83.3
July 96.7 90.3
August 93.5 80.6
September 83.3 90

Excess and deficient Monsoon year in Punjab (1901-2014)
Years Jun Jul Aug Sep JJAS Years Jun Jul Aug Sep JJAS
1908 -65.5 19.7 163.4 -49.1 48.4 1901 -77.6 11 -8.4 -71.8 -20.1
1909 85.7 38.5 14.6 151.3 56.6 1902 20 -25.4 -36.6 -23.3 -24.7
1910 175.4 -12.7 42.1 -18.2 22.7 1904 -50 -67.6 -22.4 -16.4 -40.3
1914 37 77 -51.2 116 36.3 1905 -53.9 -27.1 -67.4 32.2 -32.1
1917 112.9 4.9 47.4 313.1 89.7 1907 -48 -53.5 56.7 -90.8 -22
1923 -46 35.9 86.1 -86.5 21.8 1911 53.3 -84.2 -36.9 -63.9 -51
1925 159.6 79.7 -4.2 -85.2 25.8 1915 -41.4 -70.1 -56.8 22.2 -44.8
1933 -0.2 9.8 105.1 129.5 65.2 1918 -18.1 -76.6 -8.3 -83.7 -48.8
1942 18.8 53.4 67.5 44.5 53.3 1920 -9.7 -6.2 -40.1 -72.2 -31.2
1945 -14.4 -9 -12.5 297 49.2 1921 -57.8 -24.2 -29.1 -45.6 -33.2
1950 -70.2 29.2 35.7 384.2 91.2 1928 -13.6 -40.7 -18.5 -31.5 -28.7
1956 53.8 49.2 51.6 -67.8 27.5 1929 10 3.6 -33 -89.6 -26.6
1958 -36.1 13.3 5.6 327.2 67.6 1934 26.3 -10 -13 -83.5 -21.9
1959 -51.2 20.3 43.9 47.3 27 1938 189.8 -34.8 -40.4 -94.3 -27.5
1961 58.5 43.9 30.8 10.3 33.5 1939 20.4 -41.1 -51.7 -49 -40.6
1962 1.6 10 -12.5 238.7 47.4 1943 -28 -19.5 -15.2 -50.1 -24.8
1975 23.9 59.3 23.3 69.7 45.6 1946 58 -18 -2.8 -93.3 -20.4
1976 62.1 17.5 113 -4.1 50.3 1951 -93.8 22.2 -26.2 -91.2 -26.9
1977 71.9 30.9 15 20.1 27 1964 -74.3 -79.1 -16.8 15.4 -34.2
1978 166.9 23.3 53.5 -56.1 31.1 1965 -99.6 11.3 -47 -91.9 -37.9
1980 32.2 160.1 -26.7 -39.5 44.6 1969 -89.6 -42.2 -31.3 -17.6 -37.9
1984 27.7 61.1 19.2 17.8 35.2 1972 -48.7 -5.4 -17.4 -76.6 -27.6
1988 0 138.9 34.5 255.3 119.1 1974 138.3 -37.3 -40.9 -90.6 -36.1
1990 11.7 26.1 8.5 133.9 38.9 1979 -1.6 -7.8 -68.8 -58.4 -38.3
1995 11.6 -6.8 88.8 78.8 44.1 1982 -36.7 -32.1 37.9 -96.2 -24.9
1996 267.4 -37.9 42.4 -15 19.9 1987 -35 -81.7 -46.2 -93.1 -67.6
1997 97.6 -3.7 87.1 -62 24 2002 -7 -62.1 -28.7 32.9 -27.2
1998 64.3 22.3 -12.1 78.8 26.3 2004 23.8 -62.5 -13.9 -87.6 -44.1
2008 388.7 -49 46.4 -44.3 20.3 2007 93.8 -53.8 -21.8 -60.4 -32.2
2009 -68.8 -11.8 -51.2 -37.1 -34.9
2012 -77 -64 -37 -18 -46
2014 -53 -59 -75 16 -50
Monthly and seasonal (June-September) rainfall anomalies observed during extreme
Southwest monsoon years for the period 1901-2013 for Punjab
Excess Monsoon Rainfall Years Deficient Monsoon Rainfall Years
There were 29 Excess monsoon years and 32 deficient monsoon years during the period
1901-2013. Excess means when the rainfall is more than 20% of normal and deficient is
when rainfall is less than 20% of normal
Related Documents