REPORT ON THE AUDIT OF THE GROUP FINANCIAL STATEMENTS Opinion Basis for opinion I n d e p e n d e n c e Our audit approach O v e r v i e w Independent auditors’ report to the members of Debenhams plc (Group) 81 In our opinion, Debenhams plc’s Group financial statements (the “financial statements”): give a true and fair view of the state of the group’s affairs as at 2 September 2017 and of its profit and cash flows for the year then ended; have been properly prepared in accordance with IFRSs as adopted by the European Union; and have been prepared in accordance with the requirements of the Companies Act 2006 and, as regards the group financial statements, Article 4 of the IAS Regulation We have audited the financial statements, included within the Annual Report & Accounts (the “Annual Report”), which comprise: the Consolidated Balance Sheet as at 2 September 2017; the Consolidated Income Statement and Statement of Comprehensive Income, the Consolidated Cash Flow Statement, and the Consolidated Statement of Changes in Equity for the year then ended; and the notes to the financial statements, which include a description of the significant accounting policies. Our opinion is consistent with our reporting to the Audit Committee. We conducted our audit in accordance with International Standards on Auditing (UK) (“ISAs (UK)”) and applicable law. Our responsibilities under ISAs (UK) are further described in the Auditors’ responsibilities for the audit of the financial statements section of our report. We believe that the audit evidence we have obtained is sufficient and appropriate to provide a basis for our opinion. We remained independent of the group in accordance with the ethical requirements that are relevant to our audit of the financial statements in the UK, which includes the FRC’s Ethical Standard, as applicable to listed public interest entities, and we have fulfilled our other ethical responsibilities in accordance with these requirements. To the best of our knowledge and belief, we declare that non-audit services prohibited by the FRC’s Ethical Standard were not provided to the group. Other than those disclosed in note 6 to the financial statements, we have provided no non-audit services to the group in the period from 4 September 2016 to 2 September 2017. Overall group materiality: £4.8 million (2016: £5.9 million), based on 5% of profit before tax and exceptional items Debenhams plc consists two operating segments – UK and International. Within these two operating segments there are eight reporting units (excluding dormant entities), of which five are considered to be financially significant to the Group We performed full scope audits on the five significant reporting units (Debenhams Retail plc, Debenhams Properties Limited, Debenhams Retail (Ireland) Limited, Debenhams plc and Aktieselskabet Th. Wessel & Vett Magasin du Nord ("Magasin du Nord")) The entities where we performed full scope audits accounted for 100% of retail revenue and profit before tax and exceptional items Risk of fraud in revenue recognition in relation to manual adjustments posted to revenue and the cut-off of wholesale invoicing to franchises Inventory valuation using the retail method and provisioning for out of season inventory Goodwill and store asset impairment assessment Defined benefit pension plans Exceptional items Audit scope Key audit matters Materiality www.debenhams.com 81 Financial Statements

Welcome message from author
This document is posted to help you gain knowledge. Please leave a comment to let me know what you think about it! Share it to your friends and learn new things together.
Transcript
REPORT ON THE AUDIT OF THE GROUP FINANCIAL STATEMENTS Opinion
Basis for opinion
Independence
Our audit approach Overview
Independent auditors’ report to the members of Debenhams plc (Group)
www.debenhams.com 81
In our opinion, Debenhams plc’s Group financial statements (the “financial statements”):
give a true and fair view of the state of the group’s affairs as at 2 September 2017 and of its profit and cash flows for the year then ended;
have been properly prepared in accordance with IFRSs as adopted by the European Union; and have been prepared in accordance with the requirements of the Companies Act 2006 and, as regards the group financial
statements, Article 4 of the IAS Regulation
We have audited the financial statements, included within the Annual Report & Accounts (the “Annual Report”), which comprise: the Consolidated Balance Sheet as at 2 September 2017; the Consolidated Income Statement and Statement of Comprehensive Income, the Consolidated Cash Flow Statement, and the Consolidated Statement of Changes in Equity for the year then ended; and the notes to the financial statements, which include a description of the significant accounting policies.
Our opinion is consistent with our reporting to the Audit Committee.
We conducted our audit in accordance with International Standards on Auditing (UK) (“ISAs (UK)”) and applicable law. Our responsibilities under ISAs (UK) are further described in the Auditors’ responsibilities for the audit of the financial statements section of our report. We believe that the audit evidence we have obtained is sufficient and appropriate to provide a basis for our opinion.
We remained independent of the group in accordance with the ethical requirements that are relevant to our audit of the financial statements in the UK, which includes the FRC’s Ethical Standard, as applicable to listed public interest entities, and we have fulfilled our other ethical responsibilities in accordance with these requirements.
To the best of our knowledge and belief, we declare that non-audit services prohibited by the FRC’s Ethical Standard were not provided to the group.
Other than those disclosed in note 6 to the financial statements, we have provided no non-audit services to the group in the period from 4 September 2016 to 2 September 2017.
Overall group materiality: £4.8 million (2016: £5.9 million), based on 5% of profit before tax and exceptional items
Debenhams plc consists two operating segments – UK and International. Within these two operating segments there are eight reporting units (excluding dormant entities), of which five are considered to be financially significant to the Group
We performed full scope audits on the five significant reporting units (Debenhams Retail plc, Debenhams Properties Limited, Debenhams Retail (Ireland) Limited, Debenhams plc and Aktieselskabet Th. Wessel & Vett Magasin du Nord ("Magasin du Nord"))
The entities where we performed full scope audits accounted for 100% of retail revenue and profit before tax and exceptional items
Risk of fraud in revenue recognition in relation to manual adjustments posted to revenue and the cut-off of wholesale invoicing to franchises
Inventory valuation using the retail method and provisioning for out of season inventory Goodwill and store asset impairment assessment Defined benefit pension plans Exceptional items
Audit scope
Key auditmatters
Materiality
www.debenhams.com 81
Financial Statem
ents
Financial Statements
The scope of our audit
Key audit matters
Key audit matter How our audit addressed the key audit matter Risk of fraud in revenue recognition in relation to cut-off of wholesale invoicing to franchises. See note 2 to the financial statements for the directors' disclosures of the related revenue recognition accounting policy and page 52 for the views of the Audit Committee.
Independent auditors’ report to the members of Debenhams plc (Group) continued
82 Debenhams plc Annual Report & Accounts 2017
As part of designing our audit, we determined materiality and assessed the risks of material misstatement in the financial statements. In particular, we looked at where the directors made subjective judgements, for example in respect of significant accounting estimates that involved making assumptions and considering future events that are inherently uncertain. As in all of our audits we also addressed the risk of management override of internal controls, including evaluating whether there was evidence of bias by the directors that represented a risk of material misstatement due to fraud.
Key audit matters are those matters that, in the auditors’ professional judgement, were of most significance in the audit of the financial statements of the current period and include the most significant assessed risks of material misstatement (whether or not due to fraud) identified by the auditors, including those which had the greatest effect on: the overall audit strategy; the allocation of resources in the audit; and directing the efforts of the engagement team. These matters, and any comments we make on the results of our procedures thereon, were addressed in the context of our audit of the financial statements as a whole, and in forming our opinion thereon, and we do not provide a separate opinion on these matters. This is not a complete list of all risks identified by our audit.
The Group’s revenue relates to both retail trading and trading with franchise partners. Retail revenue comprises high volume, low value cash or credit/debit card transactions where the principal risk of fraud and manual error comes from the ability to manipulate the results through posting manual journals outside of the standard automated transaction flow and therefore not subject to the main controls over revenue. The Group uses manual journals to post accounting adjustments including adjusting concessions sales so as to remove the element of the sale that is due to the concession partner; for deferral of revenue where sale of goods online are not yet despatched at the year end, and adjustments for staff discounts and refund provisions. This risk is applicable to Debenhams Retail plc, Debenhams Retail (Ireland) Limited and Magasin du Nord as these are the only reporting units which generate retail revenue.
Franchise revenue comprises revenue from the sale of inventory to franchise partners for sale in overseas franchise stores and franchise fees for the use of the Debenhams brand by overseas franchise partners. The principal risk of fraud and manual error in franchise revenue comes from manual journals as noted above. There is also a risk that management could materially manipulate franchise revenue figures through forcing sales or invoicing the franchises in the incorrect period artificially inflating revenue for the current year. Franchise sales are only recognised in Debenhams Retail plc.
For both retail and franchise revenue we agreed material manual journal entry adjustments made to revenue to supporting documentation. Our work did not identify any significant unexpected or unsupported adjustments.
In addition, for franchise revenue, we tested a sample of sales transactions back to supporting documentation such as cash receipts or purchase orders and goods despatched notes to ascertain the point at which the revenue should be recorded and to make sure it is in the correct period. Our testing noted that Debenhams is entitled to recognise sales on despatch of the goods in line with the franchise agreements, and all items tested had been despatched in advance of the year end. We also obtained confirmation of a sample of year end accounts receivable balances with no material issues noted.
Debenhams plc Annual Report & Accounts 201782
Key audit matter How our audit addressed the key audit matter Inventory valuation using the retail method and provisioning for out of season inventory. Refer to page 52 (Audit Committee report) and note 5 to the financial statements for the directors’ disclosures of the critical accounting estimates and judgements related to the valuation of inventory.
www.debenhams.com 83
The valuation of inventory in the UK and Ireland is determined using the retail method. This is an industry specific accounting method used to derive a weighted average product cost. This method relies on a number of inputs including selling price, assumed margin and quantity. The methodology is also impacted by the timing of processing markdowns which could significantly affect gross margin. Due to differences in the systems used, inventory in Magasin du Nord is valued using a cost based method which is less complex and therefore this risk is not applicable to that reporting unit.
Furthermore, the ongoing pressure on consumer spending within the retail sector continues to create competition on the high street, especially in non-essential categories such as fashion. This could put pressure on the level of out of season stock identified for markdown within the Group. As such there is a risk that the realisable value of inventory will be lower than its recorded cost. This risk is relevant to Debenhams Retail plc, Debenhams Retail (Ireland) Limited and Magasin du Nord as these are the only reporting units that hold inventory.
Due to the reliance management places on the various stock systems used within the Group, we evaluated the IT controls over the relevant systems and tested the internal controls over the inventory valuation process including the process of recording inventory on receipt and agreement of inventory invoices to proof of receipt and purchase orders. This work gave us assurance over the processing of the inputs into management’s margin calculations which are the basis of the inventory valuation.
We also tested interfaces between the Group’s systems to ensure that sales prices used in the valuation were consistent with those prices in the store till system. Our testing did not note any issues between systems.
We obtained evidence over the quantities of inventory through assessing the Group’s controls by attending a sample of inventory counts at stores and distribution centres and reviewing the results of those counts not attended. No significant issues were noted regarding existence or accuracy of inventory.
We reviewed departmental level margins against the prior year margins for unusual fluctuations, with none being identified.
We also assessed the level of out of season inventory at the year end, including testing management’s controls in relation to classifying inventory as current, continuity (inventory with no season) or out of season inventory. We also assessed the spend on mark downs in the month following the year-end and the level of out of season inventory at the end of this period to check the reasonableness of the judgement involved in the markdown provisions applied to the year-end inventory valuation. Our testing noted that the controls in place were operating effectively for the purposes of our audit and no unusual patterns were noted through examining post year end markdowns.
The scope of our audit
Key audit matters
Key audit matter How our audit addressed the key audit matter Risk of fraud in revenue recognition in relation to cut-off of wholesale invoicing to franchises. See note 2 to the financial statements for the directors' disclosures of the related revenue recognition accounting policy and page 52 for the views of the Audit Committee.
Independent auditors’ report to the members of Debenhams plc (Group) continued
82 Debenhams plc Annual Report & Accounts 2017
As part of designing our audit, we determined materiality and assessed the risks of material misstatement in the financial statements. In particular, we looked at where the directors made subjective judgements, for example in respect of significant accounting estimates that involved making assumptions and considering future events that are inherently uncertain. As in all of our audits we also addressed the risk of management override of internal controls, including evaluating whether there was evidence of bias by the directors that represented a risk of material misstatement due to fraud.
Key audit matters are those matters that, in the auditors’ professional judgement, were of most significance in the audit of the financial statements of the current period and include the most significant assessed risks of material misstatement (whether or not due to fraud) identified by the auditors, including those which had the greatest effect on: the overall audit strategy; the allocation of resources in the audit; and directing the efforts of the engagement team. These matters, and any comments we make on the results of our procedures thereon, were addressed in the context of our audit of the financial statements as a whole, and in forming our opinion thereon, and we do not provide a separate opinion on these matters. This is not a complete list of all risks identified by our audit.
The Group’s revenue relates to both retail trading and trading with franchise partners. Retail revenue comprises high volume, low value cash or credit/debit card transactions where the principal risk of fraud and manual error comes from the ability to manipulate the results through posting manual journals outside of the standard automated transaction flow and therefore not subject to the main controls over revenue. The Group uses manual journals to post accounting adjustments including adjusting concessions sales so as to remove the element of the sale that is due to the concession partner; for deferral of revenue where sale of goods online are not yet despatched at the year end, and adjustments for staff discounts and refund provisions. This risk is applicable to Debenhams Retail plc, Debenhams Retail (Ireland) Limited and Magasin du Nord as these are the only reporting units which generate retail revenue.
Franchise revenue comprises revenue from the sale of inventory to franchise partners for sale in overseas franchise stores and franchise fees for the use of the Debenhams brand by overseas franchise partners. The principal risk of fraud and manual error in franchise revenue comes from manual journals as noted above. There is also a risk that management could materially manipulate franchise revenue figures through forcing sales or invoicing the franchises in the incorrect period artificially inflating revenue for the current year. Franchise sales are only recognised in Debenhams Retail plc.
For both retail and franchise revenue we agreed material manual journal entry adjustments made to revenue to supporting documentation. Our work did not identify any significant unexpected or unsupported adjustments.
In addition, for franchise revenue, we tested a sample of sales transactions back to supporting documentation such as cash receipts or purchase orders and goods despatched notes to ascertain the point at which the revenue should be recorded and to make sure it is in the correct period. Our testing noted that Debenhams is entitled to recognise sales on despatch of the goods in line with the franchise agreements, and all items tested had been despatched in advance of the year end. We also obtained confirmation of a sample of year end accounts receivable balances with no material issues noted.
www.debenhams.com 83
Financial Statem
ents
Financial Statements
Key audit matter How our audit addressed the key audit matter Goodwill and store asset impairment assessment. Refer to note 5 to the financial statements for the directors’ disclosures of the critical accounting estimates and judgements related to the goodwill impairment assessment and notes 14 and 15 for further details on the impairment assessment.
Independent auditors’ report to the members of Debenhams plc (Group) continued
84 Debenhams plc Annual Report & Accounts 2017
The UK retail market continues to evolve rapidly, with customers’ purchasing habits adapting to include online offerings and other convenience options, and there is a risk that this could impact the recoverable value of assets used within the store portfolio.
Management considers each store to be a cash-generating unit (“CGU”) and has performed a discounted cash flow impairment assessment at CGU level to ensure that the store assets are supported by its expected future cash flows.
We focused on this area because of the significant carrying value of store assets within the Group and the judgement used in management’s impairment assessment including assumptions over future growth rates and discount rate. This risk is relevant to Debenhams Retail plc, Debenhams Properties Limited, Debenhams Retail (Ireland) Limited and Magasin du Nord as these are the only entities that have store assets.
The Group balance sheet also includes £819.5 million of goodwill which relates primarily to the acquisition in December 2003 of the Debenhams Group by Debenhams plc. Management’s assessment of the store portfolio as detailed above is used to form the basis of the goodwill impairment review and is therefore subject to the same assumptions as the store impairment review above.
We focused on this area due to the changes noted in the retail market as detailed above. This risk is relevant to Debenhams Retail plc and Debenhams Retail (Ireland) Limited as these are the only entities with goodwill included on their balance sheet.
We tested that the impairment models used by management for both goodwill and store impairment were mathematically correct with no issues noted.
We challenged the directors on the inputs into their impairment assessment calculations, including:
The directors’ key assumptions for short-term sales growth rates (from (2.0%) to 4.0%), are driven by the implementation of the new Debenhams Redesigned strategy. We have agreed the growth rates to management’s five year plan and assessed the components of that five year plan. The growth rates used are in line with the five year plan;
The directors’ key assumptions for long-term sales growth rates of 1.0%, by comparing this to historical results, and economic and industry forecasts and note that the rates used in management’s calculations were in line with this data; and
The discount rate (post tax rate of 7.3%), by assessing the cost of capital for the Group and comparable organisations, forming a view of risk premiums as appropriate. Having performed this assessment we believe this is an appropriate discount rate
We agreed the impairment charge recognised regarding store assets of £7.2m to management’s impairment assessment and challenged these assumptions used. We also reviewed the calculations for the value in use of stores that had not been impaired to ensure that the impairment charge was complete. For marginal stores, not impaired, we challenged management and understood their argument for the carrying value of store assets and agreed that the carrying value was appropriate.
We also performed sensitivity analysis on the key assumptions including the short-term growth rates and discount rates as these are the key assumptions in the impairment model and noted that whilst the calculations are most sensitive to changes in short-term growth rates, there is sufficient headroom for this not to result in impairments being required when using the sensitivities we applied.
We found, based on our audit work, that the key assumptions used by management were supportable.
Debenhams plc Annual Report & Accounts 201784
Key audit matter How our audit addressed the key audit matter Defined benefit pension plans. Refer to note 5 to the financial statements for the directors’ disclosures on the critical accounting estimates and judgements related to the defined benefit pension plans and note 24 for detailed disclosures in relation to these plans.
Exceptional items. Refer to note 5 to the financial statements for the directors’ disclosures on the critical accounting estimates and judgements related to the exceptional items and note 7 for detailed disclosures in relation to these items.
How we tailored the audit scope
www.debenhams.com 85
The Group has two defined benefit pension plans which comprise total pension assets of £1,123.4 million and total pension liabilities of £1,042.5 million. The valuation of the pension liabilities requires significant levels of judgement and technical expertise in choosing appropriate assumptions. Changes in a number of the key assumptions (including inflation, discount rates, and mortality) can have a material impact on the calculation of the liability.
This risk is relevant to Debenhams Retail plc as this is the only entity which has employees in the defined benefit pension schemes.
We evaluated the pension liability assumptions, including discount rates, salary increases, inflation and mortality, utilising our internal actuarial specialists. We considered and challenged the reasonableness of the actuarial assumptions comparing the discount and inflation rates used to our internally developed benchmark ranges, finding them to be within an acceptable range.
The group has classified £36.2 million as exceptional costs in the current period. The classification of exceptional costs includes judgements on the nature of the cost incurred and the recurrence of those costs in future years. These costs are attributable to the Strategic review and restructuring and Strategic warehouse restructuring.
We focused on this area because of the magnitude of the amount of costs being classified as exceptional items in the current period and the element of judgement involved in determining whether an item should be classified as an exceptional item or included within the underlying results.
This risk is relevant to Debenhams Retail plc and Debenhams Properties Limited which are the only entities that have incurred exceptional items in the year.
We evaluated the assessment of management covering the nature of the item, cause of occurrence and the scale of the impact of that item on reported performance.
We considered and challenged the consistency of the use of exceptional items, both within the single set of accounts and year on year.
Our testing noted that management were able to demonstrate the nature of the expenses were non-recurring and related to the roll out of the new strategy.
We reviewed the disclosures given in both the notes to the financial statements and in the strategic and directors’ reports to ensure the disclosure of exceptional items was sufficient for users of the accounts to understand the nature of and reasons for the costs.
We tailored the scope of our audit to ensure that we performed enough work to be able to give an opinion on the financial statements as a whole, taking into account the structure of the group, the accounting processes and controls, and the industry in which it operates.
The Group is structured into two operating segments - UK and International. These operating segments consist of eight reporting units (excluding dormant entities).
Our audit approach was based on the underlying reporting units within the two operating segments. We considered there to be five financially significant reporting units - Debenhams Retail plc, Debenhams Properties Limited, Debenhams Retail (Ireland) Limited, Debenhams plc and Magasin du Nord.
Key audit matter How our audit addressed the key audit matter Goodwill and store asset impairment assessment. Refer to note 5 to the financial statements for the directors’ disclosures of the critical accounting estimates and judgements related to the goodwill impairment assessment and notes 14 and 15 for further details on the impairment assessment.
Independent auditors’ report to the members of Debenhams plc (Group) continued
84 Debenhams plc Annual Report & Accounts 2017
The UK retail market continues to evolve rapidly, with customers’ purchasing habits adapting to include online offerings and other convenience options, and there is a risk that this could impact the recoverable value of assets used within the store portfolio.
Management considers each store to be a cash-generating unit (“CGU”) and has performed a discounted cash flow impairment assessment at CGU level to ensure that the store assets are supported by its expected future cash flows.
We focused on this area because of the significant carrying value of store assets within the Group and the judgement used in management’s impairment assessment including assumptions over future growth rates and discount rate. This risk is relevant to Debenhams Retail plc, Debenhams Properties Limited, Debenhams Retail (Ireland) Limited and Magasin du Nord as these are the only entities that have store assets.
The Group balance sheet also includes £819.5 million of goodwill which relates primarily to the acquisition in December 2003 of the Debenhams Group by Debenhams plc. Management’s assessment of the store portfolio as detailed above is used to form the basis of the goodwill impairment review and is therefore subject to the same assumptions as the store impairment review above.
We focused on this area due to the changes noted in the retail market as detailed above. This risk is relevant to Debenhams Retail plc and Debenhams Retail (Ireland) Limited as these are the only entities with goodwill included on their balance sheet.
We tested that the impairment models used by management for both goodwill and store impairment were mathematically correct with no issues noted.
We challenged the directors on the inputs into their impairment assessment calculations, including:
The directors’ key assumptions for short-term sales growth rates (from (2.0%) to 4.0%), are driven by the implementation of the new Debenhams Redesigned strategy. We have agreed the growth rates to management’s five year plan and assessed the components of that five year plan. The growth rates used are in line with the five year plan;
The directors’ key assumptions for long-term sales growth rates of 1.0%, by comparing this to historical results, and economic and industry forecasts and note that the rates used in management’s calculations were in line with this data; and
The discount rate (post tax rate of 7.3%), by assessing the cost of capital for the Group and comparable organisations, forming a view of risk premiums as appropriate. Having performed this assessment we believe this is an appropriate discount rate
We agreed the impairment charge recognised regarding store assets of £7.2m to management’s impairment assessment and challenged these assumptions used. We also reviewed the calculations for the value in use of stores that had not been impaired to ensure that the impairment charge was complete. For marginal stores, not impaired, we challenged management and understood their argument for the carrying value of store assets and agreed that the carrying value was appropriate.
We also performed sensitivity analysis on the key assumptions including the short-term growth rates and discount rates as these are the key assumptions in the impairment model and noted that whilst the calculations are most sensitive to changes in short-term growth rates, there is sufficient headroom for this not to result in impairments being required when using the sensitivities we applied.
We found, based on our audit work, that the key assumptions used by management were supportable.
www.debenhams.com 85
Financial Statem
ents
Financial Statements
Materiality
Overall group materiality
How we determined it
Rationale for benchmark applied
Going concern
Reporting obligation Outcome
REPORTING ON OTHER INFORMATION
Independent auditors’ report to the members of Debenhams plc (Group) continued
86 Debenhams plc Annual Report & Accounts 2017
The five financially significant reporting units were audited by the UK Group team with the exception of Magasin du Nord which was audited by PwC Denmark as component auditor operating under our instruction. Audit work was performed over the consolidation process and tax at a consolidated Group level.
Where the work was performed by the component auditor, we determined the level of involvement we needed to have in their audit work to be able to conclude whether sufficient audit evidence had been obtained as a basis for our opinion on the Group financial statements as a whole. As part of our year end procedures, we held detailed discussions with the Magasin du Nord component audit team including evaluation of and review of the work performed, update calls on the progress of their fieldwork and attending the clearance meeting with management by conference call.
The reporting units where we performed full scope audit work accounted for 100% of retail revenue and 100% of Group profit before tax.
The scope of our audit was influenced by our application of materiality. We set certain quantitative thresholds for materiality. These, together with qualitative considerations, helped us to determine the scope of our audit and the nature, timing and extent of our audit procedures on the individual financial statement line items and disclosures and in evaluating the effect of misstatements, both individually and in aggregate on the financial statements as a whole.
Based on our professional judgement, we determined materiality for the financial statements as a whole as follows:
£4.8 million (2016: £5.9 million).
5% of profit before tax and exceptional items.
We believe that profit before tax and exceptional items is the primary measure used by the shareholders in assessing the performance of the group, and is generally accepted auditing benchmark.
For each component in the scope of our group audit, we allocated a materiality that is less than our overall group materiality. The range of materiality allocated across components was £2.3m to £4.5m. Certain components were audited to a local statutory audit materiality that was also less than our overall group materiality.
We agreed with the Audit Committee that we would report to them misstatements identified during our audit above £0.5 million (2016: £0.5 million) as well as misstatements below that amount that, in our view, warranted reporting for qualitative reasons.
In accordance with ISAs (UK) we report as follows:
We are required to report if we have anything material to add or draw attention to in respect of the directors’ statement in the financial statements about whether the directors considered it appropriate to adopt the going concern basis of accounting in preparing the financial statements and the directors’ identification of any material uncertainties to the group’s ability to continue as a going concern over a period of at least twelve months from the date of approval of the financial statements.
We have nothing material to add or to draw attention to. However, because not all future events or conditions can be predicted, this statement is not a guarantee as to the group’s ability to continue as a going concern.
We are required to report if the directors’ statement relating to Going Concern in accordance with Listing Rule 9.8.6R(3) is materially inconsistent with our knowledge obtained in the audit.
We have nothing to report.
The other information comprises all of the information in the Annual Report other than the financial statements and our auditors’ report thereon. The directors are responsible for the other information. Our opinion on the financial statements does not cover the other information and, accordingly, we do not express an audit opinion or, except to the extent otherwise explicitly stated in this report, any form of assurance thereon.
Debenhams plc Annual Report & Accounts 201786
Strategic Report and Directors’ Report
The directors’ assessment of the prospects of the group and of the principal risks that would threaten the solvency or liquidity of the group
Other Code Provisions
www.debenhams.com 87
In connection with our audit of the financial statements, our responsibility is to read the other information and, in doing so, consider whether the other information is materially inconsistent with the financial statements or our knowledge obtained in the audit, or otherwise appears to be materially misstated. If we identify an apparent material inconsistency or material misstatement, we are required to perform procedures to conclude whether there is a material misstatement of the financial statements or a material misstatement of the other information. If, based on the work we have performed, we conclude that there is a material misstatement of this other information, we are required to report that fact. We have nothing to report based on these responsibilities.
With respect to the Strategic Report and Directors’ Report, we also considered whether the disclosures required by the UK Companies Act 2006 have been included.
Based on the responsibilities described above and our work undertaken in the course of the audit, the Companies Act 2006,(CA06), ISAs (UK) and the Listing Rules of the Financial Conduct Authority (FCA) require us also to report certain opinions and matters as described below (required by ISAs (UK) unless otherwise stated).
In our opinion, based on the work undertaken in the course of the audit, the information given in the Strategic Report and Directors’ Report for the year ended 2 September 2017 is consistent with the financial statements and has been prepared in accordance with applicable legal requirements. (CA06)
In light of the knowledge and understanding of the group and its environment obtained in the course of the audit, we did not identify any material misstatements in the Strategic Report and Directors’ Report. (CA06)
We have nothing material to add or draw attention to regarding:
The directors’ confirmation on page 27 of the Annual Report that they have carried out a robust assessment of the principal risks facing the group, including those that would threaten its business model, future performance, solvency or liquidity
The disclosures in the Annual Report that describe those risks and explain how they are being managed or mitigated The directors’ explanation on page 79 of the Annual Report as to how they have assessed the prospects of the group, over
what period they have done so and why they consider that period to be appropriate, and their statement as to whether they have a reasonable expectation that the group will be able to continue in operation and meet its liabilities as they fall due over the period of their assessment, including any related disclosures drawing attention to any necessary qualifications or assumptions
We have nothing to report having performed a review of the directors’ statement that they have carried out a robust assessment of the principal risks facing the group and statement in relation to the longer-term viability of the group. Our review was substantially less in scope than an audit and only consisted of making inquiries and considering the directors’ process supporting their statements; checking that the statements are in alignment with the relevant provisions of the UK Corporate Governance Code (the “Code”); and considering whether the statements are consistent with the knowledge and understanding of the group and its environment obtained in the course of the audit. (Listing Rules)
We have nothing to report in respect of our responsibility to report when:
The statement given by the directors, on page 80, that they consider the Annual Report taken as a whole to be fair, balanced and understandable, and provides the information necessary for the members to assess the group’s position and performance, business model and strategy is materially inconsistent with our knowledge of the group obtained in the course of performing our audit
The section of the Annual Report on page 52 describing the work of the Audit Committee does not appropriately address matters communicated by us to the Audit Committee
The directors’ statement relating to the company’s compliance with the Code does not properly disclose a departure from a relevant provision of the Code specified, under the Listing Rules, for review by the auditors
Materiality
Overall group materiality
How we determined it
Rationale for benchmark applied
Going concern
Reporting obligation Outcome
REPORTING ON OTHER INFORMATION
Independent auditors’ report to the members of Debenhams plc (Group) continued
86 Debenhams plc Annual Report & Accounts 2017
The five financially significant reporting units were audited by the UK Group team with the exception of Magasin du Nord which was audited by PwC Denmark as component auditor operating under our instruction. Audit work was performed over the consolidation process and tax at a consolidated Group level.
Where the work was performed by the component auditor, we determined the level of involvement we needed to have in their audit work to be able to conclude whether sufficient audit evidence had been obtained as a basis for our opinion on the Group financial statements as a whole. As part of our year end procedures, we held detailed discussions with the Magasin du Nord component audit team including evaluation of and review of the work performed, update calls on the progress of their fieldwork and attending the clearance meeting with management by conference call.
The reporting units where we performed full scope audit work accounted for 100% of retail revenue and 100% of Group profit before tax.
The scope of our audit was influenced by our application of materiality. We set certain quantitative thresholds for materiality. These, together with qualitative considerations, helped us to determine the scope of our audit and the nature, timing and extent of our audit procedures on the individual financial statement line items and disclosures and in evaluating the effect of misstatements, both individually and in aggregate on the financial statements as a whole.
Based on our professional judgement, we determined materiality for the financial statements as a whole as follows:
£4.8 million (2016: £5.9 million).
5% of profit before tax and exceptional items.
We believe that profit before tax and exceptional items is the primary measure used by the shareholders in assessing the performance of the group, and is generally accepted auditing benchmark.
For each component in the scope of our group audit, we allocated a materiality that is less than our overall group materiality. The range of materiality allocated across components was £2.3m to £4.5m. Certain components were audited to a local statutory audit materiality that was also less than our overall group materiality.
We agreed with the Audit Committee that we would report to them misstatements identified during our audit above £0.5 million (2016: £0.5 million) as well as misstatements below that amount that, in our view, warranted reporting for qualitative reasons.
In accordance with ISAs (UK) we report as follows:
We are required to report if we have anything material to add or draw attention to in respect of the directors’ statement in the financial statements about whether the directors considered it appropriate to adopt the going concern basis of accounting in preparing the financial statements and the directors’ identification of any material uncertainties to the group’s ability to continue as a going concern over a period of at least twelve months from the date of approval of the financial statements.
We have nothing material to add or to draw attention to. However, because not all future events or conditions can be predicted, this statement is not a guarantee as to the group’s ability to continue as a going concern.
We are required to report if the directors’ statement relating to Going Concern in accordance with Listing Rule 9.8.6R(3) is materially inconsistent with our knowledge obtained in the audit.
We have nothing to report.
The other information comprises all of the information in the Annual Report other than the financial statements and our auditors’ report thereon. The directors are responsible for the other information. Our opinion on the financial statements does not cover the other information and, accordingly, we do not express an audit opinion or, except to the extent otherwise explicitly stated in this report, any form of assurance thereon.
www.debenhams.com 87
Financial Statem
ents
Financial Statements
Directors’ Remuneration
Responsibilities for the financial statements and the audit Responsibilities of the directors for the financial statements
Auditors’ responsibilities for the audit of the financial statements
Use of this report
OTHER REQUIRED REPORTING Companies Act 2006 exception reporting
Appointment
OTHER MATTER
John Ellis (Senior Statutory Auditor)
Independent auditors’ report to the members of Debenhams plc (Group) continued
88 Debenhams plc Annual Report & Accounts 2017
In our opinion, the part of the Directors’ Remuneration Report to be audited has been properly prepared in accordance with the Companies Act 2006. (CA06)
As explained more fully in the Statement of Directors’ Responsibilities set out on page 80, the directors are responsible for the preparation of the financial statements in accordance with the applicable framework and for being satisfied that they give a true and fair view. The directors are also responsible for such internal control as they determine is necessary to enable the preparation of financial statements that are free from material misstatement, whether due to fraud or error.
In preparing the financial statements, the directors are responsible for assessing the group’s ability to continue as a going concern, disclosing as applicable, matters related to going concern and using the going concern basis of accounting unless the directors either intend to liquidate the group or to cease operations, or have no realistic alternative but to do so.
Our objectives are to obtain reasonable assurance about whether the financial statements as a whole are free from material misstatement, whether due to fraud or error, and to issue an auditors’ report that includes our opinion. Reasonable assurance is a high level of assurance, but is not a guarantee that an audit conducted in accordance with ISAs (UK) will always detect a material misstatement when it exists. Misstatements can arise from fraud or error and are considered material if, individually or in the aggregate, they could reasonably be expected to influence the economic decisions of users taken on the basis of these financial statements.
A further description of our responsibilities for the audit of the financial statements is located on the FRC’s website at: www.frc.org.uk/auditorsresponsibilities. This description forms part of our auditors’ report.
This report, including the opinions, has been prepared for and only for the company’s members as a body in accordance with Chapter 3 of Part 16 of the Companies Act 2006 and for no other purpose. We do not, in giving these opinions, accept or assume responsibility for any other purpose or to any other person to whom this report is shown or into whose hands it may come save where expressly agreed by our prior consent in writing.
Under the Companies Act 2006 we are required to report to you if, in our opinion we have not received all the information and explanations we require for our audit. We have no exceptions to report arising from this responsibility.
Following the recommendation of the audit committee, we were appointed by the members of Debenhams plc to audit the financial statements for its first year after incorporation for the year ended 3 September 2005 and subsequent financial periods. The period of total uninterrupted engagement is 13 years, covering the years ended 3 September 2005 to 2 September 2017. Before 2005, we were auditors of other entities within the Debenhams plc group. The audit committee have set out details of their planned audit tender timetable on page 53 of the annual report and accounts.
We have reported separately on the company financial statements of Debenhams plc for the year ended 2 September 2017 and on the information in the Directors’ Remuneration Report that is described as having been audited.
for and on behalf of PricewaterhouseCoopers LLP Chartered Accountants and Statutory Auditors Reading 26 October 2017
Debenhams plc Annual Report & Accounts 201788
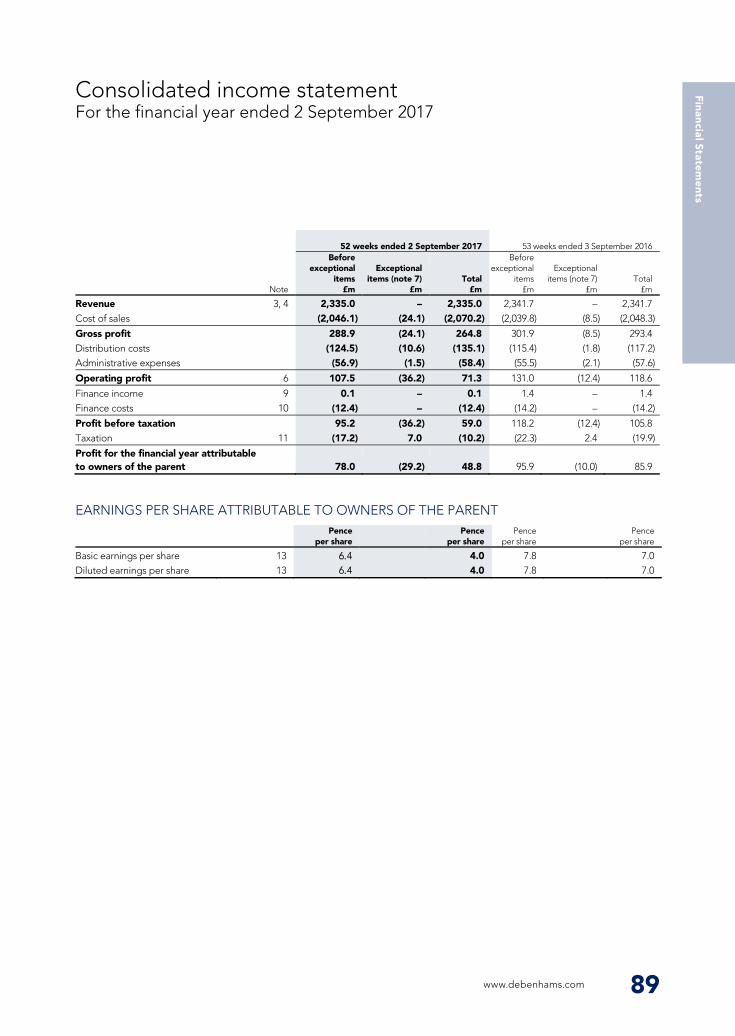
EARNINGS PER SHARE ATTRIBUTABLE TO OWNERS OF THE PARENT
Consolidated income statement For the financial year ended 2 September 2017
www.debenhams.com 89
52 weeks ended 2 September 2017
53 weeks ended 3 September 2016
Note
Before exceptional
items £m
Exceptional items (note 7)
£m Total
£m
Before exceptional
items £m
Exceptional
items (note 7) £m
Total £m
Revenue 3, 4 2,335.0 – 2,335.0 2,341.7 – 2,341.7 Cost of sales (2,046.1) (24.1) (2,070.2) (2,039.8) (8.5) (2,048.3)
Gross profit 288.9 (24.1) 264.8 301.9 (8.5) 293.4 Distribution costs (124.5) (10.6) (135.1) (115.4) (1.8) (117.2) Administrative expenses (56.9) (1.5) (58.4) (55.5) (2.1) (57.6)
Operating profit 6 107.5 (36.2) 71.3 131.0 (12.4) 118.6
Finance income 9 0.1 – 0.1 1.4 – 1.4 Finance costs 10 (12.4) – (12.4) (14.2) – (14.2)
Profit before taxation 95.2 (36.2) 59.0 118.2 (12.4) 105.8 Taxation 11 (17.2) 7.0 (10.2) (22.3) 2.4 (19.9)
Profit for the financial year attributable to owners of the parent 78.0 (29.2) 48.8 95.9 (10.0) 85.9
Pence per share
Pence per share
Pence per share
Pence per share
Basic earnings per share 13 4.0 7.8 7.0 Diluted earnings per share 13 4.0 7.8 7.0
6.4 6.4
Directors’ Remuneration
Responsibilities for the financial statements and the audit Responsibilities of the directors for the financial statements
Auditors’ responsibilities for the audit of the financial statements
Use of this report
OTHER REQUIRED REPORTING Companies Act 2006 exception reporting
Appointment
OTHER MATTER
John Ellis (Senior Statutory Auditor)
Independent auditors’ report to the members of Debenhams plc (Group) continued
88 Debenhams plc Annual Report & Accounts 2017
In our opinion, the part of the Directors’ Remuneration Report to be audited has been properly prepared in accordance with the Companies Act 2006. (CA06)
As explained more fully in the Statement of Directors’ Responsibilities set out on page 80, the directors are responsible for the preparation of the financial statements in accordance with the applicable framework and for being satisfied that they give a true and fair view. The directors are also responsible for such internal control as they determine is necessary to enable the preparation of financial statements that are free from material misstatement, whether due to fraud or error.
In preparing the financial statements, the directors are responsible for assessing the group’s ability to continue as a going concern, disclosing as applicable, matters related to going concern and using the going concern basis of accounting unless the directors either intend to liquidate the group or to cease operations, or have no realistic alternative but to do so.
Our objectives are to obtain reasonable assurance about whether the financial statements as a whole are free from material misstatement, whether due to fraud or error, and to issue an auditors’ report that includes our opinion. Reasonable assurance is a high level of assurance, but is not a guarantee that an audit conducted in accordance with ISAs (UK) will always detect a material misstatement when it exists. Misstatements can arise from fraud or error and are considered material if, individually or in the aggregate, they could reasonably be expected to influence the economic decisions of users taken on the basis of these financial statements.
A further description of our responsibilities for the audit of the financial statements is located on the FRC’s website at: www.frc.org.uk/auditorsresponsibilities. This description forms part of our auditors’ report.
This report, including the opinions, has been prepared for and only for the company’s members as a body in accordance with Chapter 3 of Part 16 of the Companies Act 2006 and for no other purpose. We do not, in giving these opinions, accept or assume responsibility for any other purpose or to any other person to whom this report is shown or into whose hands it may come save where expressly agreed by our prior consent in writing.
Under the Companies Act 2006 we are required to report to you if, in our opinion we have not received all the information and explanations we require for our audit. We have no exceptions to report arising from this responsibility.
Following the recommendation of the audit committee, we were appointed by the members of Debenhams plc to audit the financial statements for its first year after incorporation for the year ended 3 September 2005 and subsequent financial periods. The period of total uninterrupted engagement is 13 years, covering the years ended 3 September 2005 to 2 September 2017. Before 2005, we were auditors of other entities within the Debenhams plc group. The audit committee have set out details of their planned audit tender timetable on page 53 of the annual report and accounts.
We have reported separately on the company financial statements of Debenhams plc for the year ended 2 September 2017 and on the information in the Directors’ Remuneration Report that is described as having been audited.
for and on behalf of PricewaterhouseCoopers LLP Chartered Accountants and Statutory Auditors Reading 26 October 2017
www.debenhams.com 89
Financial Statem
ents
Financial Statements
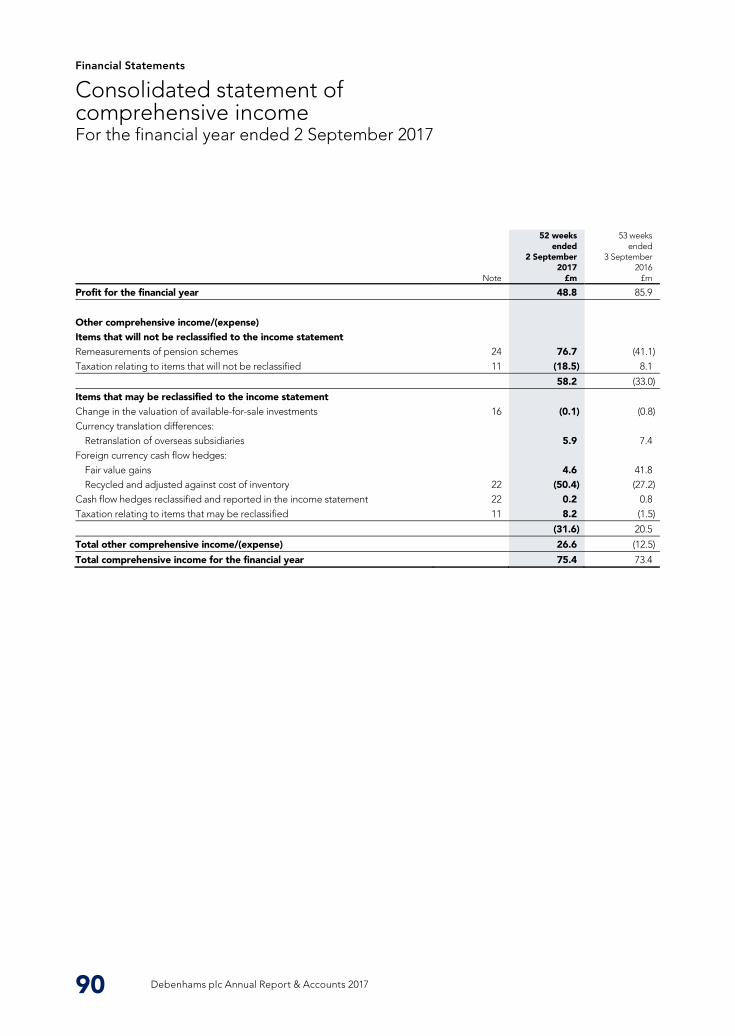
Consolidated statement of comprehensive income For the financial year ended 2 September 2017
90 Debenhams plc Annual Report & Accounts 2017
Note
52 weeks ended
2 September 2017
£m
53 weeks ended
3 September 2016
£m
Profit for the financial year 48.8 85.9
Other comprehensive income/(expense) Items that will not be reclassified to the income statement Remeasurements of pension schemes 24 76.7 (41.1) Taxation relating to items that will not be reclassified 11 (18.5) 8.1
58.2 (33.0)
Items that may be reclassified to the income statement Change in the valuation of available-for-sale investments 16 (0.1) (0.8) Currency translation differences:
Retranslation of overseas subsidiaries 5.9 7.4 Foreign currency cash flow hedges:
Fair value gains 4.6 41.8 Recycled and adjusted against cost of inventory 22 (50.4) (27.2)
Cash flow hedges reclassified and reported in the income statement 22 0.2 0.8 Taxation relating to items that may be reclassified 11 8.2 (1.5)
(31.6) 20.5
Total other comprehensive income/(expense) 26.6 (12.5)
Total comprehensive income for the financial year 75.4 73.4
Debenhams plc Annual Report & Accounts 201790
Matt Smith
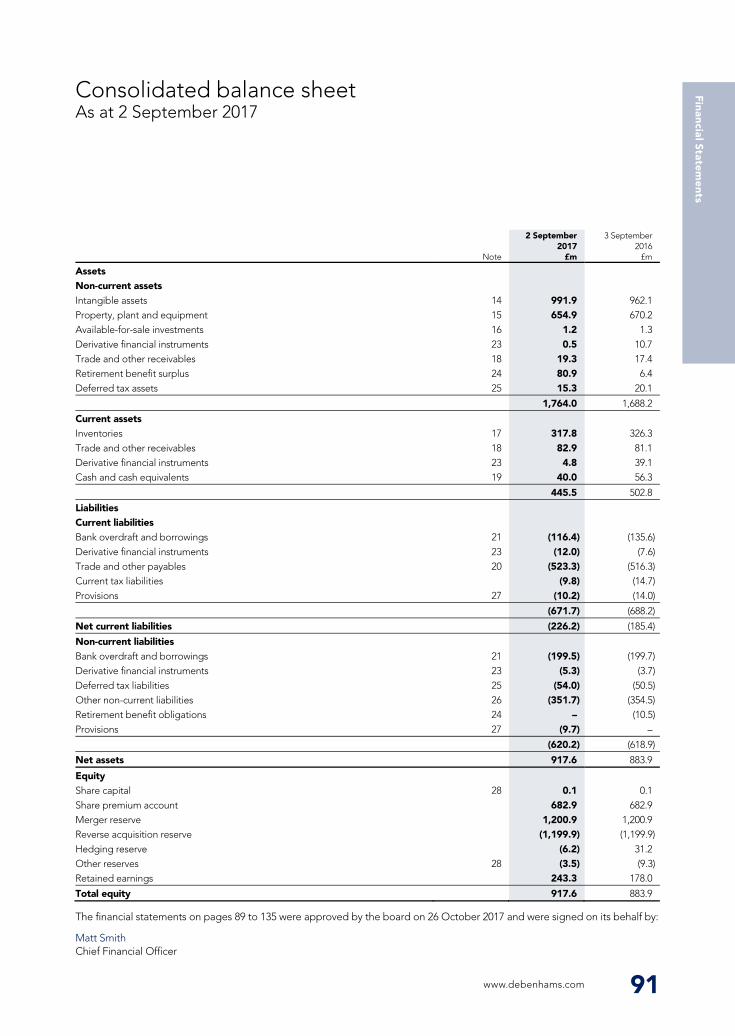
Consolidated balance sheet As at 2 September 2017
www.debenhams.com 91
Note
2 September 2017
£m
3 September 2016
£m
Assets Non-current assets Intangible assets 14 991.9 962.1 Property, plant and equipment 15 654.9 670.2 Available-for-sale investments 16 1.2 1.3 Derivative financial instruments 23 0.5 10.7 Trade and other receivables 18 19.3 17.4 Retirement benefit surplus 24 80.9 6.4 Deferred tax assets 25 15.3 20.1
1,764.0 1,688.2
Current assets Inventories 17 317.8 326.3 Trade and other receivables 18 82.9 81.1 Derivative financial instruments 23 4.8 39.1 Cash and cash equivalents 19 40.0 56.3
445.5 502.8
Liabilities Current liabilities Bank overdraft and borrowings 21 (116.4) (135.6) Derivative financial instruments 23 (12.0) (7.6) Trade and other payables 20 (523.3) (516.3) Current tax liabilities (9.8) (14.7) Provisions 27 (10.2) (14.0)
(671.7) (688.2)
Net current liabilities (226.2) (185.4)
Non-current liabilities Bank overdraft and borrowings 21 (199.5) (199.7) Derivative financial instruments 23 (5.3) (3.7) Deferred tax liabilities 25 (54.0) (50.5) Other non-current liabilities 26 (351.7) (354.5) Retirement benefit obligations 24 – (10.5) Provisions 27 (9.7) –
(620.2) (618.9)
Net assets 917.6 883.9
Equity Share capital 28 0.1 0.1 Share premium account 682.9 682.9 Merger reserve 1,200.9 1,200.9 Reverse acquisition reserve (1,199.9) (1,199.9) Hedging reserve (6.2) 31.2 Other reserves 28 (3.5) (9.3) Retained earnings 243.3 178.0
Total equity 917.6 883.9
The financial statements on pages 89 to 135 were approved by the board on 26 October 2017 and were signed on its behalf by:
Chief Financial Officer
Consolidated statement of comprehensive income For the financial year ended 2 September 2017
90 Debenhams plc Annual Report & Accounts 2017
Note
52 weeks ended
2 September 2017
£m
53 weeks ended
3 September 2016
£m
Profit for the financial year 48.8 85.9
Other comprehensive income/(expense) Items that will not be reclassified to the income statement Remeasurements of pension schemes 24 76.7 (41.1) Taxation relating to items that will not be reclassified 11 (18.5) 8.1
58.2 (33.0)
Items that may be reclassified to the income statement Change in the valuation of available-for-sale investments 16 (0.1) (0.8) Currency translation differences:
Retranslation of overseas subsidiaries 5.9 7.4 Foreign currency cash flow hedges:
Fair value gains 4.6 41.8 Recycled and adjusted against cost of inventory 22 (50.4) (27.2)
Cash flow hedges reclassified and reported in the income statement 22 0.2 0.8 Taxation relating to items that may be reclassified 11 8.2 (1.5)
(31.6) 20.5
Total other comprehensive income/(expense) 26.6 (12.5)
Total comprehensive income for the financial year 75.4 73.4
www.debenhams.com 91
Financial Statem
ents
Financial Statements
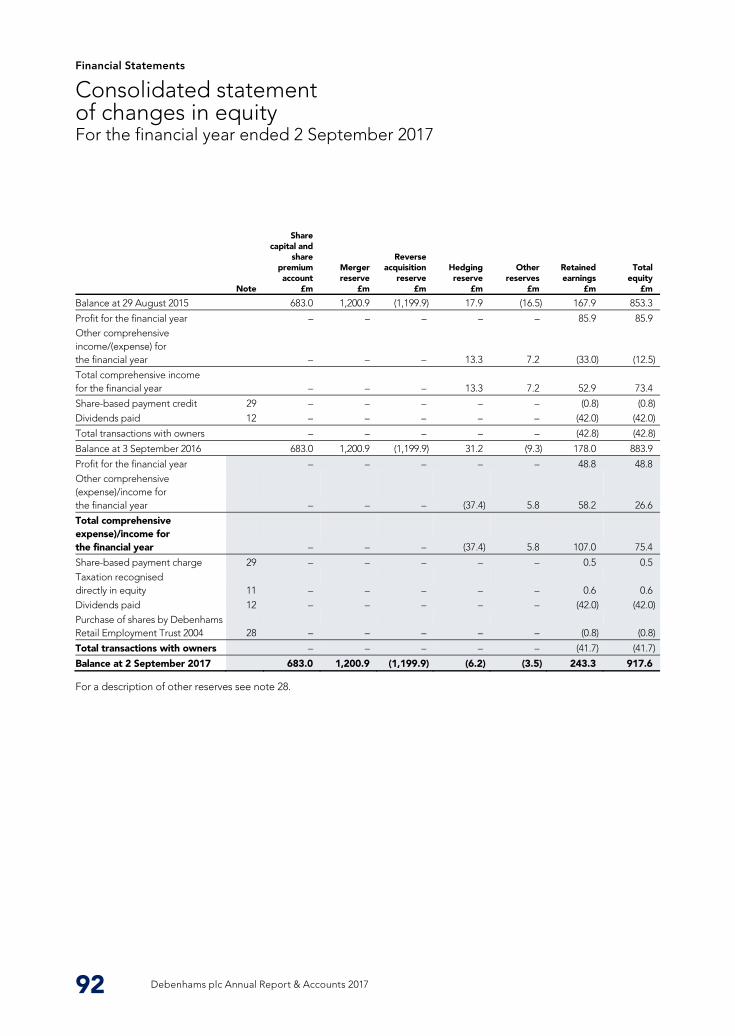
Consolidated statement of changes in equity For the financial year ended 2 September 2017
92 Debenhams plc Annual Report & Accounts 2017
Note
Share capital and
share premium account
£m
Merger reserve
£m
Reverse acquisition
reserve £m
Hedging reserve
£m
Other reserves
£m
Retained earnings
£m
Total equity
£m
Balance at 29 August 2015 683.0 1,200.9 (1,199.9) 17.9 (16.5) 167.9 853.3
Profit for the financial year – – – – – 85.9 85.9 Other comprehensive income/(expense) for the financial year – – – 13.3 7.2 (33.0) (12.5)
Total comprehensive income for the financial year – – – 13.3 7.2 52.9 73.4
Share-based payment credit 29 – – – – – (0.8) (0.8) Dividends paid 12 – – – – – (42.0) (42.0)
Total transactions with owners – – – – – (42.8) (42.8)
Balance at 3 September 2016 683.0 1,200.9 (1,199.9) 31.2 (9.3) 178.0 883.9
Profit for the financial year – – – – – 48.8 48.8 Other comprehensive (expense)/income for the financial year – – – (37.4) 5.8 58.2 26.6
Total comprehensive expense)/income for the financial year – – – (37.4) 5.8 107.0 75.4
Share-based payment charge 29 – – – – – 0.5 0.5 Taxation recognised directly in equity 11 – – – – – 0.6 0.6 Dividends paid 12 – – – – – (42.0) (42.0) Purchase of shares by Debenhams Retail Employment Trust 2004 28 – – – – – (0.8) (0.8)
Total transactions with owners – – – – – (41.7) (41.7)
Balance at 2 September 2017 683.0 1,200.9 (1,199.9) (6.2) (3.5) 243.3 917.6
For a description of other reserves see note 28.
Debenhams plc Annual Report & Accounts 201792
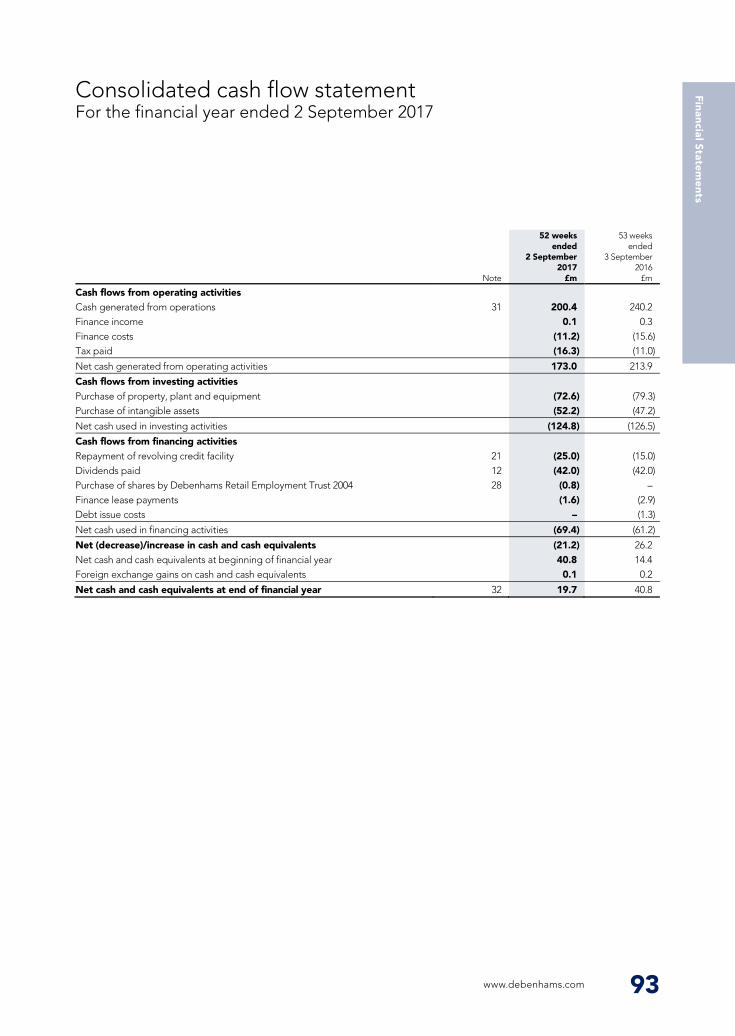
Consolidated cash flow statement For the financial year ended 2 September 2017
www.debenhams.com 93
Note
52 weeks ended
2 September 2017
£m
53 weeks ended
3 September 2016
£m
Cash flows from operating activities Cash generated from operations 31 200.4 240.2 Finance income 0.1 0.3 Finance costs (11.2) (15.6) Tax paid (16.3) (11.0)
Net cash generated from operating activities 173.0 213.9
Cash flows from investing activities Purchase of property, plant and equipment (72.6) (79.3) Purchase of intangible assets (52.2) (47.2)
Net cash used in investing activities (124.8) (126.5)
Cash flows from financing activities Repayment of revolving credit facility 21 (25.0) (15.0) Dividends paid 12 (42.0) (42.0) Purchase of shares by Debenhams Retail Employment Trust 2004 28 (0.8) – Finance lease payments (1.6) (2.9) Debt issue costs – (1.3)
Net cash used in financing activities (69.4) (61.2)
Net (decrease)/increase in cash and cash equivalents (21.2) 26.2 Net cash and cash equivalents at beginning of financial year 40.8 14.4 Foreign exchange gains on cash and cash equivalents 0.1 0.2
Net cash and cash equivalents at end of financial year 32 19.7 40.8
Consolidated statement of changes in equity For the financial year ended 2 September 2017
92 Debenhams plc Annual Report & Accounts 2017
Note
Share capital and
share premium account
£m
Merger reserve
£m
Reverse acquisition
reserve £m
Hedging reserve
£m
Other reserves
£m
Retained earnings
£m
Total equity
£m
Balance at 29 August 2015 683.0 1,200.9 (1,199.9) 17.9 (16.5) 167.9 853.3
Profit for the financial year – – – – – 85.9 85.9 Other comprehensive income/(expense) for the financial year – – – 13.3 7.2 (33.0) (12.5)
Total comprehensive income for the financial year – – – 13.3 7.2 52.9 73.4
Share-based payment credit 29 – – – – – (0.8) (0.8) Dividends paid 12 – – – – – (42.0) (42.0)
Total transactions with owners – – – – – (42.8) (42.8)
Balance at 3 September 2016 683.0 1,200.9 (1,199.9) 31.2 (9.3) 178.0 883.9
Profit for the financial year – – – – – 48.8 48.8 Other comprehensive (expense)/income for the financial year – – – (37.4) 5.8 58.2 26.6
Total comprehensive expense)/income for the financial year – – – (37.4) 5.8 107.0 75.4
Share-based payment charge 29 – – – – – 0.5 0.5 Taxation recognised directly in equity 11 – – – – – 0.6 0.6 Dividends paid 12 – – – – – (42.0) (42.0) Purchase of shares by Debenhams Retail Employment Trust 2004 28 – – – – – (0.8) (0.8)
Total transactions with owners – – – – – (41.7) (41.7)
Balance at 2 September 2017 683.0 1,200.9 (1,199.9) (6.2) (3.5) 243.3 917.6
For a description of other reserves see note 28.
www.debenhams.com 93
Financial Statem
ents
Financial Statements
1 GENERAL INFORMATION Introduction
2 ACCOUNTING POLICIES
Basis of preparation
Alternative performance measures
Basis of consolidation
a) Subsidiaries
Notes to the financial statements For the financial year ended 2 September 2017
94 Debenhams plc Annual Report & Accounts 2017
Debenhams plc (“the Company”) is a public limited company incorporated and domiciled in the United Kingdom under the Companies Act 2006 (Company number 5448421). The address of the registered office is 10 Brock Street, Regent’s Place, London NW1 3FG.
The principal activity of the Company is that of a holding company. The principal activities of the Company and its subsidiaries (together “the Group” or “the Debenhams Group”) are the sale of fashion clothing and accessories, beauty and gifting products and products for use in the home. The Group trades from department stores and online in the UK, the Republic of Ireland and Denmark and has international franchise stores.
The Group prepares its financial statements for the financial year ending on the nearest Saturday to 31 August of a given calendar year. Consequently the year ended 2 September 2017 is a 52-week year, with the comparative year ended 3 September 2016 being a 53-week year.
The subsidiary undertakings within the Group during the financial year ended 2 September 2017 are disclosed in note 4 to the Debenhams plc Company financial statements.
The Group’s principal accounting policies, as described below, have been consistently applied to all financial years presented, unless otherwise stated.
The consolidated financial statements have been prepared on the going concern basis and in accordance with International Financial Reporting Standards (“IFRS”) including International Accounting Standards (“IAS”) and IFRS Interpretations Committee (“IFRS IC”) interpretations and with those parts of the Companies Act 2006 applicable to companies reporting under accounting standards as adopted for use in the EU. The consolidated financial statements for the financial years ended 2 September 2017 and 3 September 2016 have been prepared under the historical cost convention as modified by the revaluation of available-for-sale financial assets and financial assets and financial liabilities (including derivative instruments) at fair value through the income statement.
The preparation of the financial statements, in conformity with IFRS, requires the use of estimates and assumptions that affect the reported amounts of assets and liabilities at the date of the financial statements and the reported amounts of revenue and expenses during the reporting period. Although these results are based on management’s best knowledge of the amounts, events or actions, actual results ultimately may differ from those estimates (see note 5).
In reporting financial information, the Group presents alternative performance measures “APMs”, which are not defined or specified under the requirements of IFRS and therefore may not be directly comparable with other companies’ APMs.
The Group believes that these APMs, which are not considered a substitute for or superior to IFRS measures, provide stakeholders with additional helpful information on the performance of the business. The APMs are consistent with how business performance is planned and reported within the internal management reporting to the board and executive committee. Some of the measures are also used for the purpose of setting remuneration targets.
The key APMs that the Group uses include gross transaction value; like-for-like sales; gross margin; underlying profit before tax before exceptional items; underlying earnings per share before exceptional items; underlying Group earnings before interest, taxation, depreciation, amortisation and exceptional items (“underlying EBITDA”); effective tax rate; net debt and return on capital employed. Each of these APMs and others used by the Group, are set out in the Glossary on pages 152 to 154 including explanations of how they are calculated and how they can be reconciled to a statutory measure where relevant.
Items which are both non-recurring and material in either size or nature are presented as exceptional items within their relevant income statement line. The separate reporting of exceptional items helps provide a better indication of underlying performance of the Group. The principal items which are included as exceptional items are costs arising from significant strategy changes that are not considered by the Group to be part of the normal operating costs of the business. These costs may include restructuring and other associated costs (only where there is a significant or wholesale restructuring programme), impairment charges and onerous lease charges.
The financial statements comprise a consolidation of the accounts of Debenhams plc, its subsidiaries and the Group’s share of its interests in associates.
Subsidiaries include all entities over which the Group has control. The Group controls an entity when the Group is exposed to, or has rights to, variable returns from its involvement with the entity and has the ability to affect those returns through its power to direct the activities of the entity. Subsidiaries are fully consolidated from the date on which control is transferred to the Group. They are de-consolidated from the date that control ceases.
Debenhams plc Annual Report & Accounts 201794
b) Associates
Revenue recognition
Supplier income recognition
Segmental reporting
Interest recognition
Dividend distribution
www.debenhams.com 95
On consolidation, inter company transactions, balances and unrealised gains on transactions between Group companies are eliminated. Unrealised losses are also eliminated unless the transaction provides evidence of an impairment of the asset transferred. On acquisition, accounting policies of the Company and its subsidiaries have been changed where these have a significant impact on the Group’s income statement or balance sheet to ensure consistency with the policies adopted by the Group.
An associate is an entity over which the Group has significant influence. Significant influence is the power to participate in the financial and operating policy decisions of the investee, but it is not control or joint control over those policies.
The Group’s share of the results of associates is incorporated into the Group’s results using the equity method of accounting. Investments in associates are carried in the Group balance sheet at cost plus post-acquisition changes in the Group’s share of the net assets of the entity, less any impairment in value. The carrying values of investments in associates include acquired goodwill.
If the Group’s share of losses in an associate equals or exceeds its investment in the associate, the Group does not recognise further losses, unless it has incurred obligations to do so or made payments on behalf of the associate.
Revenue is measured at the fair value of the consideration received or receivable and represents amounts receivable for goods and services provided in the normal course of business, net of staff discounts, and is stated net of value added tax and other sales-related taxes. Revenue is also adjusted for the fair value of loyalty points awarded. Loyalty points awarded are reflected within liabilities until such time as they are redeemed.
Revenue on department store sales of goods and commission on concession and consignment sales is recognised when goods are sold to the customer. Retail sales are usually settled in cash or by credit or debit card. Internet sales are recognised when the goods are despatched to the customer. Revenue from gift cards and gift vouchers sold by the Group is recognised on the redemption of the gift card or gift voucher. Revenue from sales to franchisees is recognised when goods are despatched or when goods are sold to the customer depending on the terms of the franchise agreement. Revenue from franchise fees is recognised when earned.
It is the Group’s policy to sell its products to retail customers with a right of return. Accumulated experience is used to estimate and provide for such returns at the time of sale.
The Group receives income from its suppliers, mainly in the form of settlement discounts, volume-based rebates and marketing and advertising income. Supplier income is recognised as a deduction from cost of sales, based on the expected entitlement that has been earned up to the balance sheet date. The Group only recognises supplier income where there is documented evidence of an agreement with a supplier.
Settlement discounts are recognised on receipt of the invoice, provided that the invoice will be settled in accordance with the agreed terms. Volume-based rebates are earned based on purchase or sales triggers over specific periods, such as the number of units sold to customers or purchased from the supplier. Volume-based rebates are recognised once the Group has a contractual entitlement to the income, income can be estimated reliably and it is probable that it will be received. Marketing and advertising income includes markdown or marketing support provided by suppliers and is agreed with suppliers for specified periods and products.
A proportion of the Group’s trading terms state that income due from suppliers will be netted against amounts owing to that supplier. Any outstanding invoiced supplier income relating to these suppliers at the balance sheet date will be deducted from trade payables. Where these trading terms do not exist, the Group classifies outstanding supplier income within trade receivables. Where supplier income is earned and not invoiced to the supplier at the balance sheet date, this is classified within prepayments and accrued income.
IFRS 8 “Operating segments” requires segment information to be presented based on what is reported to the Chief Operating Decision Maker. The Group has identified the Executive Committee as its Chief Operating Decision Maker and has identified two operating segments, UK and International.
Finance income and finance costs are recognised in the period to which they relate using the effective interest rate method.
A final dividend distribution to the Company’s shareholders is recognised as a liability in the Company’s and Group’s financial statements in the period in which the dividend is approved by the Company’s shareholders. Interim dividends are recognised when paid.
1 GENERAL INFORMATION Introduction
2 ACCOUNTING POLICIES
Basis of preparation
Alternative performance measures
Basis of consolidation
a) Subsidiaries
Notes to the financial statements For the financial year ended 2 September 2017
94 Debenhams plc Annual Report & Accounts 2017
Debenhams plc (“the Company”) is a public limited company incorporated and domiciled in the United Kingdom under the Companies Act 2006 (Company number 5448421). The address of the registered office is 10 Brock Street, Regent’s Place, London NW1 3FG.
The principal activity of the Company is that of a holding company. The principal activities of the Company and its subsidiaries (together “the Group” or “the Debenhams Group”) are the sale of fashion clothing and accessories, beauty and gifting products and products for use in the home. The Group trades from department stores and online in the UK, the Republic of Ireland and Denmark and has international franchise stores.
The Group prepares its financial statements for the financial year ending on the nearest Saturday to 31 August of a given calendar year. Consequently the year ended 2 September 2017 is a 52-week year, with the comparative year ended 3 September 2016 being a 53-week year.
The subsidiary undertakings within the Group during the financial year ended 2 September 2017 are disclosed in note 4 to the Debenhams plc Company financial statements.
The Group’s principal accounting policies, as described below, have been consistently applied to all financial years presented, unless otherwise stated.
The consolidated financial statements have been prepared on the going concern basis and in accordance with International Financial Reporting Standards (“IFRS”) including International Accounting Standards (“IAS”) and IFRS Interpretations Committee (“IFRS IC”) interpretations and with those parts of the Companies Act 2006 applicable to companies reporting under accounting standards as adopted for use in the EU. The consolidated financial statements for the financial years ended 2 September 2017 and 3 September 2016 have been prepared under the historical cost convention as modified by the revaluation of available-for-sale financial assets and financial assets and financial liabilities (including derivative instruments) at fair value through the income statement.
The preparation of the financial statements, in conformity with IFRS, requires the use of estimates and assumptions that affect the reported amounts of assets and liabilities at the date of the financial statements and the reported amounts of revenue and expenses during the reporting period. Although these results are based on management’s best knowledge of the amounts, events or actions, actual results ultimately may differ from those estimates (see note 5).
In reporting financial information, the Group presents alternative performance measures “APMs”, which are not defined or specified under the requirements of IFRS and therefore may not be directly comparable with other companies’ APMs.
The Group believes that these APMs, which are not considered a substitute for or superior to IFRS measures, provide stakeholders with additional helpful information on the performance of the business. The APMs are consistent with how business performance is planned and reported within the internal management reporting to the board and executive committee. Some of the measures are also used for the purpose of setting remuneration targets.
The key APMs that the Group uses include gross transaction value; like-for-like sales; gross margin; underlying profit before tax before exceptional items; underlying earnings per share before exceptional items; underlying Group earnings before interest, taxation, depreciation, amortisation and exceptional items (“underlying EBITDA”); effective tax rate; net debt and return on capital employed. Each of these APMs and others used by the Group, are set out in the Glossary on pages 152 to 154 including explanations of how they are calculated and how they can be reconciled to a statutory measure where relevant.
Items which are both non-recurring and material in either size or nature are presented as exceptional items within their relevant income statement line. The separate reporting of exceptional items helps provide a better indication of underlying performance of the Group. The principal items which are included as exceptional items are costs arising from significant strategy changes that are not considered by the Group to be part of the normal operating costs of the business. These costs may include restructuring and other associated costs (only where there is a significant or wholesale restructuring programme), impairment charges and onerous lease charges.
The financial statements comprise a consolidation of the accounts of Debenhams plc, its subsidiaries and the Group’s share of its interests in associates.
Subsidiaries include all entities over which the Group has control. The Group controls an entity when the Group is exposed to, or has rights to, variable returns from its involvement with the entity and has the ability to affect those returns through its power to direct the activities of the entity. Subsidiaries are fully consolidated from the date on which control is transferred to the Group. They are de-consolidated from the date that control ceases.
www.debenhams.com 95
Financial Statem
ents
Financial Statements
2 ACCOUNTING POLICIES CONTINUED Retirement benefit costs
Share-based payments
Foreign exchange a) Functional and presentation currency
b) Group companies
c) Transactions and balances
Notes to the financial statements For the financial year ended 2 September 2017 continued
96 Debenhams plc Annual Report & Accounts 2017
The Group operates various defined benefit and defined contribution schemes for its employees.
A defined benefit scheme is a pension plan that defines an amount of pension benefit that an employee will receive on retirement.
The pension scheme surplus or deficit recognised in the balance sheet represents the difference between the fair value of the plan assets and the present value of the defined benefit obligation at the balance sheet date. This surplus or deficit is actuarially calculated on an annual basis using the projected unit credit method. The income statement is charged or credited with a net interest expense which is calculated by applying the discount rate to the net defined benefit liability or asset. Administration costs of pension funds are recognised as an expense when the administration services are performed. Actuarial gains and losses are recognised immediately in the statement of comprehensive income. A retirement benefit surplus is only recognised to the extent that it is expected to be recoverable in the future.
A defined contribution scheme is a pension plan under which the Group pays fixed contributions to a separate entity. Payments to defined contribution pension schemes are charged as an expense as they fall due. Any contributions unpaid at the balance sheet date are included as an accrual as at that date. The Group has no further payment obligations once the contributions have been paid.
The Group issues equity-settled share-based awards to certain employees. A fair value for the equity-settled share awards is measured at the date of grant. The Group measures the fair value of each award using the Black-Scholes model where appropriate.
The fair value determined at the grant date is expensed on a straight line basis over the vesting period, based on the Group’s estimate of the shares that will eventually vest and adjusted for the effect of non-market vesting conditions. At each balance sheet date, the Group revises its estimates of the number of awards that are expected to vest. Non-market performance and service conditions are included in assumptions about the number of awards that are expected to vest.
The Group recognises the impact of the revision to original estimates, if any, in the income statement, with a corresponding adjustment to equity.
When the awards are exercised, the Company may, if permitted, issue new shares, or utilise shares held as treasury shares or those held within the Debenhams Retail Employee Trust. The proceeds received net of any directly attributable transaction costs (for new share issues) are credited to share capital (at nominal value) and share premium when the awards are exercised.
Items included in the financial statements of each of the Group’s entities are measured using the currency of the primary economic environment in which the entity operates (“the functional currency”). The consolidated financial statements are presented in sterling, which is the Group’s presentation currency.
The results and financial position of all Group entities that have a functional currency different from the presentation currency are translated into the presentation currency as follows:
Assets and liabilities are translated at the closing rate at the date of the balance sheet.
Income and expenses are translated at the average exchange rate unless this average is not a reasonable approximation of the cumulative effect of the rates prevailing on the transaction dates, in which case income and expenses are translated at the dates of the transaction.
The resulting net exchange difference is recognised in other comprehensive income and accumulated as a separate component of equity.
Transactions denominated in foreign currencies are translated into the respective functional currency at the exchange rates prevailing at the dates of the transactions.
Foreign exchange gains and losses resulting from the settlement of such transactions and from the translation, at the balance sheet date exchange rate, of monetary assets and liabilities denominated in foreign currencies, are recognised in the income statement, except when deferred in other comprehensive income as qualifying cash flow hedges.
Monetary assets and liabilities denominated in foreign currencies are translated into sterling at the closing rates ruling at the balance sheet date.
Translation differences on non-monetary financial assets, such as equities classified as available-for-sale, are included in other comprehensive income and accumulated as a separate component of equity.
Foreign exchange gains and losses that relate to borrowings, cash and cash equivalents and the translation of inter company loans, are presented in the income statement within finance income or costs, with the exception of foreign exchange gains and losses that relate to inter company loans classed as permanent equity which are recognised in other comprehensive income. All other foreign exchange gains and losses are presented in the income statement within cost of sales.
Debenhams plc Annual Report & Accounts 201796
Taxation
Leased assets a) Finance leases
b) Operating leases
Business combinations
Intangible assets a) Goodwill
b) Other intangible assets
www.debenhams.com 97
Taxation expense represents the sum of current tax and deferred tax. Taxation which relates to items recognised in other comprehensive income or equity is recognised in other comprehensive income or equity respectively.
Current tax is based on taxable profits for the financial period using tax rates that are in force during the period. Taxable profit differs from net profit as reported in the income statement because it excludes items of income or expense that are taxable or deductible in other financial years and it further excludes items that are never taxable or deductible.
Deferred tax is provided in full, using the liability method, on temporary differences arising between the tax bases of assets and liabilities and their carrying amounts for financial reporting purposes. If deferred tax arises from initial recognition of an asset or liability in a transaction other than a business combination that at the time of the transaction affects neither accounting nor taxable profit or loss, it is not accounted for. Deferred tax is determined using tax rates that have been enacted or substantively enacted at the balance sheet date and are expected to apply when the related deferred tax asset is realised or the deferred tax liability is settled.
Deferred tax assets are recognised to the extent that it is probable that future taxable profit will be available against which the temporary differences can be utilised.
Deferred tax is provided on temporary differences arising on investments in subsidiaries, except where the timing of the reversals of the temporary differences is controlled by the Group and it is probable that the temporary differences will not reverse in the foreseeable future.
Leases of assets which transfer substantially all the risks and rewards of ownership to the Group are classified as finance leases. Finance leases are classified as a financial liability and measured at amortised cost. Finance leases are capitalised at the inception of the lease at the lower of the fair value of the asset or the present value of the minimum lease payments and depreciated over the useful economic life or the period of the lease. The resulting lease obligations are included in liabilities.
Lease payments are apportioned between finance costs and reduction of the lease obligation so as to achieve a constant rate of interest on the remaining balance of the liability.
All other leases are classified as operating leases. Rentals payable under operating leases, net of lease incentives, are charged to the income statement on a straight line basis over the period of the lease.
Where property lease contracts contain guaranteed fixed minimum incremental rental payments, the total committed cost is determined and is calculated and amortised on a straight line basis over the life of the lease.
The purchase method of accounting is used to account for all business combinations.
The cost of an acquisition is measured as the fair value of the consideration given, liabilities incurred or assumed and equity instruments issued by the Group in exchange for control of the acquiree. All costs directly attributable to an acquisition are expensed to the income statement.
Identifiable assets, liabilities and contingent liabilities acquired in a business combination are initially measured at their fair values at the acquisition date. The excess of cost over the Group’s share of identifiable net assets acquired is recognised as goodwill. If, after reassessment, the cost of acquisition is less than the fair value of assets acquired, the excess is immediately recognised in the income statement.
Goodwill on acquisition of subsidiaries represents the excess of the cost of an acquisition over the fair value of the Group’s share of the net identifiable assets, liabilities and contingent liabilities of the acquired subsidiary. Goodwill on acquisition of subsidiaries is included in intangible assets. Goodwill is not amortised but tested for impairment annually, or when trigger events occur, and carried at cost less accumulated impairment losses.
Goodwill also represents the goodwill for a portfolio of sites which have been allocated to cash-generating units for the purpose of impairment testing on the basis of UK and other which is the lowest level at which goodwill is monitored for internal management purposes.
Other intangible assets are held at cost less accumulated amortisation and any provision for impairment.
Internally generated software costs, where it is clear that the software developed is technically feasible and will be completed and that the software generated will generate economic benefit, are capitalised as an intangible asset. Included within intangible assets are assets in the course of construction. These assets include directly attributable costs to bring the assets into use and may include capitalised borrowing costs. Amortisation is provided at the following rates per annum to write off the costs of other intangible assets, less residual value, on a straight line basis from the date on which they are brought into use:
Acquired licences and trademarks Up to 10.0% Internally generated software 10.0% to 33.3% Purchased software 10.0% to 33.3%
2 ACCOUNTING POLICIES CONTINUED Retirement benefit costs
Share-based payments
Foreign exchange a) Functional and presentation currency
b) Group companies
c) Transactions and balances
Notes to the financial statements For the financial year ended 2 September 2017 continued
96 Debenhams plc Annual Report & Accounts 2017
The Group operates various defined benefit and defined contribution schemes for its employees.
A defined benefit scheme is a pension plan that defines an amount of pension benefit that an employee will receive on retirement.
The pension scheme surplus or deficit recognised in the balance sheet represents the difference between the fair value of the plan assets and the present value of the defined benefit obligation at the balance sheet date. This surplus or deficit is actuarially calculated on an annual basis using the projected unit credit method. The income statement is charged or credited with a net interest expense which is calculated by applying the discount rate to the net defined benefit liability or asset. Administration costs of pension funds are recognised as an expense when the administration services are performed. Actuarial gains and losses are recognised immediately in the statement of comprehensive income. A retirement benefit surplus is only recognised to the extent that it is expected to be recoverable in the future.
A defined contribution scheme is a pension plan under which the Group pays fixed contributions to a separate entity. Payments to defined contribution pension schemes are charged as an expense as they fall due. Any contributions unpaid at the balance sheet date are included as an accrual as at that date. The Group has no further payment obligations once the contributions have been paid.
The Group issues equity-settled share-based awards to certain employees. A fair value for the equity-settled share awards is measured at the date of grant. The Group measures the fair value of each award using the Black-Scholes model where appropriate.
The fair value determined at the grant date is expensed on a straight line basis over the vesting period, based on the Group’s estimate of the shares that will eventually vest and adjusted for the effect of non-market vesting conditions. At each balance sheet date, the Group revises its estimates of the number of awards that are expected to vest. Non-market performance and service conditions are included in assumptions about the number of awards that are expected to vest.
The Group recognises the impact of the revision to original estimates, if any, in the income statement, with a corresponding adjustment to equity.
When the awards are exercised, the Company may, if permitted, issue new shares, or utilise shares held as treasury shares or those held within the Debenhams Retail Employee Trust. The proceeds received net of any directly attributable transaction costs (for new share issues) are credited to share capital (at nominal value) and share premium when the awards are exercised.
Items included in the financial statements of each of the Group’s entities are measured using the currency of the primary economic environment in which the entity operates (“the functional currency”). The consolidated financial statements are presented in sterling, which is the Group’s presentation currency.
The results and financial position of all Group entities that have a functional currency different from the presentation currency are translated into the presentation currency as follows:
Assets and liabilities are translated at the closing rate at the date of the balance sheet.
Income and expenses are translated at the average exchange rate unless this average is not a reasonable approximation of the cumulative effect of the rates prevailing on the transaction dates, in which case income and expenses are translated at the dates of the transaction.
The resulting net exchange difference is recognised in other comprehensive income and accumulated as a separate component of equity.
Transactions denominated in foreign currencies are translated into the respective functional currency at the exchange rates prevailing at the dates of the transactions.
Foreign exchange gains and losses resulting from the settlement of such transactions and from the translation, at the balance sheet date exchange rate, of monetary assets and liabilities denominated in foreign currencies, are recognised in the income statement, except when deferred in other comprehensive income as qualifying cash flow hedges.
Monetary assets and liabilities denominated in foreign currencies are translated into sterling at the closing rates ruling at the balance sheet date.
Translation differences on non-monetary financial assets, such as equities classified as available-for-sale, are included in other comprehensive income and accumulated as a separate component of equity.
Foreign exchange gains and losses that relate to borrowings, cash and cash equivalents and the translation of inter company loans, are presented in the income statement within finance income or costs, with the exception of foreign exchange gains and losses that relate to inter company loans classed as permanent equity which are recognised in other comprehensive income. All other foreign exchange gains and losses are presented in the income statement within cost of sales.
www.debenhams.com 97
Financial Statem
ents
Financial Statements
2 ACCOUNTING POLICIES CONTINUED Impairment testing
Property, plant and equipment
Impairment testing
Capitalisation of finance costs
Available-for-sale investments
Notes to the financial statements For the financial year ended 2 September 2017 continued
98 Debenhams plc Annual Report & Accounts 2017
Assets that have an indefinite useful life, for example goodwill or intangible assets not ready for use, are not subject to amortisation and are tested annually for impairment. Assets that are subject to amortisation are reviewed for impairment whenever events or changes in circumstances indicate that the carrying value may not be recoverable. An impairment loss is recognised for the amount by which the asset’s carrying amount exceeds its recoverable amount. The recoverable amount is the higher of an asset’s fair value less costs to sell and value-in-use. For the purposes of assessing impairment, assets are grouped by store, which is the lowest level for which there are separately identifiable cash flows (cash-generating units). Non-financial assets other than goodwill that have been impaired are reviewed at each reporting date for possible reversal of the impairment.
Property, plant and equipment is held at historical purchase cost less accumulated depreciation and any provision for impairment. Cost includes the original purchase price of the asset and the costs attributable to bringing the asset to its working condition for its intended use. This may include capitalised borrowing costs.
Depreciation is provided at the following rates per annum to write off the cost of property, plant and equipment, less residual value, on a straight line basis from the date on which the assets are brought into use:
Freehold land Not depreciated Freehold buildings 1.0% Long leasehold land and buildings including landlords’ fixtures and fittings
1.0% or life of lease if shorter
Short leasehold land and buildings including landlords’ fixtures and fittings Life of lease Retail fixtures and fittings 4.0% to 25.0% Office equipment 10.0% to 12.5% Computer equipment 10.0% to 33.3% Vehicles 20.0%
Gains and losses on disposal are determined by comparing proceeds with carrying amount. These are included in the income statement.
Included within property, plant and equipment are assets in the course of construction. These assets comprise stores which are under construction or modernisation, including costs directly attributable to bring the asset into use. Transfers to the appropriate category of property, plant and equipment are made when the store opens. No depreciation is provided on stores or other assets under construction.
Assets that have an indefinite useful life are not subject to depreciation and are tested annually for impairment. Assets that are subject to depreciation are reviewed for impairment whenever events or changes in circumstances indicate that the carrying value may not be recoverable. An impairment loss is recognised for the amount by which the asset’s carrying amount exceeds its recoverable amount.
The recoverable amount is the higher of an asset’s fair value less costs to sell and value-in-use. For the purposes of assessing impairment, assets are grouped by store, which is the lowest level for which there are separately identifiable cash flows (cash-generating units). Non-financial assets that have been impaired are reviewed at each reporting date for possible reversal of the impairment.
Finance costs that are directly attributable to the acquisition or construction of qualifying assets are capitalised to the cost of the asset, gross of tax relief. Qualifying assets are those that necessarily take a substantial period of time to prepare for their intended use.
Purchases and sales of financial assets are recognised on the trade-date, being the date on which the Group commits to purchase or sell the asset. The Group classifies its investments as available-for-sale financial assets in accordance with IAS 39 “Financial instruments: recognition and measurement” (“IAS 39”). Available-for-sale financial investments are non-derivative assets that are either designated in this category or are not classified in the other financial instrument categories being “Fair value through profit or loss” or “Loans and receivables”. They are included in non-current assets unless management intends to dispose of the investment within 12 months of the balance sheet date. Available-for-sale investments are recognised at fair value.
The fair values of quoted investments are based on current bid prices. If the market for a financial asset (and for unlisted securities) is not active, the Group establishes fair value by using valuation techniques. These include the use of recent arm’s length transactions, reference to other instruments that are substantially the same, discounted cash flow analysis and option pricing models, making maximum use of market inputs and relying as little as possible on entity specific inputs. The fair value of available-for-sale investments denominated in a foreign currency is calculated in that foreign currency and translated at the closing rate at the reporting date. Changes in the fair value of securities classified as “available-for-sale” are recognised in other comprehensive income.
An impairment test is performed annually on the carrying value of each investment. An impairment loss is recognised for the amount by which the asset’s carrying value exceeds its recoverable amount. Impairment losses are recognised in the income statement.
Debenhams plc Annual Report & Accounts 201798
Inventories
Trade and other receivables
Cash and cash equivalents
Borrowings
Debt repurchase
Trade payables
Other payables and non-current liabilities
Provisions
Derivatives
www.debenhams.com 99
Inventories are stated at the lower of cost and net realisable value primarily using the retail method and represent goods for resale. The retail method is an industry specific accounting method used to derive a weighted average product cost. Product cost and retail values are aggregated at a departmental level to determine an average margin per department. These margins are then applied to the retail value of inventory to derive the cost of the inventory.
Cost includes all direct expenditure and other attributable costs, net of volume and settlement supplier discounts, incurred in bringing inventories to their present location and condition. Net realisable value is the estimated selling price in the ordinary course of business, less applicable variable selling expenses. This method intrinsically takes into account any stock loss or markdown to goods sold below cost. Concession inventories are not included within inventory held by the Group. Inventories on consignment at third parties are included within inventory held by the Group.
Trade receivables are initially recognised at fair value and subsequently held at amortised cost less provisions for impairment. A provision for impairment of trade receivables is established when there is evidence that the Group will not be able to collect all amounts due according to the original terms of the receivables. The amount of the provision is the difference between the asset’s carrying amount and the present value of future cash flows discounted at the effective interest rate. The movement in the provision is recognised in the income statement.
Cash and cash equivalents include cash in hand, deposits held at the bank and other short-term liquid investments with original maturities of three months or less.
Borrowings are recognised initially at fair value, net of transaction costs incurred. Borrowings are subsequently stated at amortised cost. Any difference between the proceeds (net of transaction costs) and the redemption value is recognised in the income statement over the period of the borrowings using the effective interest method.
Borrowings are classified as current liabilities unless the Group has an unconditional right to defer settlement of the liability for at least 12 months after the balance sheet date.
Transaction costs associated with borrowings are recognised initially at fair value and are amortised over the term of the facilities using the effective interest rate on the committed amount of each facility.
The nominal value of debt repurchased is accounted for as a loan redemption, reducing net borrowings at the balance sheet date.
Trade payables, defined as financial liabilities in accordance with IAS 39, are recognised initially at fair value and subsequently measured at amortised cost using the effective interest method.
All of the trade payables are non-interest bearing.
Included within other payables are lease incentives received from landlords either through developers’ contributions or rent-free periods. These incentives are credited to the income statement on a straight line basis over the term of the relevant lease. Other payables also relate to the spreading of charges in respect of leases with fixed annual increments in rent (escalating rent clauses) over the term of the relevant lease.
Provisions are recognised when the Group has a present legal or constructive obligation as a result of past events and where it is more likely than not an outflow of resources will be required to settle the obligation and the amount can be reliably estimated. Provisions are measured at management’s best estimate of the expenditure required to settle the obligation at the balance sheet date.
Derivatives comprise forward foreign currency contracts and interest rate swaps. Derivatives are initially recognised at fair value on the date a derivative contract is entered into and are subsequently remeasured at fair value. The method of recognising the resulting gain or loss depends on whether the derivative is designated as an effective hedging instrument and the nature of the item being hedged. The Group designates certain derivatives as hedges of highly probable forecast transactions (cash flow hedges).
At the inception of the transaction, the Group documents the relationship between hedging instruments and hedged items as well as its risk management objective and strategy for undertaking various hedge transactions. The Group also documents its assessment, both at the inception and on an ongoing basis, of whether the derivatives that are used in hedging transactions are highly effective in offsetting changes in cash flows of hedged items.
Hedge accounting is discontinued when the hedging instrument expires or is sold, terminated, or exercised, the hedge relationship no longer qualifies for hedge accounting, the forecast transaction is no longer expected to occur or the Group de-designates the hedge relationship. The replacement or roll-over of a hedging instrument into another hedging instrument is not an expiration or termination if it formed part of the Group’s documented hedging strategy from inception.
2 ACCOUNTING POLICIES CONTINUED Impairment testing
Property, plant and equipment
Impairment testing
Capitalisation of finance costs
Available-for-sale investments
Notes to the financial statements For the financial year ended 2 September 2017 continued
98 Debenhams plc Annual Report & Accounts 2017
Assets that have an indefinite useful life, for example goodwill or intangible assets not ready for use, are not subject to amortisation and are tested annually for impairment. Assets that are subject to amortisation are reviewed for impairment whenever events or changes in circumstances indicate that the carrying value may not be recoverable. An impairment loss is recognised for the amount by which the asset’s carrying amount exceeds its recoverable amount. The recoverable amount is the higher of an asset’s fair value less costs to sell and value-in-use. For the purposes of assessing impairment, assets are grouped by store, which is the lowest level for which there are separately identifiable cash flows (cash-generating units). Non-financial assets other than goodwill that have been impaired are reviewed at each reporting date for possible reversal of the impairment.
Property, plant and equipment is held at historical purchase cost less accumulated depreciation and any provision for impairment. Cost includes the original purchase price of the asset and the costs attributable to bringing the asset to its working condition for its intended use. This may include capitalised borrowing costs.
Depreciation is provided at the following rates per annum to write off the cost of property, plant and equipment, less residual value, on a straight line basis from the date on which the assets are brought into use:
Freehold land Not depreciated Freehold buildings 1.0% Long leasehold land and buildings including landlords’ fixtures and fittings
1.0% or life of lease if shorter
Short leasehold land and buildings including landlords’ fixtures and fittings Life of lease Retail fixtures and fittings 4.0% to 25.0% Office equipment 10.0% to 12.5% Computer equipment 10.0% to 33.3% Vehicles 20.0%
Gains and losses on disposal are determined by comparing proceeds with carrying amount. These are included in the income statement.
Included within property, plant and equipment are assets in the course of construction. These assets comprise stores which are under construction or modernisation, including costs directly attributable to bring the asset into use. Transfers to the appropriate category of property, plant and equipment are made when the store opens. No depreciation is provided on stores or other assets under construction.
Assets that have an indefinite useful life are not subject to depreciation and are tested annually for impairment. Assets that are subject to depreciation are reviewed for impairment whenever events or changes in circumstances indicate that the carrying value may not be recoverable. An impairment loss is recognised for the amount by which the asset’s carrying amount exceeds its recoverable amount.
The recoverable amount is the higher of an asset’s fair value less costs to sell and value-in-use. For the purposes of assessing impairment, assets are grouped by store, which is the lowest level for which there are separately identifiable cash flows (cash-generating units). Non-financial assets that have been impaired are reviewed at each reporting date for possible reversal of the impairment.
Finance costs that are directly attributable to the acquisition or construction of qualifying assets are capitalised to the cost of the asset, gross of tax relief. Qualifying assets are those that necessarily take a substantial period of time to prepare for their intended use.
Purchases and sales of financial assets are recognised on the trade-date, being the date on which the Group commits to purchase or sell the asset. The Group classifies its investments as available-for-sale financial assets in accordance with IAS 39 “Financial instruments: recognition and measurement” (“IAS 39”). Available-for-sale financial investments are non-derivative assets that are either designated in this category or are not classified in the other financial instrument categories being “Fair value through profit or loss” or “Loans and receivables”. They are included in non-current assets unless management intends to dispose of the investment within 12 months of the balance sheet date. Available-for-sale investments are recognised at fair value.
The fair values of quoted investments are based on current bid prices. If the market for a financial asset (and for unlisted securities) is not active, the Group establishes fair value by using valuation techniques. These include the use of recent arm’s length transactions, reference to other instruments that are substantially the same, discounted cash flow analysis and option pricing models, making maximum use of market inputs and relying as little as possible on entity specific inputs. The fair value of available-for-sale investments denominated in a foreign currency is calculated in that foreign currency and translated at the closing rate at the reporting date. Changes in the fair value of securities classified as “available-for-sale” are recognised in other comprehensive income.
An impairment test is performed annually on the carrying value of each investment. An impairment loss is recognised for the amount by which the asset’s carrying value exceeds its recoverable amount. Impairment losses are recognised in the income statement.
www.debenhams.com 99
Financial Statem
ents
Financial Statements
2 ACCOUNTING POLICIES CONTINUED a) Cash flow hedges
b) Derivatives that do not qualify for hedge accounting
Share capital
New standards and interpretations
Notes to the financial statements For the financial year ended 2 September 2017 continued
100 Debenhams plc Annual Report & Accounts 2017
The effective portion of the changes in fair value of derivatives that are designated and qualify as cash flow hedges is recognised in equity. The gain or loss relating to the ineffective portion is recognised immediately in the relevant line of the income statement which will be affected by the underlying hedged item. Forward foreign currency contracts designated as cash flow hedges are de-designated and subsequently classified as “held for trading” when the underlying forecast transaction is recognised in the financial statements.
Amounts accumulated in equity are reclassified and adjusted against the initial measurement of the underlying hedged item when the underlying hedged item is recognised on the balance sheet or in the income statement.
When a hedged instrument expires, is sold, terminated or when a hedge no longer meets the criteria for hedge accounting, hedge accounting is discontinued. Any cumulative gain or loss existing in equity at that time is held in equity until the forecast transaction occurs. When a forecast transaction is no longer expected to occur, the cumulative gain or loss that was reported in equity is immediately reclassified to the relevant line of the income statement which would have been affected by the forecast transaction.
Certain derivatives do not qualify for hedge accounting. Changes in fair value of any derivative instruments that do not qualify for hedge accounting are recognised immediately in the income statement within cost of sales or finance costs.
Ordinary shares are classified as equity.
Incremental costs directly attributable to the issue of new shares in equity are shown as a deduction, net of tax, from the proceeds.
Where the Company purchases its own ordinary shares, the consideration paid, including any directly attributable incremental costs (net of income taxes), is deducted from equity attributable to the Company’s equity holders until the shares are cancelled or reissued. Where such ordinary shares are subsequently reissued, any consideration received, net of any directly attributable incremental transaction costs together with the related income tax effects, is included in equity attributable to the Company’s equity holders.
The following standards and amendments apply for the first time in the current financial year and do not have a material impact on the consolidated financial information of the Group:
Amendment to IAS 7 “Cash flow statements” disclosure initiative
Amendment to IAS 12 “Income taxes” on recognition of deferred tax assets for unrealised losses
IFRS 16 “Leases” was issued on 13 January 2016 and is effective for periods beginning on or after 1 January 2019. The standard is yet to be endorsed by the EU. IFRS 16 requires lessees to recognise a lease liability reflecting future lease payments and a right-of-use asset for lease contracts, subject to limited exceptions for short-term leases and leases of low value assets.
The Group has invested in a new property management system to prepare for the adoption of the new standard. The Group is currently assessing the impact of IFRS 16 on its existing lease portfolio of approximately 250 property leases and other contracts. Work performed to date includes consideration of the transition approach and collection of relevant data from different areas of the business. In order to quantify the impact of IFRS 16, judgements are required which include, amongst others, the lease term, including consideration of extension options and the discount rate.
IFRS 16 is expected to have a material impact on the balance sheet as both assets and liabilities will increase and is also expected to have a material impact on key components within the income statement because operating lease rental charges will be replaced by depreciation and finance costs. IFRS 16 will not have any impact on the underlying commercial performance of the Group nor the cash flow generated in the year.
It is not possible to provide an accurate assessment of the effect of this standard until a detailed review has been completed on an individual lease basis. The Group's undiscounted operating lease commitments at 2 September 2017 under the current leasing standard, is disclosed in note 30.
Other standards and interpretations in issue, but not yet effective, which are not expected to have a material effect on the Group’s net assets or results are:
Annual improvements to IFRS: 2014 – 2016 Cycle IFRS 9 “Financial instruments” and amendments to IFRS 9
“Financial instruments” on general hedge accounting IFRS 15 “Revenue from contracts with customers” and
amendments to IFRS 15 “Revenue from contracts with customers” clarifications
Amendment to IFRS 2 “Share-based payment” on clarifying share-based payment transactions
Amendment to IAS 40 “Investment property” transfers of investment property
IFRIC 22 “Foreign currency transactions and advance consideration”
IFRIC 23 “Uncertainty over income tax”
Debenhams plc Annual Report & Accounts 2017100
3 SEGMENTAL REPORTING
www.debenhams.com 101
IFRS 8 “Operating segments” requires disclosure of the operating segments which are reported to the Chief Operating Decision Maker (“CODM”). The CODM has been identified as the Executive Committee, which includes the executive directors and other key management. It is the Executive Committee that has responsibility for planning and controlling the activities of the Group.
The Group’s reportable segments have been identified as UK and International representing the geographical areas in which the Group operates. The UK segment consists of the UK store and online retail business. The International segment
consists of subsidiaries in the Republic of Ireland and Denmark, together with international franchise and online operations. Transactions between segments have been eliminated from the information presented below.
The segments are reported to the CODM to operating profit level, using the same accounting policies as applied to the Group accounts. Current assets, current liabilities and non-current liabilities are not reported to or reviewed by the CODM on the basis of operating segment as these are reviewed on a Group-wide basis and therefore these amounts are not presented below.
UK £m
International £m
Total £m
Financial year ended 2 September 2017 Gross transaction value 2,350.0 604.1 2,954.1 Concessions, consignments and staff discounts (457.1) (162.0) (619.1)
External revenue 1,892.9 442.1 2,335.0
74.0 33.5 107.5 Exceptional items (34.3) (1.9) (36.2)
Operating profit after exceptional items 39.7 31.6 71.3
Other segment items Depreciation (note 15) 81.0 8.5 89.5 Amortisation (note 14) 19.0 1.0 20.0 Impairment of property, plant and equipment (note 15) 7.2 – 7.2 Loss on disposal and write off of property, plant and equipment (note 15) 1.2 – 1.2 Loss on disposal and write off of intangible assets (note 14) 4.6 – 4.6
Financial year ended 3 September 2016 Gross transaction value 2,386.2 552.3 2,938.5 Concessions, consignments and staff discounts (454.3) (142.5) (596.8)
External revenue 1,931.9 409.8 2,341.7
Operating profit before exceptional items 98.0 33.0 131.0 Exceptional items (5.4) (7.0) (12.4)
Operating profit after exceptional items 92.6 26.0 118.6
Other segment items Depreciation (note 15) 82.3 7.1 89.4 Amortisation (note 14) 18.2 1.0 19.2 Impairment of intangible assets (note 14) – 2.2 2.2
Operating profit before exceptional items
2 ACCOUNTING POLICIES CONTINUED a) Cash flow hedges
b) Derivatives that do not qualify for hedge accounting
Share capital
New standards and interpretations
Notes to the financial statements For the financial year ended 2 September 2017 continued
100 Debenhams plc Annual Report & Accounts 2017
The effective portion of the changes in fair value of derivatives that are designated and qualify as cash flow hedges is recognised in equity. The gain or loss relating to the ineffective portion is recognised immediately in the relevant line of the income statement which will be affected by the underlying hedged item. Forward foreign currency contracts designated as cash flow hedges are de-designated and subsequently classified as “held for trading” when the underlying forecast transaction is recognised in the financial statements.
Amounts accumulated in equity are reclassified and adjusted against the initial measurement of the underlying hedged item when the underlying hedged item is recognised on the balance sheet or in the income statement.
When a hedged instrument expires, is sold, terminated or when a hedge no longer meets the criteria for hedge accounting, hedge accounting is discontinued. Any cumulative gain or loss existing in equity at that time is held in equity until the forecast transaction occurs. When a forecast transaction is no longer expected to occur, the cumulative gain or loss that was reported in equity is immediately reclassified to the relevant line of the income statement which would have been affected by the forecast transaction.
Certain derivatives do not qualify for hedge accounting. Changes in fair value of any derivative instruments that do not qualify for hedge accounting are recognised immediately in the income statement within cost of sales or finance costs.
Ordinary shares are classified as equity.
Incremental costs directly attributable to the issue of new shares in equity are shown as a deduction, net of tax, from the proceeds.
Where the Company purchases its own ordinary shares, the consideration paid, including any directly attributable incremental costs (net of income taxes), is deducted from equity attributable to the Company’s equity holders until the shares are cancelled or reissued. Where such ordinary shares are subsequently reissued, any consideration received, net of any directly attributable incremental transaction costs together with the related income tax effects, is included in equity attributable to the Company’s equity holders.
The following standards and amendments apply for the first time in the current financial year and do not have a material impact on the consolidated financial information of the Group:
Amendment to IAS 7 “Cash flow statements” disclosure initiative
Amendment to IAS 12 “Income taxes” on recognition of deferred tax assets for unrealised losses
IFRS 16 “Leases” was issued on 13 January 2016 and is effective for periods beginning on or after 1 January 2019. The standard is yet to be endorsed by the EU. IFRS 16 requires lessees to recognise a lease liability reflecting future lease payments and a right-of-use asset for lease contracts, subject to limited exceptions for short-term leases and leases of low value assets.
The Group has invested in a new property management system to prepare for the adoption of the new standard. The Group is currently assessing the impact of IFRS 16 on its existing lease portfolio of approximately 250 property leases and other contracts. Work performed to date includes consideration of the transition approach and collection of relevant data from different areas of the business. In order to quantify the impact of IFRS 16, judgements are required which include, amongst others, the lease term, including consideration of extension options and the discount rate.
IFRS 16 is expected to have a material impact on the balance sheet as both assets and liabilities will increase and is also expected to have a material impact on key components within the income statement because operating lease rental charges will be replaced by depreciation and finance costs. IFRS 16 will not have any impact on the underlying commercial performance of the Group nor the cash flow generated in the year.
It is not possible to provide an accurate assessment of the effect of this standard until a detailed review has been completed on an individual lease basis. The Group's undiscounted operating lease commitments at 2 September 2017 under the current leasing standard, is disclosed in note 30.
Other standards and interpretations in issue, but not yet effective, which are not expected to have a material effect on the Group’s net assets or results are:
Annual improvements to IFRS: 2014 – 2016 Cycle IFRS 9 “Financial instruments” and amendments to IFRS 9
“Financial instruments” on general hedge accounting IFRS 15 “Revenue from contracts with customers” and
amendments to IFRS 15 “Revenue from contracts with customers” clarifications
Amendment to IFRS 2 “Share-based payment” on clarifying share-based payment transactions
Amendment to IAS 40 “Investment property” transfers of investment property
IFRIC 22 “Foreign currency transactions and advance consideration”
IFRIC 23 “Uncertainty over income tax”
www.debenhams.com 101
Financial Statem
ents
Financial Statements
3 SEGMENTAL REPORTING CONTINUED Segmental analysis of results
4 GROSS TRANSACTION VALUE
Notes to the financial statements For the financial year ended 2 September 2017 continued
102 Debenhams plc Annual Report & Accounts 2017
Total segmental operating profit may be reconciled to total profit before taxation as follows:
2 September 2017
£m
3 September 2016
£m
Total operating profit 71.3 118.6 Finance income 0.1 1.4 Finance costs (12.4) (14.2)
Total profit before taxation 59.0 105.8
Revenues analysed by country, based on the customers’ location, are set out below:
2 September 2017
£m
3 September 2016
£m
United Kingdom 1,892.9 1,931.9 Denmark 205.6 185.1 Republic of Ireland 147.5 136.3 Rest of the world 89.0 88.4
Total external revenue 2,335.0 2,341.7
Non-current assets, which comprise intangible assets and property and plant and equipment analysed by country, are set out below:
2 September 2017
£m
3 September 2016
£m
United Kingdom 1,585.9 1,582.1 Denmark 36.0 28.4 Republic of Ireland 24.0 21.5 Rest of the world 0.9 0.3 Total non-current assets 1,646.8 1,632.3
Additions to intangible assets and property, plant and equipment analysed by operating segment are set out below:
UK £m
International £m
Total £m
Financial year ended 2 September 2017 116.1 15.6 131.7 Financial year ended 3 September 2016 120.3 9.4 129.7
Revenue from concession and consignment sales is required to be shown on a net basis, being the commission received rather than the gross value achieved on the sale. Management believes that gross transaction value (“GTV”), which presents revenue on a gross basis before adjusting for concessions, consignments and staff discounts, represents a good guide to the overall activity of the Group.
2 September 2017
£m
3 September 2016
£m
Gross transaction value 2,954.1 2,938.5
A reconciliation of GTV to external revenue is included in note 3.
Debenhams plc Annual Report & Accounts 2017102
5 CRITICAL ACCOUNTING ESTIMATES AND JUDGEMENTS
Sources of estimation uncertainty Estimated impairment of goodwill and store assets
Estimated useful life of property, plant and equipment and intangible assets
Inventories
Retirement benefits
Property provisions
Judgements made in applying accounting policies Exceptional items
www.debenhams.com 103
The preparation of the consolidated Group financial statements requires the Group to make estimates and assumptions that affect the application of policies and reported amounts. Estimates and judgements are continually evaluated and are based on historical experience and other factors, including expectations of future events that are believed to be reasonable under the circumstances. Actual results may differ from these estimates. The significant judgements applied in the preparation of the consolidated financial statements, along with estimates and assumptions that have a significant risk of causing a material adjustment to the carrying amounts of assets and liabilities within the next financial year, are discussed below.
The Group tests whether goodwill and store assets have suffered any impairment in accordance with the accounting policies stated in note 2. The recoverable amount of cash-generating units is determined based on a value-in-use calculation. The method requires an estimate of future cash flows and the selection of a suitable discount rate in order to calculate the net present value of the cash flows. Actual outcomes could vary; see notes 14 and 15 for further details.
At the date of capitalising property, plant and equipment and intangible assets, the Group estimates the useful life of the asset based on management’s judgement and experience. Due to the significance of capital investment to the Group, variances between actual and estimated useful economic lives could impact results both positively and negatively.
Inventories are stated at the lower of cost and net realisable value primarily using the retail method and represent goods for resale. The retail method is an industry specific accounting method used to derive a weighted average product cost. Product cost and retail values are aggregated at a departmental level to determine an average margin per department. These margins are then applied to the retail value of inventory to derive the cost of inventory. This method intrinsically takes into account any stock loss or markdown to goods sold below cost. Concession inventories are not included within inventory held by the Group.
The Group’s defined benefit schemes’ pension surplus/obligation, which is assessed each period by actuaries, is based on key assumptions including discount rates, mortality rates, inflation, future salary costs and pension costs. These assumptions, individually or collectively, may be different to actual outcomes; refer to note 24 for further details.
A retirement benefit surplus is only recognised to the extent that it is expected to be recoverable in the future.
Property provisions comprise onerous lease provisions, relating to leases on properties which the Group plans to exit and dilapidations provisions. Onerous lease provisions are based on the lower of the net cost of fulfilling or exiting the contract. The ultimate costs and timing of cash flows are dependent on exiting the property lease contracts and sub-letting surplus space. Significant assumptions are used in making these calculations, in particular the nature, timing and value of mitigating lease costs including the level of sub-lease income, and changes in these assumptions and future events could cause the value of these provisions to change. Refer to note 27 for further details.
The Group separately reports exceptional items within their relevant income statement line as it believes this helps provide a better indication of the underlying performance of the Group.
Judgement is required in determining whether an item should be classified as an exceptional item or included within underlying results. This assessment covers the nature of the item, cause of occurrence and the scale of the impact of that item on reported performance. Reversals of previous exceptional items are assessed based on the same criteria. A breakdown of the exceptional items included in the income statement is disclosed in note 7.
3 SEGMENTAL REPORTING CONTINUED Segmental analysis of results
4 GROSS TRANSACTION VALUE
Notes to the financial statements For the financial year ended 2 September 2017 continued
102 Debenhams plc Annual Report & Accounts 2017
Total segmental operating profit may be reconciled to total profit before taxation as follows:
2 September 2017
£m
3 September 2016
£m
Total operating profit 71.3 118.6 Finance income 0.1 1.4 Finance costs (12.4) (14.2)
Total profit before taxation 59.0 105.8
Revenues analysed by country, based on the customers’ location, are set out below:
2 September 2017
£m
3 September 2016
£m
United Kingdom 1,892.9 1,931.9 Denmark 205.6 185.1 Republic of Ireland 147.5 136.3 Rest of the world 89.0 88.4
Total external revenue 2,335.0 2,341.7
Non-current assets, which comprise intangible assets and property and plant and equipment analysed by country, are set out below:
2 September 2017
£m
3 September 2016
£m
United Kingdom 1,585.9 1,582.1 Denmark 36.0 28.4 Republic of Ireland 24.0 21.5 Rest of the world 0.9 0.3 Total non-current assets 1,646.8 1,632.3
Additions to intangible assets and property, plant and equipment analysed by operating segment are set out below:
UK £m
International £m
Total £m
Financial year ended 2 September 2017 116.1 15.6 131.7 Financial year ended 3 September 2016 120.3 9.4 129.7
Revenue from concession and consignment sales is required to be shown on a net basis, being the commission received rather than the gross value achieved on the sale. Management believes that gross transaction value (“GTV”), which presents revenue on a gross basis before adjusting for concessions, consignments and staff discounts, represents a good guide to the overall activity of the Group.
2 September 2017
£m
3 September 2016
£m
Gross transaction value 2,954.1 2,938.5
A reconciliation of GTV to external revenue is included in note 3.
www.debenhams.com 103
Financial Statem
ents
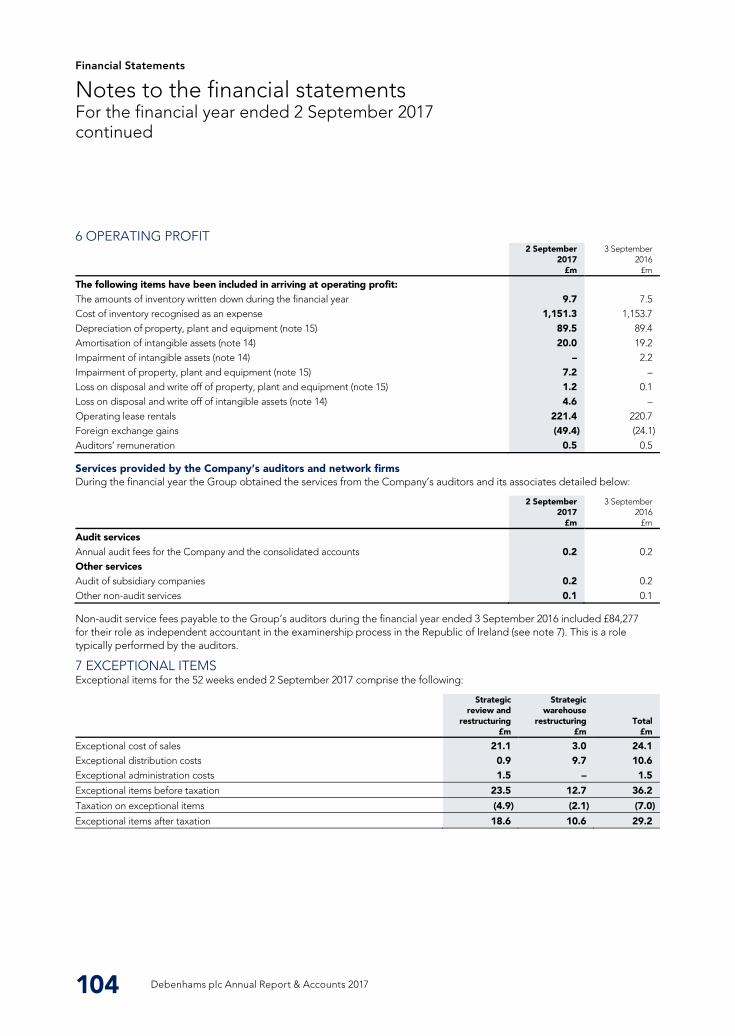
Financial Statements
6 OPERATING PROFIT
Services provided by the Company’s auditors and network firms
7 EXCEPTIONAL ITEMS
Notes to the financial statements For the financial year ended 2 September 2017 continued
104 Debenhams plc Annual Report & Accounts 2017
2 September 2017
£m
3 September 2016
£m
The following items have been included in arriving at operating profit: The amounts of inventory written down during the financial year 9.7 7.5 Cost of inventory recognised as an expense 1,151.3 1,153.7 Depreciation of property, plant and equipment (note 15) 89.5 89.4 Amortisation of intangible assets (note 14) 20.0 19.2 Impairment of intangible assets (note 14) – 2.2 Impairment of property, plant and equipment (note 15) 7.2 – Loss on disposal and write off of property, plant and equipment (note 15) 1.2 0.1 Loss on disposal and write off of intangible assets (note 14) 4.6 – Operating lease rentals 221.4 220.7 Foreign exchange gains (49.4) (24.1) Auditors’ remuneration 0.5 0.5
During the financial year the Group obtained the services from the Company’s auditors and its associates detailed below:
2 September 2017
£m
3 September 2016
£m
Audit services Annual audit fees for the Company and the consolidated accounts 0.2 0.2 Other services Audit of subsidiary companies 0.2 0.2 Other non-audit services 0.1 0.1
Non-audit service fees payable to the Group’s auditors during the financial year ended 3 September 2016 included £84,277 for their role as independent accountant in the examinership process in the Republic of Ireland (see note 7). This is a role typically performed by the auditors.
Exceptional items for the 52 weeks ended 2 September 2017 comprise the following:
Strategic review and
restructuring £m
Strategic warehouse
restructuring £m
Total £m
Exceptional cost of sales 21.1 3.0 24.1 Exceptional distribution costs 0.9 9.7 10.6 Exceptional administration costs 1.5 – 1.5
Exceptional items before taxation 23.5 12.7 36.2
Taxation on exceptional items (4.9) (2.1) (7.0)
Exceptional items after taxation 18.6 10.6 29.2
Debenhams plc Annual Report & Accounts 2017104
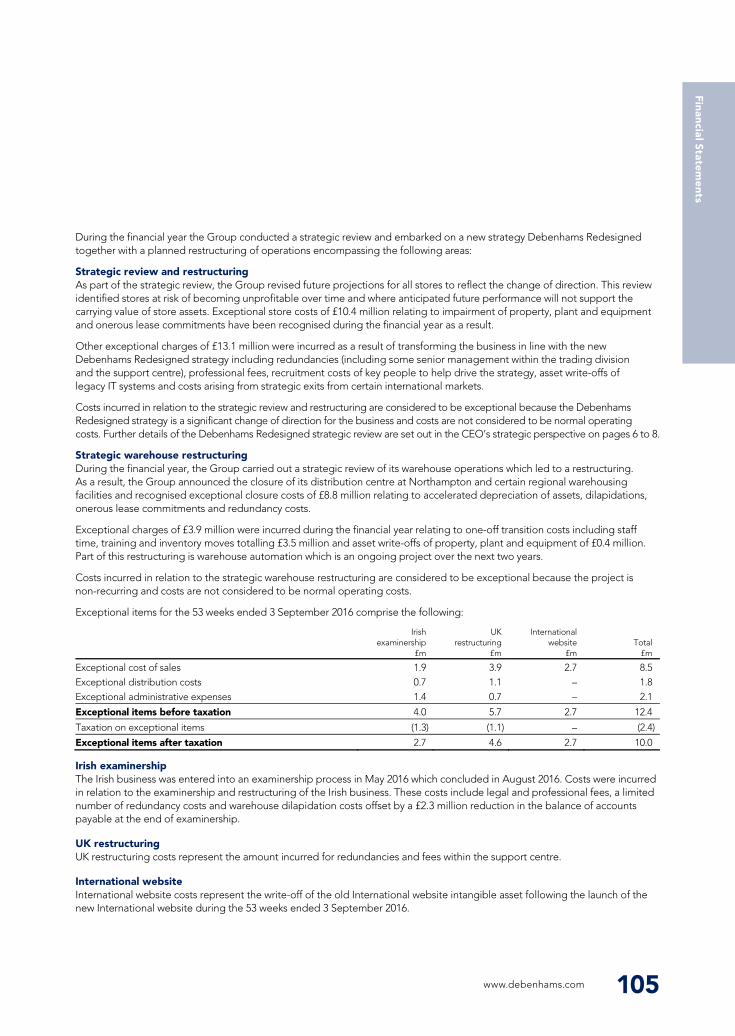
Strategic review and restructuring
Strategic warehouse restructuring
Irish examinership
UK restructuring
International website
www.debenhams.com 105
During the financial year the Group conducted a strategic review and embarked on a new strategy Debenhams Redesigned together with a planned restructuring of operations encompassing the following areas:
As part of the strategic review, the Group revised future projections for all stores to reflect the change of direction. This review identified stores at risk of becoming unprofitable over time and where anticipated future performance will not support the carrying value of store assets. Exceptional store costs of £10.4 million relating to impairment of property, plant and equipment and onerous lease commitments have been recognised during the financial year as a result.
Other exceptional charges of £13.1 million were incurred as a result of transforming the business in line with the new Debenhams Redesigned strategy including redundancies (including some senior management within the trading division and the support centre), professional fees, recruitment costs of key people to help drive the strategy, asset write-offs of legacy IT systems and costs arising from strategic exits from certain international markets.
Costs incurred in relation to the strategic review and restructuring are considered to be exceptional because the Debenhams Redesigned strategy is a significant change of direction for the business and costs are not considered to be normal operating costs. Further details of the Debenhams Redesigned strategic review are set out in the CEO’s strategic perspective on pages 6 to 8.
During the financial year, the Group carried out a strategic review of its warehouse operations which led to a restructuring. As a result, the Group announced the closure of its distribution centre at Northampton and certain regional warehousing facilities and recognised exceptional closure costs of £8.8 million relating to accelerated depreciation of assets, dilapidations, onerous lease commitments and redundancy costs.
Exceptional charges of £3.9 million were incurred during the financial year relating to one-off transition costs including staff time, training and inventory moves totalling £3.5 million and asset write-offs of property, plant and equipment of £0.4 million. Part of this restructuring is warehouse automation which is an ongoing project over the next two years.
Costs incurred in relation to the strategic warehouse restructuring are considered to be exceptional because the project is non-recurring and costs are not considered to be normal operating costs.
Exceptional items for the 53 weeks ended 3 September 2016 comprise the following:
Irish examinership
£m
UKrestructuring
£m
International website
£mTotal
£m
Exceptional cost of sales 1.9 3.9 2.7 8.5Exceptional distribution costs 0.7 1.1 – 1.8Exceptional administrative expenses 1.4 0.7 – 2.1
Exceptional items before taxation 4.0 5.7 2.7 12.4
Taxation on exceptional items (1.3) (1.1) – (2.4)
Exceptional items after taxation 2.7 4.6 2.7 10.0
The Irish business was entered into an examinership process in May 2016 which concluded in August 2016. Costs were incurred in relation to the examinership and restructuring of the Irish business. These costs include legal and professional fees, a limited number of redundancy costs and warehouse dilapidation costs offset by a £2.3 million reduction in the balance of accounts payable at the end of examinership.
UK restructuring costs represent the amount incurred for redundancies and fees within the support centre.
International website costs represent the write-off of the old International website intangible asset following the launch of the new International website during the 53 weeks ended 3 September 2016.
6 OPERATING PROFIT
Services provided by the Company’s auditors and network firms
7 EXCEPTIONAL ITEMS
Notes to the financial statements For the financial year ended 2 September 2017 continued
104 Debenhams plc Annual Report & Accounts 2017
2 September 2017
£m
3 September 2016
£m
The following items have been included in arriving at operating profit: The amounts of inventory written down during the financial year 9.7 7.5 Cost of inventory recognised as an expense 1,151.3 1,153.7 Depreciation of property, plant and equipment (note 15) 89.5 89.4 Amortisation of intangible assets (note 14) 20.0 19.2 Impairment of intangible assets (note 14) – 2.2 Impairment of property, plant and equipment (note 15) 7.2 – Loss on disposal and write off of property, plant and equipment (note 15) 1.2 0.1 Loss on disposal and write off of intangible assets (note 14) 4.6 – Operating lease rentals 221.4 220.7 Foreign exchange gains (49.4) (24.1) Auditors’ remuneration 0.5 0.5
During the financial year the Group obtained the services from the Company’s auditors and its associates detailed below:
2 September 2017
£m
3 September 2016
£m
Audit services Annual audit fees for the Company and the consolidated accounts 0.2 0.2 Other services Audit of subsidiary companies 0.2 0.2 Other non-audit services 0.1 0.1
Non-audit service fees payable to the Group’s auditors during the financial year ended 3 September 2016 included £84,277 for their role as independent accountant in the examinership process in the Republic of Ireland (see note 7). This is a role typically performed by the auditors.
Exceptional items for the 52 weeks ended 2 September 2017 comprise the following:
Strategic review and
restructuring £m
Strategic warehouse
restructuring £m
Total £m
Exceptional cost of sales 21.1 3.0 24.1 Exceptional distribution costs 0.9 9.7 10.6 Exceptional administration costs 1.5 – 1.5
Exceptional items before taxation 23.5 12.7 36.2
Taxation on exceptional items (4.9) (2.1) (7.0)
Exceptional items after taxation 18.6 10.6 29.2
www.debenhams.com 105
Financial Statem
ents
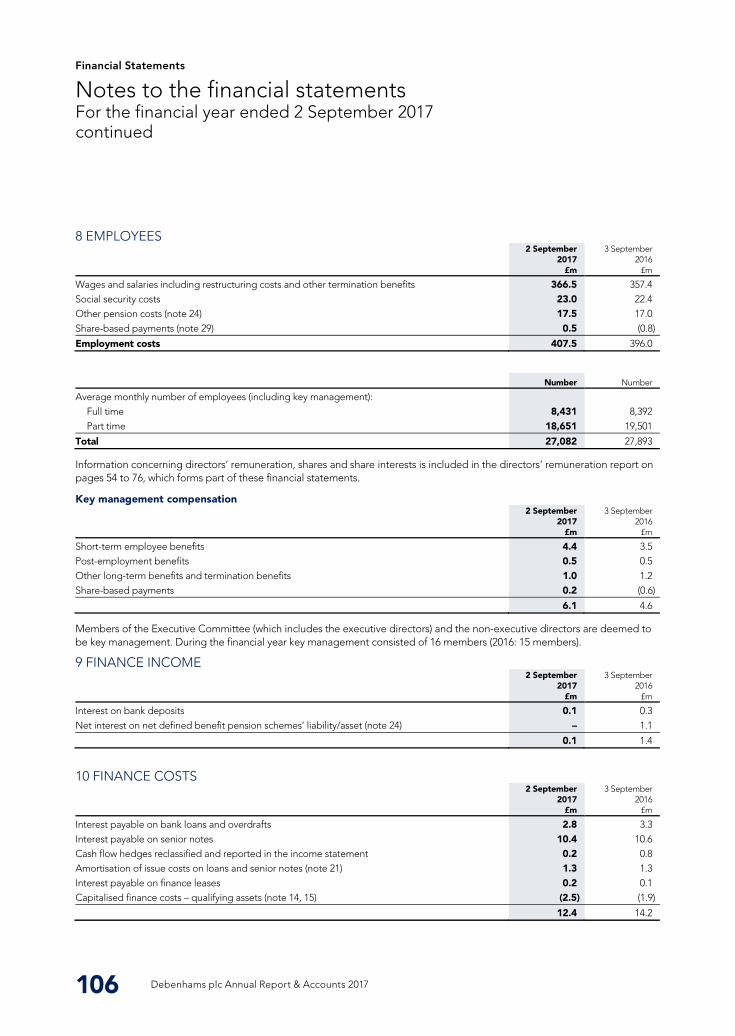
Financial Statements
8 EMPLOYEES
Key management compensation
9 FINANCE INCOME
10 FINANCE COSTS
Notes to the financial statements For the financial year ended 2 September 2017 continued
106 Debenhams plc Annual Report & Accounts 2017
2 September 2017
£m
3 September 2016
£m
Wages and salaries including restructuring costs and other termination benefits 366.5 357.4 Social security costs 23.0 22.4 Other pension costs (note 24) 17.5 17.0 Share-based payments (note 29) 0.5 (0.8)
Employment costs 407.5 396.0
Number Number
Average monthly number of employees (including key management): Full time 8,431 8,392 Part time 18,651 19,501
Total 27,082 27,893
Information concerning directors’ remuneration, shares and share interests is included in the directors’ remuneration report on pages 54 to 76, which forms part of these financial statements.
2 September 2017
£m
3 September 2016
£m
Short-term employee benefits 4.4 3.5 Post-employment benefits 0.5 0.5 Other long-term benefits and termination benefits 1.0 1.2 Share-based payments 0.2 (0.6)
6.1 4.6
Members of the Executive Committee (which includes the executive directors) and the non-executive directors are deemed to be key management. During the financial year key management consisted of 16 members (2016: 15 members).
2 September 2017
£m
3 September 2016
£m
Interest on bank deposits 0.1 0.3 Net interest on net defined benefit pension schemes’ liability/asset (note 24) – 1.1
0.1 1.4
2 September 2017
£m
3 September 2016
£m
Interest payable on bank loans and overdrafts 2.8 3.3 Interest payable on senior notes 10.4 10.6 Cash flow hedges reclassified and reported in the income statement 0.2 0.8 Amortisation of issue costs on loans and senior notes (note 21) 1.3 1.3 Interest payable on finance leases 0.2 0.1 Capitalised finance costs – qualifying assets (note 14, 15) (2.5) (1.9)
12.4 14.2
Debenhams plc Annual Report & Accounts 2017106
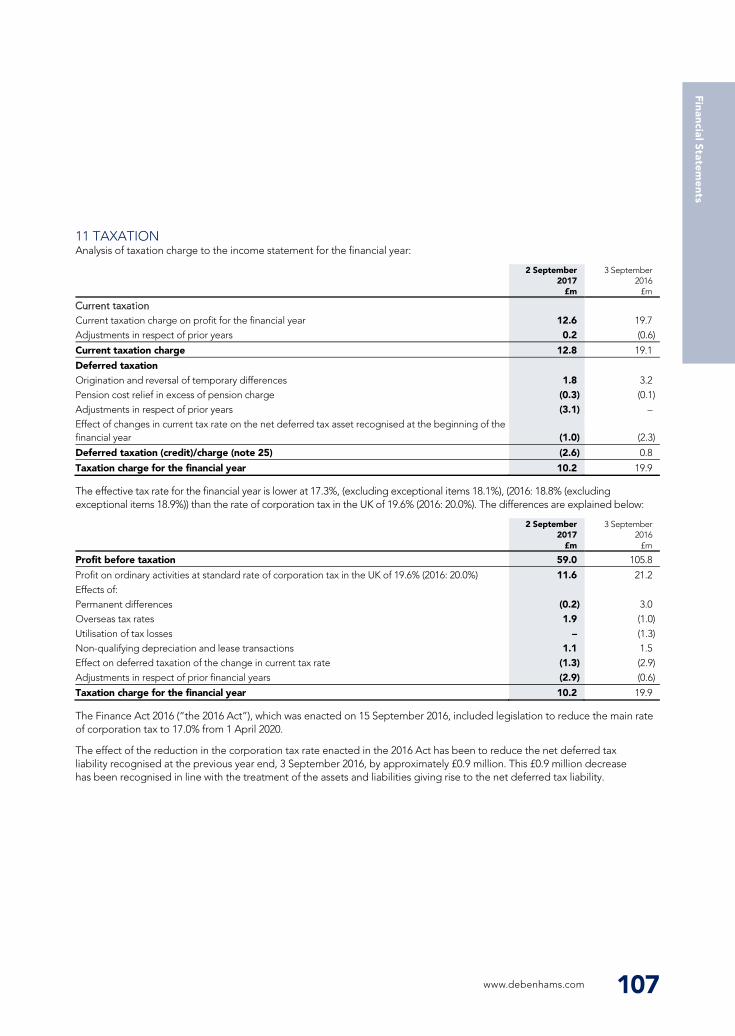
11 TAXATION
www.debenhams.com 107
Analysis of taxation charge to the income statement for the financial year:
2 September 2017
£m
3 September 2016
£m
Current taxation charge on profit for the financial year 12.6 19.7 Adjustments in respect of prior years 0.2 (0.6)
Current taxation charge 12.8 19.1
Deferred taxation Origination and reversal of temporary differences 1.8 3.2 Pension cost relief in excess of pension charge (0.3) (0.1) Adjustments in respect of prior years (3.1) – Effect of changes in current tax rate on the net deferred tax asset recognised at the beginning of the financial year (1.0) (2.3)
Deferred taxation (credit)/charge (note 25) (2.6) 0.8
Taxation charge for the financial year 10.2 19.9
The effective tax rate for the financial year is lower at 17.3%, (excluding exceptional items 18.1%), (2016: 18.8% (excluding exceptional items 18.9%)) than the rate of corporation tax in the UK of 19.6% (2016: 20.0%). The differences are explained below:
2 September 2017
£m
3 September 2016
£m
Profit before taxation 59.0 105.8
Profit on ordinary activities at standard rate of corporation tax in the UK of 19.6% (2016: 20.0%) 11.6 21.2 Effects of: Permanent differences (0.2) 3.0 Overseas tax rates 1.9 (1.0) Utilisation of tax losses – (1.3) Non-qualifying depreciation and lease transactions 1.1 1.5 Effect on deferred taxation of the change in current tax rate (1.3) (2.9) Adjustments in respect of prior financial years (2.9) (0.6)
Taxation charge for the financial year 10.2 19.9
The Finance Act 2016 (“the 2016 Act”), which was enacted on 15 September 2016, included legislation to reduce the main rate of corporation tax to 17.0% from 1 April 2020.
The effect of the reduction in the corporation tax rate enacted in the 2016 Act has been to reduce the net deferred tax liability recognised at the previous year end, 3 September 2016, by approximately £0.9 million. This £0.9 million decrease has been recognised in line with the treatment of the assets and liabilities giving rise to the net deferred tax liability.
Current taxation
8 EMPLOYEES
Key management compensation
9 FINANCE INCOME
10 FINANCE COSTS
Notes to the financial statements For the financial year ended 2 September 2017 continued
106 Debenhams plc Annual Report & Accounts 2017
2 September 2017
£m
3 September 2016
£m
Wages and salaries including restructuring costs and other termination benefits 366.5 357.4 Social security costs 23.0 22.4 Other pension costs (note 24) 17.5 17.0 Share-based payments (note 29) 0.5 (0.8)
Employment costs 407.5 396.0
Number Number
Average monthly number of employees (including key management): Full time 8,431 8,392 Part time 18,651 19,501
Total 27,082 27,893
Information concerning directors’ remuneration, shares and share interests is included in the directors’ remuneration report on pages 54 to 76, which forms part of these financial statements.
2 September 2017
£m
3 September 2016
£m
Short-term employee benefits 4.4 3.5 Post-employment benefits 0.5 0.5 Other long-term benefits and termination benefits 1.0 1.2 Share-based payments 0.2 (0.6)
6.1 4.6
Members of the Executive Committee (which includes the executive directors) and the non-executive directors are deemed to be key management. During the financial year key management consisted of 16 members (2016: 15 members).
2 September 2017
£m
3 September 2016
£m
Interest on bank deposits 0.1 0.3 Net interest on net defined benefit pension schemes’ liability/asset (note 24) – 1.1
0.1 1.4
2 September 2017
£m
3 September 2016
£m
Interest payable on bank loans and overdrafts 2.8 3.3 Interest payable on senior notes 10.4 10.6 Cash flow hedges reclassified and reported in the income statement 0.2 0.8 Amortisation of issue costs on loans and senior notes (note 21) 1.3 1.3 Interest payable on finance leases 0.2 0.1 Capitalised finance costs – qualifying assets (note 14, 15) (2.5) (1.9)
12.4 14.2
www.debenhams.com 107
Financial Statem
ents
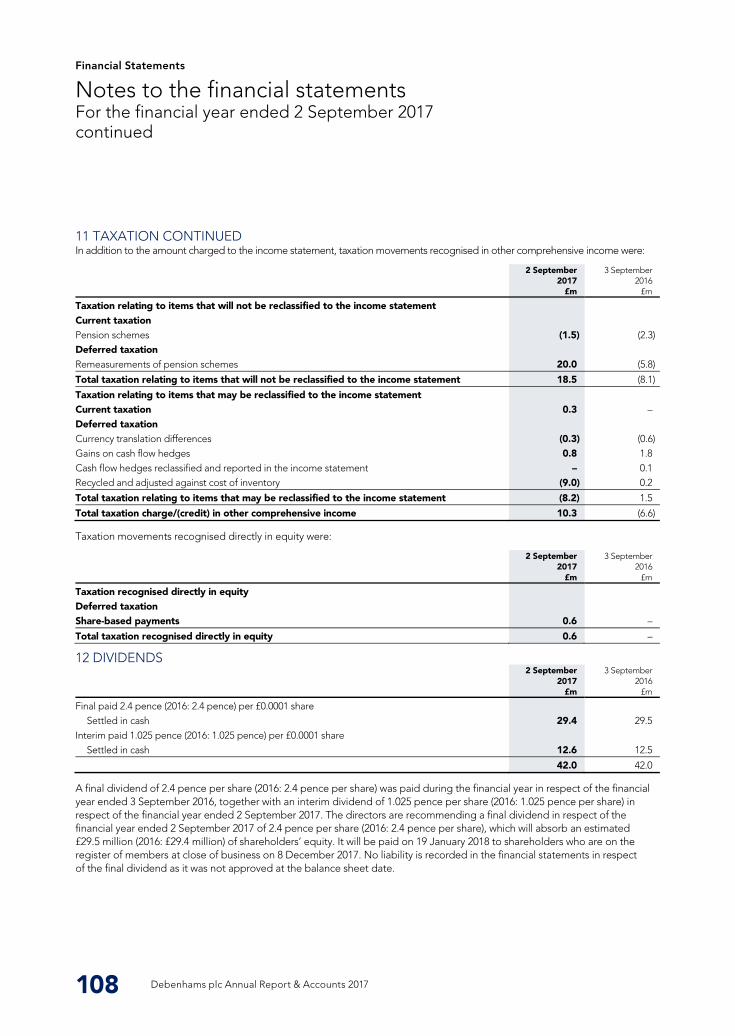
Financial Statements
11 TAXATION CONTINUED
12 DIVIDENDS
Notes to the financial statements For the financial year ended 2 September 2017 continued
108 Debenhams plc Annual Report & Accounts 2017
In addition to the amount charged to the income statement, taxation movements recognised in other comprehensive income were:
2 September 2017
£m
3 September 2016
£m
Taxation relating to items that will not be reclassified to the income statement Current taxation Pension schemes (1.5) (2.3) Deferred taxation Remeasurements of pension schemes 20.0 (5.8)
Total taxation relating to items that will not be reclassified to the income statement 18.5 (8.1)
Taxation relating to items that may be reclassified to the income statement Current taxation 0.3 – Deferred taxation Currency translation differences (0.3) (0.6) Gains on cash flow hedges 0.8 1.8 Cash flow hedges reclassified and reported in the income statement – 0.1 Recycled and adjusted against cost of inventory (9.0) 0.2
Total taxation relating to items that may be reclassified to the income statement (8.2) 1.5
Total taxation charge/(credit) in other comprehensive income 10.3 (6.6)
Taxation movements recognised directly in equity were:
2 September 2017
£m
3 September 2016
£m
Taxation recognised directly in equity Deferred taxation Share-based payments 0.6 –
Total taxation recognised directly in equity 0.6 –
2 September 2017
£m
3 September 2016
£m
Final paid 2.4 pence (2016: 2.4 pence) per £0.0001 share Settled in cash 29.4 29.5
Interim paid 1.025 pence (2016: 1.025 pence) per £0.0001 share Settled in cash 12.6 12.5
42.0 42.0
A final dividend of 2.4 pence per share (2016: 2.4 pence per share) was paid during the financial year in respect of the financial year ended 3 September 2016, together with an interim dividend of 1.025 pence per share (2016: 1.025 pence per share) in respect of the financial year ended 2 September 2017. The directors are recommending a final dividend in respect of the financial year ended 2 September 2017 of 2.4 pence per share (2016: 2.4 pence per share), which will absorb an estimated £29.5 million (2016: £29.4 million) of shareholders’ equity. It will be paid on 19 January 2018 to shareholders who are on the register of members at close of business on 8 December 2017. No liability is recorded in the financial statements in respect of the final dividend as it was not approved at the balance sheet date.
Debenhams plc Annual Report & Accounts 2017108
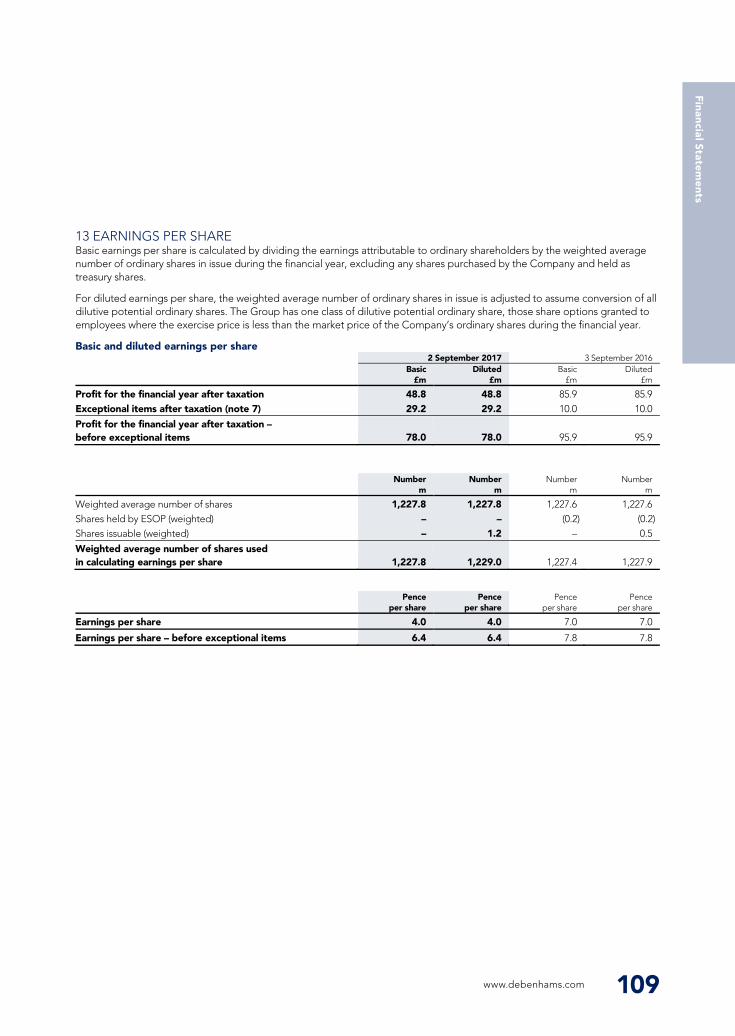
11 TAXATION CONTINUED
12 DIVIDENDS
Notes to the financial statements For the financial year ended 2 September 2017 continued
108 Debenhams plc Annual Report & Accounts 2017
In addition to the amount charged to the income statement, taxation movements recognised in other comprehensive income were:
2 September 2017
£m
3 September 2016
£m
Taxation relating to items that will not be reclassified to the income statement Current taxation Pension schemes (1.5) (2.3) Deferred taxation Remeasurements of pension schemes 20.0 (5.8)
Total taxation relating to items that will not be reclassified to the income statement 18.5 (8.1)
Taxation relating to items that may be reclassified to the income statement Current taxation 0.3 – Deferred taxation Currency translation differences (0.3) (0.6) Gains on cash flow hedges 0.8 1.8 Cash flow hedges reclassified and reported in the income statement – 0.1 Recycled and adjusted against cost of inventory (9.0) 0.2
Total taxation relating to items that may be reclassified to the income statement (8.2) 1.5
Total taxation charge/(credit) in other comprehensive income 10.3 (6.6)
Taxation movements recognised directly in equity were:
2 September 2017
£m
3 September 2016
£m
Taxation recognised directly in equity Deferred taxation Share-based payments 0.6 –
Total taxation recognised directly in equity 0.6 –
2 September 2017
£m
3 September 2016
£m
Final paid 2.4 pence (2016: 2.4 pence) per £0.0001 share Settled in cash 29.4 29.5
Interim paid 1.025 pence (2016: 1.025 pence) per £0.0001 share Settled in cash 12.6 12.5
42.0 42.0
A final dividend of 2.4 pence per share (2016: 2.4 pence per share) was paid during the financial year in respect of the financial year ended 3 September 2016, together with an interim dividend of 1.025 pence per share (2016: 1.025 pence per share) in respect of the financial year ended 2 September 2017. The directors are recommending a final dividend in respect of the financial year ended 2 September 2017 of 2.4 pence per share (2016: 2.4 pence per share), which will absorb an estimated £29.5 million (2016: £29.4 million) of shareholders’ equity. It will be paid on 19 January 2018 to shareholders who are on the register of members at close of business on 8 December 2017. No liability is recorded in the financial statements in respect of the final dividend as it was not approved at the balance sheet date.
13 EARNINGS PER SHARE
Basic and diluted earnings per share
www.debenhams.com 109
Basic earnings per share is calculated by dividing the earnings attributable to ordinary shareholders by the weighted average number of ordinary shares in issue during the financial year, excluding any shares purchased by the Company and held as treasury shares.
For diluted earnings per share, the weighted average number of ordinary shares in issue is adjusted to assume conversion of all dilutive potential ordinary shares. The Group has one class of dilutive potential ordinary share, those share options granted to employees where the exercise price is less than the market price of the Company’s ordinary shares during the financial year.
2 September 2017 3 September 2016
Basic
£m Diluted
£m Basic
£m Diluted
£m
Profit for the financial year after taxation 48.8 48.8 85.9 85.9 Exceptional items after taxation (note 7) 29.2 29.2 10.0 10.0
Profit for the financial year after taxation – before exceptional items 78.0 78.0 95.9 95.9
Number
m Number
m Number
m Number
m
Weighted average number of shares 1,227.8 1,227.8 1,227.6 1,227.6 Shares held by ESOP (weighted) – – (0.2) (0.2) Shares issuable (weighted) – 1.2 – 0.5
Weighted average number of shares used in calculating earnings per share 1,227.8 1,229.0 1,227.4 1,227.9
Pence
per share Pence
per share Pence
per share Pence
per share
Earnings per share 4.0 4.0 7.0 7.0
Earnings per share – before exceptional items 6.4 6.4 7.8 7.8
www.debenhams.com 109
Financial Statem
ents
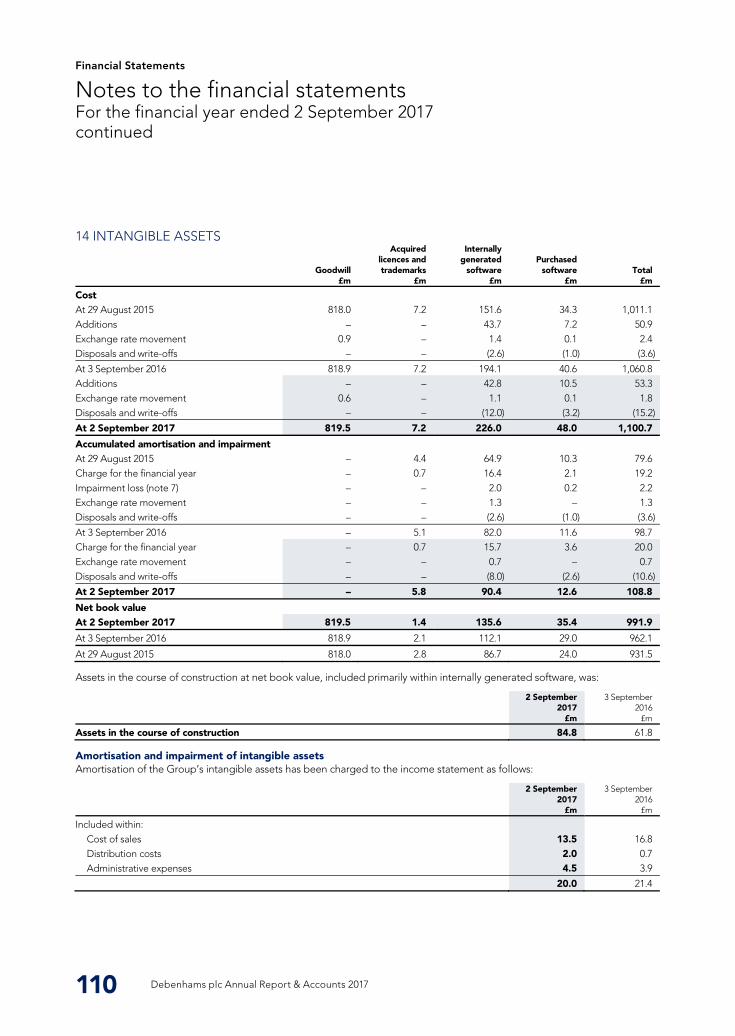
Financial Statements
14 INTANGIBLE ASSETS
Amortisation and impairment of intangible assets
Notes to the financial statements For the financial year ended 2 September 2017 continued
110 Debenhams plc Annual Report & Accounts 2017
Goodwill
£m
Acquired licences and trademarks
£m
Internally generated
software £m
Purchased software
£m Total
£m
Cost At 29 August 2015 818.0 7.2 151.6 34.3 1,011.1 Additions – – 43.7 7.2 50.9 Exchange rate movement 0.9 – 1.4 0.1 2.4 Disposals and write-offs – – (2.6) (1.0) (3.6)
At 3 September 2016 818.9 7.2 194.1 40.6 1,060.8 Additions – – 42.8 10.5 53.3 Exchange rate movement 0.6 – 1.1 0.1 1.8 Disposals and write-offs – – (12.0) (3.2) (15.2)
At 2 September 2017 819.5 7.2 226.0 48.0 1,100.7
Accumulated amortisation and impairment At 29 August 2015 – 4.4 64.9 10.3 79.6 Charge for the financial year – 0.7 16.4 2.1 19.2 Impairment loss (note 7) – – 2.0 0.2 2.2 Exchange rate movement – – 1.3 – 1.3 Disposals and write-offs – – (2.6) (1.0) (3.6)
At 3 September 2016 – 5.1 82.0 11.6 98.7 Charge for the financial year – 0.7 15.7 3.6 20.0 Exchange rate movement – – 0.7 – 0.7 Disposals and write-offs – – (8.0) (2.6) (10.6)
At 2 September 2017 – 5.8 90.4 12.6 108.8
Net book value At 2 September 2017 819.5 1.4 135.6 35.4 991.9
At 3 September 2016 818.9 2.1 112.1 29.0 962.1
At 29 August 2015 818.0 2.8 86.7 24.0 931.5
Assets in the course of construction at net book value, included primarily within internally generated software, was:
2 September 2017
£m
3 September 2016
£m
Assets in the course of construction 84.8 61.8
Amortisation of the Group’s intangible assets has been charged to the income statement as follows:
2 September 2017
£m
3 September 2016
£m
Included within: Cost of sales 13.5 16.8 Distribution costs 2.0 0.7 Administrative expenses 4.5 3.9
20.0 21.4
Debenhams plc Annual Report & Accounts 2017110
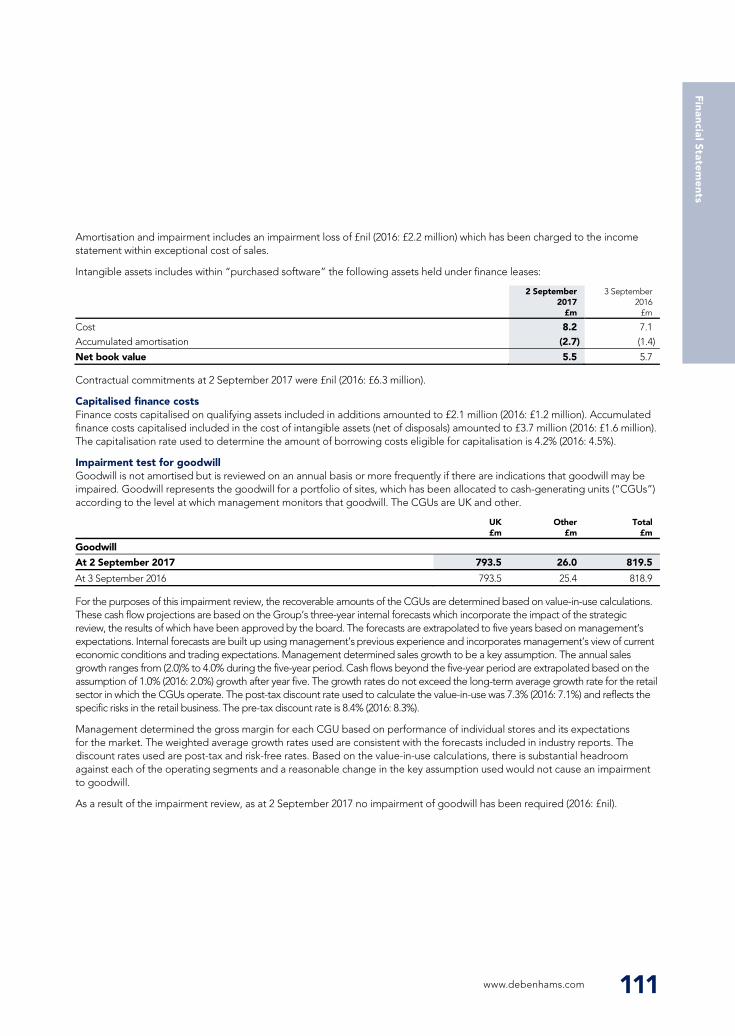
14 INTANGIBLE ASSETS
Amortisation and impairment of intangible assets
Notes to the financial statements For the financial year ended 2 September 2017 continued
110 Debenhams plc Annual Report & Accounts 2017
Goodwill
£m
Acquired licences and trademarks
£m
Internally generated
software £m
Purchased software
£m Total
£m
Cost At 29 August 2015 818.0 7.2 151.6 34.3 1,011.1 Additions – – 43.7 7.2 50.9 Exchange rate movement 0.9 – 1.4 0.1 2.4 Disposals and write-offs – – (2.6) (1.0) (3.6)
At 3 September 2016 818.9 7.2 194.1 40.6 1,060.8 Additions – – 42.8 10.5 53.3 Exchange rate movement 0.6 – 1.1 0.1 1.8 Disposals and write-offs – – (12.0) (3.2) (15.2)
At 2 September 2017 819.5 7.2 226.0 48.0 1,100.7
Accumulated amortisation and impairment At 29 August 2015 – 4.4 64.9 10.3 79.6 Charge for the financial year – 0.7 16.4 2.1 19.2 Impairment loss (note 7) – – 2.0 0.2 2.2 Exchange rate movement – – 1.3 – 1.3 Disposals and write-offs – – (2.6) (1.0) (3.6)
At 3 September 2016 – 5.1 82.0 11.6 98.7 Charge for the financial year – 0.7 15.7 3.6 20.0 Exchange rate movement – – 0.7 – 0.7 Disposals and write-offs – – (8.0) (2.6) (10.6)
At 2 September 2017 – 5.8 90.4 12.6 108.8
Net book value At 2 September 2017 819.5 1.4 135.6 35.4 991.9
At 3 September 2016 818.9 2.1 112.1 29.0 962.1
At 29 August 2015 818.0 2.8 86.7 24.0 931.5
Assets in the course of construction at net book value, included primarily within internally generated software, was:
2 September 2017
£m
3 September 2016
£m
Assets in the course of construction 84.8 61.8
Amortisation of the Group’s intangible assets has been charged to the income statement as follows:
2 September 2017
£m
3 September 2016
£m
Included within: Cost of sales 13.5 16.8 Distribution costs 2.0 0.7 Administrative expenses 4.5 3.9
20.0 21.4
Capitalised finance costs
Impairment test for goodwill
www.debenhams.com 111
Amortisation and impairment includes an impairment loss of £nil (2016: £2.2 million) which has been charged to the income statement within exceptional cost of sales.
Intangible assets includes within “purchased software” the following assets held under finance leases:
2 September 2017
£m
3 September 2016
£m
Cost 8.2 7.1 Accumulated amortisation (2.7) (1.4)
Net book value 5.5 5.7
Contractual commitments at 2 September 2017 were £nil (2016: £6.3 million).
Finance costs capitalised on qualifying assets included in additions amounted to £2.1 million (2016: £1.2 million). Accumulated finance costs capitalised included in the cost of intangible assets (net of disposals) amounted to £3.7 million (2016: £1.6 million). The capitalisation rate used to determine the amount of borrowing costs eligible for capitalisation is 4.2% (2016: 4.5%).
Goodwill is not amortised but is reviewed on an annual basis or more frequently if there are indications that goodwill may be impaired. Goodwill represents the goodwill for a portfolio of sites, which has been allocated to cash-generating units (“CGUs”) according to the level at which management monitors that goodwill. The CGUs are UK and other.
UK £m
Other £m
Total £m
Goodwill
At 2 September 2017 793.5 26.0 819.5
At 3 September 2016 793.5 25.4 818.9
For the purposes of this impairment review, the recoverable amounts of the CGUs are determined based on value-in-use calculations. These cash flow projections are based on the Group’s three-year internal forecasts which incorporate the impact of the strategic review, the results of which have been approved by the board. The forecasts are extrapolated to five years based on management’s expectations. Internal forecasts are built up using management’s previous experience and incorporates management’s view of current economic conditions and trading expectations. Management determined sales growth to be a key assumption. The annual sales growth ranges from (2.0)% to 4.0% during the five-year period. Cash flows beyond the five-year period are extrapolated based on the assumption of 1.0% (2016: 2.0%) growth after year five. The growth rates do not exceed the long-term average growth rate for the retail sector in which the CGUs operate. The post-tax discount rate used to calculate the value-in-use was 7.3% (2016: 7.1%) and reflects the specific risks in the retail business. The pre-tax discount rate is 8.4% (2016: 8.3%).
Management determined the gross margin for each CGU based on performance of individual stores and its expectations for the market. The weighted average growth rates used are consistent with the forecasts included in industry reports. The discount rates used are post-tax and risk-free rates. Based on the value-in-use calculations, there is substantial headroom against each of the operating segments and a reasonable change in the key assumption used would not cause an impairment to goodwill.
As a result of the impairment review, as at 2 September 2017 no impairment of goodwill has been required (2016: £nil).
www.debenhams.com 111
Financial Statem
ents
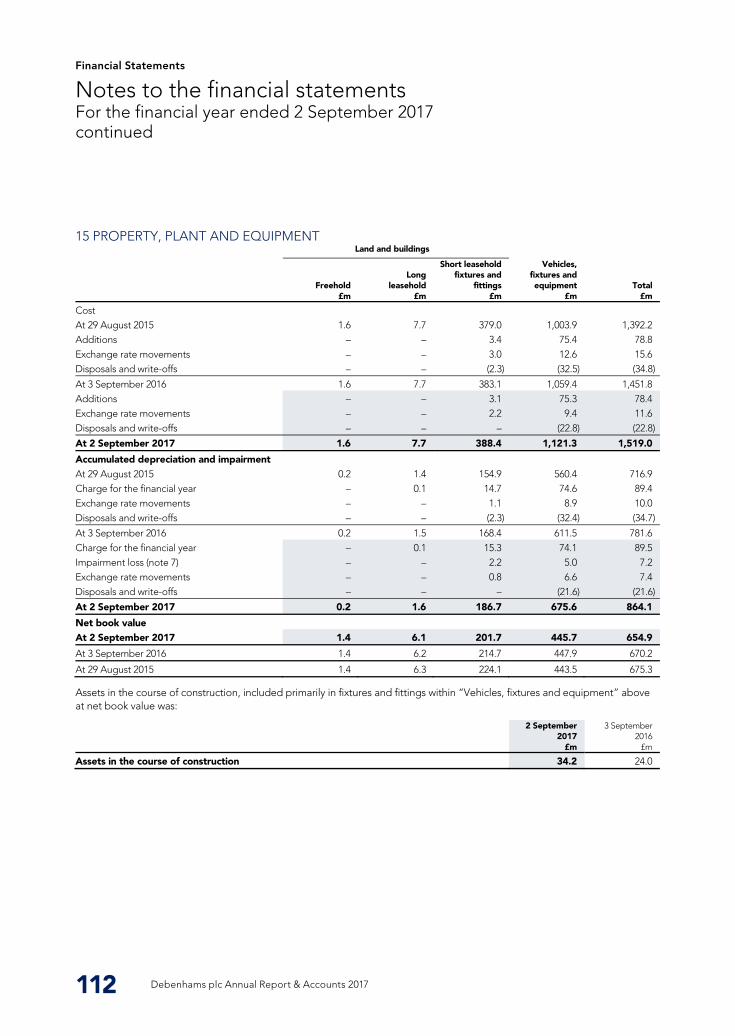
Financial Statements
15 PROPERTY, PLANT AND EQUIPMENT
Notes to the financial statements For the financial year ended 2 September 2017 continued
112 Debenhams plc Annual Report & Accounts 2017
Land and buildings
Freehold
£m
Long leasehold
£m
Short leasehold fixtures and
fittings £m
Vehicles, fixtures and equipment
£m Total
£m
Cost At 29 August 2015 1.6 7.7 379.0 1,003.9 1,392.2 Additions – – 3.4 75.4 78.8 Exchange rate movements – – 3.0 12.6 15.6 Disposals and write-offs – – (2.3) (32.5) (34.8)
At 3 September 2016 1.6 7.7 383.1 1,059.4 1,451.8 Additions – – 3.1 75.3 78.4 Exchange rate movements – – 2.2 9.4 11.6 Disposals and write-offs – – – (22.8) (22.8)
At 2 September 2017 1.6 7.7 388.4 1,121.3 1,519.0
Accumulated depreciation and impairment At 29 August 2015 0.2 1.4 154.9 560.4 716.9 Charge for the financial year – 0.1 14.7 74.6 89.4 Exchange rate movements – – 1.1 8.9 10.0 Disposals and write-offs – – (2.3) (32.4) (34.7)
At 3 September 2016 0.2 1.5 168.4 611.5 781.6 Charge for the financial year – 0.1 15.3 74.1 89.5 Impairment loss (note 7) – – 2.2 5.0 7.2 Exchange rate movements – – 0.8 6.6 7.4 Disposals and write-offs – – – (21.6) (21.6)
At 2 September 2017 0.2 1.6 186.7 675.6 864.1
Net book value At 2 September 2017 1.4 6.1 201.7 445.7 654.9
At 3 September 2016 1.4 6.2 214.7 447.9 670.2
At 29 August 2015 1.4 6.3 224.1 443.5 675.3
Assets in the course of construction, included primarily in fixtures and fittings within “Vehicles, fixtures and equipment” above at net book value was:
2 September 2017
£m
3 September 2016
£m
Assets in the course of construction 34.2 24.0
Debenhams plc Annual Report & Accounts 2017112
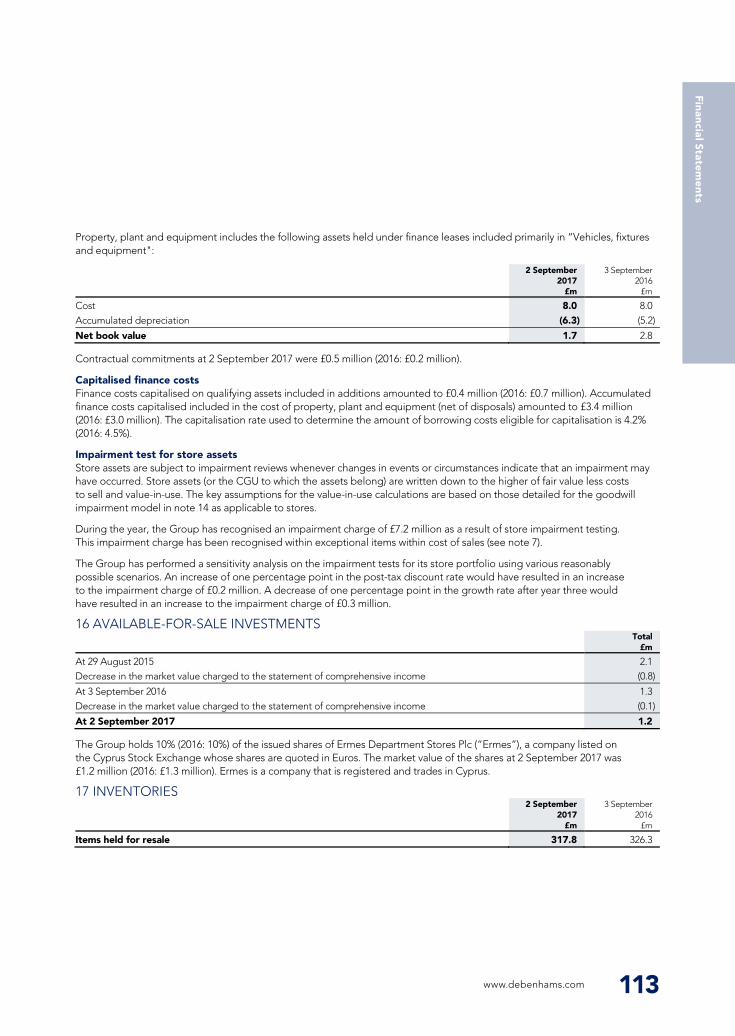
15 PROPERTY, PLANT AND EQUIPMENT
Notes to the financial statements For the financial year ended 2 September 2017 continued
112 Debenhams plc Annual Report & Accounts 2017
Land and buildings
Freehold
£m
Long leasehold
£m
Short leasehold fixtures and
fittings £m
Vehicles, fixtures and equipment
£m Total
£m
Cost At 29 August 2015 1.6 7.7 379.0 1,003.9 1,392.2 Additions – – 3.4 75.4 78.8 Exchange rate movements – – 3.0 12.6 15.6 Disposals and write-offs – – (2.3) (32.5) (34.8)
At 3 September 2016 1.6 7.7 383.1 1,059.4 1,451.8 Additions – – 3.1 75.3 78.4 Exchange rate movements – – 2.2 9.4 11.6 Disposals and write-offs – – – (22.8) (22.8)
At 2 September 2017 1.6 7.7 388.4 1,121.3 1,519.0
Accumulated depreciation and impairment At 29 August 2015 0.2 1.4 154.9 560.4 716.9 Charge for the financial year – 0.1 14.7 74.6 89.4 Exchange rate movements – – 1.1 8.9 10.0 Disposals and write-offs – – (2.3) (32.4) (34.7)
At 3 September 2016 0.2 1.5 168.4 611.5 781.6 Charge for the financial year – 0.1 15.3 74.1 89.5 Impairment loss (note 7) – – 2.2 5.0 7.2 Exchange rate movements – – 0.8 6.6 7.4 Disposals and write-offs – – – (21.6) (21.6)
At 2 September 2017 0.2 1.6 186.7 675.6 864.1
Net book value At 2 September 2017 1.4 6.1 201.7 445.7 654.9
At 3 September 2016 1.4 6.2 214.7 447.9 670.2
At 29 August 2015 1.4 6.3 224.1 443.5 675.3
Assets in the course of construction, included primarily in fixtures and fittings within “Vehicles, fixtures and equipment” above at net book value was:
2 September 2017
£m
3 September 2016
£m
Assets in the course of construction 34.2 24.0
Capitalised finance costs
Impairment test for store assets
16 AVAILABLE-FOR-SALE INVESTMENTS
17 INVENTORIES
www.debenhams.com 113
Property, plant and equipment includes the following assets held under finance leases included primarily in “Vehicles, fixtures and equipment":
2 September 2017
£m
3 September 2016
£m
Cost 8.0 8.0 Accumulated depreciation (6.3) (5.2)
Net book value 1.7 2.8
Contractual commitments at 2 September 2017 were £0.5 million (2016: £0.2 million).
Finance costs capitalised on qualifying assets included in additions amounted to £0.4 million (2016: £0.7 million). Accumulated finance costs capitalised included in the cost of property, plant and equipment (net of disposals) amounted to £3.4 million (2016: £3.0 million). The capitalisation rate used to determine the amount of borrowing costs eligible for capitalisation is 4.2% (2016: 4.5%).
Store assets are subject to impairment reviews whenever changes in events or circumstances indicate that an impairment may have occurred. Store assets (or the CGU to which the assets belong) are written down to the higher of fair value less costs to sell and value-in-use. The key assumptions for the value-in-use calculations are based on those detailed for the goodwill impairment model in note 14 as applicable to stores.
During the year, the Group has recognised an impairment charge of £7.2 million as a result of store impairment testing. This impairment charge has been recognised within exceptional items within cost of sales (see note 7).
The Group has performed a sensitivity analysis on the impairment tests for its store portfolio using various reasonably possible scenarios. An increase of one percentage point in the post-tax discount rate would have resulted in an increase to the impairment charge of £0.2 million. A decrease of one percentage point in the growth rate after year three would have resulted in an increase to the impairment charge of £0.3 million.
Total
£m
At 29 August 2015 2.1 Decrease in the market value charged to the statement of comprehensive income (0.8)
At 3 September 2016 1.3 Decrease in the market value charged to the statement of comprehensive income (0.1)
At 2 September 2017 1.2
The Group holds 10% (2016: 10%) of the issued shares of Ermes Department Stores Plc (“Ermes”), a company listed on the Cyprus Stock Exchange whose shares are quoted in Euros. The market value of the shares at 2 September 2017 was £1.2 million (2016: £1.3 million). Ermes is a company that is registered and trades in Cyprus.
2 September 2017
£m
3 September 2016
£m
Items held for resale 317.8 326.3
www.debenhams.com 113
Financial Statem
ents
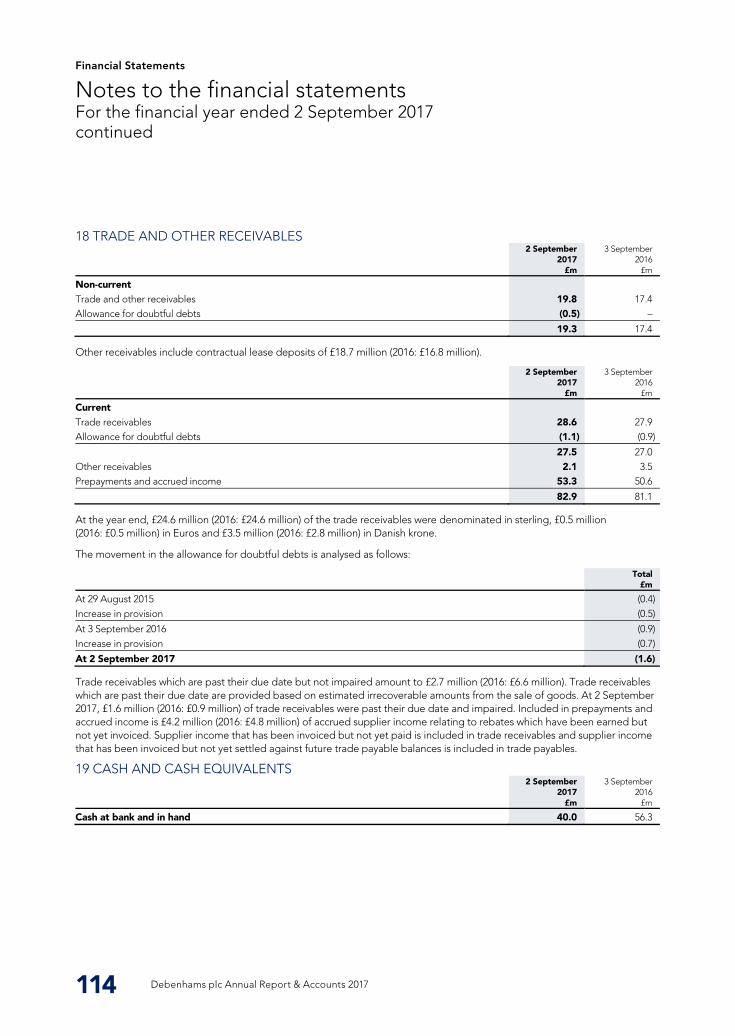
Financial Statements
18 TRADE AND OTHER RECEIVABLES
19 CASH AND CASH EQUIVALENTS
Notes to the financial statements For the financial year ended 2 September 2017 continued
114 Debenhams plc Annual Report & Accounts 2017
2 September 2017
£m
3 September 2016
£m
Non-current Trade and other receivables 19.8 17.4 Allowance for doubtful debts (0.5) –
19.3 17.4
Other receivables include contractual lease deposits of £18.7 million (2016: £16.8 million).
2 September 2017
£m
3 September 2016
£m
Current Trade receivables 28.6 27.9 Allowance for doubtful debts (1.1) (0.9)
27.5 27.0 Other receivables 2.1 3.5 Prepayments and accrued income 53.3 50.6
82.9 81.1
At the year end, £24.6 million (2016: £24.6 million) of the trade receivables were denominated in sterling, £0.5 million (2016: £0.5 million) in Euros and £3.5 million (2016: £2.8 million) in Danish krone.
The movement in the allowance for doubtful debts is analysed as follows:
Total
£m
At 29 August 2015 (0.4) Increase in provision (0.5)
At 3 September 2016 (0.9) Increase in provision (0.7)
At 2 September 2017 (1.6)
Trade receivables which are past their due date but not impaired amount to £2.7 million (2016: £6.6 million). Trade receivables which are past their due date are provided based on estimated irrecoverable amounts from the sale of goods. At 2 September 2017, £1.6 million (2016: £0.9 million) of trade receivables were past their due date and impaired. Included in prepayments and accrued income is £4.2 million (2016: £4.8 million) of accrued supplier income relating to rebates which have been earned but not yet invoiced. Supplier income that has been invoiced but not yet paid is included in trade receivables and supplier income that has been invoiced but not yet settled against future trade payable balances is included in trade payables.
2 September 2017
£m
3 September 2016
£m
Cash at bank and in hand 40.0 56.3
Debenhams plc Annual Report & Accounts 2017114
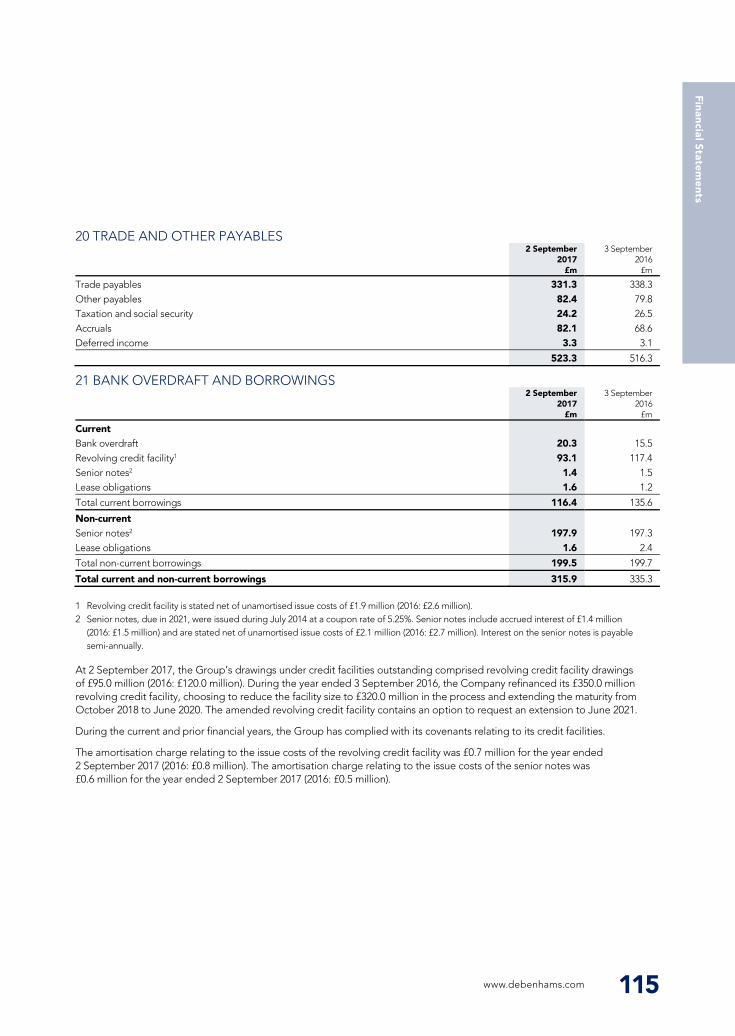
18 TRADE AND OTHER RECEIVABLES
19 CASH AND CASH EQUIVALENTS
Notes to the financial statements For the financial year ended 2 September 2017 continued
114 Debenhams plc Annual Report & Accounts 2017
2 September 2017
£m
3 September 2016
£m
Non-current Trade and other receivables 19.8 17.4 Allowance for doubtful debts (0.5) –
19.3 17.4
Other receivables include contractual lease deposits of £18.7 million (2016: £16.8 million).
2 September 2017
£m
3 September 2016
£m
Current Trade receivables 28.6 27.9 Allowance for doubtful debts (1.1) (0.9)
27.5 27.0 Other receivables 2.1 3.5 Prepayments and accrued income 53.3 50.6
82.9 81.1
At the year end, £24.6 million (2016: £24.6 million) of the trade receivables were denominated in sterling, £0.5 million (2016: £0.5 million) in Euros and £3.5 million (2016: £2.8 million) in Danish krone.
The movement in the allowance for doubtful debts is analysed as follows:
Total
£m
At 29 August 2015 (0.4) Increase in provision (0.5)
At 3 September 2016 (0.9) Increase in provision (0.7)
At 2 September 2017 (1.6)
Trade receivables which are past their due date but not impaired amount to £2.7 million (2016: £6.6 million). Trade receivables which are past their due date are provided based on estimated irrecoverable amounts from the sale of goods. At 2 September 2017, £1.6 million (2016: £0.9 million) of trade receivables were past their due date and impaired. Included in prepayments and accrued income is £4.2 million (2016: £4.8 million) of accrued supplier income relating to rebates which have been earned but not yet invoiced. Supplier income that has been invoiced but not yet paid is included in trade receivables and supplier income that has been invoiced but not yet settled against future trade payable balances is included in trade payables.
2 September 2017
£m
3 September 2016
£m
Cash at bank and in hand 40.0 56.3
20 TRADE AND OTHER PAYABLES
21 BANK OVERDRAFT AND BORROWINGS
www.debenhams.com 115
2 September 2017
£m
3 September 2016
£m
Trade payables 331.3 338.3 Other payables 82.4 79.8 Taxation and social security 24.2 26.5 Accruals 82.1 68.6 Deferred income 3.3 3.1
523.3 516.3
2 September 2017
£m
3 September 2016
£m
Current Bank overdraft 20.3 15.5 Revolving credit facility1 93.1 117.4 Senior notes2 1.4 1.5 Lease obligations 1.6 1.2
Total current borrowings 116.4 135.6
Non-current Senior notes2 197.9 197.3 Lease obligations 1.6 2.4
Total non-current borrowings 199.5 199.7
Total current and non-current borrowings 315.9 335.3
1 Revolving credit facility is stated net of unamortised issue costs of £1.9 million (2016: £2.6 million). 2 Senior notes, due in 2021, were issued during July 2014 at a coupon rate of 5.25%. Senior notes include accrued interest of £1.4 million
(2016: £1.5 million) and are stated net of unamortised issue costs of £2.1 million (2016: £2.7 million). Interest on the senior notes is payable semi-annually.
At 2 September 2017, the Group’s drawings under credit facilities outstanding comprised revolving credit facility drawings of £95.0 million (2016: £120.0 million). During the year ended 3 September 2016, the Company refinanced its £350.0 million revolving credit facility, choosing to reduce the facility size to £320.0 million in the process and extending the maturity from October 2018 to June 2020. The amended revolving credit facility contains an option to request an extension to June 2021.
During the current and prior financial years, the Group has complied with its covenants relating to its credit facilities.
The amortisation charge relating to the issue costs of the revolving credit facility was £0.7 million for the year ended 2 September 2017 (2016: £0.8 million). The amortisation charge relating to the issue costs of the senior notes was £0.6 million for the year ended 2 September 2017 (2016: £0.5 million).
www.debenhams.com 115
Financial Statem
ents
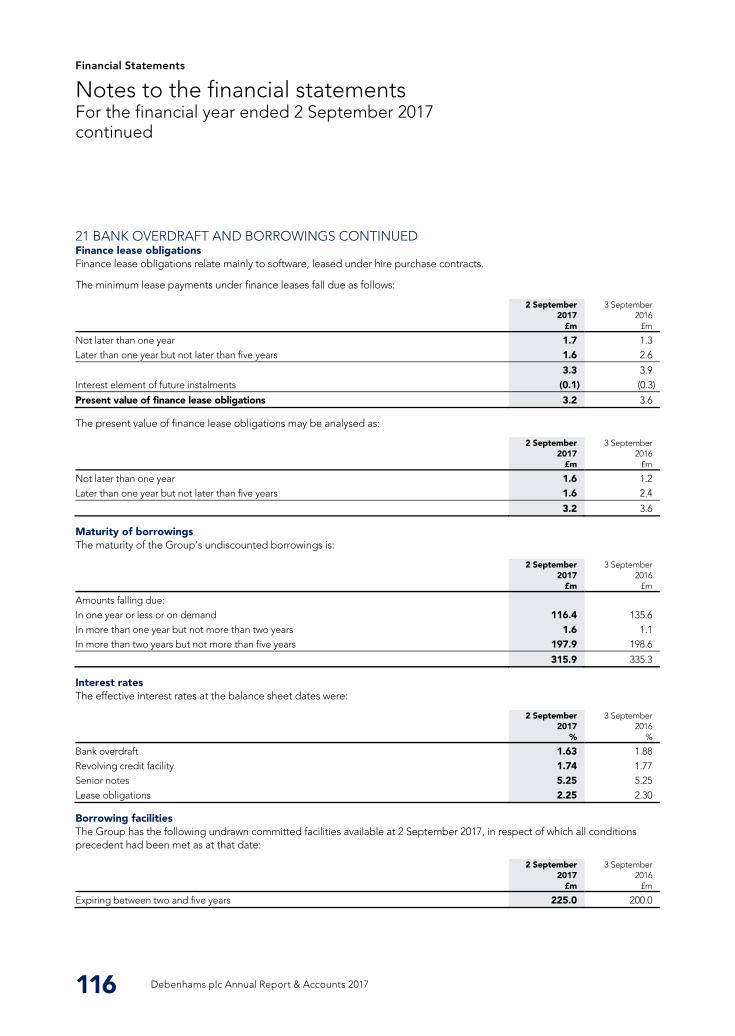
Financial Statements
21 BANK OVERDRAFT AND BORROWINGS CONTINUED Finance lease obligations
Maturity of borrowings
Interest rates
Borrowing facilities
Notes to the financial statements For the financial year ended 2 September 2017 continued
116 Debenhams plc Annual Report & Accounts 2017
Finance lease obligations relate mainly to software, leased under hire purchase contracts.
The minimum lease payments under finance leases fall due as follows:
2 September 2017
£m
3 September 2016
£m
Not later than one year 1.7 1.3 Later than one year but not later than five years 1.6 2.6
3.3 3.9 Interest element of future instalments (0.1) (0.3)
Present value of finance lease obligations 3.2 3.6
The present value of finance lease obligations may be analysed as:
2 September 2017
£m
3 September 2016
£m
Not later than one year 1.6 1.2 Later than one year but not later than five years 1.6 2.4
3.2 3.6
The maturity of the Group’s undiscounted borrowings is:
2 September 2017
£m
3 September 2016
£m
Amounts falling due: In one year or less or on demand 116.4 135.6 In more than one year but not more than two years 1.6 1.1 In more than two years but not more than five years 197.9 198.6
315.9 335.3
The effective interest rates at the balance sheet dates were:
2 September 2017
%
3 September 2016
%
Bank overdraft 1.63 1.88 Revolving credit facility 1.74 1.77 Senior notes 5.25 5.25 Lease obligations 2.25 2.30
The Group has the following undrawn committed facilities available at 2 September 2017, in respect of which all conditions precedent had been met as at that date:
2 September 2017
£m
3 September 2016
£m
Expiring between two and five years 225.0 200.0
Debenhams plc Annual Report & Accounts 2017116
21 BANK OVERDRAFT AND BORROWINGS CONTINUED Finance lease obligations
Maturity of borrowings
Interest rates
Borrowing facilities
Notes to the financial statements For the financial year ended 2 September 2017 continued
116 Debenhams plc Annual Report & Accounts 2017
Finance lease obligations relate mainly to software, leased under hire purchase contracts.
The minimum lease payments under finance leases fall due as follows:
2 September 2017
£m
3 September 2016
£m
Not later than one year 1.7 1.3 Later than one year but not later than five years 1.6 2.6
3.3 3.9 Interest element of future instalments (0.1) (0.3)
Present value of finance lease obligations 3.2 3.6
The present value of finance lease obligations may be analysed as:
2 September 2017
£m
3 September 2016
£m
Not later than one year 1.6 1.2 Later than one year but not later than five years 1.6 2.4
3.2 3.6
The maturity of the Group’s undiscounted borrowings is:
2 September 2017
£m
3 September 2016
£m
Amounts falling due: In one year or less or on demand 116.4 135.6 In more than one year but not more than two years 1.6 1.1 In more than two years but not more than five years 197.9 198.6
315.9 335.3
The effective interest rates at the balance sheet dates were:
2 September 2017
%
3 September 2016
%
Bank overdraft 1.63 1.88 Revolving credit facility 1.74 1.77 Senior notes 5.25 5.25 Lease obligations 2.25 2.30
The Group has the following undrawn committed facilities available at 2 September 2017, in respect of which all conditions precedent had been met as at that date:
2 September 2017
£m
3 September 2016
£m
Expiring between two and five years 225.0 200.0
22 FINANCIAL RISK MANAGEMENT a) Financial risks and treasury management
i) Funding and liquidity risk
www.debenhams.com 117
The Group conducts its treasury activities within the remit of a treasury policy which outlines approved policies, procedures and authority levels. The board delegates its responsibility for reviewing and approving treasury policy to the Audit Committee. Reports are prepared monthly covering all areas of treasury activity and policy compliance and are reviewed by the Chief Financial Officer. The board and Audit Committee receive regular reports covering treasury activities and policy compliance. Group treasury manages the Group’s funding requirements and financial risks in line with the agreed treasury policies and procedures.
The Group’s financial instruments, other than derivatives, primarily include borrowings, cash and liquid resources, available- for-sale assets, trade receivables and trade payables. The main purpose of these financial instruments is to manage liquidity or raise finance for the Group.
Group treasury uses derivative financial instruments to manage its currency risk arising from the Group’s operations and interest rate risks associated with the Group’s financing. The derivatives used are mainly forward currency contracts and interest rate swaps. The Group did not have any interest rate swaps in place at 2 September 2017.
The Group’s activities expose it to a variety of financial risks, which include:
Funding and liquidity risk Credit risk Foreign exchange risk Interest rate risk Other price risk
The Group’s overall risk management programme focuses on the unpredictability of financial markets and seeks to minimise potential adverse effects on the Group’s financial performance. The Group uses derivative financial instruments to hedge certain risk exposures.
The policies and strategies for managing these risks are summarised as follows:
Prudent liquidity risk management implies sufficient cash and marketable securities, the availability of funding through an adequate amount of committed credit facilities and the ability to close out market positions. Due to the dynamic nature of the underlying business, Group treasury aims to maintain flexibility in funding by keeping committed credit lines available.
The Group finances its operations by a combination of retained profits, debt finance and leases. Group treasury monitors rolling forecasts of the Group’s liquidity requirements to ensure that it has a sufficient cash or working capital facility to meet the cash flow and covenant requirements of the Group and the current business plan.
Surplus cash held by the operating entities over and above balances required for working capital management is transferred to Group treasury. Group treasury invests surplus cash in interest bearing current accounts and term deposits, choosing instruments with appropriate maturities or sufficient liquidity to provide sufficient headroom as determined by the above-mentioned forecasts.
www.debenhams.com 117
Financial Statem
ents
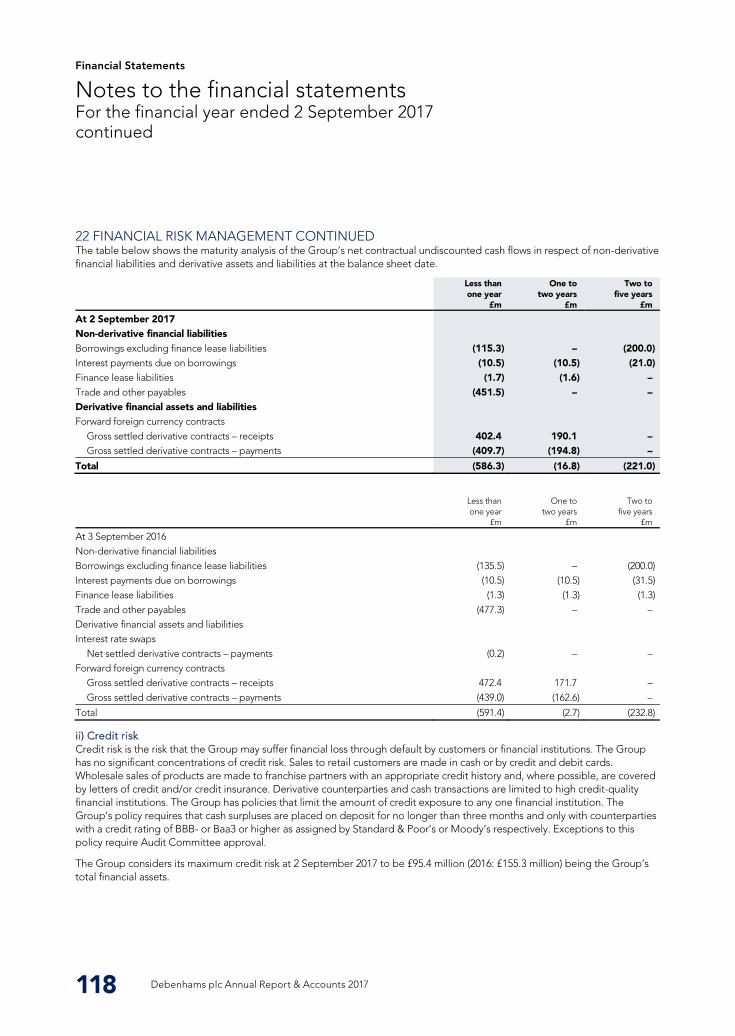
Financial Statements
22 FINANCIAL RISK MANAGEMENT CONTINUED
ii) Credit risk
Notes to the financial statements For the financial year ended 2 September 2017 continued
118 Debenhams plc Annual Report & Accounts 2017
The table below shows the maturity analysis of the Group’s net contractual undiscounted cash flows in respect of non-derivative financial liabilities and derivative assets and liabilities at the balance sheet date.
Less than one year
£m
One to two years
£m
Two to five years
£m
At 2 September 2017 Non-derivative financial liabilities Borrowings excluding finance lease liabilities (115.3) – (200.0) Interest payments due on borrowings (10.5) (10.5) (21.0) Finance lease liabilities (1.7) (1.6) – Trade and other payables (451.5) – – Derivative financial assets and liabilities Forward foreign currency contracts
Gross settled derivative contracts – receipts 402.4 190.1 – Gross settled derivative contracts – payments (409.7) (194.8) –
Total (586.3) (16.8) (221.0)
Less than one year
£m
One to two years
£m
Two to five years
£m
At 3 September 2016 Non-derivative financial liabilities Borrowings excluding finance lease liabilities (135.5) – (200.0) Interest payments due on borrowings (10.5) (10.5) (31.5) Finance lease liabilities (1.3) (1.3) (1.3) Trade and other payables (477.3) – – Derivative financial assets and liabilities Interest rate swaps
Net settled derivative contracts – payments (0.2) – – Forward foreign currency contracts
Gross settled derivative contracts – receipts 472.4 171.7 – Gross settled derivative contracts – payments (439.0) (162.6) –
Total (591.4) (2.7) (232.8)
Credit risk is the risk that the Group may suffer financial loss through default by customers or financial institutions. The Group has no significant concentrations of credit risk. Sales to retail customers are made in cash or by credit and debit cards. Wholesale sales of products are made to franchise partners with an appropriate credit history and, where possible, are covered by letters of credit and/or credit insurance. Derivative counterparties and cash transactions are limited to high credit-quality financial institutions. The Group has policies that limit the amount of credit exposure to any one financial institution. The Group’s policy requires that cash surpluses are placed on deposit for no longer than three months and only with counterparties with a credit rating of BBB- or Baa3 or higher as assigned by Standard & Poor’s or Moody’s respectively. Exceptions to this policy require Audit Committee approval.
The Group considers its maximum credit risk at 2 September 2017 to be £95.4 million (2016: £155.3 million) being the Group’s total financial assets.
Debenhams plc Annual Report & Accounts 2017118
22 FINANCIAL RISK MANAGEMENT CONTINUED
ii) Credit risk
Notes to the financial statements For the financial year ended 2 September 2017 continued
118 Debenhams plc Annual Report & Accounts 2017
The table below shows the maturity analysis of the Group’s net contractual undiscounted cash flows in respect of non-derivative financial liabilities and derivative assets and liabilities at the balance sheet date.
Less than one year
£m
One to two years
£m
Two to five years
£m
At 2 September 2017 Non-derivative financial liabilities Borrowings excluding finance lease liabilities (115.3) – (200.0) Interest payments due on borrowings (10.5) (10.5) (21.0) Finance lease liabilities (1.7) (1.6) – Trade and other payables (451.5) – – Derivative financial assets and liabilities Forward foreign currency contracts
Gross settled derivative contracts – receipts 402.4 190.1 – Gross settled derivative contracts – payments (409.7) (194.8) –
Total (586.3) (16.8) (221.0)
Less than one year
£m
One to two years
£m
Two to five years
£m
At 3 September 2016 Non-derivative financial liabilities Borrowings excluding finance lease liabilities (135.5) – (200.0) Interest payments due on borrowings (10.5) (10.5) (31.5) Finance lease liabilities (1.3) (1.3) (1.3) Trade and other payables (477.3) – – Derivative financial assets and liabilities Interest rate swaps
Net settled derivative contracts – payments (0.2) – – Forward foreign currency contracts
Gross settled derivative contracts – receipts 472.4 171.7 – Gross settled derivative contracts – payments (439.0) (162.6) –
Total (591.4) (2.7) (232.8)
Credit risk is the risk that the Group may suffer financial loss through default by customers or financial institutions. The Group has no significant concentrations of credit risk. Sales to retail customers are made in cash or by credit and debit cards. Wholesale sales of products are made to franchise partners with an appropriate credit history and, where possible, are covered by letters of credit and/or credit insurance. Derivative counterparties and cash transactions are limited to high credit-quality financial institutions. The Group has policies that limit the amount of credit exposure to any one financial institution. The Group’s policy requires that cash surpluses are placed on deposit for no longer than three months and only with counterparties with a credit rating of BBB- or Baa3 or higher as assigned by Standard & Poor’s or Moody’s respectively. Exceptions to this policy require Audit Committee approval.
The Group considers its maximum credit risk at 2 September 2017 to be £95.4 million (2016: £155.3 million) being the Group’s total financial assets.
iii) Foreign exchange risk
iv) Interest rate risk
www.debenhams.com 119
The Group operates internationally and is exposed to foreign exchange risk arising from various currency exposures, primarily with respect to the US dollar, the Euro, the Chinese yuan and the Danish krone.
To manage the foreign exchange transaction risk, entities in the Group use forward foreign currency contracts transacted by Group treasury. Foreign exchange risk arises when commercial transactions are denominated in a currency that is not the entity’s functional currency. Group treasury is responsible for managing the exposure in each foreign currency by using external forward foreign currency contracts with a settlement of up to three (2016: three) years. Forecast cash flows are hedged to the extent that those cash flows are deemed highly probable. The Group regularly reviews the need to hedge foreign exchange exposure arising from the financial results, assets and liabilities of its non-sterling businesses, hedging those exposures to the extent that they are considered appropriate for hedging.
The Group manages foreign exchange translation risk by entering into monthly foreign exchange swap contracts to offset month-by-month currency translation impacts within the Group, where appropriate.
During the current and previous financial years, the Group closed out certain forward foreign currency contracts and reset the contracts to current market rates. As a result of these transactions, cash amounting to £10.1 million (2016: £11.2 million) was received. Gains on forward foreign currency contracts reset to current market rates are recycled from the hedging reserve as the contracts reach expiry in accordance with the Group’s cash flow hedging policy.
A gain of £50.4 million (2016: £27.2 million) was reclassified from equity to the income statement within cost of inventory during the year in respect of forward foreign currency contracts designated as cash flow hedges.
The notional value of open forward foreign currency contracts at 2 September 2017 was £565.7 million (2016: £547.5 million).
The net fair value losses on open forward foreign currency contracts held in the hedging reserve at 2 September 2017 were £5.5 million (2016: gains of £38.3 million). This will be recycled and adjusted against the initial measurement of the acquisition cost of inventory over the next three years.
During the current and prior financial years there were no contracts reclassified to “held for trading” due to cash flow hedges being ineffective.
The Group’s interest rate risk arises from long-term borrowing facilities with debt issued at variable rates that expose the Group to cash flow interest rate risk. At 2 September 2017, Debenhams plc has in issue £200.0 million (2016: £200.0 million) of senior notes at a coupon rate of 5.25% which reduces the Group’s exposure to cash flow interest rate risk.
The interest exposure of the Group is managed within the constraints of the Group’s business plan and the financial covenants under its facilities. The aim is to reduce exposure to interest rate movements and to take advantage of low interest rates by hedging an appropriate amount of interest rate exposure whilst maintaining the flexibility to minimise early termination costs. The Group’s interest rate hedging strategy is to achieve a target fixed percentage of 75%, with a 15% tolerance (60% – 90%).
The impact of movements in interest rates is managed with fixed rate debt and the use of interest rate swaps. Interest rate swaps are usually matched with specific loans for a period of time up to their maturity or call date.
The Group’s main interest rate exposure is from the floating rate loans under the credit facilities. At the year end the percentage of the Group’s total borrowings subject to fixed interest rates (either directly or as a result of hedging) was 62.8% (2016: 94.4%).
Interest rate swaps The Group’s interest rate swaps switch interest from floating rates to fixed rates. At 2 September 2017 the Group had no interest rate swaps in place. The notional principal amount of interest rate swaps at 3 September 2016 was £120.0 million. The net gains and losses on these swaps, which were deferred in equity, reversed through interest in the income statement over the life of the swaps. During the financial year a loss of £0.2 million (2016: £0.8 million) was reclassified and reported in the income statement in respect of interest rate swaps.
www.debenhams.com 119
Financial Statem
ents
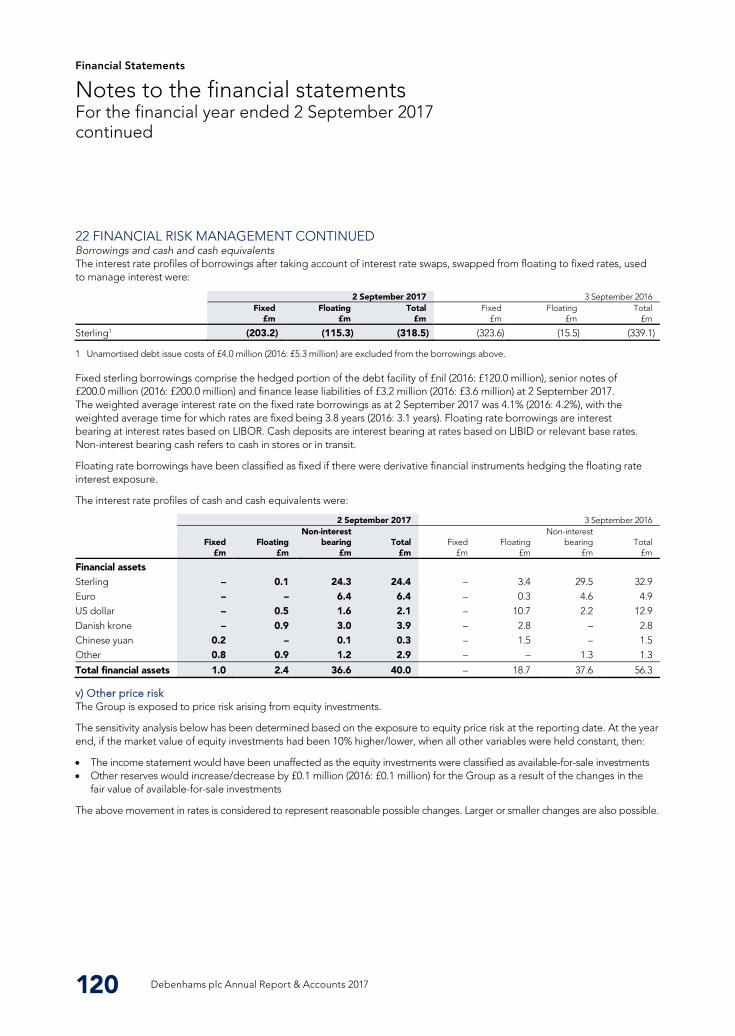
Financial Statements
22 FINANCIAL RISK MANAGEMENT CONTINUED
v) Other price risk
Notes to the financial statements For the financial year ended 2 September 2017 continued
120 Debenhams plc Annual Report & Accounts 2017
Borrowings and cash and cash equivalents The interest rate profiles of borrowings after taking account of interest rate swaps, swapped from floating to fixed rates, used to manage interest were:
2 September 2017 3 September 2016
Fixed
£m Floating
£m Total
£m Fixed
£m Floating
£m Total
£m
Sterling1 (203.2) (115.3) (318.5) (323.6) (15.5) (339.1)
1 Unamortised debt issue costs of £4.0 million (2016: £5.3 million) are excluded from the borrowings above.
Fixed sterling borrowings comprise the hedged portion of the debt facility of £nil (2016: £120.0 million), senior notes of £200.0 million (2016: £200.0 million) and finance lease liabilities of £3.2 million (2016: £3.6 million) at 2 September 2017. The weighted average interest rate on the fixed rate borrowings as at 2 September 2017 was 4.1% (2016: 4.2%), with the weighted average time for which rates are fixed being 3.8 years (2016: 3.1 years). Floating rate borrowings are interest bearing at interest rates based on LIBOR. Cash deposits are interest bearing at rates based on LIBID or relevant base rates. Non-interest bearing cash refers to cash in stores or in transit.
Floating rate borrowings have been classified as fixed if there were derivative financial instruments hedging the floating rate interest exposure.
The interest rate profiles of cash and cash equivalents were:
2 September 2017 3 September 2016
Fixed
£m Floating
£m
Non-interest bearing
£m Total
£m Fixed
£m Floating
£m
Non-interest bearing
£m Total
£m
Financial assets Sterling – 0.1 24.3 24.4 – 3.4 29.5 32.9 Euro – – 6.4 6.4 – 0.3 4.6 4.9 US dollar – 0.5 1.6 2.1 – 10.7 2.2 12.9 Danish krone – 0.9 3.0 3.9 – 2.8 – 2.8 Chinese yuan 0.2 – 0.1 0.3 – 1.5 – 1.5 Other 0.8 0.9 1.2 2.9 – – 1.3 1.3
Total financial assets 1.0 2.4 36.6 40.0 – 18.7 37.6 56.3
The Group is exposed to price risk arising from equity investments.
The sensitivity analysis below has been determined based on the exposure to equity price risk at the reporting date. At the year end, if the market value of equity investments had been 10% higher/lower, when all other variables were held constant, then:
The income statement would have been unaffected as the equity investments were classified as available-for-sale investments Other reserves would increase/decrease by £0.1 million (2016: £0.1 million) for the Group as a result of the changes in the
fair value of available-for-sale investments
The above movement in rates is considered to represent reasonable possible changes. Larger or smaller changes are also possible.
Debenhams plc Annual Report & Accounts 2017120
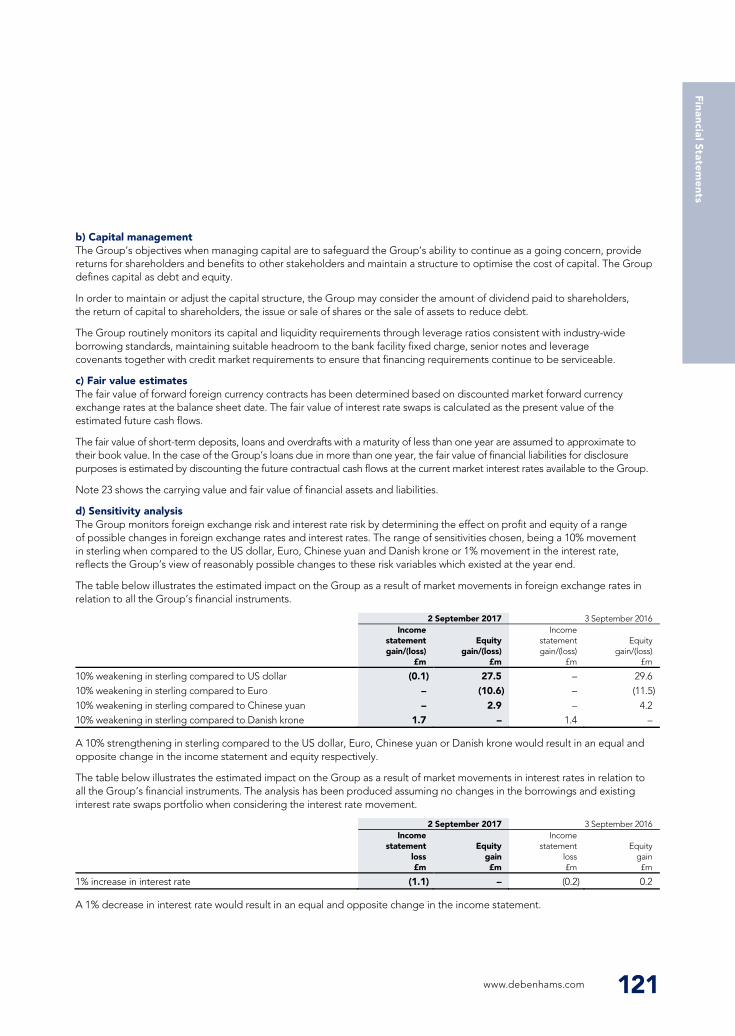
22 FINANCIAL RISK MANAGEMENT CONTINUED
v) Other price risk
Notes to the financial statements For the financial year ended 2 September 2017 continued
120 Debenhams plc Annual Report & Accounts 2017
Borrowings and cash and cash equivalents The interest rate profiles of borrowings after taking account of interest rate swaps, swapped from floating to fixed rates, used to manage interest were:
2 September 2017 3 September 2016
Fixed
£m Floating
£m Total
£m Fixed
£m Floating
£m Total
£m
Sterling1 (203.2) (115.3) (318.5) (323.6) (15.5) (339.1)
1 Unamortised debt issue costs of £4.0 million (2016: £5.3 million) are excluded from the borrowings above.
Fixed sterling borrowings comprise the hedged portion of the debt facility of £nil (2016: £120.0 million), senior notes of £200.0 million (2016: £200.0 million) and finance lease liabilities of £3.2 million (2016: £3.6 million) at 2 September 2017. The weighted average interest rate on the fixed rate borrowings as at 2 September 2017 was 4.1% (2016: 4.2%), with the weighted average time for which rates are fixed being 3.8 years (2016: 3.1 years). Floating rate borrowings are interest bearing at interest rates based on LIBOR. Cash deposits are interest bearing at rates based on LIBID or relevant base rates. Non-interest bearing cash refers to cash in stores or in transit.
Floating rate borrowings have been classified as fixed if there were derivative financial instruments hedging the floating rate interest exposure.
The interest rate profiles of cash and cash equivalents were:
2 September 2017 3 September 2016
Fixed
£m Floating
£m
Non-interest bearing
£m Total
£m Fixed
£m Floating
£m
Non-interest bearing
£m Total
£m
Financial assets Sterling – 0.1 24.3 24.4 – 3.4 29.5 32.9 Euro – – 6.4 6.4 – 0.3 4.6 4.9 US dollar – 0.5 1.6 2.1 – 10.7 2.2 12.9 Danish krone – 0.9 3.0 3.9 – 2.8 – 2.8 Chinese yuan 0.2 – 0.1 0.3 – 1.5 – 1.5 Other 0.8 0.9 1.2 2.9 – – 1.3 1.3
Total financial assets 1.0 2.4 36.6 40.0 – 18.7 37.6 56.3
The Group is exposed to price risk arising from equity investments.
The sensitivity analysis below has been determined based on the exposure to equity price risk at the reporting date. At the year end, if the market value of equity investments had been 10% higher/lower, when all other variables were held constant, then:
The income statement would have been unaffected as the equity investments were classified as available-for-sale investments Other reserves would increase/decrease by £0.1 million (2016: £0.1 million) for the Group as a result of the changes in the
fair value of available-for-sale investments
The above movement in rates is considered to represent reasonable possible changes. Larger or smaller changes are also possible.
b) Capital management
c) Fair value estimates
d) Sensitivity analysis
www.debenhams.com 121
The Group’s objectives when managing capital are to safeguard the Group’s ability to continue as a going concern, provide returns for shareholders and benefits to other stakeholders and maintain a structure to optimise the cost of capital. The Group defines capital as debt and equity.
In order to maintain or adjust the capital structure, the Group may consider the amount of dividend paid to shareholders, the return of capital to shareholders, the issue or sale of shares or the sale of assets to reduce debt.
The Group routinely monitors its capital and liquidity requirements through leverage ratios consistent with industry-wide borrowing standards, maintaining suitable headroom to the bank facility fixed charge, senior notes and leverage covenants together with credit market requirements to ensure that financing requirements continue to be serviceable.
The fair value of forward foreign currency contracts has been determined based on discounted market forward currency exchange rates at the balance sheet date. The fair value of interest rate swaps is calculated as the present value of the estimated future cash flows.
The fair value of short-term deposits, loans and overdrafts with a maturity of less than one year are assumed to approximate to their book value. In the case of the Group’s loans due in more than one year, the fair value of financial liabilities for disclosure purposes is estimated by discounting the future contractual cash flows at the current market interest rates available to the Group.
Note 23 shows the carrying value and fair value of financial assets and liabilities.
The Group monitors foreign exchange risk and interest rate risk by determining the effect on profit and equity of a range of possible changes in foreign exchange rates and interest rates. The range of sensitivities chosen, being a 10% movement in sterling when compared to the US dollar, Euro, Chinese yuan and Danish krone or 1% movement in the interest rate, reflects the Group’s view of reasonably possible changes to these risk variables which existed at the year end.
The table below illustrates the estimated impact on the Group as a result of market movements in foreign exchange rates in relation to all the Group’s financial instruments.
2 September 2017 3 September 2016
Income statement gain/(loss)
£m
Equity gain/(loss)
£m
Income statement gain/(loss)
£m
Equity gain/(loss)
£m
10% weakening in sterling compared to US dollar (0.1) 27.5 – 29.6 10% weakening in sterling compared to Euro – (10.6) – (11.5) 10% weakening in sterling compared to Chinese yuan – 2.9 – 4.2 10% weakening in sterling compared to Danish krone 1.7 – 1.4 –
A 10% strengthening in sterling compared to the US dollar, Euro, Chinese yuan or Danish krone would result in an equal and opposite change in the income statement and equity respectively.
The table below illustrates the estimated impact on the Group as a result of market movements in interest rates in relation to all the Group’s financial instruments. The analysis has been produced assuming no changes in the borrowings and existing interest rate swaps portfolio when considering the interest rate movement.
2 September 2017 3 September 2016
Income statement
loss £m
Equity gain £m
Income statement
loss £m
Equity gain £m
1% increase in interest rate (1.1) – (0.2) 0.2
A 1% decrease in interest rate would result in an equal and opposite change in the income statement.
www.debenhams.com 121
Financial Statem
ents
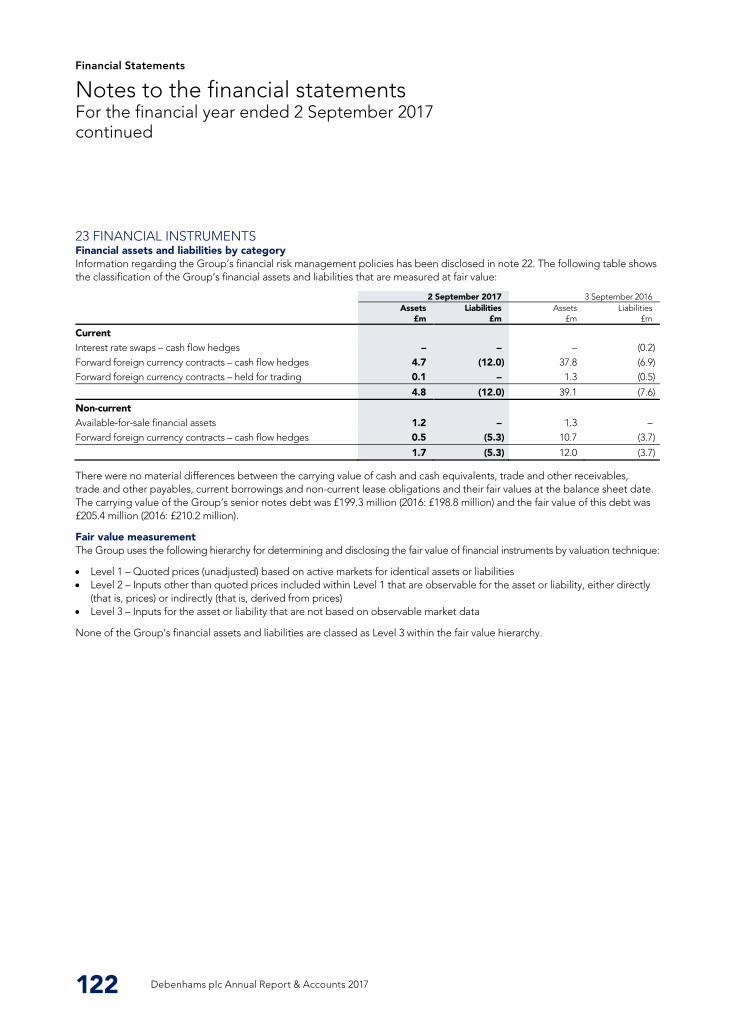
Financial Statements
23 FINANCIAL INSTRUMENTS Financial assets and liabilities by category
Fair value measurement
Notes to the financial statements For the financial year ended 2 September 2017 continued
122 Debenhams plc Annual Report & Accounts 2017
Information regarding the Group’s financial risk management policies has been disclosed in note 22. The following table shows the classification of the Group’s financial assets and liabilities that are measured at fair value:
2 September 2017 3 September 2016
Assets
£m Liabilities
£m Assets
£m Liabilities
£m
Current Interest rate swaps – cash flow hedges – – – (0.2) Forward foreign currency contracts – cash flow hedges 4.7 (12.0) 37.8 (6.9) Forward foreign currency contracts – held for trading 0.1 – 1.3 (0.5)
4.8 (12.0) 39.1 (7.6)
Non-current Available-for-sale financial assets 1.2 – 1.3 – Forward foreign currency contracts – cash flow hedges 0.5 (5.3) 10.7 (3.7)
1.7 (5.3) 12.0 (3.7)
There were no material differences between the carrying value of cash and cash equivalents, trade and other receivables, trade and other payables, current borrowings and non-current lease obligations and their fair values at the balance sheet date. The carrying value of the Group’s senior notes debt was £199.3 million (2016: £198.8 million) and the fair value of this debt was £205.4 million (2016: £210.2 million).
The Group uses the following hierarchy for determining and disclosing the fair value of financial instruments by valuation technique:
Level 1 – Quoted prices (unadjusted) based on active markets for identical assets or liabilities Level 2 – Inputs other than quoted prices included within Level 1 that are observable for the asset or liability, either directly
(that is, prices) or indirectly (that is, derived from prices) Level 3 – Inputs for the asset or liability that are not based on observable market data
None of the Group’s financial assets and liabilities are classed as Level 3 within the fair value hierarchy.
Debenhams plc Annual Report & Accounts 2017122
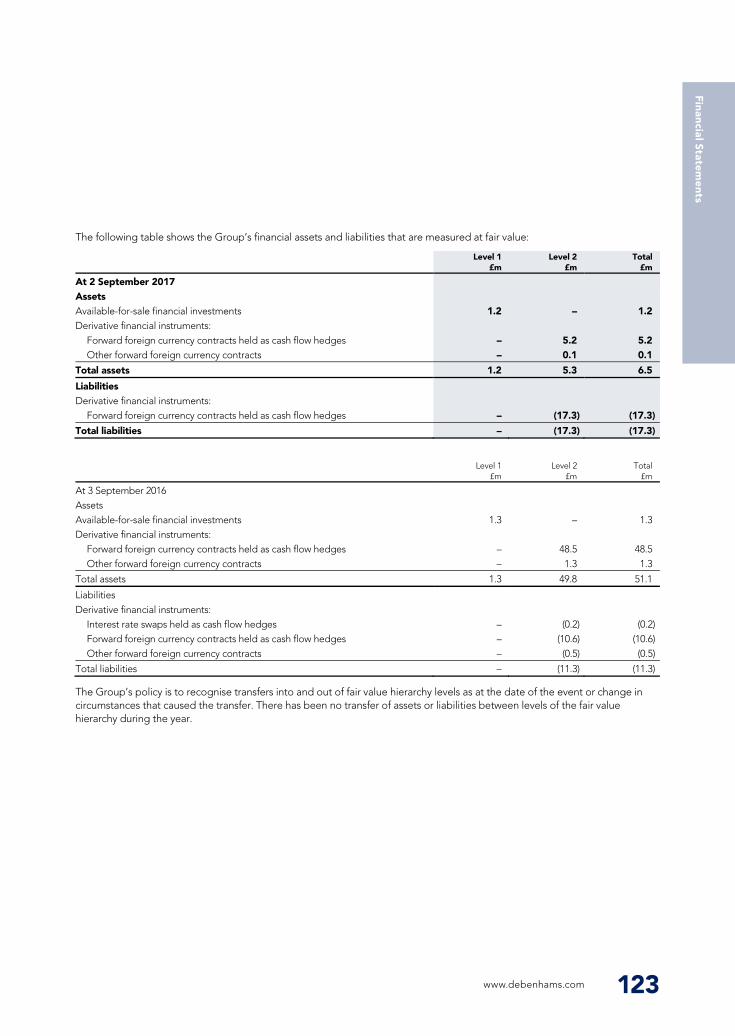
23 FINANCIAL INSTRUMENTS Financial assets and liabilities by category
Fair value measurement
Notes to the financial statements For the financial year ended 2 September 2017 continued
122 Debenhams plc Annual Report & Accounts 2017
Information regarding the Group’s financial risk management policies has been disclosed in note 22. The following table shows the classification of the Group’s financial assets and liabilities that are measured at fair value:
2 September 2017 3 September 2016
Assets
£m Liabilities
£m Assets
£m Liabilities
£m
Current Interest rate swaps – cash flow hedges – – – (0.2) Forward foreign currency contracts – cash flow hedges 4.7 (12.0) 37.8 (6.9) Forward foreign currency contracts – held for trading 0.1 – 1.3 (0.5)
4.8 (12.0) 39.1 (7.6)
Non-current Available-for-sale financial assets 1.2 – 1.3 – Forward foreign currency contracts – cash flow hedges 0.5 (5.3) 10.7 (3.7)
1.7 (5.3) 12.0 (3.7)
There were no material differences between the carrying value of cash and cash equivalents, trade and other receivables, trade and other payables, current borrowings and non-current lease obligations and their fair values at the balance sheet date. The carrying value of the Group’s senior notes debt was £199.3 million (2016: £198.8 million) and the fair value of this debt was £205.4 million (2016: £210.2 million).
The Group uses the following hierarchy for determining and disclosing the fair value of financial instruments by valuation technique:
Level 1 – Quoted prices (unadjusted) based on active markets for identical assets or liabilities Level 2 – Inputs other than quoted prices included within Level 1 that are observable for the asset or liability, either directly
(that is, prices) or indirectly (that is, derived from prices) Level 3 – Inputs for the asset or liability that are not based on observable market data
None of the Group’s financial assets and liabilities are classed as Level 3 within the fair value hierarchy.
www.debenhams.com 123
The following table shows the Group’s financial assets and liabilities that are measured at fair value:
Level 1
£m Level 2
£m Total
£m
At 2 September 2017 Assets Available-for-sale financial investments 1.2 – 1.2 Derivative financial instruments:
Forward foreign currency contracts held as cash flow hedges – 5.2 5.2 Other forward foreign currency contracts – 0.1 0.1
Total assets 1.2 5.3 6.5
Liabilities Derivative financial instruments:
Forward foreign currency contracts held as cash flow hedges – (17.3) (17.3)
Total liabilities – (17.3) (17.3)
Level 1
£m Level 2
£m Total
£m
At 3 September 2016 Assets Available-for-sale financial investments 1.3 – 1.3 Derivative financial instruments:
Forward foreign currency contracts held as cash flow hedges – 48.5 48.5 Other forward foreign currency contracts – 1.3 1.3
Total assets 1.3 49.8 51.1
Liabilities Derivative financial instruments:
Interest rate swaps held as cash flow hedges – (0.2) (0.2) Forward foreign currency contracts held as cash flow hedges – (10.6) (10.6) Other forward foreign currency contracts – (0.5) (0.5)
Total liabilities – (11.3) (11.3)
The Group’s policy is to recognise transfers into and out of fair value hierarchy levels as at the date of the event or change in circumstances that caused the transfer. There has been no transfer of assets or liabilities between levels of the fair value hierarchy during the year.
www.debenhams.com 123
Financial Statem
ents
Financial Statements
24 RETIREMENT BENEFIT SCHEMES Defined contribution pension schemes
Defined benefit pension schemes
Notes to the financial statements For the financial year ended 2 September 2017 continued
124 Debenhams plc Annual Report & Accounts 2017
The Group operates defined contribution pension schemes for its employees. Group contributions to defined contribution pension schemes during the financial year were £16.0 million (2016: £15.5 million).
The Group also operates defined benefit type pension schemes, being the Debenhams Executive Pension Plan (“DEPP”) and the Debenhams Retirement Scheme (“DRS”) (together “the Group’s pension schemes”), the assets of which are held in separate trustee-administered funds. The Group’s pension schemes were closed to future service accrual from 31 October 2006. The closure to future accrual will not affect the pensions of those who have retired or the deferred benefits of those who have left service or opted out before 31 October 2006.
The Group’s pension schemes are established under trust law and each has a corporate trustee that is required to run the scheme in accordance with the scheme’s Trust Deed and Rules and to comply with the Pensions Act 2004 and all relevant legislation. Responsibility for governance of the schemes lies with the trustee of each scheme. Each corporate trustee is a company whose directors comprise of representatives:
Appointed by the Group Nominated by scheme members
The chair of both corporate trustees is independent from the schemes and from the Group.
At 2 September 2017, the most recent completed actuarial valuation of the Company’s pension schemes was carried out at 31 March 2014 and has been used by KPMG LLP, a qualified independent actuary, when calculating the IAS 19 “Employee benefits” revised valuation at 2 September 2017.
On 6 October 2017, the actuarial valuation of the Group’s pension schemes at 31 March 2017 was completed, concluding that DEPP was fully funded on a technical provisions basis and on a technical provisions basis DRS had improved since the previous actuarial valuation, but remained in deficit. Therefore the Group agreed a recovery plan for DRS which was intended to restore the scheme to a fully funded position on an ongoing basis. Under that agreement, the Group agreed to contribute £5.0 million per annum to the pension schemes for the period from 1 September 2017 to 31 March 2022. The agreement replaced an agreement made in 2015 under which the Group agreed to contribute £9.5 million per annum to the pension schemes for the period from 1 April 2014 to 31 March 2022 increasing by the percentage increase in RPI over the year to the previous December. Additionally during October 2017, the Group agreed to continue to cover the non-investment expenses and levies of the pension schemes, including those payable to the Pension Protection Fund.
Employees make no further contributions to the schemes. By funding its defined benefit pension schemes, the Group is exposed to the risk that the cost of meeting its obligations is higher than anticipated. This could occur for several reasons, for example:
Investment returns on the schemes’ assets may be lower than anticipated, especially if falls in asset values are not matched by similar falls in the value of the schemes’ liabilities
The level of price inflation may be higher than that assumed, resulting in higher payments from the schemes Scheme members may live longer than assumed Legislative changes could lead to an increase in the liabilities of the pension schemes
Investment of the schemes’ assets is managed by Hewitt Risk Management Services Limited under a delegated consulting service agreement. As at 2 September 2017, most of the schemes’ assets were invested in a hedging component or a growth component.
The weighted average duration of the defined benefit obligation is 22 years (2016: 22 years).
The contributions expected to be paid during the financial year ending 1 September 2018 amount to £6.4 million.
Debenhams plc Annual Report & Accounts 2017124
24 RETIREMENT BENEFIT SCHEMES Defined contribution pension schemes
Defined benefit pension schemes
Notes to the financial statements For the financial year ended 2 September 2017 continued
124 Debenhams plc Annual Report & Accounts 2017
The Group operates defined contribution pension schemes for its employees. Group contributions to defined contribution pension schemes during the financial year were £16.0 million (2016: £15.5 million).
The Group also operates defined benefit type pension schemes, being the Debenhams Executive Pension Plan (“DEPP”) and the Debenhams Retirement Scheme (“DRS”) (together “the Group’s pension schemes”), the assets of which are held in separate trustee-administered funds. The Group’s pension schemes were closed to future service accrual from 31 October 2006. The closure to future accrual will not affect the pensions of those who have retired or the deferred benefits of those who have left service or opted out before 31 October 2006.
The Group’s pension schemes are established under trust law and each has a corporate trustee that is required to run the scheme in accordance with the scheme’s Trust Deed and Rules and to comply with the Pensions Act 2004 and all relevant legislation. Responsibility for governance of the schemes lies with the trustee of each scheme. Each corporate trustee is a company whose directors comprise of representatives:
Appointed by the Group Nominated by scheme members
The chair of both corporate trustees is independent from the schemes and from the Group.
At 2 September 2017, the most recent completed actuarial valuation of the Company’s pension schemes was carried out at 31 March 2014 and has been used by KPMG LLP, a qualified independent actuary, when calculating the IAS 19 “Employee benefits” revised valuation at 2 September 2017.
On 6 October 2017, the actuarial valuation of the Group’s pension schemes at 31 March 2017 was completed, concluding that DEPP was fully funded on a technical provisions basis and on a technical provisions basis DRS had improved since the previous actuarial valuation, but remained in deficit. Therefore the Group agreed a recovery plan for DRS which was intended to restore the scheme to a fully funded position on an ongoing basis. Under that agreement, the Group agreed to contribute £5.0 million per annum to the pension schemes for the period from 1 September 2017 to 31 March 2022. The agreement replaced an agreement made in 2015 under which the Group agreed to contribute £9.5 million per annum to the pension schemes for the period from 1 April 2014 to 31 March 2022 increasing by the percentage increase in RPI over the year to the previous December. Additionally during October 2017, the Group agreed to continue to cover the non-investment expenses and levies of the pension schemes, including those payable to the Pension Protection Fund.
Employees make no further contributions to the schemes. By funding its defined benefit pension schemes, the Group is exposed to the risk that the cost of meeting its obligations is higher than anticipated. This could occur for several reasons, for example:
Investment returns on the schemes’ assets may be lower than anticipated, especially if falls in asset values are not matched by similar falls in the value of the schemes’ liabilities
The level of price inflation may be higher than that assumed, resulting in higher payments from the schemes Scheme members may live longer than assumed Legislative changes could lead to an increase in the liabilities of the pension schemes
Investment of the schemes’ assets is managed by Hewitt Risk Management Services Limited under a delegated consulting service agreement. As at 2 September 2017, most of the schemes’ assets were invested in a hedging component or a growth component.
The weighted average duration of the defined benefit obligation is 22 years (2016: 22 years).
The contributions expected to be paid during the financial year ending 1 September 2018 amount to £6.4 million.
www.debenhams.com 125
The major assumptions used by the actuary were:
2 September 2017 per annum
%
3 September 2016 per annum
%
Inflation assumption 3.2 2.9 General salary and wage increase 3.2 2.9 Rate of increase in pension payments and deferred payments 3.2 2.9 Pension increase rate 3.1 2.8 Discount rate 2.4 2.1
The inflation assumption is based on the RPI rate because pension increases, both in payment and deferment within the schemes, are set out with reference to this measure.
At the financial year end, the schemes’ assets were:
2 September 2017 3 September 2016
Quoted
£m Unquoted
£m Total
£m Quoted
£m Unquoted
£m Total
£m
Assets Hedging component 188.5 – 188.5 215.5 – 215.5 Growth component 671.3 237.8 909.1 614.2 190.0 804.2 Cash and other assets 25.8 – 25.8 37.9 – 37.9
Total market value of assets 885.6 237.8 1,123.4 867.6 190.0 1,057.6 Present value of scheme liabilities (1,042.5) (1,061.7)
Net surplus/(deficit) in schemes 80.9 (4.1)
Analysed as: DEPP scheme surplus 22.3 6.4 DRS scheme surplus/(deficit) 58.6 (10.5)
At 2 September 2017, 78.8% (2016: 82.0%) of investments were quoted on a recognised stock exchange or held in cash or assets readily convertible to cash and are therefore considered to be liquid.
The Trust Deeds and Rules provide the Group with an unconditional right to a refund of surplus assets assuming the full settlement of plan liabilities in the event of a plan wind up. Furthermore, in the ordinary course of business the Trustees have no right to unilaterally wind up, or otherwise augment the benefits due to members of the schemes. Based on these rights any net surplus in the schemes is recognised in full.
The current life expectancies of a pensioner retiring aged 65 underlying the mortality tables for each of the schemes above are:
2 September 2017 3 September 2016
Years Male
Years Female
Years Male
Years Female
Debenhams Retirement Scheme Member currently aged 65 22.2 24.5 22.1 24.4 Member aged 65 in 15 years 23.6 25.9 23.5 25.8
2 September 2017 3 September 2016
Years Male
Years Female
Years Male
Years Female
Debenhams Executive Pension Plan Member currently aged 65 24.2 26.4 24.1 26.3 Member aged 65 in 15 years 25.6 27.8 25.5 27.7
www.debenhams.com 125
Financial Statem
ents
Financial Statements
24 RETIREMENT BENEFIT SCHEMES CONTINUED
Notes to the financial statements For the financial year ended 2 September 2017 continued
126 Debenhams plc Annual Report & Accounts 2017
Changes in the present value of the defined benefit obligations are:
2 September 2017
£m
3 September 2016
£m
Present value of obligations at start of the financial year 1,061.7 769.6 Current service cost (including expenses) 1.5 1.5 Interest cost on the defined benefit liability 21.4 28.7 Benefit payments from plan assets (40.2) (30.6) Remeasurements:
(Gains)/losses from changes in financial assumptions (0.8) 312.4 Experience gains (1.1) (19.9)
Present value of obligations at end of the financial year 1,042.5 1,061.7
Changes in the fair value of plan assets are:
2 September 2017
£m
3 September 2016
£m
Fair value of pension scheme assets at start of the financial year 1,057.6 795.8 Interest income on plan assets 21.4 29.8 Benefit payments from plan assets (40.2) (30.6) Company contributions 9.8 11.2 Remeasurements:
Return on plan assets, excluding amounts included in finance costs 74.8 251.4
Fair value of pension scheme assets at end of the financial year 1,123.4 1,057.6
Movement in the net surplus/(deficit) during the financial year is:
2 September 2017
£m
3 September 2016
£m
Net (deficit)/surplus in the schemes at start of the financial year (4.1) 26.2 Movement in the financial year:
Company contributions 9.8 11.2 Current service cost (including expenses) (1.5) (1.5) Net interest on net defined benefit asset/liability – 1.1 Remeasurements of pension schemes 76.7 (41.1)
Net surplus/(deficit) in the schemes at end of the financial year 80.9 (4.1)
Debenhams plc Annual Report & Accounts 2017126
24 RETIREMENT BENEFIT SCHEMES CONTINUED
Notes to the financial statements For the financial year ended 2 September 2017 continued
126 Debenhams plc Annual Report & Accounts 2017
Changes in the present value of the defined benefit obligations are:
2 September 2017
£m
3 September 2016
£m
Present value of obligations at start of the financial year 1,061.7 769.6 Current service cost (including expenses) 1.5 1.5 Interest cost on the defined benefit liability 21.4 28.7 Benefit payments from plan assets (40.2) (30.6) Remeasurements:
(Gains)/losses from changes in financial assumptions (0.8) 312.4 Experience gains (1.1) (19.9)
Present value of obligations at end of the financial year 1,042.5 1,061.7
Changes in the fair value of plan assets are:
2 September 2017
£m
3 September 2016
£m
Fair value of pension scheme assets at start of the financial year 1,057.6 795.8 Interest income on plan assets 21.4 29.8 Benefit payments from plan assets (40.2) (30.6) Company contributions 9.8 11.2 Remeasurements:
Return on plan assets, excluding amounts included in finance costs 74.8 251.4
Fair value of pension scheme assets at end of the financial year 1,123.4 1,057.6
Movement in the net surplus/(deficit) during the financial year is:
2 September 2017
£m
3 September 2016
£m
Net (deficit)/surplus in the schemes at start of the financial year (4.1) 26.2 Movement in the financial year:
Company contributions 9.8 11.2 Current service cost (including expenses) (1.5) (1.5) Net interest on net defined benefit asset/liability – 1.1 Remeasurements of pension schemes 76.7 (41.1)
Net surplus/(deficit) in the schemes at end of the financial year 80.9 (4.1)
25 DEFERRED TAX ASSETS AND LIABILITIES
www.debenhams.com 127
The table below illustrates the estimated impact on the schemes’ liabilities as a result of movements in the principal assumptions used to measure those liabilities.
2 September 2017
£m
3 September 2016
£m
Increase in schemes’ liabilities arising from a 0.5% increase in inflation 113.2 117.8 Increase in schemes’ liabilities arising from a 0.5% reduction in the discount rate 123.3 128.4 Increase in schemes’ liabilities arising from a one year increase in life expectancy 27.3 28.4
A 0.5% reduction in the inflation assumption, a 0.5% increase in the discount rate assumption and a one year reduction in the life expectancy assumption would result in an equal and opposite change in the schemes’ liabilities. The above sensitivities relate purely to liabilities. Inflation and discount rate movements may be mitigated by a similar offsetting movement in the schemes’ assets.
The above sensitivity analyses are based on a change in an assumption while holding all other assumptions constant. In practice, this is unlikely to occur, and changes in some of the assumptions may be accumulated. When calculating the sensitivity of the schemes’ liabilities to significant actuarial assumptions, the same method has been applied as when calculating the retirement benefit obligations/surplus recognised within the balance sheet.
Deferred tax is calculated in full on temporary differences under the liability method using a tax rate of 19.0% for the UK differences (2016: 20.0%). Local tax rates have been used for overseas differences.
2 September 2017
£m
3 September 2016
£m
Non-current Deferred tax assets 15.3 20.1 Deferred tax liabilities (54.0) (50.5)
(38.7) (30.4)
Deferred tax expected to be reversed within 12 months of the balance sheet date:
2 September 2017
£m
3 September 2016
£m
Deferred tax assets 4.4 5.3 Deferred tax liabilities (6.0) (17.1)
(1.6) (11.8)
Deferred tax assets have been recognised in respect of temporary differences giving rise to deferred tax assets because it is probable that these assets will be recovered.
www.debenhams.com 127
Financial Statem
ents
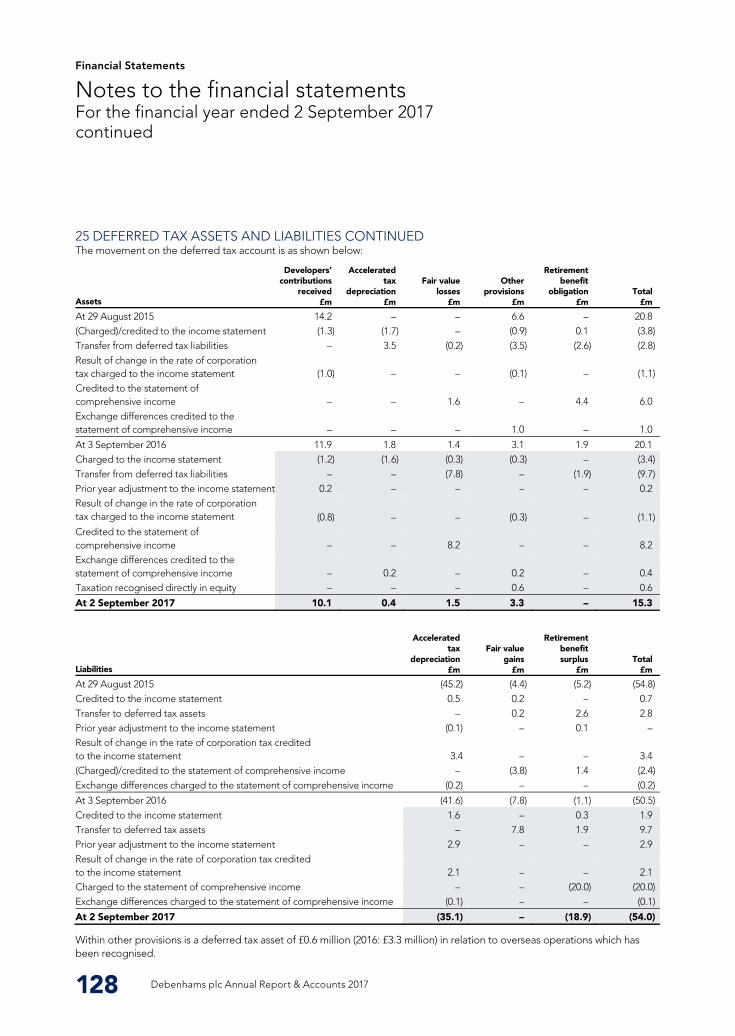
Financial Statements
25 DEFERRED TAX ASSETS AND LIABILITIES CONTINUED
Notes to the financial statements For the financial year ended 2 September 2017 continued
128 Debenhams plc Annual Report & Accounts 2017
The movement on the deferred tax account is as shown below:
Assets
Developers’ contributions
received £m
Accelerated tax
depreciation £m
Fair value losses
£m
Other provisions
£m
Retirement benefit
obligation £m
Total £m
At 29 August 2015 14.2 – – 6.6 – 20.8 (Charged)/credited to the income statement (1.3) (1.7) – (0.9) 0.1 (3.8) Transfer from deferred tax liabilities – 3.5 (0.2) (3.5) (2.6) (2.8) Result of change in the rate of corporation tax charged to the income statement (1.0) – – (0.1) – (1.1) Credited to the statement of comprehensive income – – 1.6 – 4.4 6.0 Exchange differences credited to the statement of comprehensive income – – – 1.0 – 1.0
At 3 September 2016 11.9 1.8 1.4 3.1 1.9 20.1 Charged to the income statement (1.2) (1.6) (0.3) (0.3) – (3.4) Transfer from deferred tax liabilities – – (7.8) – (1.9) (9.7) Prior year adjustment to the income statement 0.2 – – – – 0.2 Result of change in the rate of corporation tax charged to the income statement (0.8) – – (0.3) –
(1.1)
Credited to the statement of comprehensive income – – 8.2 – – 8.2 Exchange differences credited to the statement of comprehensive income – 0.2 – 0.2 – 0.4 Taxation recognised directly in equity – – – 0.6 – 0.6
At 2 September 2017 10.1 0.4 1.5 3.3 – 15.3
Liabilities
Accelerated tax
depreciation £m
Fair value gains
£m
Retirement benefit surplus
£m Total
£m
At 29 August 2015 (45.2) (4.4) (5.2) (54.8) Credited to the income statement 0.5 0.2 – 0.7 Transfer to deferred tax assets – 0.2 2.6 2.8 Prior year adjustment to the income statement (0.1) – 0.1 – Result of change in the rate of corporation tax credited to the income statement 3.4 – – 3.4 (Charged)/credited to the statement of comprehensive income – (3.8) 1.4 (2.4) Exchange differences charged to the statement of comprehensive income (0.2) – – (0.2)
At 3 September 2016 (41.6) (7.8) (1.1) (50.5) Credited to the income statement 1.6 – 0.3 1.9 Transfer to deferred tax assets – 7.8 1.9 9.7 Prior year adjustment to the income statement 2.9 – – 2.9 Result of change in the rate of corporation tax credited to the income statement 2.1 – – 2.1 Charged to the statement of comprehensive income – – (20.0) (20.0) Exchange differences charged to the statement of comprehensive income (0.1) – – (0.1)
At 2 September 2017 (35.1) – (18.9) (54.0)
Within other provisions is a deferred tax asset of £0.6 million (2016: £3.3 million) in relation to overseas operations which has been recognised.
Debenhams plc Annual Report & Accounts 2017128
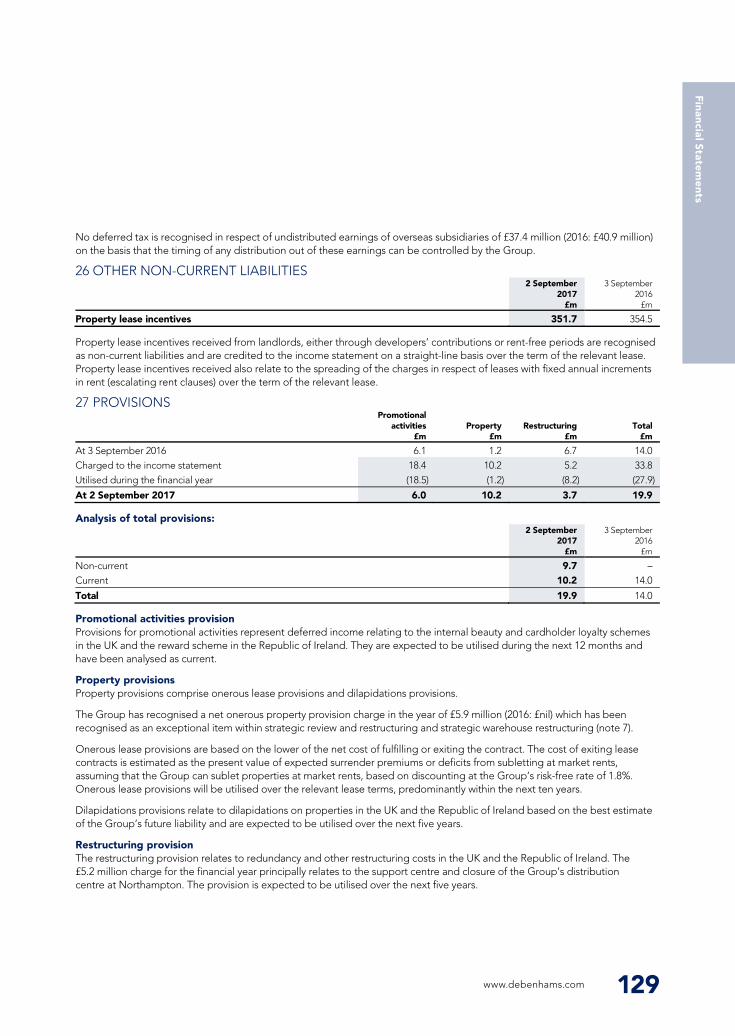
25 DEFERRED TAX ASSETS AND LIABILITIES CONTINUED
Notes to the financial statements For the financial year ended 2 September 2017 continued
128 Debenhams plc Annual Report & Accounts 2017
The movement on the deferred tax account is as shown below:
Assets
Developers’ contributions
received £m
Accelerated tax
depreciation £m
Fair value losses
£m
Other provisions
£m
Retirement benefit
obligation £m
Total £m
At 29 August 2015 14.2 – – 6.6 – 20.8 (Charged)/credited to the income statement (1.3) (1.7) – (0.9) 0.1 (3.8) Transfer from deferred tax liabilities – 3.5 (0.2) (3.5) (2.6) (2.8) Result of change in the rate of corporation tax charged to the income statement (1.0) – – (0.1) – (1.1) Credited to the statement of comprehensive income – – 1.6 – 4.4 6.0 Exchange differences credited to the statement of comprehensive income – – – 1.0 – 1.0
At 3 September 2016 11.9 1.8 1.4 3.1 1.9 20.1 Charged to the income statement (1.2) (1.6) (0.3) (0.3) – (3.4) Transfer from deferred tax liabilities – – (7.8) – (1.9) (9.7) Prior year adjustment to the income statement 0.2 – – – – 0.2 Result of change in the rate of corporation tax charged to the income statement (0.8) – – (0.3) –
(1.1)
Credited to the statement of comprehensive income – – 8.2 – – 8.2 Exchange differences credited to the statement of comprehensive income – 0.2 – 0.2 – 0.4 Taxation recognised directly in equity – – – 0.6 – 0.6
At 2 September 2017 10.1 0.4 1.5 3.3 – 15.3
Liabilities
Accelerated tax
depreciation £m
Fair value gains
£m
Retirement benefit surplus
£m Total
£m
At 29 August 2015 (45.2) (4.4) (5.2) (54.8) Credited to the income statement 0.5 0.2 – 0.7 Transfer to deferred tax assets – 0.2 2.6 2.8 Prior year adjustment to the income statement (0.1) – 0.1 – Result of change in the rate of corporation tax credited to the income statement 3.4 – – 3.4 (Charged)/credited to the statement of comprehensive income – (3.8) 1.4 (2.4) Exchange differences charged to the statement of comprehensive income (0.2) – – (0.2)
At 3 September 2016 (41.6) (7.8) (1.1) (50.5) Credited to the income statement 1.6 – 0.3 1.9 Transfer to deferred tax assets – 7.8 1.9 9.7 Prior year adjustment to the income statement 2.9 – – 2.9 Result of change in the rate of corporation tax credited to the income statement 2.1 – – 2.1 Charged to the statement of comprehensive income – – (20.0) (20.0) Exchange differences charged to the statement of comprehensive income (0.1) – – (0.1)
At 2 September 2017 (35.1) – (18.9) (54.0)
Within other provisions is a deferred tax asset of £0.6 million (2016: £3.3 million) in relation to overseas operations which has been recognised.
26 OTHER NON-CURRENT LIABILITIES
27 PROVISIONS
Analysis of total provisions:
Promotional activities provision
Property provisions
Restructuring provision
www.debenhams.com 129
No deferred tax is recognised in respect of undistributed earnings of overseas subsidiaries of £37.4 million (2016: £40.9 million) on the basis that the timing of any distribution out of these earnings can be controlled by the Group.
2 September 2017
£m
3 September 2016
£m
Property lease incentives 351.7 354.5
Property lease incentives received from landlords, either through developers’ contributions or rent-free periods are recognised as non-current liabilities and are credited to the income statement on a straight-line basis over the term of the relevant lease. Property lease incentives received also relate to the spreading of the charges in respect of leases with fixed annual increments in rent (escalating rent clauses) over the term of the relevant lease.
Promotional activities
£m Property
£m Restructuring
£m Total
£m
At 3 September 2016 6.1 1.2 6.7 14.0 Charged to the income statement 18.4 10.2 5.2 33.8 Utilised during the financial year (18.5) (1.2) (8.2) (27.9)
At 2 September 2017 6.0 10.2 3.7 19.9
2 September 2017
£m
3 September 2016
£m
Non-current 9.7 – Current 10.2 14.0
Total 19.9 14.0
Provisions for promotional activities represent deferred income relating to the internal beauty and cardholder loyalty schemes in the UK and the reward scheme in the Republic of Ireland. They are expected to be utilised during the next 12 months and have been analysed as current.
Property provisions comprise onerous lease provisions and dilapidations provisions.
The Group has recognised a net onerous property provision charge in the year of £5.9 million (2016: £nil) which has been recognised as an exceptional item within strategic review and restructuring and strategic warehouse restructuring (note 7).
Onerous lease provisions are based on the lower of the net cost of fulfilling or exiting the contract. The cost of exiting lease contracts is estimated as the present value of expected surrender premiums or deficits from subletting at market rents, assuming that the Group can sublet properties at market rents, based on discounting at the Group’s risk-free rate of 1.8%. Onerous lease provisions will be utilised over the relevant lease terms, predominantly within the next ten years.
Dilapidations provisions relate to dilapidations on properties in the UK and the Republic of Ireland based on the best estimate of the Group’s future liability and are expected to be utilised over the next five years.
The restructuring provision relates to redundancy and other restructuring costs in the UK and the Republic of Ireland. The £5.2 million charge for the financial year principally relates to the support centre and closure of the Group’s distribution centre at Northampton. The provision is expected to be utilised over the next five years.
www.debenhams.com 129
Financial Statem
ents
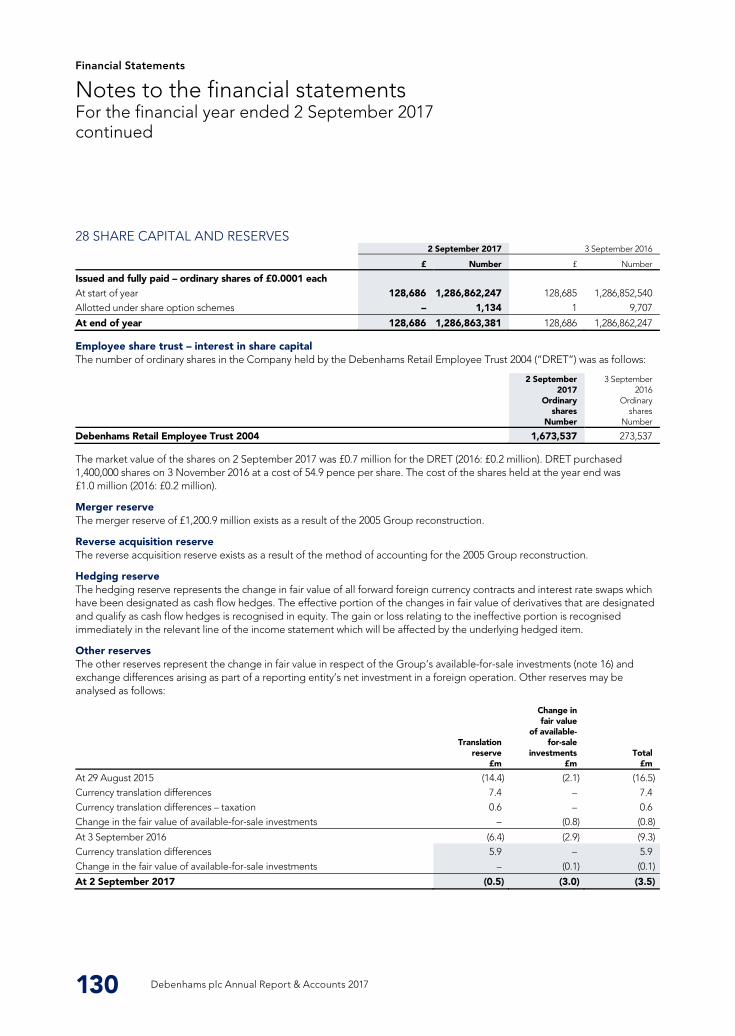
Financial Statements
28 SHARE CAPITAL AND RESERVES
Employee share trust – interest in share capital
Merger reserve
Reverse acquisition reserve
Hedging reserve
Other reserves
Notes to the financial statements For the financial year ended 2 September 2017 continued
130 Debenhams plc Annual Report & Accounts 2017
2 September 2017 3 September 2016
£ Number £ Number
Issued and fully paid – ordinary shares of £0.0001 each At start of year 128,686 1,286,862,247 128,685 1,286,852,540 Allotted under share option schemes – 1,134 1 9,707
At end of year 128,686 1,286,863,381 128,686 1,286,862,247
The number of ordinary shares in the Company held by the Debenhams Retail Employee Trust 2004 (“DRET”) was as follows:
2 September 2017
Ordinary shares
Number
3 September 2016
Ordinary shares
Number
Debenhams Retail Employee Trust 2004 1,673,537 273,537
The market value of the shares on 2 September 2017 was £0.7 million for the DRET (2016: £0.2 million). DRET purchased 1,400,000 shares on 3 November 2016 at a cost of 54.9 pence per share. The cost of the shares held at the year end was £1.0 million (2016: £0.2 million).
The merger reserve of £1,200.9 million exists as a result of the 2005 Group reconstruction.
The reverse acquisition reserve exists as a result of the method of accounting for the 2005 Group reconstruction.
The hedging reserve represents the change in fair value of all forward foreign currency contracts and interest rate swaps which have been designated as cash flow hedges. The effective portion of the changes in fair value of derivatives that are designated and qualify as cash flow hedges is recognised in equity. The gain or loss relating to the ineffective portion is recognised immediately in the relevant line of the income statement which will be affected by the underlying hedged item.
The other reserves represent the change in fair value in respect of the Group’s available-for-sale investments (note 16) and exchange differences arising as part of a reporting entity’s net investment in a foreign operation. Other reserves may be analysed as follows:
Translation reserve
£m
Change in fair value
of available- for-sale
investments £m
Total £m
At 29 August 2015 (14.4) (2.1) (16.5) Currency translation differences 7.4 – 7.4 Currency translation differences – taxation 0.6 – 0.6 Change in the fair value of available-for-sale investments – (0.8) (0.8)
At 3 September 2016 (6.4) (2.9) (9.3) Currency translation differences 5.9 – 5.9 Change in the fair value of available-for-sale investments – (0.1) (0.1)
At 2 September 2017 (0.5) (3.0) (3.5)
Debenhams plc Annual Report & Accounts 2017130
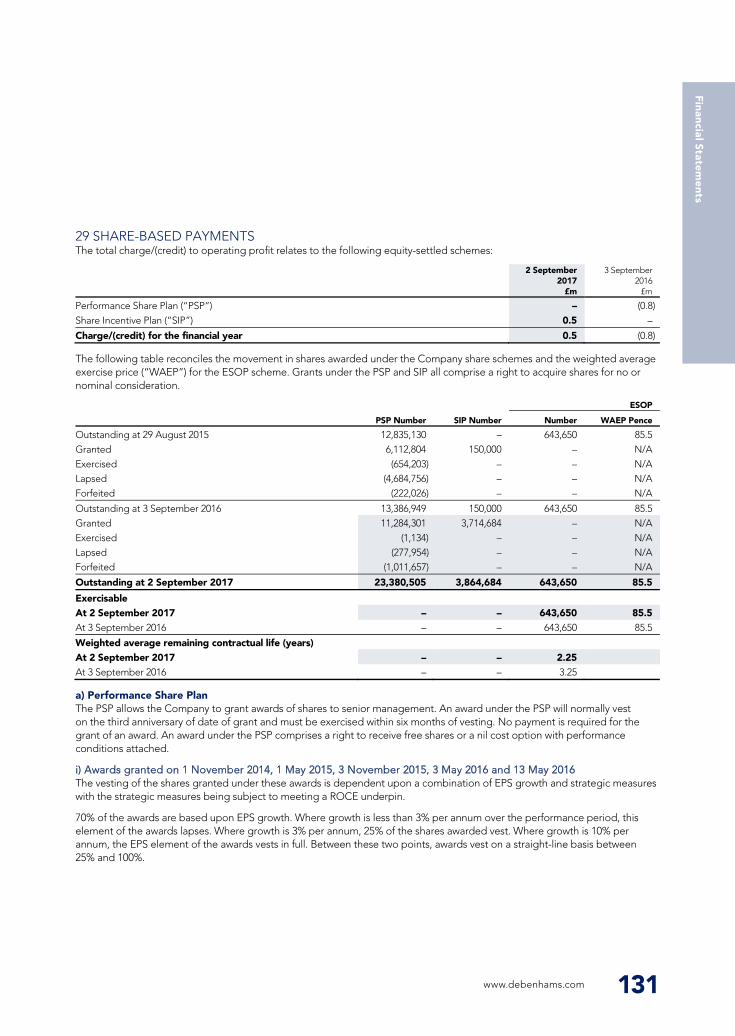
28 SHARE CAPITAL AND RESERVES
Employee share trust – interest in share capital
Merger reserve
Reverse acquisition reserve
Hedging reserve
Other reserves
Notes to the financial statements For the financial year ended 2 September 2017 continued
130 Debenhams plc Annual Report & Accounts 2017
2 September 2017 3 September 2016
£ Number £ Number
Issued and fully paid – ordinary shares of £0.0001 each At start of year 128,686 1,286,862,247 128,685 1,286,852,540 Allotted under share option schemes – 1,134 1 9,707
At end of year 128,686 1,286,863,381 128,686 1,286,862,247
The number of ordinary shares in the Company held by the Debenhams Retail Employee Trust 2004 (“DRET”) was as follows:
2 September 2017
Ordinary shares
Number
3 September 2016
Ordinary shares
Number
Debenhams Retail Employee Trust 2004 1,673,537 273,537
The market value of the shares on 2 September 2017 was £0.7 million for the DRET (2016: £0.2 million). DRET purchased 1,400,000 shares on 3 November 2016 at a cost of 54.9 pence per share. The cost of the shares held at the year end was £1.0 million (2016: £0.2 million).
The merger reserve of £1,200.9 million exists as a result of the 2005 Group reconstruction.
The reverse acquisition reserve exists as a result of the method of accounting for the 2005 Group reconstruction.
The hedging reserve represents the change in fair value of all forward foreign currency contracts and interest rate swaps which have been designated as cash flow hedges. The effective portion of the changes in fair value of derivatives that are designated and qualify as cash flow hedges is recognised in equity. The gain or loss relating to the ineffective portion is recognised immediately in the relevant line of the income statement which will be affected by the underlying hedged item.
The other reserves represent the change in fair value in respect of the Group’s available-for-sale investments (note 16) and exchange differences arising as part of a reporting entity’s net investment in a foreign operation. Other reserves may be analysed as follows:
Translation reserve
£m
Change in fair value
of available- for-sale
investments £m
Total £m
At 29 August 2015 (14.4) (2.1) (16.5) Currency translation differences 7.4 – 7.4 Currency translation differences – taxation 0.6 – 0.6 Change in the fair value of available-for-sale investments – (0.8) (0.8)
At 3 September 2016 (6.4) (2.9) (9.3) Currency translation differences 5.9 – 5.9 Change in the fair value of available-for-sale investments – (0.1) (0.1)
At 2 September 2017 (0.5) (3.0) (3.5)
29 SHARE-BASED PAYMENTS
a) Performance Share Plan
i) Awards granted on 1 November 2014, 1 May 2015, 3 November 2015, 3 May 2016 and 13 May 2016
www.debenhams.com 131
The total charge/(credit) to operating profit relates to the following equity-settled schemes:
2 September 2017
£m
3 September 2016
£m
Performance Share Plan (“PSP”) – (0.8) Share Incentive Plan (“SIP”) 0.5 –
Charge/(credit) for the financial year 0.5 (0.8)
The following table reconciles the movement in shares awarded under the Company share schemes and the weighted average exercise price (“WAEP”) for the ESOP scheme. Grants under the PSP and SIP all comprise a right to acquire shares for no or nominal consideration.
ESOP
PSP Number SIP Number Number WAEP Pence
Outstanding at 29 August 2015 12,835,130 – 643,650 85.5 Granted 6,112,804 150,000 – N/A Exercised (654,203) – – N/A Lapsed (4,684,756) – – N/A Forfeited (222,026) – – N/A
Outstanding at 3 September 2016 13,386,949 150,000 643,650 85.5 Granted 11,284,301 3,714,684 – N/A Exercised (1,134) – – N/A Lapsed (277,954) – – N/A Forfeited (1,011,657) – – N/A
Outstanding at 2 September 2017 23,380,505 3,864,684 643,650 85.5
Exercisable At 2 September 2017 – – 643,650 85.5 At 3 September 2016 – – 643,650 85.5
Weighted average remaining contractual life (years) At 2 September 2017 – – 2.25 At 3 September 2016 – – 3.25
The PSP allows the Company to grant awards of shares to senior management. An award under the PSP will normally vest on the third anniversary of date of grant and must be exercised within six months of vesting. No payment is required for the grant of an award. An award under the PSP comprises a right to receive free shares or a nil cost option with performance conditions attached.
The vesting of the shares granted under these awards is dependent upon a combination of EPS growth and strategic measures with the strategic measures being subject to meeting a ROCE underpin.
70% of the awards are based upon EPS growth. Where growth is less than 3% per annum over the performance period, this element of the awards lapses. Where growth is 3% per annum, 25% of the shares awarded vest. Where growth is 10% per annum, the EPS element of the awards vests in full. Between these two points, awards vest on a straight-line basis between 25% and 100%.
www.debenhams.com 131
Financial Statem
ents
Financial Statements
29 SHARE-BASED PAYMENTS CONTINUED a) Performance Share Plan continued i) Awards granted on 1 November 2014, 1 May 2015, 3 November 2015, 3 May 2016 and 13 May 2016 continued
ii) Awards granted on 31 May 2017
Notes to the financial statements For the financial year ended 2 September 2017 continued
132 Debenhams plc Annual Report & Accounts 2017
The remaining 30% of the awards are dependent upon the performance of the four strategic measures (each with a maximum vesting of 7.5%). The strategic measures are: Group gross margin improvement, online EBITDA growth rate, UK gross transaction value growth and International EBITDA growth rate. Each strategic measure is subject to a single performance test at the end of the performance period which will result in either vesting at 0% or in full (7.5%) of the award. If the Group’s ROCE at the end of the applicable performance period is not greater than ROCE at the start of the applicable performance period, the 30% of the awards subject to the strategic measures will not vest.
At 2 September 2017, the awards granted on 1 November 2014 and 1 May 2015 had not met their performance conditions and the awards will therefore lapse in full on 1 November 2017 and 1 May 2018 respectively.
The vesting of the shares granted under these awards is dependent upon a combination of EPS targets and strategic performance measures with strategic performance measures being subject to meeting a ROCE underpin.
70% of the awards are based upon the EPS value for the financial year ending 31 August 2019. Where the EPS value is 5.6 pence, 25% of the shares awarded vest. Where the EPS value is 6.0 pence, 50% of the shares awarded vest. Where the EPS value is 8.0 pence, the award vests in full. Between these values the awards vest on a straight-line basis.
The remaining 30% of the awards are dependent upon beauty gross transaction value growth, food gross transaction value growth, mobile gross transaction value growth and online cost per unit improvement. Each strategic measure is subject to a performance test at the end of the performance period which will result in vesting on a straight-line basis between the entry point, the target point and the maximum point. If the Group’s ROCE at the end of the applicable performance period is not greater than a target percentage, 30% of the awards subject to the strategic measures will not vest.
In accordance with IFRS 2 “Share-based payments”, the vesting conditions attached to the PSP are classified as non-market conditions and therefore the shares have been fair valued at face value with a discount to take into account the non-entitlement to dividends in the vesting period where relevant. The fair value of these PSP awards is calculated based on the Black-Scholes model assuming the inputs in the table below:
Grant date 31 May 2017
Number of shares under award 11,284,301 Expected term (years) 3.0 Share price at grant (pence) 50.1 Exercise price (pence) – Risk-free rate 0.0% Expected volatility 100.0% Expected dividend yield 6.8% Fair value of award (pence) 40.9
Volatility is a measure of the amount by which the Company’s share price is expected to fluctuate in the period. Where volatility has been used in the calculation of the fair value of the award, it has been estimated by using the most recent historical share price volatility which is commensurate with the expected term of the option taking into account its contractual life.
Debenhams plc Annual Report & Accounts 2017132
29 SHARE-BASED PAYMENTS CONTINUED a) Performance Share Plan continued i) Awards granted on 1 November 2014, 1 May 2015, 3 November 2015, 3 May 2016 and 13 May 2016 continued
ii) Awards granted on 31 May 2017
Notes to the financial statements For the financial year ended 2 September 2017 continued
132 Debenhams plc Annual Report & Accounts 2017
The remaining 30% of the awards are dependent upon the performance of the four strategic measures (each with a maximum vesting of 7.5%). The strategic measures are: Group gross margin improvement, online EBITDA growth rate, UK gross transaction value growth and International EBITDA growth rate. Each strategic measure is subject to a single performance test at the end of the performance period which will result in either vesting at 0% or in full (7.5%) of the award. If the Group’s ROCE at the end of the applicable performance period is not greater than ROCE at the start of the applicable performance period, the 30% of the awards subject to the strategic measures will not vest.
At 2 September 2017, the awards granted on 1 November 2014 and 1 May 2015 had not met their performance conditions and the awards will therefore lapse in full on 1 November 2017 and 1 May 2018 respectively.
The vesting of the shares granted under these awards is dependent upon a combination of EPS targets and strategic performance measures with strategic performance measures being subject to meeting a ROCE underpin.
70% of the awards are based upon the EPS value for the financial year ending 31 August 2019. Where the EPS value is 5.6 pence, 25% of the shares awarded vest. Where the EPS value is 6.0 pence, 50% of the shares awarded vest. Where the EPS value is 8.0 pence, the award vests in full. Between these values the awards vest on a straight-line basis.
The remaining 30% of the awards are dependent upon beauty gross transaction value growth, food gross transaction value growth, mobile gross transaction value growth and online cost per unit improvement. Each strategic measure is subject to a performance test at the end of the performance period which will result in vesting on a straight-line basis between the entry point, the target point and the maximum point. If the Group’s ROCE at the end of the applicable performance period is not greater than a target percentage, 30% of the awards subject to the strategic measures will not vest.
In accordance with IFRS 2 “Share-based payments”, the vesting conditions attached to the PSP are classified as non-market conditions and therefore the shares have been fair valued at face value with a discount to take into account the non-entitlement to dividends in the vesting period where relevant. The fair value of these PSP awards is calculated based on the Black-Scholes model assuming the inputs in the table below:
Grant date 31 May 2017
Number of shares under award 11,284,301 Expected term (years) 3.0 Share price at grant (pence) 50.1 Exercise price (pence) – Risk-free rate 0.0% Expected volatility 100.0% Expected dividend yield 6.8% Fair value of award (pence) 40.9
Volatility is a measure of the amount by which the Company’s share price is expected to fluctuate in the period. Where volatility has been used in the calculation of the fair value of the award, it has been estimated by using the most recent historical share price volatility which is commensurate with the expected term of the option taking into account its contractual life.
b) Share Incentive Plan
i) Options granted on 2 December 2015
ii) Options granted on 5 December 2016 and 2 May 2017
c) Executive Share Option Plan
www.debenhams.com 133
The SIP allows the Company to grant options to key senior managers below board level, whom the Company wishes to retain and incentivise in the short to medium term. Once the options have vested, the employee has six months in which to exercise them.
The options granted on 2 December 2015 over 150,000 shares have a 24-month vesting period based on the employee’s continued employment and performance targets specific to the employee’s role within the business and were granted with no exercise price.
Options granted on 5 December 2016 over 451,263 and 180,505 shares have 12- and 24-month vesting periods respectively based on the employee’s continued employment within the business and were granted with no exercise price.
Options granted on 2 May 2017 over 3,082,916 shares have a 30-month vesting period based on the employee’s continued employment within the business and were granted with no exercise price.
In accordance with IFRS 2 “Share-based payments”, the vesting conditions attached to the SIPs are classified as non-market conditions and therefore the shares have been fair valued at face value with a discount to take into account the non-entitlement to dividends in the vesting period where relevant. The fair value of the SIP awards is calculated based on the Black-Scholes model assuming the inputs in the table below:
Grant date 2 May
2017 5 December
2016 5 December
2016
Number of shares under award 3,082,916 451,263 180,505 Expected term (years) 2.5 1.0 2.0 Share price at grant (pence) 51.3 55.4 55.4 Exercise price (pence) – – – Risk-free rate 0.0% 0.0% 0.0% Expected volatility 0.0% 0.0% 0.0% Expected dividend yield 4.4% 6.1% 6.1% Fair value of award (pence) 46.8 49.0 49.0
Volatility is a measure of the amount by which the Company’s share price is expected to fluctuate in the period. Where volatility has been used in the calculation of the fair value of the award, it has been estimated by using the most recent historical share price volatility which is commensurate with the expected term of the option taking into account its contractual life.
The ESOP allowed the Company to grant options to acquire shares to eligible employees. These options would normally become exercisable following a three-year performance period, only if and to the extent that the performance conditions to which they were subject had been satisfied. Once the options had vested, the employees had a seven-year period in which to exercise. Options were granted with an exercise price equal to the middle market value of the shares on the day immediately preceding the date of grant. The options granted on 24 November 2009 became exercisable in full based on ROCE performance exceeding the cost of capital by 7.8% during the applicable performance period. There are no unvested options under this plan. The rules of this plan expired in 2016.
www.debenhams.com 133
Financial Statem
ents
Financial Statements
30 OPERATING LEASE COMMITMENTS
31 CASH GENERATED FROM OPERATIONS
Notes to the financial statements For the financial year ended 2 September 2017 continued
134 Debenhams plc Annual Report & Accounts 2017
2 September 2017 3 September 2016
Land and buildings
£m Other
£m
Land and buildings
£m Other
£m
The future aggregate minimum lease payments under non-cancellable operating leases are as follows: Within one year 223.9 1.3 216.9 1.5 Later than one year and not later than five years 905.8 1.3 868.0 1.5 Later than five years and not later than ten years 1,056.3 – 1,020.1 – Later than ten years and not later than 20 years 1,463.1 – 1,500.3 – Later than 20 years 896.1 – 974.4 –
4,545.2 2.6 4,579.7 3.0
The Group leases department stores, warehouses and offices under non-cancellable operating leases. The leases have various terms including escalating rent and contingent turnover rent clauses and renewal rights. The Group has pre-emption rights over a number of properties, which provides the Group with the right of first refusal to purchase the property in the event the landlord chooses to sell. The option price payable for the property in each instance is referenced to current market value prevailing at the point of pre-emption. The Group also leases vehicles and fixtures and equipment under non-cancellable operating leases.
2 September 2017
£m
3 September 2016
£m
Profit before taxation 59.0 105.8 Depreciation (note 15) 89.5 89.4 Amortisation (note 14) 20.0 19.2 Impairment of intangible assets (note 14) – 2.2 Impairment of property, plant and equipment (note 15) 7.2 – Loss on disposal and write off of intangible assets 4.6 – Loss on disposal and write off of property, plant and equipment 1.2 0.1 Share-based payment charge/(credit) (note 29) 0.5 (0.8) Fair value gains on derivative instruments 6.4 (7.0) Net movements in provisions (note 27) 5.9 7.6 Finance income (0.1) (1.4) Finance costs 12.4 14.2 Net movement in close out of forward foreign currency contracts (note 22) (1.6) 11.2 Pension current service cost 1.5 1.5 Cash contributions to pension schemes (note 24) (9.8) (11.2) Net movement in other long-term receivables (0.1) (0.1) Net movement in other non-current liabilities (2.8) 13.7 Changes in working capital Decrease in inventories 8.8 5.0 Increase in trade and other receivables (1.4) (1.9) Decrease in trade and other payables (0.8) (7.3)
Cash generated from operations 200.4 240.2
Debenhams plc Annual Report & Accounts 2017134
30 OPERATING LEASE COMMITMENTS
31 CASH GENERATED FROM OPERATIONS
Notes to the financial statements For the financial year ended 2 September 2017 continued
134 Debenhams plc Annual Report & Accounts 2017
2 September 2017 3 September 2016
Land and buildings
£m Other
£m
Land and buildings
£m Other
£m
The future aggregate minimum lease payments under non-cancellable operating leases are as follows: Within one year 223.9 1.3 216.9 1.5 Later than one year and not later than five years 905.8 1.3 868.0 1.5 Later than five years and not later than ten years 1,056.3 – 1,020.1 – Later than ten years and not later than 20 years 1,463.1 – 1,500.3 – Later than 20 years 896.1 – 974.4 –
4,545.2 2.6 4,579.7 3.0
The Group leases department stores, warehouses and offices under non-cancellable operating leases. The leases have various terms including escalating rent and contingent turnover rent clauses and renewal rights. The Group has pre-emption rights over a number of properties, which provides the Group with the right of first refusal to purchase the property in the event the landlord chooses to sell. The option price payable for the property in each instance is referenced to current market value prevailing at the point of pre-emption. The Group also leases vehicles and fixtures and equipment under non-cancellable operating leases.
2 September 2017
£m
3 September 2016
£m
Profit before taxation 59.0 105.8 Depreciation (note 15) 89.5 89.4 Amortisation (note 14) 20.0 19.2 Impairment of intangible assets (note 14) – 2.2 Impairment of property, plant and equipment (note 15) 7.2 – Loss on disposal and write off of intangible assets 4.6 – Loss on disposal and write off of property, plant and equipment 1.2 0.1 Share-based payment charge/(credit) (note 29) 0.5 (0.8) Fair value gains on derivative instruments 6.4 (7.0) Net movements in provisions (note 27) 5.9 7.6 Finance income (0.1) (1.4) Finance costs 12.4 14.2 Net movement in close out of forward foreign currency contracts (note 22) (1.6) 11.2 Pension current service cost 1.5 1.5 Cash contributions to pension schemes (note 24) (9.8) (11.2) Net movement in other long-term receivables (0.1) (0.1) Net movement in other non-current liabilities (2.8) 13.7 Changes in working capital Decrease in inventories 8.8 5.0 Increase in trade and other receivables (1.4) (1.9) Decrease in trade and other payables (0.8) (7.3)
Cash generated from operations 200.4 240.2
32 ANALYSIS OF CHANGES IN NET DEBT
33 CONTINGENT LIABILITIES
34 POST BALANCE SHEET EVENT
www.debenhams.com 135
Cash payments in relation to exceptional items were as follows:
2 September 2017
£m
3 September 2016
£m
Exceptional items for the year ended 2 September 2017 8.5 – Exceptional items for the year ended 3 September 2016 7.4 3.3
Total cash payments in relation to exceptional items 15.9 3.3
3 September 2016
£m Cash flow
£m
Foreign exchange
gains £m
Other non-cash
movements £m
2 September 2017
£m
Analysis of net debt Cash and cash equivalents 56.3 (16.4) 0.1 – 40.0 Bank overdrafts (15.5) (4.8) – – (20.3)
Net cash and cash equivalents 40.8 (21.2) 0.1 – 19.7 Debt due within one year (118.9) 25.0 – (0.6) (94.5) Debt due after one year (197.3) – – (0.6) (197.9) Finance lease obligations due within one year (1.2) 1.6 – (2.0) (1.6) Finance lease obligations due after one year (2.4) – – 0.8 (1.6)
(279.0) 5.4 0.1 (2.4) (275.9)
Other non-cash movements comprise:
2 September 2017
£m
3 September 2016
£m
Amortisation of issue costs relating to revolving credit facilities 0.7 0.8 Amortisation of issue costs relating to senior notes 0.6 0.5 Non-cash movements associated with finance lease obligations 1.2 3.3 Non-cash movements associated with senior notes (0.1) (0.2)
Other non-cash transactions 2.4 4.4
The Group is subject to litigation from time to time as a result of its activities. The Group establishes provisions in connection with litigation where it has a present legal or constructive obligation as a result of past events and where it is more likely than not an outflow of resources will be required to settle the obligation and the amount can be reliably estimated.
There are a number of contingent liabilities that arise in the normal course of business which if realised are not expected to result in a material liability to the Group.
On 5 September 2017, the Group acquired a minority stake in blow LTD. for a cash consideration of £7.5 million. blow LTD. provides beauty services and is registered in the UK.
www.debenhams.com 135
Financial Statem
ents
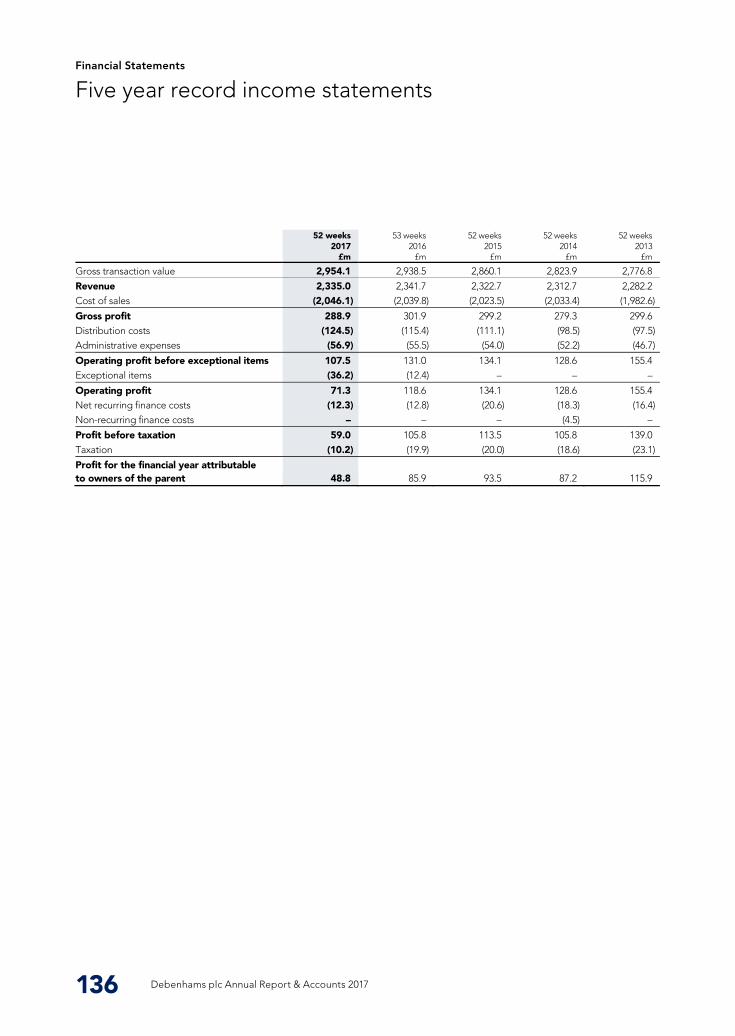
Financial Statements
Five year record income statements
136 Debenhams plc Annual Report & Accounts 2017
52 weeks 2017
£m
53 weeks 2016
£m
52 weeks 2015
£m
52 weeks 2014
£m
52 weeks 2013
£m
Gross transaction value 2,954.1 2,938.5 2,860.1 2,823.9 2,776.8
Revenue 2,335.0 2,341.7 2,322.7 2,312.7 2,282.2 Cost of sales (2,046.1) (2,039.8) (2,023.5) (2,033.4) (1,982.6)
Gross profit 288.9 301.9 299.2 279.3 299.6 Distribution costs (124.5) (115.4) (111.1) (98.5) (97.5) Administrative expenses (56.9) (55.5) (54.0) (52.2) (46.7)
Operating profit before exceptional items 107.5 131.0 134.1 128.6 155.4 Exceptional items (36.2) (12.4) – – –
Operating profit 71.3 118.6 134.1 128.6 155.4 Net recurring finance costs (12.3) (12.8) (20.6) (18.3) (16.4) Non-recurring finance costs – – – (4.5) –
Profit before taxation 59.0 105.8 113.5 105.8 139.0 Taxation (10.2) (19.9) (20.0) (18.6) (23.1)
Profit for the financial year attributable to owners of the parent 48.8 85.9 93.5 87.2 115.9
Debenhams plc Annual Report & Accounts 2017136
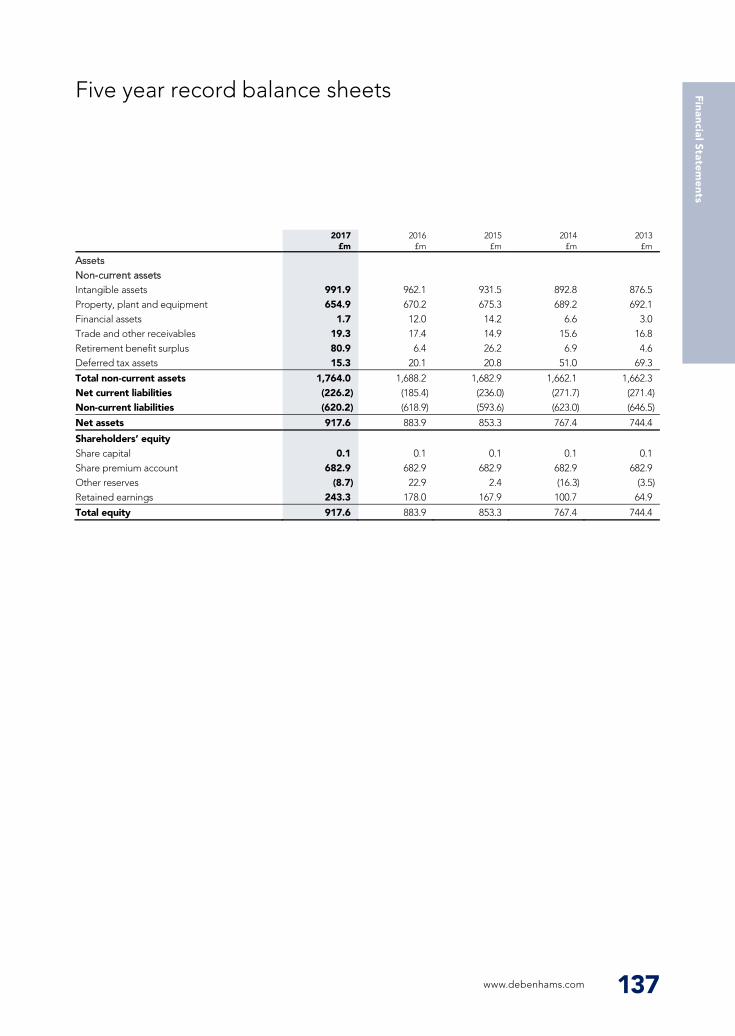
Five year record income statements
136 Debenhams plc Annual Report & Accounts 2017
52 weeks 2017
£m
53 weeks 2016
£m
52 weeks 2015
£m
52 weeks 2014
£m
52 weeks 2013
£m
Gross transaction value 2,954.1 2,938.5 2,860.1 2,823.9 2,776.8
Revenue 2,335.0 2,341.7 2,322.7 2,312.7 2,282.2 Cost of sales (2,046.1) (2,039.8) (2,023.5) (2,033.4) (1,982.6)
Gross profit 288.9 301.9 299.2 279.3 299.6 Distribution costs (124.5) (115.4) (111.1) (98.5) (97.5) Administrative expenses (56.9) (55.5) (54.0) (52.2) (46.7)
Operating profit before exceptional items 107.5 131.0 134.1 128.6 155.4 Exceptional items (36.2) (12.4) – – –
Operating profit 71.3 118.6 134.1 128.6 155.4 Net recurring finance costs (12.3) (12.8) (20.6) (18.3) (16.4) Non-recurring finance costs – – – (4.5) –
Profit before taxation 59.0 105.8 113.5 105.8 139.0 Taxation (10.2) (19.9) (20.0) (18.6) (23.1)
Profit for the financial year attributable to owners of the parent 48.8 85.9 93.5 87.2 115.9
Five year record balance sheets
www.debenhams.com 137
2017
£m 2016
£m 2015
£m 2014
£m 2013
£m
Intangible assets 991.9 962.1 931.5 892.8 876.5 Property, plant and equipment 654.9 670.2 675.3 689.2 692.1 Financial assets 1.7 12.0 14.2 6.6 3.0 Trade and other receivables 19.3 17.4 14.9 15.6 16.8 Retirement benefit surplus 80.9 6.4 26.2 6.9 4.6 Deferred tax assets 15.3 20.1 20.8 51.0 69.3
Total non-current assets 1,764.0 1,688.2 1,682.9 1,662.1 1,662.3 Net current liabilities (226.2) (185.4) (236.0) (271.7) (271.4) Non-current liabilities (620.2) (618.9) (593.6) (623.0) (646.5)
Net assets 917.6 883.9 853.3 767.4 744.4
Shareholders’ equity Share capital 0.1 0.1 0.1 0.1 0.1 Share premium account 682.9 682.9 682.9 682.9 682.9 Other reserves (8.7) 22.9 2.4 (16.3) (3.5) Retained earnings 243.3 178.0 167.9 100.7 64.9
Total equity 917.6 883.9 853.3 767.4 744.4
Assets Non-current assets
www.debenhams.com 137
Financial Statem
ents
Financial Statements
Independent auditors’ report to the members of Debenhams plc (Company)
www.debenhams.com 138
REPORT ON THE AUDIT OF THE COMPANY FINANCIAL STATEMENTS Opinion In our opinion, Debenhams plc’s Company financial statements (the “financial statements”):
give a true and fair view of the state of the company’s affairs as at 2 September 2017; have been properly prepared in accordance with United Kingdom Generally Accepted Accounting Practice (United
Kingdom Accounting Standards, comprising FRS 101 “Reduced Disclosure Framework”, and applicable law); and have been prepared in accordance with the requirements of the Companies Act 2006
We have audited the financial statements, included within the Annual Report & Accounts (the “Annual Report”), which comprise: the Company Balance Sheet as at 2 September 2017; the Company Statement of Changes in Equity for the year then ended; and the notes to the financial statements, which include a description of the significant accounting policies.
Our opinion is consistent with our reporting to the Audit Committee.
Basis for opinion We conducted our audit in accordance with International Standards on Auditing (UK) (“ISAs (UK)”) and applicable law. Our responsibilities under ISAs (UK) are further described in the Auditors’ responsibilities for the audit of the financial statements section of our report. We believe that the audit evidence we have obtained is sufficient and appropriate to provide a basis for our opinion.
Independence We remained independent of the Group in accordance with the ethical requirements that are relevant to our audit of the financial statements in the UK, which includes the FRC’s Ethical Standard, as applicable to listed public interest entities, and we have fulfilled our other ethical responsibilities in accordance with these requirements.
To the best of our knowledge and belief, we declare that non-audit services prohibited by the FRC’s Ethical Standard were not provided to the group or the company.
Other than those disclosed in note 6 to the financial statements, we have provided no non-audit services to the group and its subsidiaries in the period from 4 September 2016 to 2 September 2017.
Our audit approach Overview
Overall materiality: £4.8 million (2016: £5.9 million), based on 5% of profit before tax and exceptional items
The company consists of investments held in group companies, borrowing and intercompany balances
Assessment of carrying value of the investments
Audit scope
Key auditmatters
Materiality
Debenhams plc Annual Report & Accounts 2017138
Independent auditors’ report to the members of Debenhams plc (Company)
www.debenhams.com 138
REPORT ON THE AUDIT OF THE COMPANY FINANCIAL STATEMENTS Opinion In our opinion, Debenhams plc’s Company financial statements (the “financial statements”):
give a true and fair view of the state of the company’s affairs as at 2 September 2017; have been properly prepared in accordance with United Kingdom Generally Accepted Accounting Practice (United
Kingdom Accounting Standards, comprising FRS 101 “Reduced Disclosure Framework”, and applicable law); and have been prepared in accordance with the requirements of the Companies Act 2006
We have audited the financial statements, included within the Annual Report & Accounts (the “Annual Report”), which comprise: the Company Balance Sheet as at 2 September 2017; the Company Statement of Changes in Equity for the year then ended; and the notes to the financial statements, which include a description of the significant accounting policies.
Our opinion is consistent with our reporting to the Audit Committee.
Basis for opinion We conducted our audit in accordance with International Standards on Auditing (UK) (“ISAs (UK)”) and applicable law. Our responsibilities under ISAs (UK) are further described in the Auditors’ responsibilities for the audit of the financial statements section of our report. We believe that the audit evidence we have obtained is sufficient and appropriate to provide a basis for our opinion.
Independence We remained independent of the Group in accordance with the ethical requirements that are relevant to our audit of the financial statements in the UK, which includes the FRC’s Ethical Standard, as applicable to listed public interest entities, and we have fulfilled our other ethical responsibilities in accordance with these requirements.
To the best of our knowledge and belief, we declare that non-audit services prohibited by the FRC’s Ethical Standard were not provided to the group or the company.
Other than those disclosed in note 6 to the financial statements, we have provided no non-audit services to the group and its subsidiaries in the period from 4 September 2016 to 2 September 2017.
Our audit approach Overview
Overall materiality: £4.8 million (2016: £5.9 million), based on 5% of profit before tax and exceptional items
The company consists of investments held in group companies, borrowing and intercompany balances
Assessment of carrying value of the investments
www.debenhams.com 139
THE SCOPE OF OUR AUDIT As part of designing our audit, we determined materiality and assessed the risks of material misstatement in the financial statements. In particular, we looked at where the directors made subjective judgements, for example in respect of significant accounting estimates that involved making assumptions and considering future events that are inherently uncertain. As in all of our audits we also addressed the risk of management override of internal controls, including evaluating whether there was evidence of bias by the directors that represented a risk of material misstatement due to fraud.
The company’s principal activity is that of a holding company as stated in note 1 of the group financial statements and is structured as one operating segment.
Our audit approach was based on the materiality of the company covering 100% of the company’s ledger and related disclosure notes.
Key audit matters Key audit matters are those matters that, in the auditors’ professional judgement, were of most significance in the audit of the financial statements of the current period and include the most significant assessed risks of material misstatement (whether or not due to fraud) identified by the auditors, including those which had the greatest effect on: the overall audit strategy; the allocation of resources in the audit; and directing the efforts of the engagement team. These matters, and any comments we make on the results of our procedures thereon, were addressed in the context of our audit of the financial statements as a whole, and in forming our opinion thereon, and we do not provide a separate opinion on these matters. This is not a complete list of all risks identified by our audit.
Key audit matter How our audit addressed the key audit matter Risk of impairment of investments held in subsidiaries. See note 1 to the financial statements for the directors' disclosures of the related impairment policy. The UK retail market continues to evolve rapidly, with customers’ purchasing habits adapting to include online offerings and other convenience options, and there is a risk that this could impact the recoverable value of assets used within the subsidiaries and in turn impact the value of investments held in the subsidiaries.
We tested that the impairment models used by management were mathematically correct with no issues noted.
We challenged the directors on the inputs into their impairment assessment calculations, including:
The directors’ key assumptions for short-term sales growth rates (from (2.0%) to 4.0%), are driven by the implementation of the new Debenhams Redesigned strategy. We have agreed the growth rates to management’s five year plan and assessed the components of that five year plan. The growth rates used are in line with the five year plan;
The directors’ key assumptions for long-term sales growth rates of 1.0%, by comparing this to historical results, and economic and industry forecasts and note that the rates used in management’s calculations were in line with this data; and
The discount rate (post tax rate of 7.3%), by assessing the cost of capital for the group and comparable organisations, forming a view of risk premiums as appropriate. Having performed this assessment we believe this is an appropriate discount rate
We also performed sensitivity analysis on the key assumptions including the short-term growth rates and discount rates as these are the key assumptions in the impairment model. We note that the calculations are most sensitive to changes in short-term growth rates, however, consider there to be sufficient headroom to support the carrying value of the investments.
We found, based on our audit work, that the key assumptions used by management were supportable.
How we tailored the audit scope We tailored the scope of our audit to ensure that we performed enough work to be able to give an opinion on the financial statements as a whole, taking into account the structure of the company, the accounting processes and controls, and the industry in which it operates.
www.debenhams.com 139
Financial Statem
ents
Financial Statements
Independent auditors’ report to the members of Debenhams plc (Company) continued
140 Debenhams plc Annual Report & Accounts 2017
Materiality The scope of our audit was influenced by our application of materiality. We set certain quantitative thresholds for materiality. These, together with qualitative considerations, helped us to determine the scope of our audit and the nature, timing and extent of our audit procedures on the individual financial statement line items and disclosures and in evaluating the effect of misstatements, both individually and in aggregate on the financial statements as a whole.
Based on our professional judgement, we determined materiality for the stand-alone company financial statements as a whole as follows:
Overall materiality £4.8 million (2016: £5.9 million).
How we determined it 5% of profit before tax and exceptional items.
Rationale for benchmark applied Whilst the company is a holding company and therefore an asset measure would be a generally accepted auditing benchmark, we have restricted the level of materiality applied to be the same level as applied to the group financial statements and therefore used group profit before tax and exceptional items as the benchmark.
We agreed with the Audit Committee that we would report to them misstatements identified during our audit above £0.5 million (2016: £0.5 million) as well as misstatements below that amount that, in our view, warranted reporting for qualitative reasons.
Going concern In accordance with ISAs (UK) we report as follows:
Reporting obligation Outcome We are required to report if we have anything material to add or draw attention to in respect of the directors’ statement in the financial statements about whether the directors considered it appropriate to adopt the going concern basis of accounting in preparing the financial statements and the directors’ identification of any material uncertainties to the company’s ability to continue as a going concern over a period of at least twelve months from the date of approval of the financial statements.
We have nothing material to add or to draw attention to. However, because not all future events or conditions can be predicted, this statement is not a guarantee as to the company’s ability to continue as a going concern.
We are required to report if the directors’ statement relating to Going Concern in accordance with Listing Rule 9.8.6R(3) is materially inconsistent with our knowledge obtained in the audit.
We have nothing to report.
REPORTING ON OTHER INFORMATION The other information comprises all of the information in the Annual Report other than the financial statements and our auditors’ report thereon. The directors are responsible for the other information. Our opinion on the financial statements does not cover the other information and, accordingly, we do not express an audit opinion or, except to the extent otherwise explicitly stated in this report, any form of assurance thereon.
In connection with our audit of the financial statements, our responsibility is to read the other information and, in doing so, consider whether the other information is materially inconsistent with the financial statements or our knowledge obtained in the audit, or otherwise appears to be materially misstated. If we identify an apparent material inconsistency or material misstatement, we are required to perform procedures to conclude whether there is a material misstatement of the financial statements or a material misstatement of the other information. If, based on the work we have performed, we conclude that there is a material misstatement of this other information, we are required to report that fact. We have nothing to report based on these responsibilities.
With respect to the Strategic Report and Directors’ Report, we also considered whether the disclosures required by the UK Companies Act 2006 have been included.
Based on the responsibilities described above and our work undertaken in the course of the audit, the Companies Act 2006, (CA06), ISAs (UK) and the Listing Rules of the Financial Conduct Authority (FCA) require us also to report certain opinions and matters as described below (required by ISAs (UK) unless otherwise stated).
Debenhams plc Annual Report & Accounts 2017140
Independent auditors’ report to the members of Debenhams plc (Company) continued
140 Debenhams plc Annual Report & Accounts 2017
Materiality The scope of our audit was influenced by our application of materiality. We set certain quantitative thresholds for materiality. These, together with qualitative considerations, helped us to determine the scope of our audit and the nature, timing and extent of our audit procedures on the individual financial statement line items and disclosures and in evaluating the effect of misstatements, both individually and in aggregate on the financial statements as a whole.
Based on our professional judgement, we determined materiality for the stand-alone company financial statements as a whole as follows:
Overall materiality £4.8 million (2016: £5.9 million).
How we determined it 5% of profit before tax and exceptional items.
Rationale for benchmark applied Whilst the company is a holding company and therefore an asset measure would be a generally accepted auditing benchmark, we have restricted the level of materiality applied to be the same level as applied to the group financial statements and therefore used group profit before tax and exceptional items as the benchmark.
We agreed with the Audit Committee that we would report to them misstatements identified during our audit above £0.5 million (2016: £0.5 million) as well as misstatements below that amount that, in our view, warranted reporting for qualitative reasons.
Going concern In accordance with ISAs (UK) we report as follows:
Reporting obligation Outcome We are required to report if we have anything material to add or draw attention to in respect of the directors’ statement in the financial statements about whether the directors considered it appropriate to adopt the going concern basis of accounting in preparing the financial statements and the directors’ identification of any material uncertainties to the company’s ability to continue as a going concern over a period of at least twelve months from the date of approval of the financial statements.
We have nothing material to add or to draw attention to. However, because not all future events or conditions can be predicted, this statement is not a guarantee as to the company’s ability to continue as a going concern.
We are required to report if the directors’ statement relating to Going Concern in accordance with Listing Rule 9.8.6R(3) is materially inconsistent with our knowledge obtained in the audit.
We have nothing to report.
REPORTING ON OTHER INFORMATION The other information comprises all of the information in the Annual Report other than the financial statements and our auditors’ report thereon. The directors are responsible for the other information. Our opinion on the financial statements does not cover the other information and, accordingly, we do not express an audit opinion or, except to the extent otherwise explicitly stated in this report, any form of assurance thereon.
In connection with our audit of the financial statements, our responsibility is to read the other information and, in doing so, consider whether the other information is materially inconsistent with the financial statements or our knowledge obtained in the audit, or otherwise appears to be materially misstated. If we identify an apparent material inconsistency or material misstatement, we are required to perform procedures to conclude whether there is a material misstatement of the financial statements or a material misstatement of the other information. If, based on the work we have performed, we conclude that there is a material misstatement of this other information, we are required to report that fact. We have nothing to report based on these responsibilities.
With respect to the Strategic Report and Directors’ Report, we also considered whether the disclosures required by the UK Companies Act 2006 have been included.
Based on the responsibilities described above and our work undertaken in the course of the audit, the Companies Act 2006, (CA06), ISAs (UK) and the Listing Rules of the Financial Conduct Authority (FCA) require us also to report certain opinions and matters as described below (required by ISAs (UK) unless otherwise stated).
www.debenhams.com 141
Strategic Report and Directors’ Report In our opinion, based on the work undertaken in the course of the audit, the information given in the Strategic Report and Directors’ Report for the year ended 2 September 2017 is consistent with the financial statements and has been prepared in accordance with applicable legal requirements. (CA06)
In light of the knowledge and understanding of the company and its environment obtained in the course of the audit, we did not identify any material misstatements in the Strategic Report and Directors’ Report. (CA06)
The directors’ assessment of the prospects of the company and of the principal risks that would threaten the solvency or liquidity of the company We have nothing material to add or draw attention to regarding:
The directors’ confirmation on page 27 of the Annual Report that they have carried out a robust assessment of the principal risks facing the company, including those that would threaten its business model, future performance, solvency or liquidity
The disclosures in the Annual Report that describe those risks and explain how they are being managed or mitigated The directors’ explanation on page 79 of the Annual Report as to how they have assessed the prospects of the company,
over what period they have done so and why they consider that period to be appropriate, and their statement as to whether they have a reasonable expectation that the company will be able to continue in operation and meet its liabilities as they fall due over the period of their assessment, including any related disclosures drawing attention to any necessary qualifications or assumptions
We have nothing to report having performed a review of the directors’ statement that they have carried out a robust assessment of the principal risks facing the company and statement in relation to the longer-term viability of the company. Our review was substantially less in scope than an audit and only consisted of making inquiries and considering the directors’ process supporting their statements; checking that the statements are in alignment with the relevant provisions of the UK Corporate Governance Code (the “Code”); and considering whether the statements are consistent with the knowledge and understanding of the company and its environment obtained in the course of the audit. (Listing Rules)
Other Code Provisions We have nothing to report in respect of our responsibility to report when:
The statement given by the directors, on page 80, that they consider the Annual Report taken as a whole to be fair, balanced and understandable, and provides the information necessary for the members to assess the company’s position and performance, business model and strategy is materially inconsistent with our knowledge of the company obtained in the course of performing our audit
The section of the Annual Report on page 52 describing the work of the Audit Committee does not appropriately address matters communicated by us to the Audit Committee
The directors’ statement relating to the company’s compliance with the Code does not properly disclose a departure from a relevant provision of the Code specified, under the Listing Rules, for review by the auditors
Directors’ Remuneration In our opinion, the part of the Directors’ Remuneration Report to be audited has been properly prepared in accordance with the Companies Act 2006. (CA06)
www.debenhams.com 141
Financial Statem
ents
Financial Statements
Independent auditors’ report to the members of Debenhams plc (Company) continued
142 Debenhams plc Annual Report & Accounts 2017
RESPONSIBILITIES FOR THE FINANCIAL STATEMENTS AND THE AUDIT Responsibilities of the directors for the financial statements As explained more fully in the Statement of Directors’ Responsibilities set out on page 80, the directors are responsible for the preparation of the financial statements in accordance with the applicable framework and for being satisfied that they give a true and fair view. The directors are also responsible for such internal control as they determine is necessary to enable the preparation of financial statements that are free from material misstatement, whether due to fraud or error.
In preparing the financial statements, the directors are responsible for assessing the company’s ability to continue as a going concern, disclosing as applicable, matters related to going concern and using the going concern basis of accounting unless the directors either intend to liquidate the company or to cease operations, or have no realistic alternative but to do so.
Auditors’ responsibilities for the audit of the financial statements Our objectives are to obtain reasonable assurance about whether the financial statements as a whole are free from material misstatement, whether due to fraud or error, and to issue an auditors’ report that includes our opinion. Reasonable assurance is a high level of assurance, but is not a guarantee that an audit conducted in accordance with ISAs (UK) will always detect a material misstatement when it exists. Misstatements can arise from fraud or error and are considered material if, individually or in the aggregate, they could reasonably be expected to influence the economic decisions of users taken on the basis of these financial statements.
A further description of our responsibilities for the audit of the financial statements is located on the FRC’s website at: www.frc.org.uk/auditorsresponsibilities. This description forms part of our auditors’ report.
Use of this report This report, including the opinions, has been prepared for and only for the company’s members as a body in accordance with Chapter 3 of Part 16 of the Companies Act 2006 and for no other purpose. We do not, in giving these opinions, accept or assume responsibility for any other purpose or to any other person to whom this report is shown or into whose hands it may come save where expressly agreed by our prior consent in writing.
OTHER REQUIRED REPORTING Companies Act 2006 exception reporting Under the Companies Act 2006 we are required to report to you if, in our opinion:
we have not received all the information and explanations we require for our audit; or adequate accounting records have not been kept by the company, or returns adequate for our audit have not been
received from branches not visited by us; or certain disclosures of directors’ remuneration specified by law are not made; or the financial statements and the part of the Directors’ Remuneration Report to be audited are not in agreement with the
accounting records and returns
We have no exceptions to report arising from this responsibility.
Appointment Following the recommendation of the audit committee, we were appointed by the members of Debenhams plc to audit the financial statements for its first year after incorporation for the year ended 3 September 2005 and subsequent financial periods. The period of total uninterrupted engagement is 13 years, covering the years ended 3 September 2005 to 2 September 2017. Before 2005, we were auditors of other entities within the Debenhams plc group. The audit committee have set out details of their planned audit tender timetable on page 53 of the annual report and accounts.
OTHER MATTER We have reported separately on the group financial statements of Debenhams plc for the year ended 2 September 2017.
John Ellis (Senior Statutory Auditor) for and on behalf of PricewaterhouseCoopers LLP Chartered Accountants and Statutory Auditors Reading 26 October 2017
Debenhams plc Annual Report & Accounts 2017142
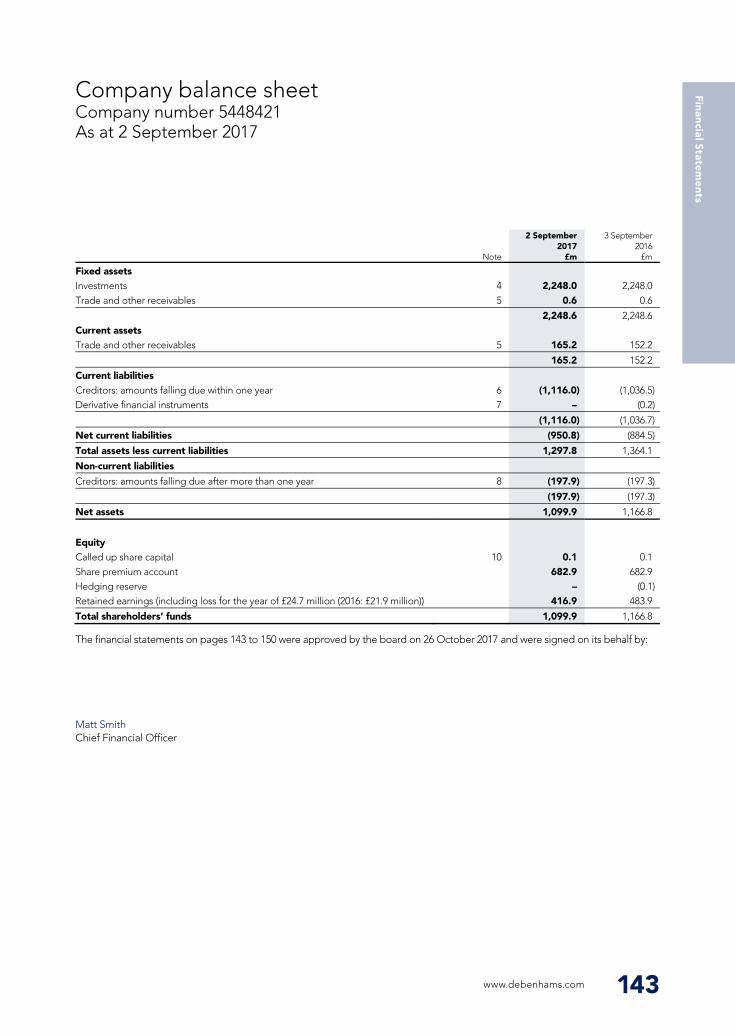
Independent auditors’ report to the members of Debenhams plc (Company) continued
142 Debenhams plc Annual Report & Accounts 2017
RESPONSIBILITIES FOR THE FINANCIAL STATEMENTS AND THE AUDIT Responsibilities of the directors for the financial statements As explained more fully in the Statement of Directors’ Responsibilities set out on page 80, the directors are responsible for the preparation of the financial statements in accordance with the applicable framework and for being satisfied that they give a true and fair view. The directors are also responsible for such internal control as they determine is necessary to enable the preparation of financial statements that are free from material misstatement, whether due to fraud or error.
In preparing the financial statements, the directors are responsible for assessing the company’s ability to continue as a going concern, disclosing as applicable, matters related to going concern and using the going concern basis of accounting unless the directors either intend to liquidate the company or to cease operations, or have no realistic alternative but to do so.
Auditors’ responsibilities for the audit of the financial statements Our objectives are to obtain reasonable assurance about whether the financial statements as a whole are free from material misstatement, whether due to fraud or error, and to issue an auditors’ report that includes our opinion. Reasonable assurance is a high level of assurance, but is not a guarantee that an audit conducted in accordance with ISAs (UK) will always detect a material misstatement when it exists. Misstatements can arise from fraud or error and are considered material if, individually or in the aggregate, they could reasonably be expected to influence the economic decisions of users taken on the basis of these financial statements.
A further description of our responsibilities for the audit of the financial statements is located on the FRC’s website at: www.frc.org.uk/auditorsresponsibilities. This description forms part of our auditors’ report.
Use of this report This report, including the opinions, has been prepared for and only for the company’s members as a body in accordance with Chapter 3 of Part 16 of the Companies Act 2006 and for no other purpose. We do not, in giving these opinions, accept or assume responsibility for any other purpose or to any other person to whom this report is shown or into whose hands it may come save where expressly agreed by our prior consent in writing.
OTHER REQUIRED REPORTING Companies Act 2006 exception reporting Under the Companies Act 2006 we are required to report to you if, in our opinion:
we have not received all the information and explanations we require for our audit; or adequate accounting records have not been kept by the company, or returns adequate for our audit have not been
received from branches not visited by us; or certain disclosures of directors’ remuneration specified by law are not made; or the financial statements and the part of the Directors’ Remuneration Report to be audited are not in agreement with the
accounting records and returns
We have no exceptions to report arising from this responsibility.
Appointment Following the recommendation of the audit committee, we were appointed by the members of Debenhams plc to audit the financial statements for its first year after incorporation for the year ended 3 September 2005 and subsequent financial periods. The period of total uninterrupted engagement is 13 years, covering the years ended 3 September 2005 to 2 September 2017. Before 2005, we were auditors of other entities within the Debenhams plc group. The audit committee have set out details of their planned audit tender timetable on page 53 of the annual report and accounts.
OTHER MATTER We have reported separately on the group financial statements of Debenhams plc for the year ended 2 September 2017.
John Ellis (Senior Statutory Auditor) for and on behalf of PricewaterhouseCoopers LLP Chartered Accountants and Statutory Auditors Reading 26 October 2017
Company balance sheet Company number 5448421 As at 2 September 2017
www.debenhams.com 143
Note
2 September 2017
£m
3 September 2016
£m
Fixed assets Investments 4 2,248.0 2,248.0 Trade and other receivables 5 0.6 0.6
2,248.6 2,248.6 Current assets Trade and other receivables 5 165.2 152.2
165.2 152.2
Current liabilities Creditors: amounts falling due within one year 6 (1,116.0) (1,036.5) Derivative financial instruments 7 – (0.2)
(1,116.0) (1,036.7)
Net current liabilities (950.8) (884.5)
Total assets less current liabilities 1,297.8 1,364.1
Non-current liabilities
Creditors: amounts falling due after more than one year 8 (197.9) (197.3)
(197.9) (197.3)
Net assets 1,099.9 1,166.8
Equity Called up share capital 10 0.1 0.1 Share premium account 682.9 682.9 Hedging reserve – (0.1) Retained earnings (including loss for the year of £24.7 million (2016: £21.9 million)) 416.9 483.9
Total shareholders’ funds 1,099.9 1,166.8
The financial statements on pages 143 to 150 were approved by the board on 26 October 2017 and were signed on its behalf by:
Matt Smith Chief Financial Officer
www.debenhams.com 143
Financial Statem
ents
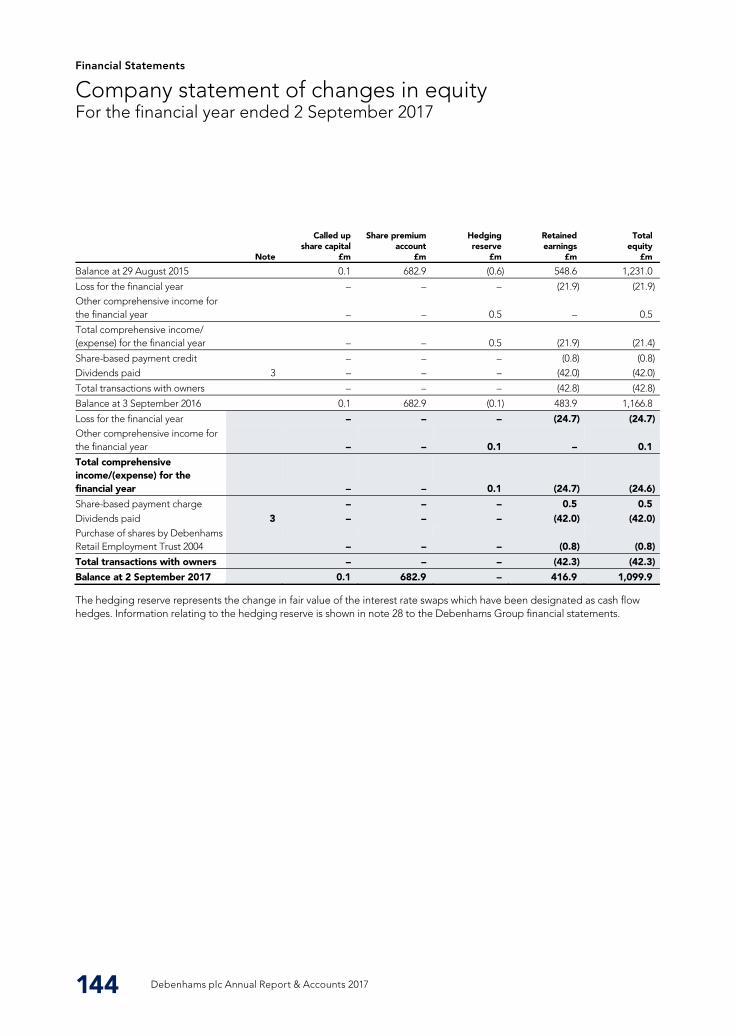
Financial Statements
Company statement of changes in equity For the financial year ended 2 September 2017
144 Debenhams plc Annual Report & Accounts 2017
Note
Called up share capital
£m
Share premium account
£m
Hedging reserve
£m
Retained earnings
£m
Total equity
£m
Balance at 29 August 2015 0.1 682.9 (0.6) 548.6 1,231.0
Loss for the financial year – – – (21.9) (21.9) Other comprehensive income for the financial year – – 0.5 – 0.5
Total comprehensive income/ (expense) for the financial year – – 0.5 (21.9) (21.4)
Share-based payment credit – – – (0.8) (0.8) Dividends paid 3 – – – (42.0) (42.0)
Total transactions with owners – – – (42.8) (42.8)
Balance at 3 September 2016 0.1 682.9 (0.1) 483.9 1,166.8
Loss for the financial year – – – (24.7) (24.7) Other comprehensive income for the financial year – – 0.1 – 0.1
Total comprehensive income/(expense) for the financial year – – 0.1 (24.7) (24.6)
Share-based payment charge – – – 0.5 0.5 Dividends paid 3 – – – (42.0) (42.0) Purchase of shares by Debenhams Retail Employment Trust 2004 – – – (0.8) (0.8)
Total transactions with owners – – – (42.3) (42.3)
Balance at 2 September 2017 0.1 682.9 – 416.9 1,099.9
The hedging reserve represents the change in fair value of the interest rate swaps which have been designated as cash flow hedges. Information relating to the hedging reserve is shown in note 28 to the Debenhams Group financial statements.
Debenhams plc Annual Report & Accounts 2017144
Company statement of changes in equity For the financial year ended 2 September 2017
144 Debenhams plc Annual Report & Accounts 2017
Note
Called up share capital
£m
Share premium account
£m
Hedging reserve
£m
Retained earnings
£m
Total equity
£m
Balance at 29 August 2015 0.1 682.9 (0.6) 548.6 1,231.0
Loss for the financial year – – – (21.9) (21.9) Other comprehensive income for the financial year – – 0.5 – 0.5
Total comprehensive income/ (expense) for the financial year – – 0.5 (21.9) (21.4)
Share-based payment credit – – – (0.8) (0.8) Dividends paid 3 – – – (42.0) (42.0)
Total transactions with owners – – – (42.8) (42.8)
Balance at 3 September 2016 0.1 682.9 (0.1) 483.9 1,166.8
Loss for the financial year – – – (24.7) (24.7) Other comprehensive income for the financial year – – 0.1 – 0.1
Total comprehensive income/(expense) for the financial year – – 0.1 (24.7) (24.6)
Share-based payment charge – – – 0.5 0.5 Dividends paid 3 – – – (42.0) (42.0) Purchase of shares by Debenhams Retail Employment Trust 2004 – – – (0.8) (0.8)
Total transactions with owners – – – (42.3) (42.3)
Balance at 2 September 2017 0.1 682.9 – 416.9 1,099.9
The hedging reserve represents the change in fair value of the interest rate swaps which have been designated as cash flow hedges. Information relating to the hedging reserve is shown in note 28 to the Debenhams Group financial statements.
Notes to the Company financial statements For the financial year ended 2 September 2017
www.debenhams.com 145
1 ACCOUNTING POLICIES Basis of preparation These financial statements are for the 52 weeks ended 2 September 2017. The comparative financial year is the 53 weeks ended 3 September 2016.
The financial statements have been prepared in accordance FRS 101 “Reduced disclosure framework” (FRS 101). The accounting policies as described below have been consistently applied to all financial years presented. The financial statements have been prepared on a going concern basis under the historical cost convention (as modified by the revaluation of derivative financial assets and financial liabilities measured at fair value through profit and loss) and in accordance with the Companies Act 2006. Historical cost is generally based on the fair value of the consideration given in exchange for the assets.
FRS 101 enables the financial statements of the parent company to be prepared in accordance with EU-adopted IFRS but with certain disclosure exemptions. The main areas of reduced disclosure are in respect of equity-settled share-based payments, financial instruments, the cash flow statement and related party transactions with Group companies. When required, equivalent disclosures are given in the consolidated financial statements of Debenhams plc.
As permitted by section 408 of the Companies Act 2006, the income statement for the Company has not been presented.
The principal accounting policies, which have been applied consistently for each financial year unless stated otherwise, are set out below.
Investments Investments comprise the Company’s investment in subsidiaries and are shown at cost less any provision for impairment.
Impairment testing Assets that have an indefinite useful life are not subject to amortisation and are tested annually for impairment. Assets that are subject to amortisation are reviewed for impairment whenever events or changes in circumstances indicate that the carrying value may not be recoverable. An impairment loss is recognised for the amount by which the asset’s carrying amount exceeds its recoverable amount. The recoverable amount is the higher of an asset’s net realisable value and value-in-use.
Borrowings Borrowings are recognised initially at fair value, net of transaction costs incurred. Borrowings are subsequently stated at amortised cost. Any difference between the proceeds (net of transaction costs) and the redemption value is recognised in the income statement over the period of the borrowings using the effective interest method.
Borrowings are classified as current liabilities unless the Company has an unconditional right to defer settlement of the liability for at least 12 months after the balance sheet date.
Transaction costs associated with borrowings are recognised initially at fair value and are amortised over the term of the facilities using the effective interest rate on the committed amount of each facility.
Debt repurchase The nominal value of debt repurchased is accounted for as a loan redemption, reducing net borrowings at the balance sheet date.
Property related income and costs Property related income and costs are recognised in the period to which they relate.
Interest recognition Finance income and finance costs are recognised in the period to which they relate using the effective interest method.
Dividend income Dividend income is recognised when the right to receive payment is established.
Taxation Current tax is provided at amounts expected to be paid (or recovered) using the tax rates that are in force during the period.
Deferred tax is recognised in respect of all timing differences that have originated but not reversed at the balance sheet date where transactions or events that result in an obligation to pay more tax in the future or a right to pay less tax in the future have occurred at the balance sheet date. Timing differences are differences between the taxable profits and the results as stated in the financial statements that arise from the inclusion of gains and losses in tax assessments in periods different from those in which they are recognised in the financial statements.
Deferred tax is measured on a non-discounted basis. A deferred tax asset is regarded as recoverable and therefore recognised only when, on the basis of all available evidence, it can be regarded as more likely than not that there will be taxable profits from which the future reversal of the underlying timing differences can be deducted.
Deferred tax is measured at the average tax rates which are expected to apply in the periods in which the timing differences are expected to reverse, based upon tax rates and laws which have been enacted or substantively enacted by the balance sheet date.
www.debenhams.com 145
Financial Statem
ents
Financial Statements
Notes to the Company financial statements For the financial year ended 2 September 2017 continued
146 Debenhams plc Annual Report & Accounts 2017
1 ACCOUNTING POLICIES CONTINUED Dividend distribution A final dividend distribution to the Company’s shareholders is recognised as a liability in the Company’s financial statements in the period in which the dividend is approved by the Company’s shareholders. Interim dividends are recognised when paid.
Share-based payments The Company issues equity-settled share-based payments to certain employees. A fair value for the equity-settled share awards is measured at the date of grant. The Company measures the fair value of each award using the Black-Scholes model where appropriate.
The fair value determined at the grant date is expensed on a straight-line basis over the vesting period, based on the Company’s estimate of the shares that will eventually vest and adjusted for the effect of non-market-based vesting conditions. At each balance sheet date, the Company revises its estimates of the number of awards that are expected to vest. Non-market performance and service conditions are included in assumptions about the number of awards that are expected to vest. The Company recognises the impact of the revision to original estimates, if any, in the income statement, with a corresponding adjustment to equity.
When the awards are exercised, the Company may issue new shares or utilise shares held as treasury shares or within the Debenhams Retail Employee Trust 2004. The proceeds received net of any directly attributable transaction costs are credited to share capital (at nominal value) and share premium when the awards are exercised.
Where the Company has granted options over the Company’s shares to employees of its subsidiaries, a capital contribution has been deemed made by the Company. This is then recharged to the subsidiary and is based on the fair value of the options issued spread over the option’s vesting period.
Foreign exchange Transactions denominated in foreign currencies are translated into the respective functional currency at the exchange rates prevailing at the dates of the transaction. Monetary assets and liabilities that are denominated in foreign currencies are translated into sterling at the closing rates ruling at the balance sheet date.
Derivatives The derivative instruments used by the Company to manage its interest rate risk are interest rate swaps.
Derivatives are initially recognised at fair value on the date a derivative contract is entered into and are subsequently remeasured at fair value. The method of recognising the resulting gain or loss depends on whether the derivative is designated as an effective hedging instrument and the nature
of the item being hedged. The Company designates certain derivatives as hedges of highly probable forecast transactions (cash flow hedges).
The Company documents, at the inception of the transaction, the relationship between hedging instruments and hedged items as well as its risk management objectives and strategy for undertaking various hedge transactions. The Company also documents its assessment, both at the inception and on an ongoing basis, of whether the derivatives that are used in hedging transactions are highly effective in offsetting changes in cash flows of hedged items.
a) Cash flow hedges The effective portion of the changes in fair value of derivatives that are designated and qualify as cash flow hedges is recognised in equity. The gain or loss relating to the ineffective portion is recognised immediately in the relevant line of the income statement which will be affected by the underlying hedged item.
Amounts accumulated in equity are reclassified and adjusted against the initial measurement of the underlying hedged item when the underlying hedged item is recognised on the balance sheet or in the income statement.
When a hedged instrument expires, is sold or when a hedge no longer meets the criteria for hedge accounting, hedge accounting is discontinued. Any cumulative gain or loss existing in equity at that time is held in equity until the forecast transaction occurs. When a forecast transaction is no longer expected to occur, the cumulative gain or loss that was reported in equity is immediately reclassified to the relevant line of the income statement which would have been affected by the forecast transaction.
b) Derivatives that do not qualify for hedge accounting Certain derivatives do not qualify for hedge accounting. Changes in fair value of any derivative instruments that do not qualify for hedge accounting are recognised immediately in the income statement.
Share capital Ordinary shares are classified as equity. Incremental costs directly attributable to the issue of new shares are shown as a deduction, net of tax, from the proceeds.
Where the Company purchases its own ordinary shares, the consideration paid, including any directly attributable incremental costs (net of income taxes), is deducted from equity attributable to the Company’s equity holders until the shares are cancelled or reissued. Where such ordinary shares are subsequently reissued, any consideration received, net of any directly attributable incremental transaction costs together with the related income tax effects, is included in equity attributable to the Company’s equity holders.
Debenhams plc Annual Report & Accounts 2017146
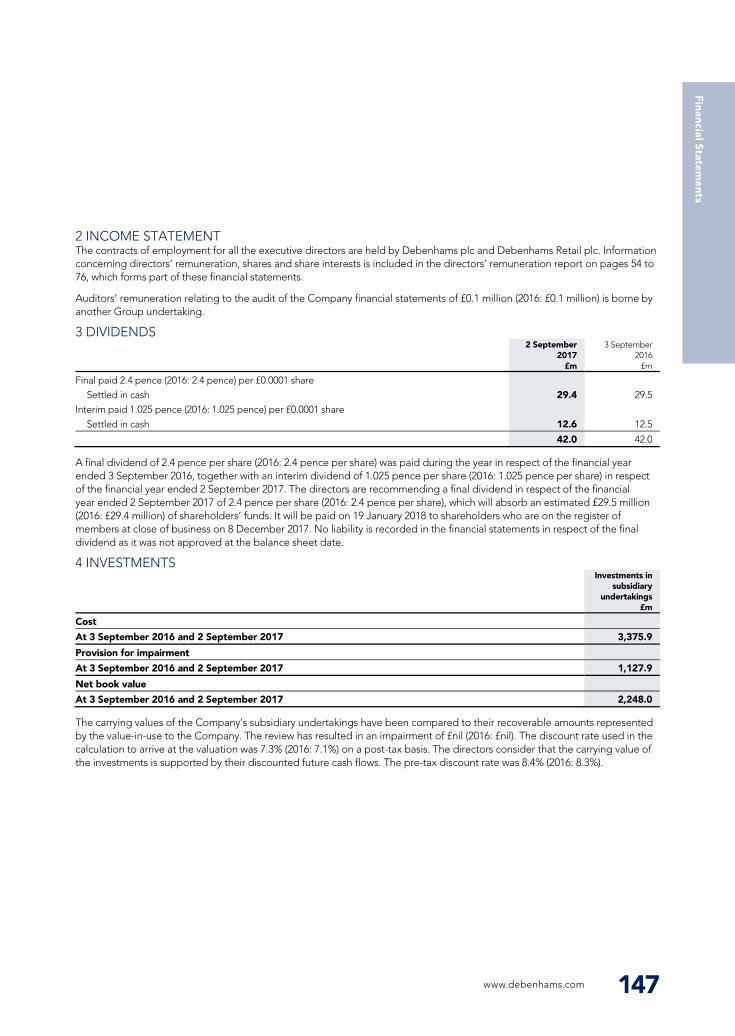
Notes to the Company financial statements For the financial year ended 2 September 2017 continued
146 Debenhams plc Annual Report & Accounts 2017
1 ACCOUNTING POLICIES CONTINUED Dividend distribution A final dividend distribution to the Company’s shareholders is recognised as a liability in the Company’s financial statements in the period in which the dividend is approved by the Company’s shareholders. Interim dividends are recognised when paid.
Share-based payments The Company issues equity-settled share-based payments to certain employees. A fair value for the equity-settled share awards is measured at the date of grant. The Company measures the fair value of each award using the Black-Scholes model where appropriate.
The fair value determined at the grant date is expensed on a straight-line basis over the vesting period, based on the Company’s estimate of the shares that will eventually vest and adjusted for the effect of non-market-based vesting conditions. At each balance sheet date, the Company revises its estimates of the number of awards that are expected to vest. Non-market performance and service conditions are included in assumptions about the number of awards that are expected to vest. The Company recognises the impact of the revision to original estimates, if any, in the income statement, with a corresponding adjustment to equity.
When the awards are exercised, the Company may issue new shares or utilise shares held as treasury shares or within the Debenhams Retail Employee Trust 2004. The proceeds received net of any directly attributable transaction costs are credited to share capital (at nominal value) and share premium when the awards are exercised.
Where the Company has granted options over the Company’s shares to employees of its subsidiaries, a capital contribution has been deemed made by the Company. This is then recharged to the subsidiary and is based on the fair value of the options issued spread over the option’s vesting period.
Foreign exchange Transactions denominated in foreign currencies are translated into the respective functional currency at the exchange rates prevailing at the dates of the transaction. Monetary assets and liabilities that are denominated in foreign currencies are translated into sterling at the closing rates ruling at the balance sheet date.
Derivatives The derivative instruments used by the Company to manage its interest rate risk are interest rate swaps.
Derivatives are initially recognised at fair value on the date a derivative contract is entered into and are subsequently remeasured at fair value. The method of recognising the resulting gain or loss depends on whether the derivative is designated as an effective hedging instrument and the nature
of the item being hedged. The Company designates certain derivatives as hedges of highly probable forecast transactions (cash flow hedges).
The Company documents, at the inception of the transaction, the relationship between hedging instruments and hedged items as well as its risk management objectives and strategy for undertaking various hedge transactions. The Company also documents its assessment, both at the inception and on an ongoing basis, of whether the derivatives that are used in hedging transactions are highly effective in offsetting changes in cash flows of hedged items.
a) Cash flow hedges The effective portion of the changes in fair value of derivatives that are designated and qualify as cash flow hedges is recognised in equity. The gain or loss relating to the ineffective portion is recognised immediately in the relevant line of the income statement which will be affected by the underlying hedged item.
Amounts accumulated in equity are reclassified and adjusted against the initial measurement of the underlying hedged item when the underlying hedged item is recognised on the balance sheet or in the income statement.
When a hedged instrument expires, is sold or when a hedge no longer meets the criteria for hedge accounting, hedge accounting is discontinued. Any cumulative gain or loss existing in equity at that time is held in equity until the forecast transaction occurs. When a forecast transaction is no longer expected to occur, the cumulative gain or loss that was reported in equity is immediately reclassified to the relevant line of the income statement which would have been affected by the forecast transaction.
b) Derivatives that do not qualify for hedge accounting Certain derivatives do not qualify for hedge accounting. Changes in fair value of any derivative instruments that do not qualify for hedge accounting are recognised immediately in the income statement.
Share capital Ordinary shares are classified as equity. Incremental costs directly attributable to the issue of new shares are shown as a deduction, net of tax, from the proceeds.
Where the Company purchases its own ordinary shares, the consideration paid, including any directly attributable incremental costs (net of income taxes), is deducted from equity attributable to the Company’s equity holders until the shares are cancelled or reissued. Where such ordinary shares are subsequently reissued, any consideration received, net of any directly attributable incremental transaction costs together with the related income tax effects, is included in equity attributable to the Company’s equity holders.
Notes to the Company financial statements For the financial year ended 2 September 2017
www.debenhams.com 147
2 INCOME STATEMENT The contracts of employment for all the executive directors are held by Debenhams plc and Debenhams Retail plc. Information concerning directors’ remuneration, shares and share interests is included in the directors’ remuneration report on pages 54 to 76, which forms part of these financial statements.
Auditors’ remuneration relating to the audit of the Company financial statements of £0.1 million (2016: £0.1 million) is borne by another Group undertaking.
3 DIVIDENDS
2 September 2017
£m
3 September 2016
£m
Final paid 2.4 pence (2016: 2.4 pence) per £0.0001 share Settled in cash 29.4 29.5
Interim paid 1.025 pence (2016: 1.025 pence) per £0.0001 share Settled in cash 12.6 12.5
42.0 42.0
A final dividend of 2.4 pence per share (2016: 2.4 pence per share) was paid during the year in respect of the financial year ended 3 September 2016, together with an interim dividend of 1.025 pence per share (2016: 1.025 pence per share) in respect of the financial year ended 2 September 2017. The directors are recommending a final dividend in respect of the financial year ended 2 September 2017 of 2.4 pence per share (2016: 2.4 pence per share), which will absorb an estimated £29.5 million (2016: £29.4 million) of shareholders’ funds. It will be paid on 19 January 2018 to shareholders who are on the register of members at close of business on 8 December 2017. No liability is recorded in the financial statements in respect of the final dividend as it was not approved at the balance sheet date.
4 INVESTMENTS
Investments in subsidiary
undertakings £m
Cost
At 3 September 2016 and 2 September 2017 3,375.9
Provision for impairment
At 3 September 2016 and 2 September 2017 1,127.9
Net book value
At 3 September 2016 and 2 September 2017 2,248.0
The carrying values of the Company’s subsidiary undertakings have been compared to their recoverable amounts represented by the value-in-use to the Company. The review has resulted in an impairment of £nil (2016: £nil). The discount rate used in the calculation to arrive at the valuation was 7.3% (2016: 7.1%) on a post-tax basis. The directors consider that the carrying value of the investments is supported by their discounted future cash flows. The pre-tax discount rate was 8.4% (2016: 8.3%).
www.debenhams.com 147
Financial Statem
ents
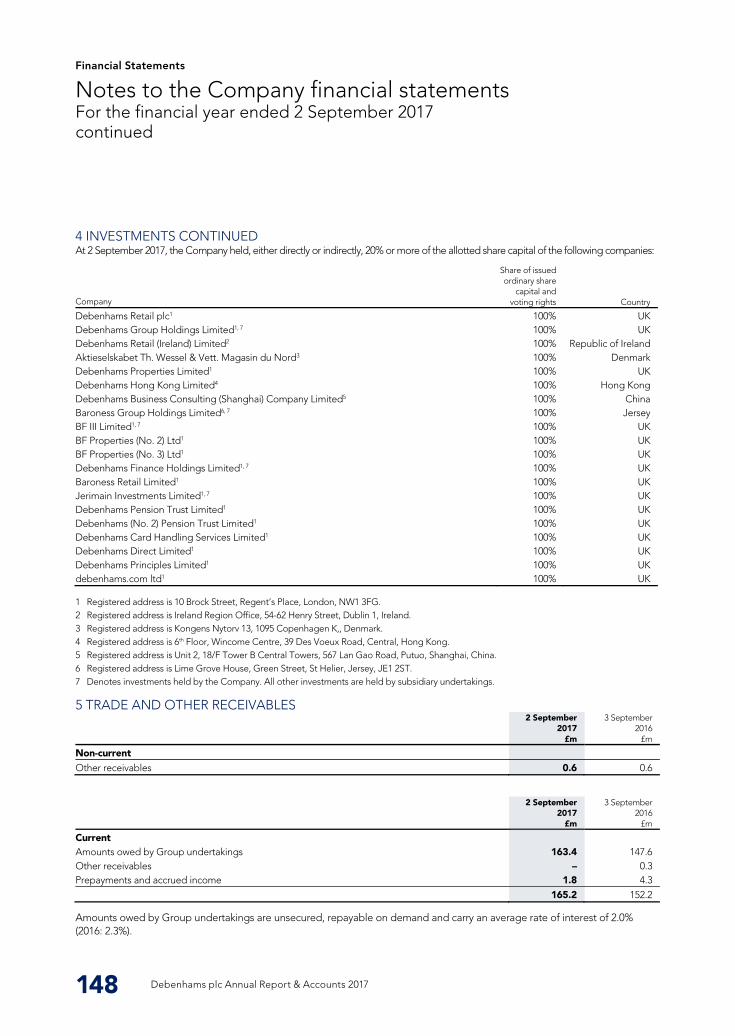
Financial Statements
Notes to the Company financial statements For the financial year ended 2 September 2017 continued
148 Debenhams plc Annual Report & Accounts 2017
4 INVESTMENTS CONTINUED At 2 September 2017, the Company held, either directly or indirectly, 20% or more of the allotted share capital of the following companies:
Company
Share of issued ordinary share
capital and voting rights Country
Debenhams Retail plc1 100% UK Debenhams Group Holdings Limited1, 7 100% UK Debenhams Retail (Ireland) Limited2 100% Republic of Ireland Aktieselskabet Th. Wessel & Vett. Magasin du Nord3 100% Denmark Debenhams Properties Limited1 100% UK Debenhams Hong Kong Limited4 100% Hong Kong Debenhams Business Consulting (Shanghai) Company Limited5 100% China Baroness Group Holdings Limited6, 7 100% Jersey BF III Limited1, 7 100% UK BF Properties (No. 2) Ltd1 100% UK BF Properties (No. 3) Ltd1 100% UK Debenhams Finance Holdings Limited1, 7 100% UK Baroness Retail Limited1 100% UK Jerimain Investments Limited1, 7 100% UK Debenhams Pension Trust Limited1 100% UK Debenhams (No. 2) Pension Trust Limited1 100% UK Debenhams Card Handling Services Limited1 100% UK Debenhams Direct Limited1 100% UK Debenhams Principles Limited1 100% UK debenhams.com ltd1 100% UK
1 Registered address is 10 Brock Street, Regent’s Place, London, NW1 3FG. 2 Registered address is Ireland Region Office, 54-62 Henry Street, Dublin 1, Ireland. 3 Registered address is Kongens Nytorv 13, 1095 Copenhagen K,, Denmark. 4 Registered address is 6th Floor, Wincome Centre, 39 Des Voeux Road, Central, Hong Kong. 5 Registered address is Unit 2, 18/F Tower B Central Towers, 567 Lan Gao Road, Putuo, Shanghai, China. 6 Registered address is Lime Grove House, Green Street, St Helier, Jersey, JE1 2ST. 7 Denotes investments held by the Company. All other investments are held by subsidiary undertakings.
5 TRADE AND OTHER RECEIVABLES
2 September 2017
£m
3 September 2016
£m
Non-current
Other receivables 0.6 0.6
2 September 2017
£m
3 September 2016
£m
Current Amounts owed by Group undertakings 163.4 147.6 Other receivables – 0.3 Prepayments and accrued income 1.8 4.3
165.2 152.2
Amounts owed by Group undertakings are unsecured, repayable on demand and carry an average rate of interest of 2.0% (2016: 2.3%).
Debenhams plc Annual Report & Accounts 2017148
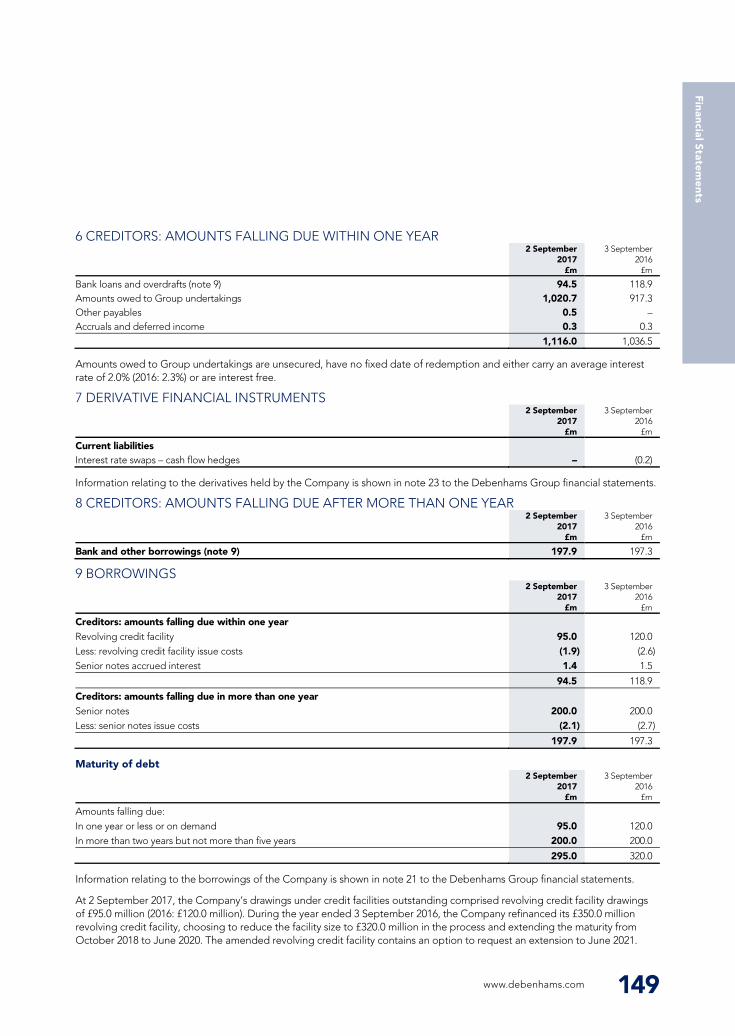
Notes to the Company financial statements For the financial year ended 2 September 2017 continued
148 Debenhams plc Annual Report & Accounts 2017
4 INVESTMENTS CONTINUED At 2 September 2017, the Company held, either directly or indirectly, 20% or more of the allotted share capital of the following companies:
Company
Share of issued ordinary share
capital and voting rights Country
Debenhams Retail plc1 100% UK Debenhams Group Holdings Limited1, 7 100% UK Debenhams Retail (Ireland) Limited2 100% Republic of Ireland Aktieselskabet Th. Wessel & Vett. Magasin du Nord3 100% Denmark Debenhams Properties Limited1 100% UK Debenhams Hong Kong Limited4 100% Hong Kong Debenhams Business Consulting (Shanghai) Company Limited5 100% China Baroness Group Holdings Limited6, 7 100% Jersey BF III Limited1, 7 100% UK BF Properties (No. 2) Ltd1 100% UK BF Properties (No. 3) Ltd1 100% UK Debenhams Finance Holdings Limited1, 7 100% UK Baroness Retail Limited1 100% UK Jerimain Investments Limited1, 7 100% UK Debenhams Pension Trust Limited1 100% UK Debenhams (No. 2) Pension Trust Limited1 100% UK Debenhams Card Handling Services Limited1 100% UK Debenhams Direct Limited1 100% UK Debenhams Principles Limited1 100% UK debenhams.com ltd1 100% UK
1 Registered address is 10 Brock Street, Regent’s Place, London, NW1 3FG. 2 Registered address is Ireland Region Office, 54-62 Henry Street, Dublin 1, Ireland. 3 Registered address is Kongens Nytorv 13, 1095 Copenhagen K,, Denmark. 4 Registered address is 6th Floor, Wincome Centre, 39 Des Voeux Road, Central, Hong Kong. 5 Registered address is Unit 2, 18/F Tower B Central Towers, 567 Lan Gao Road, Putuo, Shanghai, China. 6 Registered address is Lime Grove House, Green Street, St Helier, Jersey, JE1 2ST. 7 Denotes investments held by the Company. All other investments are held by subsidiary undertakings.
5 TRADE AND OTHER RECEIVABLES
2 September 2017
£m
3 September 2016
£m
Non-current
Other receivables 0.6 0.6
2 September 2017
£m
3 September 2016
£m
Current Amounts owed by Group undertakings 163.4 147.6 Other receivables – 0.3 Prepayments and accrued income 1.8 4.3
165.2 152.2
Amounts owed by Group undertakings are unsecured, repayable on demand and carry an average rate of interest of 2.0% (2016: 2.3%).
www.debenhams.com 149
6 CREDITORS: AMOUNTS FALLING DUE WITHIN ONE YEAR
2 September 2017
£m
3 September 2016
£m
Bank loans and overdrafts (note 9) 94.5 118.9 Amounts owed to Group undertakings 1,020.7 917.3 Other payables 0.5 – Accruals and deferred income 0.3 0.3
1,116.0 1,036.5
Amounts owed to Group undertakings are unsecured, have no fixed date of redemption and either carry an average interest rate of 2.0% (2016: 2.3%) or are interest free.
7 DERIVATIVE FINANCIAL INSTRUMENTS
2 September 2017
£m
3 September 2016
£m
Current liabilities Interest rate swaps – cash flow hedges – (0.2)
Information relating to the derivatives held by the Company is shown in note 23 to the Debenhams Group financial statements.
8 CREDITORS: AMOUNTS FALLING DUE AFTER MORE THAN ONE YEAR
2 September 2017
£m
3 September 2016
£m
Bank and other borrowings (note 9) 197.9 197.3
9 BORROWINGS
2 September 2017
£m
3 September 2016
£m
Creditors: amounts falling due within one year Revolving credit facility 95.0 120.0 Less: revolving credit facility issue costs (1.9) (2.6) Senior notes accrued interest 1.4 1.5
94.5 118.9
Creditors: amounts falling due in more than one year Senior notes 200.0 200.0 Less: senior notes issue costs (2.1) (2.7)
197.9 197.3
Maturity of debt
2 September 2017
£m
3 September 2016
£m
Amounts falling due: In one year or less or on demand 95.0 120.0 In more than two years but not more than five years 200.0 200.0
295.0 320.0
Information relating to the borrowings of the Company is shown in note 21 to the Debenhams Group financial statements.
At 2 September 2017, the Company’s drawings under credit facilities outstanding comprised revolving credit facility drawings of £95.0 million (2016: £120.0 million). During the year ended 3 September 2016, the Company refinanced its £350.0 million revolving credit facility, choosing to reduce the facility size to £320.0 million in the process and extending the maturity from October 2018 to June 2020. The amended revolving credit facility contains an option to request an extension to June 2021.
www.debenhams.com 149
Financial Statem
ents
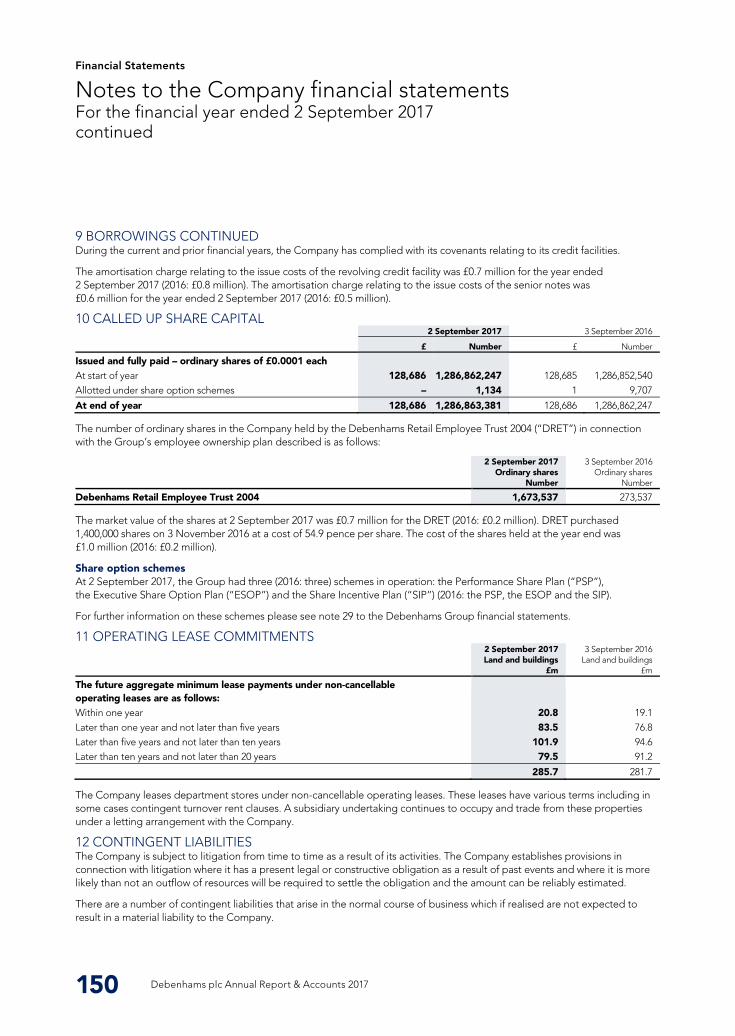
Financial Statements
Notes to the Company financial statements For the financial year ended 2 September 2017 continued
150 Debenhams plc Annual Report & Accounts 2017
9 BORROWINGS CONTINUED During the current and prior financial years, the Company has complied with its covenants relating to its credit facilities.
The amortisation charge relating to the issue costs of the revolving credit facility was £0.7 million for the year ended 2 September 2017 (2016: £0.8 million). The amortisation charge relating to the issue costs of the senior notes was £0.6 million for the year ended 2 September 2017 (2016: £0.5 million).
10 CALLED UP SHARE CAPITAL 2 September 2017 3 September 2016
£ Number £ Number
Issued and fully paid – ordinary shares of £0.0001 each At start of year 128,686 1,286,862,247 128,685 1,286,852,540 Allotted under share option schemes – 1,134 1 9,707
At end of year 128,686 1,286,863,381 128,686 1,286,862,247
The number of ordinary shares in the Company held by the Debenhams Retail Employee Trust 2004 (“DRET”) in connection with the Group’s employee ownership plan described is as follows:
2 September 2017 Ordinary shares
Number
3 September 2016 Ordinary shares
Number
Debenhams Retail Employee Trust 2004 1,673,537 273,537
The market value of the shares at 2 September 2017 was £0.7 million for the DRET (2016: £0.2 million). DRET purchased 1,400,000 shares on 3 November 2016 at a cost of 54.9 pence per share. The cost of the shares held at the year end was £1.0 million (2016: £0.2 million).
Share option schemes At 2 September 2017, the Group had three (2016: three) schemes in operation: the Performance Share Plan (“PSP”), the Executive Share Option Plan (“ESOP”) and the Share Incentive Plan (“SIP”) (2016: the PSP, the ESOP and the SIP).
For further information on these schemes please see note 29 to the Debenhams Group financial statements.
11 OPERATING LEASE COMMITMENTS
2 September 2017 Land and buildings
£m
3 September 2016 Land and buildings
£m
The future aggregate minimum lease payments under non-cancellable operating leases are as follows: Within one year 20.8 19.1 Later than one year and not later than five years 83.5 76.8 Later than five years and not later than ten years 101.9 94.6 Later than ten years and not later than 20 years 79.5 91.2
285.7 281.7
The Company leases department stores under non-cancellable operating leases. These leases have various terms including in some cases contingent turnover rent clauses. A subsidiary undertaking continues to occupy and trade from these properties under a letting arrangement with the Company.
12 CONTINGENT LIABILITIES The Company is subject to litigation from time to time as a result of its activities. The Company establishes provisions in connection with litigation where it has a present legal or constructive obligation as a result of past events and where it is more likely than not an outflow of resources will be required to settle the obligation and the amount can be reliably estimated.
There are a number of contingent liabilities that arise in the normal course of business which if realised are not expected to result in a material liability to the Company.
Debenhams plc Annual Report & Accounts 2017150
Related Documents