University Politehnica of Bucharest Doctoral School of Entrepreneurship, Engineering and Business PhD Thesis Increasing telecommunication service performance through statistical analysis Doctoral student: Mohammad Abiad Scientific coordinator Prof. habil. dr.ing. Sorin Ionescu Fundamental Domain: Engineering Sciences Doctoral Field: Industrial Engineering Bucharest 2021

Welcome message from author
This document is posted to help you gain knowledge. Please leave a comment to let me know what you think about it! Share it to your friends and learn new things together.
Transcript
University Politehnica of Bucharest
Doctoral School of Entrepreneurship, Engineering and Business
PhD Thesis
Increasing telecommunication service
performance through statistical analysis
Doctoral student: Mohammad Abiad
Scientific coordinator
Prof. habil. dr.ing. Sorin Ionescu
Fundamental Domain: Engineering Sciences
Doctoral Field: Industrial Engineering
Bucharest 2021
2
Index Abstract .......................................................................................................................................... 3
Introduction ................................................................................................................................... 4
Chapter 1: Telecommunication System ........................................................................................ 5
Chapter 2: State of the Art - Telecommunication Equipment and Maintenance .......................... 7
Chapter 3: State of the Art – Analysis of Customer Relationship ................................................ 9
Chapter 4: Statistical Research Methodology ............................................................................. 11
Chapter 5: Statistical Application made in telecommunication Sector ....................................... 14
Chapter 6: Procedures for Telecommunication Management ..................................................... 20
Chapter 7: Conclusion of the thesis ............................................................................................ 25
Summary of Published Articles ................................................................................................. 27
Letter of Interest from Telecommunications Company .......................................................... 28
Bibliography ................................................................................................................................ 29
List of Figures 1: Phases of the thesis ..................................................................................................................... 4
1.1: Telecommunication System .................................................................................................... 5
4.1: Decision Tree Basic Layers ................................................................................................... 13
5.1: Equipment’s Tracking Information for Equipment’s daily Overload ................................... 15
5.2: Example of MSP expectation for a specific customer under certain input values ................ 16
5.3: CS-CR matrix ........................................................................................................................ 18
6.1: Algorithm for Predictive Maintenance Procedure ................................................................. 21
6.5: Algorithm for Customers’ Satisfaction Procedure ................................................................ 22
6.6: Algorithm for Customers' Satisfaction-Retention Procedure ................................................ 23
6.7: Algorithm for Customer Churn Procedure ............................................................................ 24
List of Tables 5.1: Algorithm Output Warning Message .................................................................................... 15
5.2: Algorithm Output Detailed Information Message ................................................................. 17
5.3: Groups of customers that show churn in Decision Tree analysis .......................................... 17
5.4: ANOVA (Overall Satisfaction vs. Size of companies) ......................................................... 19
3
Abstract
The purpose of this thesis is to increase the performance of the communication service
through statistical methodologies. Therefore, in order to improve the overall efficiency
of telecommunications services, the objective of our study is to improve the
management system for telecommunications companies. Telecommunication
infrastructure consists of different types of equipment working under the supervision
of staff to provide end-users with services. As a result, we aim to accomplish two
immediate objectives: At first, Improving the life of the equipment by introducing a
successful predictive maintenance plan to increase the equipment's reliability and
availability; Secondly, increasing and maintaining the number of service providers'
customers by a useful customer relationship study based on Satisfaction, Retention,
Loyalty, Attraction and Customer Churn Analysis.
Previous studies were reviewed primarily through a literature review to define the
operating indicators of the equipment as well as key indicators for customer
relationship management. Different statistical methodologies were identified and used
in the thesis, such as Mean Time Between Failures, Reliability, Regression, K-means
Clustering and Classification using Decision Tree. These methodologies were tested
using applications for predictive maintenance, Customer Relationship analysis, and
Customer Churn Analysis.
As a result of our analysis, four procedures were generated to complete the
management system of service providers and help to implement different strategies that
enhances their performance. The first procedure aims to make predictive maintenance
for telecommunication equipment which aims to improve the equipment’s reliability
and provide the service provider a message for the next expected failure, the second
procedure is to analyze a single indicator for customer relationship which defines the
significant factors for such indicator, the third procedure was built to make a cross
analysis of two indicators and generate groups of customers using k-means clustering
technique, and finally the fourth procedure includes the concept of customer churn
analysis of which classification of customers takes place using Binary Logistic
regression Model as well as Decision tree Classification. Applications in the thesis were
conducted in Kuwait telecommunication market and the generated procedures were
evaluated by one of the leading mobile service providers.

4
Introduction
The telecommunications companies are going through further acts and difficulties when they need
to meet the changing demand and competition. Customers are looking for a good service quality,
a low price and an exemplary customer relationship. Service providers are eager to boost their
quality of service in order to gain the confidence and loyalty of their customers. Companies
offering telecommunications services need statistics so that they can anticipate customer behavior
and evaluate the performance of the equipment, which helps to boost the overall system
performance. The study concentrated on two objectives: ‘growing the life of the equipment’ to
enhance the service quality which will lead to gain customers’ satisfaction and ‘increasing and
retaining the number of subscribers’ to enhance their profitability. The phases of the thesis are split
into three major concepts, which is summarized by the following figure:
The thesis is designed to include an introduction followed by seven chapters of which the main
contribution of this analysis is to reach procedures for managers to apply when planning to enhance
their overall performance.
Figure 1: Phases of the thesis
5
Chapter 1
Telecommunication System
The global communication network has been an extremely significant subject of creativity in
recent years. The telecommunications company is also a system, which has equipment and
employees that provide services to the different types of customers. In order to have more market
advantages and maximize the benefit, managers in the telecommunications industry aim to offer a
broad variety of services of the highest standard according to customer needs. Therefore, it is
appropriate to concentrate on the layout of the network, the equipment reliability, investigation on
the metrics for a successful relationship between customers and providers, and understand issues
that may occur in the telecommunication system from various perspectives.
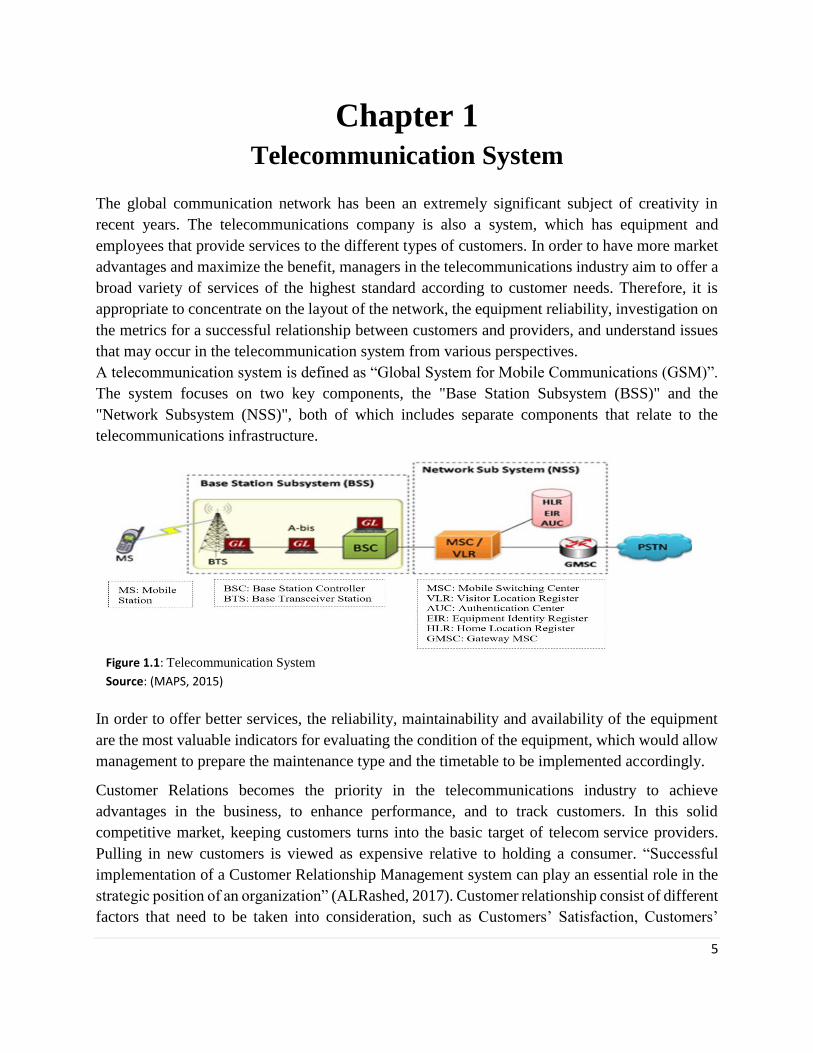
A telecommunication system is defined as “Global System for Mobile Communications (GSM)”.
The system focuses on two key components, the "Base Station Subsystem (BSS)" and the
"Network Subsystem (NSS)", both of which includes separate components that relate to the
telecommunications infrastructure.
In order to offer better services, the reliability, maintainability and availability of the equipment
are the most valuable indicators for evaluating the condition of the equipment, which would allow
management to prepare the maintenance type and the timetable to be implemented accordingly.
Customer Relations becomes the priority in the telecommunications industry to achieve
advantages in the business, to enhance performance, and to track customers. In this solid
competitive market, keeping customers turns into the basic target of telecom service providers.
Pulling in new customers is viewed as expensive relative to holding a consumer. “Successful
implementation of a Customer Relationship Management system can play an essential role in the
strategic position of an organization” (ALRashed, 2017). Customer relationship consist of different
factors that need to be taken into consideration, such as Customers’ Satisfaction, Customers’
Figure 1.1: Telecommunication System
Source: (MAPS, 2015)
6
Retention, Customers’ Loyalty and Customers’ Attraction. In addition, Customer Churn analysis
is an important element in customer relationship as the performance of the service providers and
their customers’ behavior are measured by the churn rate.
Problems arises in the telecommunication sector could be studied from both perspectives
“Experts” (Experienced employees in telecommunication companies) and “Customers” and can
be classified as Technical problems that affect the offering of the service, and service problems
that reflects the quality and relationship problems with customers.
Technical problems: Such problems occur in the equipment parts of the telecommunication
system. It takes a lot of equipment working together correctly to keep the network running.
That means monitoring not only the base telecom equipment, but also all the equipment that
supports it and the environmental conditions that all the equipment requires to operate
correctly. Experts classified things that should be monitored into four categories:
o Telecom and transport equipment
o Power supplies
o Environmental conditions
The Key Performance Indicator (KPI) of telecom service providers could be summarized as
o Drop Call Rate (DCR)
o Congestion
o Interference
o Handover
Service Problems: Problems that may arise in the telecommunication system can be also those
related to the service provided such as call drops, network coverage or availability, poor
internet speed, prices and offers, call center availability and roaming options which are the
main problems or complaints raised by customers of Service providers.
Therefore, in the telecommunications sector, it is essential to concentrate on customer relationship
and the capability of equipment. Equipment seems to have a part to play in enhancing the service
and thereby obtaining consumer satisfaction, and customer relationships to understand the
behavior of customers. We contributed in the chapter by reviewing the structure and function of
telecommunications networks, how service operates, the role of the equipment in this process, and
the various problems that could arise in this sector from both customers and engineers'
perspectives. Further, we outlined the key indicators in customer relationship between customers
and service providers. This allowed us to set the immediate goal of the study and how to
accomplish the ultimate outcome.
7
Chapter 2 State of the Art - Telecommunication Equipment and
Maintenance
The role of equipment in telecommunication networks is to efficiently provide communication
services. Telecom towers, switches and routers are a few examples of telecommunication
equipment. “Telecommunication equipment is any hardware used for telecommunication
purposes. It includes a wide range of communication technologies” (Thomas, 2020). Telecom
towers, switches, routers, Private Branch Exchange (PBX) equipment and Voice Over Internet
Protocol (VoIP) equipment are a few examples of telecommunication equipment.
Telecommunication equipment is the most important part for service providers, since it provides
the service to customers and hence it has direct influence on customer relationship and the success
of the service-based businesses.
Telecommunication equipment has been reviewed for its energy consumption and the significance
of maintenance to optimize performance. Multiple statistical approaches were applied to measure
the most effective maintenance intervention that needs to be taken to maximize the lifetime of the
equipment. Aspects such as "Original Equipment Manufacturer", "Cost Efficiency of
Telecommunications Equipment", "Stock Efficiency of Telecommunications Equipment" and
"Total Productive Maintenance" must be considered when targeting the equipment efficiency.
An Original Equipment Manufacturer (OEM) is a corporation that makes components and
equipment, but is capable of selling` them under another company's brand. “To reduce cost and
gain competitive advantage, original equipment manufacturers (OEMs) around the world have
continued their aggressive sourcing from China” (Subramanian et al., 2014). “Cost savings is the
most frequently mentioned motivation for sourcing from China” (Kerkhoff et al., 2017). (Thomas,
2020) has mentioned that Huawei, Cisco Systems, Fujitsu, NEC Corporation, Nokia, Ericsson and
Qualcomm are the leading telecom equipment companies worldwide.
The cost-effectiveness of equipment is determined by many variables, such as the usage of
electricity, the cost of cooling, the on/off switching of base stations, the use of hybrid energy
systems as well as the integration of new technologies. “It is observed that almost 50% of the
power consumption is due to the operation of telecommunication networks” (Koutitas &
Demestichas, 2010). “70% mobile towers in India face electrical grid outages in excess of 8 hours
a day” (Zhang et al., 2010). Therefore, the site should have a generator and/or battery bank in order
to support the tower, which is dependent on the amount of the BTS it holds.
“Currently over 80% of the power in mobile telecommunications is consumed in the base stations”
(Richter et al., 2009). “Turning off the power amplifiers is often more convenient than keeping
them idle" (Chatzipapas et al., 2011). The Closest Distance as well as the Efficiency First are two
strategies that are used to decide whether to switch on/off the BS. Other strategies can be used for
8
the purpose of reducing the switching cost is to switch off the BS that has zero load or those BS
that has UE that can be transferred to another BS. The base station contains the diesel generator,
batteries, a clean energy grid, as well as wind turbines and solar panels. “A 40~90% reduction in
fuel consumption by the diesel generator (DG) with the solar hybrid system. 90% can be reduced
as well on the operation and maintenance cost (OPEX)” (Oviroh et al., 2018). The optimal solution
for powering a BS can be using different energy for different durations. “The majority of firms
adapt their strategies because of the massive reduction in costs associated with cloud services”
(Khalil, 2019). “Spare parts holding costs are known to be significant contributors to the overall
operating costs” (Eruguz et al., 2018).
Total Productive Maintenance (TPM) is designed to increase the performance and reliability of the
facilities and is used as a central function of the quality management system. It seeks to increase
efficiency by maintaining adequate maintenance in order to reduce losses, such as breakages,
availability of machinery, slight stoppages affecting the reliability of the equipment and lowering
the level of output. “Maintenance clearly affects component and system reliability” (Endrenyi et
al., 2001). Total Productive Maintenance seeks to increase the quality of equipment. “TPM aims
for zero defects and zero accidents while engaging operators to be 100% involved and committed”
(Agustiady & Cudney, 2018). Breakdown maintenance, Periodic maintenance, Predictive
maintenance, Preventive maintenance and Corrective maintenance are different types of
maintenance actions.
Breakdown maintenance represents the maintenance of which the repair begins after the full
breakdown of the equipment
Periodic maintenance is a time-based maintenance, that is, the maintenance is done according
to predefined schedule and not related to the status of the equipment.
Predictive maintenance is a technique employed in an enterprise to reduce the operating
expense to offer good quality of operation without interruptions of service.
Preventive maintenance is used to avoid or delay errors. During the operational phase,
maintenance take place and performed to critical equipment.
Corrective maintenance is a type of system maintenance, that occurs when a system
breakdown or problem exists.
Each of these maintenance types can be applied in different situation and for different purposes
all, of which they target to enhance the equipment reliability.
Our contribution in this chapter was to demonstrate the numerous forms of maintenance actions
used in the literature, as well as the cost-effectiveness of telecommunications equipment.
Eventually, through the usage of Predictive Maintenance, the reliability of the equipment is mainly
perceived to be the most important factor to be measured in order to boost the lifetime of the
equipment. This would contribute to improving the reliability of the equipment, improving the
quality of service and achieving customer satisfaction.
9
Chapter 3 State of the Art – Analysis of Customer Relationship
Telecommunications service providers are trying to boost their efficiency and increase their
income. The core of revenue for such businesses comes from their customers, individual customers
as well as company-based customers. Gaining comparative advantages between organizations
substantially achieved by effective customer experience management, and by understanding the
consumers well, would be the first step towards achieving this goal. Customer satisfaction is a
crucial factor in the growth of telecommunications service providers. Healthy working
relationships contribute to improved sales, as well as offer advantages to the service provider in a
competitive environment. The aim of telecommunications companies is to retain existing
subscribers while simultaneously growing total revenues of their line of services. My contribution
in this chapter was therefore to examine the main customer interaction indicators (Satisfaction,
Retention, Loyalty, Attraction and Churn Analysis) and to illustrate the important influences of
each variable as well as the factors that have a direct effect on the rise in the churn rate. This will
be useful for management as it helps identify the key indicators in customer relationship analysis
that helps in understanding customers’ behavior and building valuable strategies. In addition, a
review has been added for the statistical methodologies that has been applied in research for
customer relationship.
Customer satisfaction is critical for mobile service providers' efficiency. “Satisfied customers
buy a product again, talk favorably to others about the product, pay less attention to competing
brands and advertising” (Kotler & Armstrong, 2018). When evaluating the telecommunication
industry as a whole, it is essential to note the variables that greatly impact the level of
satisfaction for the customers. Customers are of two types, the Individual Customers and
Company-based Customers. For Individual based customers, factors that significantly affect
the level of satisfaction are such as Service Quality, Price, Employees, Customers’
expectations, how the service provider react on customers’ complaints and many other factors
which is related to the methods of communication and payments used by the service provider.
“There exists a positive relationship between the service quality and the customer satisfaction”
(Afthanorhan et al., 2019). As for the Company-based customers, satisfaction will be affected
by different factors which is verified normally due to the type of customer and the type of
services the company-based customers are in need. The internet Speed, Affordability of
services, Security traits and Value-added services are some the significant factors that enhances
the level of satisfaction for such type of customers.
Customer retention for service companies is an integral aspect of their enterprises. “Customer
Retention is a part of customer relationship management” (Sulaimon et al., 2016). Customers’
Retention is nowadays a critical point to mobile service providers with this competitive and
saturated market. Mobile Service Providers are more into checking the factors that can
10
significantly affect customers’ decision and try to retain them by working on these factors,
these factors are such as: Mobile Network Portability, Barriers to Switch Offered Services,
Promotion, Brand Image, Price compared to other MSP and some other factors related to
demographic variables, Customers' satisfaction, Active on Social Media and the service of
online live chat.
Customer Loyalty is defined as “a commitment to continue to do a business or exchange with
a particular company on an ongoing basis” (Zineldin, 2006). Loyal customers are hard to churn
and hence the mobile service provider will benefit from these customers by increasing their
sales and profit. “Service quality was positively and significantly related to customer loyalty”
(Bhuian et al., 2018). Scholar have introduced several significant factors for the key indicator
customer’s loyalty, these factors are such as Customer Satisfaction, Service Quality, Brand
Image and Customer Value, Service Reliability and Assurance, Commitment and Switching
Cost and more.
Attracting a new customer in telecommunication sector became the most difficult part that a
company can face, especially with this saturated market as well as matured customers.
“Attraction and relationship value are highly related concepts” (Ellegaard & Ritter, 2006).
Managerial plans are to be implemented successfully so that customers to be attracted, and one
of these plans is to invest on technology, works on improving the brand image, offer affordable
prices for the services as well as adding exclusive offers that targets the population. Scholars
have listed different factors that might affect customers and attract them to a specific service
provider, such factors are like Technology, Branding, Price, Offers and Social responsibility.
Customer Churn is an important field of study for mobile service providers to understand their
customer’s behavior and enhance the relationship with them. Customer Churn is the situation
of a consumer quitting an institution, irrespective of whether or not to enter a lucrative one.
“Customer Churn has a huge impact on companies” (Mahajan et al., 2017). “Decreasing the
churn rate by 5% increases the profit from 25% to 85%” (Kotler, 1997). In the literature,
Demographic and non-Demographic factors showed significant effect on customer churn
analysis, these factors are such as Age, Nationality, Gender, Years of Experience, Monthly
Bill, Service Quality, Brand Image, Promotion and Customer Service Team.
Therefore, the contribution of this chapter was to provide the management with a thorough look at
the major variables that have a considerable effect on each of the Customer Relationship key
indicators.
11
Chapter 4
Statistical Research Methodology
Telecommunication sector is one of the sectors that is based on services where both equipment
and customer relationship are the backbone of the organization, and the success of such
organization will be based on the success of handling an excellent relationship with their
customers. “Statistics is a science that helps us make decisions and draw conclusions in the
presence of variability” (Montgomery & Runger, 2014). There are different types of statistics that
could be applied based on the case of study.
In telecommunication sector, we could focus on equipment reliability, maintainability and
availability to increase the quality of service delivered and therefore gain customers’ satisfaction.
Moreover, another application in statistics is to understand the behavior of customers and define
the significant variables that has important role in customer relationship analysis, this is done
through powerful analytical and statistical tools and techniques such as Explanatory and
Confirmatory Factor Analysis, Regression and Analysis of Variance (ANOVA), Clustering
Analysis as well as Classification Analysis.
Business Engineering are usually using statistics in order to test their claims and make significant
decisions. Our key contribution is to describe the statistical approaches used to improve the
equipment's reliability and the relationship between customers and service providers. At first, in
this chapter, we went through the statistical stages that are considered basics for running any
statistical analysis, such stages are the data collection, data visualization, data analysis and the
conclusion. In the data analysis stage, the following are the most commonly used statistical
methodologies in this domain:
The reliability function is defined by the following expression (Hafaifa et al., 2016):
𝑅(𝑡) = 1 − 𝐹(𝑡) 𝑓𝑜𝑟 𝑡 > 0
The most common maintenance metric used in telecommunications networks is “MTBF (Mean
Time Between Failures), MTTR (Mean Time to Repair) or MDT (Mean downtime)” (Durivage,
2015). Availability is described as "A measure of the degree to which an item or system is in
an operable and committable state at the start of a mission when the mission is called for an
unknown time" (Ayers, 2012). Inherent availability is calculated as
𝐴𝑖 =𝑀𝑇𝐵𝐹
𝑀𝑇𝐵𝐹+𝑀𝑇𝑇𝑅
Data Reliability: It provides an information about whether the responders have consistency in
their responses for the questions. The use of statistical packages makes it easy for users to
measure the value of Cronbach's alpha, because when the value for a given attribute is greater
than 0.7 then the outcome is known to be a positive indicator of internal consistency as the result
of a good association to be expected. “Cronbach alpha values of 0.7 or higher indicate
acceptable internal consistency” (Taber, 2018).
12
Data Validity: It verifies whether the independent variables measure what they are supposed to
measure. This can be verified by checking the importance of the coefficient of association
between variables. Various types of correlation coefficients may be used, such as the Pearson
and Spearman correlation coefficient. “The values of all correlation coefficients should be
within the range of -1 and +1” (Schober et al., 2018). Significant correlation is when p-value of
the test result is small, that is lower than 0.05 and, in this case, we can assume the data validity.
Principal Component Analysis (PCA): It is a method of reducing the components under study
by defining the kind of correlation between the identified independent variables. Moreover, the
PCA can spot on the difference of the direction of variables, that is, it highlights the variables
that were measured in a different scale order. The PCA provides a table showing the number of
factors that the input factors can represent. Once you know the number of reduced factors, you
will need to look at the rotated component matrix in order to determine which variables is best
combined with each other; This is known by looking at the highest value in the component
matrix output of each factor and then we check to which component it belongs.
Confirmatory factor Analysis (CFA): The CFA helps to determine which factors taken under
study is more effective on each of the mentioned latent factors for Satisfaction and Retention.
"In CFA, researchers can specify which measured variable is related to which latent variable"
(CFA, 2020). CFA model uses the maximum likelihood estimation of which its performance
is to be checked using AMOS software. When running the CFA, there will be a stage where the
trial and error approach are expected to find the right mix of variables that can be used in the
analysis. To calculate the efficiency of the CFA, different statistical models are used and typical
statistical models to use are such as CMIN/DF, RMR, SRMR, CFI, RSMEA, GFI and NFI.
AMOS, R, Stata are some examples of statistical software that can run the CFA.
Regression Analysis: The collection of statistical tools that are used to model and explore
relationships between variables that are related in a nondeterministic manner is called regression
analysis. Regression analysis is used for prediction purposes, "Logistic regression is used to
predict a categorical variable from a set of predictor variables" (Core.ecu.edu, 2019).
Regression analysis is also used to enhance the operational efficiency of a company and
highlights the significant factors on each area. The general equation generated by the regression
analysis can be summarized as follow:
y = 𝑎 + 𝑏1𝑥1 + 𝑏2𝑥2 + ⋯ + 𝑏𝑛𝑥𝑛
The dependent variable in the Binary Logistic Regression is 𝑦 = (𝑙𝑜𝑔(𝑝
1−𝑝)) and p is the
probability that the depended variables has a value equals to 1. The output of the Regression
Analysis includes the coefficient of determination 𝑅2value of which it represent the percentage
of variation in the dependent variable that is explained by the independent.
Clustering Analysis: "The main purpose of clustering is to divide the data set into K classes"
(Liu & Zhang, 2020). "Clustering is the process of partitioning or grouping a given set of
patterns into disjoint clusters" (Alsabti et al., 1997). There are many clustering techniques that
can be used, and the K-Means clustering algorithm is one of the commonly popular clustering

13
algorithms. K-Means works by center approach; At first, it creates centers for each cluster
randomly, then it calculates the distance from each point to the centers and generate the groups,
the averages will be calculated of each group to create new centers and the same process is
repeated until the center of clusters will not be changed. The distances calculated in the
clustering algorithm could be Euclidean Distance, Manhattan Distance, Chebyshev
Distance…etc. this will be related to the type of data and analysis.
Classification Analysis: In telecommunication sector, the classification analysis can be used in
churn customer analysis. Different statistical methodologies can be used for customer churn
analysis, and the most commonly used methodologies are the Binary Logistic Regression and
the Decision Tree classification algorithm. The performance of the classification output can be
checked and compared through the Classification Accuracy, Sensitivity and Specificity
measures. "Mobile Operators prefer models with high sensitivity " (Hassouna et al., 2015).
𝐴𝑐𝑐𝑢𝑟𝑎𝑐𝑦 =𝑇𝑃+𝑇𝑁
𝑇𝑃+𝐹𝑁+𝐹𝑃+𝑇𝑁,
𝑆𝑒𝑛𝑠𝑖𝑡𝑖𝑣𝑖𝑡𝑦 =𝑇𝑃
𝑇𝑃+𝐹𝑁 and
𝑆𝑝𝑒𝑐𝑖𝑓𝑖𝑐𝑖𝑡𝑦 =𝑇𝑁
𝑇𝑁 + 𝐹𝑃
I. Binary Logistic Regression for Classification: The Model Significance Table, the Model
Summary, the Classification Table and the Coefficients Table variables are used in the
outputs of the Binary Logistic Regression Process. The Classification Table consists of two
parts, the false positive as well as the false negative classification. False positive means that
when you predict the occurrence of the event while in reality it will not occur. Whereas the
False negative is the opposite case, that is, you do not predict the occurrence while in reality
the event occurs.
II. Decision Tree Classification Model: A Decision Tree (DT) is a well-defined system of
classification and is a collection of nodes positioned in a hierarchical structure. The basics
layers of a decision tree are displayed in figure 4.1:
There are different algorithms that are used to build a Decision Tree; the most commonly
used is the J48. DT can be easily made using statistical software such as SPSS and WEKA.
Figure 4.1: Decision Tree Basic Layers

14
Chapter 5 Statistical Application made in telecommunication
Sector
Statistics play an important part in this area as it allows to compile and read data correctly, as well
as to interpret data by making forecasts. Various implementations may be rendered in this domain
so that the management can meet their goal. For telecommunications equipment, Total Productive
Maintenance (TPM) is meant to increase the efficiency and reliability of the equipment. It aims to
improve production by engaging in adequate maintenance to minimize losses, such as breakdowns,
availability of equipment, minor stoppages affecting system reliability and decreased performance
quality. An application of predictive maintenance on one of the telecommunication equipment is
studied in the first section of this chapter. As for customer relationship analysis, we made three
separate applications in the Kuwait telecommunications industry, the first application targeting the
customer churn analysis in order to predict which group of customers are more likely to churn,
then another application was made to create groups of customers based on their level of satisfaction
and retention and knowing the factors that significantly affects each group, and finally we have
studied the second category of customers in the telecommunications industry, the company-based
customers, and evaluated their significant factors in order to maximize their satisfaction.
As a contribution, we have made four applications, one targeting an equipment status to assess the
statistical methodologies for equipment's reliability, and three surveys targeting the study of
customer relationship. Data is gathered, summarized, and evaluated in order to demonstrate the
telecom service providers how such analysis should be carried out, and what advantages they can
gain from this. In such applications, we are able to demonstrate that significant factors that differ
across community of customers, hence clustering and classification analysis is essential if
performed using the required techniques which helps the management system to set their
strategies.
5.1. Predictive Maintenance Application and Simulation
At first an application for predictive maintenance algorithm, which is an important analysis to
schedule maintenance actions for the equipment based on the next expected failure and the
reliability of the equipment. The use of Mean time Between failures as well as the probability
distribution with the calculation of Reliability function was applied and tested on
telecommunication equipment called Remote radio unit, which is mainly used to connect the user
with the network. Random data set was created, which includes the day-to-day overload record for
1 year along with the status of the equipment (Working or Error). That is, we track the load of the
equipment on a daily basis, and then we check the threshold value of the equipment defined by the
experts in order to track the overload value of the equipment.

15
Engineers from the telecommunication sector defined the Equipment’s Overload Warning value
as 15 and the Equipment’s Overload Threshold value as 25.
The equipment’s tracking information for the daily overload is presented in figure 5.1:
This graph summarizes the present status and displays the background of the overload values of
the equipment, highlights the failures in red, the alerts in green and the usual condition in blue. we
can see that there are three faults in the year being tracked and that there is more than one overload
value that comes beyond the alert range (15 to 25) as defined in the input stage. In this analysis, a
‘Warning Message’ provides the following information of the algorithm output:
This could allow the service provider to get an alert so that the equipment is to be inspected as
well as to check if the connected equipment is affected. In addition, a ‘Detailed Information
Message’, as a pop-up message, represents the output of the algorithm of which it includes the
Mean Time Between Failure (MTBF) based on historical failure records, as well as the estimated
date for the next error along with the reliability of the equipment, which is the percent that the
equipment will be reliable until the next error is expected as shown in table 5.2.
This message will provide the management an idea about their maintenance plan and it also helps
in reducing the maintenance cost since the maintenance action will be applied when needed. The
study showed an interesting result which provides a warning message for the service provider
about the next expected failure so that plans for maintenance will be taken accordingly.
Figure 5.1: Equipment’s Tracking Information for Equipment’s daily Overload
Table 5.1: Algorithm Output Warning Message
Warning Date 18-Dec-18
Equipment’s Overload Value 17
Last Warning Date 6-Dec-18
Number of Warnings since Last Error 2
Table 5.2: Algorithm Output Detailed Information Message
MTBF 110.67 days
Date of Requested Information 31-Dec-2018
Estimated Date for the Next Error 16-Mar-19
Number of Days Left before the Expected Error 75 days
Equipment Reliability 86.9%
16
5.2. Customer Churn Analysis
Customer Churn is nowadays service providers' concern in order to enhance their economic status and
improve their profits, since it is known that attracting new customer costs more than saving current
customers. In this application, a sample of 136 customers from this market were selected using a
snowball sampling technique to fill out the statistical survey that consists of 17 factors. The study
followed the statistical cycle that starts from data collection, followed by data organization and
Data visualization and ending with appropriate analysis. The Binary Logistic Regression (BLR)
analysis as well as Decision Tree (DT) classification, using SPSS and WEKA software, were
selected for the purpose of classifying customers based on the factors and to estimate which group
of customers is more likely to exit the company.
When running the BLR, the model showed significant result with 𝑅2is 0.495, this indicates that
the list of variables entered in our model explains 49.5% of the variation in customer churn
possibility. The classification table shows that our model has 78.7% Accuracy, Sensitivity 81.4%
and 75.8% Specificity. The BLR model is summarized with the following equation:
y = 6.368 − 1.121 ∗ 𝐺𝑒𝑛𝑑𝑒𝑟 − 1.427 ∗ 𝑀𝑎𝑟𝑖𝑡𝑎𝑙 𝑆𝑡𝑎𝑡𝑢𝑠 − 1.946 ∗ 𝐴𝑟𝑎𝑏 𝐸𝑥𝑝𝑎𝑡 + 1.565 ∗ 𝑂𝑜𝑟𝑒𝑑𝑜𝑜 + 1.343 ∗
𝑆𝑇𝐶 − 0.131 ∗ 𝐸𝑥𝑝𝑒𝑟𝑖𝑒𝑛𝑐𝑒 − 0.038 ∗ 𝑆𝑒𝑟𝑣𝑖𝑐𝑒 𝑄𝑢𝑎𝑙𝑖𝑡𝑦 − 0.021 ∗ 𝐵𝑟𝑎𝑛𝑑 𝐼𝑚𝑎𝑔𝑒.
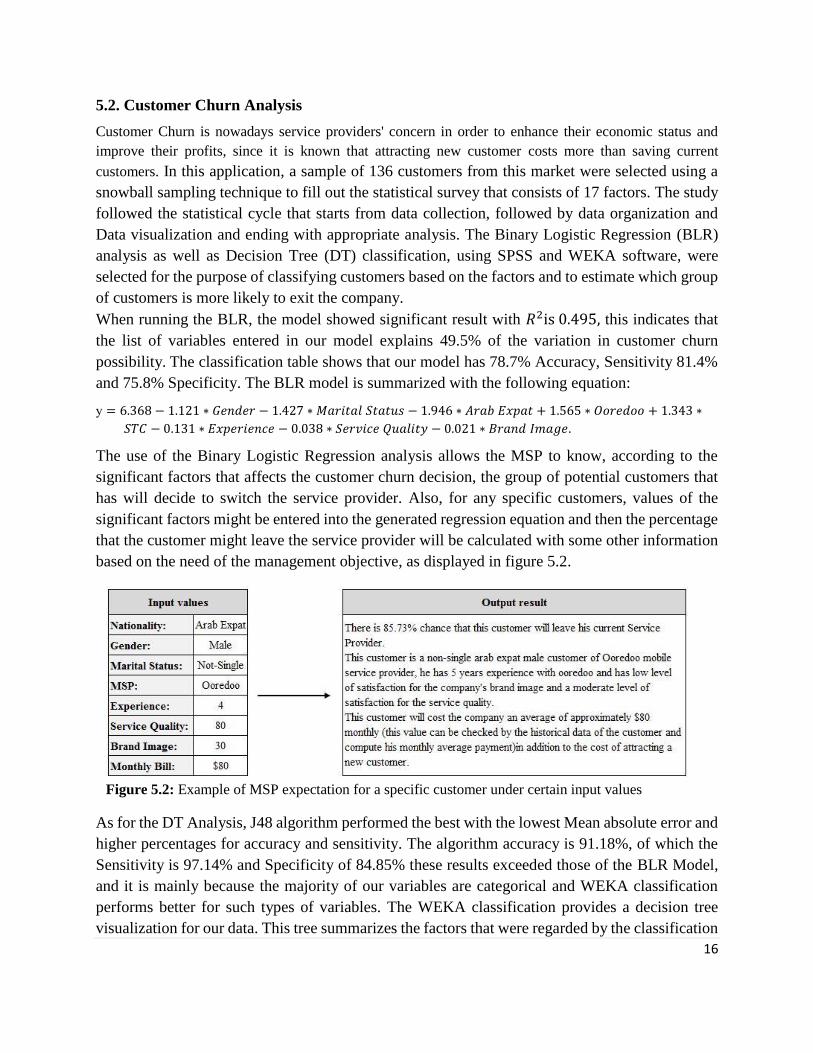
The use of the Binary Logistic Regression analysis allows the MSP to know, according to the
significant factors that affects the customer churn decision, the group of potential customers that
has will decide to switch the service provider. Also, for any specific customers, values of the
significant factors might be entered into the generated regression equation and then the percentage
that the customer might leave the service provider will be calculated with some other information
based on the need of the management objective, as displayed in figure 5.2.
As for the DT Analysis, J48 algorithm performed the best with the lowest Mean absolute error and
higher percentages for accuracy and sensitivity. The algorithm accuracy is 91.18%, of which the
Sensitivity is 97.14% and Specificity of 84.85% these results exceeded those of the BLR Model,
and it is mainly because the majority of our variables are categorical and WEKA classification
performs better for such types of variables. The WEKA classification provides a decision tree
visualization for our data. This tree summarizes the factors that were regarded by the classification
Figure 5.2: Example of MSP expectation for a specific customer under certain input values
17
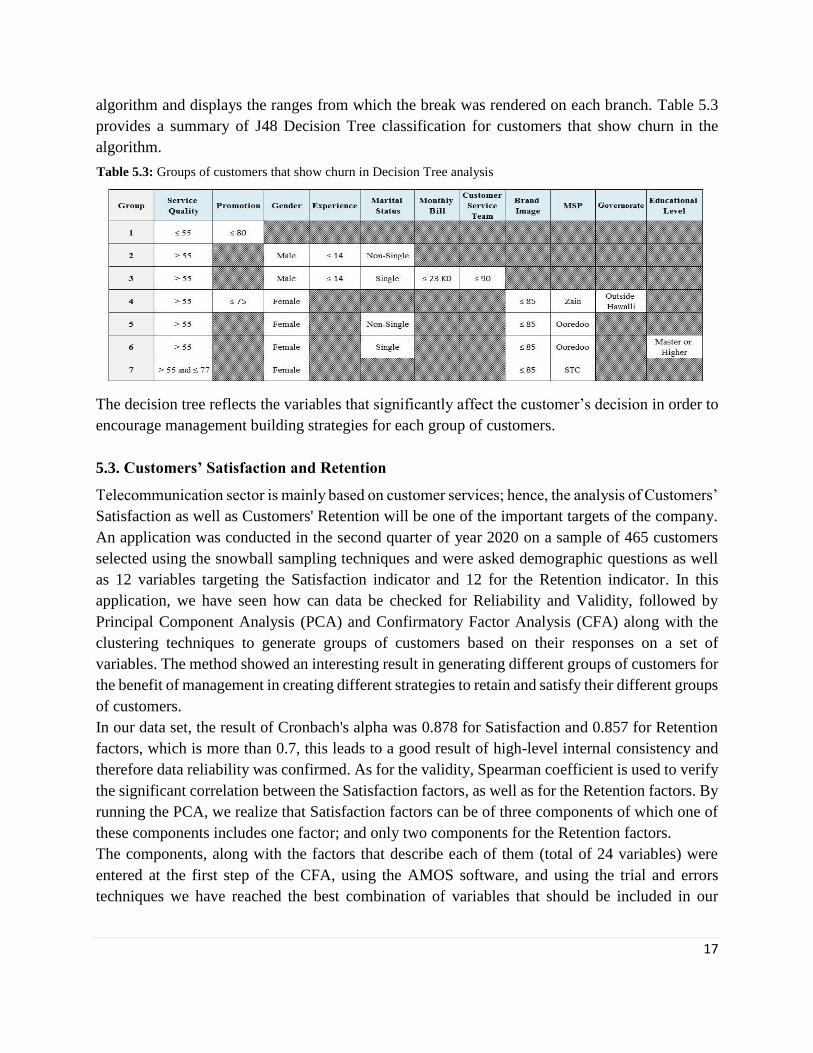
algorithm and displays the ranges from which the break was rendered on each branch. Table 5.3
provides a summary of J48 Decision Tree classification for customers that show churn in the
algorithm.
The decision tree reflects the variables that significantly affect the customer’s decision in order to
encourage management building strategies for each group of customers.
5.3. Customers’ Satisfaction and Retention
Telecommunication sector is mainly based on customer services; hence, the analysis of Customers’
Satisfaction as well as Customers' Retention will be one of the important targets of the company.
An application was conducted in the second quarter of year 2020 on a sample of 465 customers
selected using the snowball sampling techniques and were asked demographic questions as well
as 12 variables targeting the Satisfaction indicator and 12 for the Retention indicator. In this
application, we have seen how can data be checked for Reliability and Validity, followed by
Principal Component Analysis (PCA) and Confirmatory Factor Analysis (CFA) along with the
clustering techniques to generate groups of customers based on their responses on a set of
variables. The method showed an interesting result in generating different groups of customers for
the benefit of management in creating different strategies to retain and satisfy their different groups
of customers.
In our data set, the result of Cronbach's alpha was 0.878 for Satisfaction and 0.857 for Retention
factors, which is more than 0.7, this leads to a good result of high-level internal consistency and
therefore data reliability was confirmed. As for the validity, Spearman coefficient is used to verify
the significant correlation between the Satisfaction factors, as well as for the Retention factors. By
running the PCA, we realize that Satisfaction factors can be of three components of which one of
these components includes one factor; and only two components for the Retention factors.
The components, along with the factors that describe each of them (total of 24 variables) were
entered at the first step of the CFA, using the AMOS software, and using the trial and errors
techniques we have reached the best combination of variables that should be included in our
Table 5.3: Groups of customers that show churn in Decision Tree analysis

18
analysis. Consequently, a total of 2 variables were excluded from the analysis due to their weak
effect on our model.
This step was followed by the K-means clustering methodology, using Euclidean distance, so that
groups of customers from the satisfaction factors can be generated, similarly from the Retention
variables. These groups when crosses with each other, and with the help of ANOVA we generated
the 2x2 matrix (Figure 5.3) which represents the following groups of customers:
Group 1: Customers with Low Satisfaction and Low Retention.
Group 2: Customers with Low Satisfaction and High Retention.
Group 3: Customers with High Satisfaction and Low Retention.
Group 4: Customers with High Satisfaction and High Retention.
The help of the Binary Logistic Regression will be an appropriate technique that can be used to
determine the significant effect of each variable in each of the four defined clusters. This result
can be summarized by:
Customers in Group1 will be affected with many Satisfaction and Retention factors but those that
has the highest effect are the "Responsiveness of customers' complaints" followed by "Price of
Internet Services" for Satisfaction; and for Retention, customers are highly affected by "Price
compared to other service providers" followed by "Brand Image". Group two contains the group
of customers with high retention level, therefore the focus on this group will be on factors that
increase the level of satisfaction for the customers such as "Quality of Internet Services" and
"Quality compared to Price for internet Services". For Group 3, highly satisfied customers, the
main target will be for the factors that enhances the customers' level of retention, among the
significant factors, the one that has the highest impact on this group will be the "Offering
combination of services in one package" followed by "Receiving a service evaluation message
after contacting the customer care employee" they need to feel themselves more involved in
evaluating the service they are getting.
Figure 5.3: CS-CR matrix
19
5.4. Company-Customers’ Satisfaction
Company’s level of satisfaction is an important factor for Mobile Service Providers. In this
application, a study was made to analyze the significant factors that plays an important role in
telecommunication market for company-customers’ satisfaction noting that the study was
conducted on the mid of year 2020. A survey was generated with 18 variables and a sample of 45
companies with four different types and different sizes (based on the total number of employees)
were selected. This type of analysis has its uniqueness in analyzing customers in telecom in the
type of corporate.
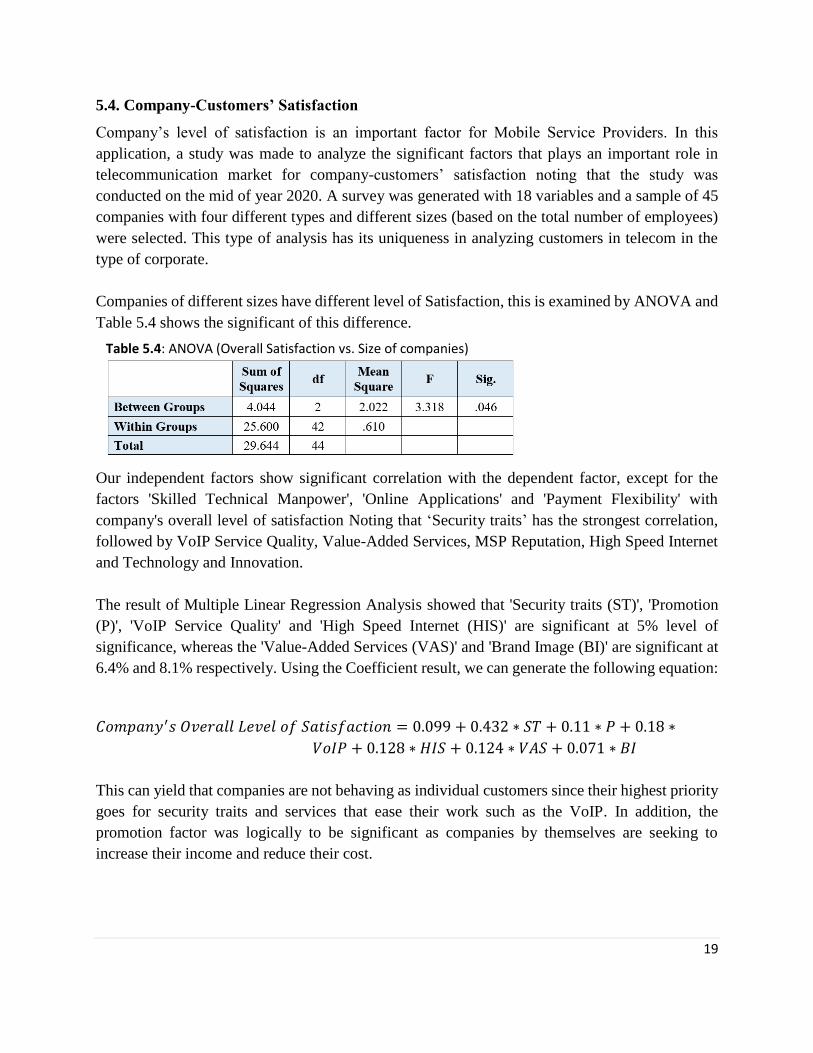
Companies of different sizes have different level of Satisfaction, this is examined by ANOVA and
Table 5.4 shows the significant of this difference.
Our independent factors show significant correlation with the dependent factor, except for the
factors 'Skilled Technical Manpower', 'Online Applications' and 'Payment Flexibility' with
company's overall level of satisfaction Noting that ‘Security traits’ has the strongest correlation,
followed by VoIP Service Quality, Value-Added Services, MSP Reputation, High Speed Internet
and Technology and Innovation.
The result of Multiple Linear Regression Analysis showed that 'Security traits (ST)', 'Promotion
(P)', 'VoIP Service Quality' and 'High Speed Internet (HIS)' are significant at 5% level of
significance, whereas the 'Value-Added Services (VAS)' and 'Brand Image (BI)' are significant at
6.4% and 8.1% respectively. Using the Coefficient result, we can generate the following equation:
𝐶𝑜𝑚𝑝𝑎𝑛𝑦′𝑠 𝑂𝑣𝑒𝑟𝑎𝑙𝑙 𝐿𝑒𝑣𝑒𝑙 𝑜𝑓 𝑆𝑎𝑡𝑖𝑠𝑓𝑎𝑐𝑡𝑖𝑜𝑛 = 0.099 + 0.432 ∗ 𝑆𝑇 + 0.11 ∗ 𝑃 + 0.18 ∗
𝑉𝑜𝐼𝑃 + 0.128 ∗ 𝐻𝐼𝑆 + 0.124 ∗ 𝑉𝐴𝑆 + 0.071 ∗ 𝐵𝐼
This can yield that companies are not behaving as individual customers since their highest priority
goes for security traits and services that ease their work such as the VoIP. In addition, the
promotion factor was logically to be significant as companies by themselves are seeking to
increase their income and reduce their cost.
Table 5.4: ANOVA (Overall Satisfaction vs. Size of companies)
20
Chapter 6 Procedures for Telecommunications Management
In telecommunications sector, management seeks to improve the profitability of businesses by
increasing their production and reducing costs. Statistics play an important part in this area as it
allows gaining advantages on other competitors when it is applied properly. Statistics and
management are strongly connected to each other, appropriate and valuable plans are supported
by statistical analysis. For the purpose of completing the management system, our contribution in
this chapter was to create different procedures using appropriate statistical methodologies, these
procedures are related to the main purpose of the thesis and has direct connection with the
immediate objectives. Four procedures were created for management so that when targeting such
analysis, the procedure will be used. Each procedure has its own objective, and some procedures
are connected in a way that to apply certain analysis, a prerequisite of procedure is needed. These
procedures are made for two main purposes, increase the equipment’s life time by working on
predictive maintenance plan, and to increase and maintain the number of subscribers for the service
provider which is done through an appropriate analysis for the customer relationship indicators.
At first, a procedure for predictive maintenance was made to avoid any breakdown due to
maintenance issues, as well as to track and monitor the status of the equipment so that the number
of unexpected failures can be reduced. In this procedure, different principles were used, such as
the data simulation, data cleaning, Time Series and Regression analysis, MTTR, MTBF,
Remaining Useful Lifetime and the best Probability Distribution that has to be used.
Secondly, procedure for analyzing unique indicator of the customer relationship such as
“Satisfaction”, Regression Analysis is the main statistical methodology used in this procedure.
Thirdly, building a procedure that crosses between Satisfaction and Retention, this procedure
requires the result of the previous procedure so that the significant factors resulted will be included.
Clustering statistical and ANOVA methodologies are used in this procedure.
Finally, the last procedure is related to customer churn analysis. Classification using Decision tree
and regression analysis are used in such analysis with some basic checks such as data reliability
and validity along with Principle Component Analysis and Confirmatory Factor Analysis. This
contribution is deemed a major additional benefit to the telecommunications management, since it
lets their system boost its overall efficiency and include effective solutions for maintenance actions
or for understanding customer's behavior.
Here is the list of these procedures along with their main objectives:

21
The algorithm consists of five major stages: The Data Acquisition, The Data Cleaning, Defining
the Indices, Building Models and Algorithm Implementation. The procedure aims to assess the
condition of the equipment as well as to schedule maintenance actions before the failure of the
equipment, which will lead to service breakdown. Hence, the main objective of the predictive
maintenance application for the management is to Track and monitor the equipment condition to
keep the standard for the service provided, Reduce the number of unexpected failures for the
equipment, Reduce the cost of repair of the equipment, Increase the Mean Time Between Failures
of the equipment as well as to Reduce the storage quantity of spare parts.
Figure 6.1: Algorithm for Predictive Maintenance Procedure

22
Managements need to analyze their customers’ level of satisfaction in order to Know more about
customers’ feeling toward the service, Discover the significant factors that affect their customers’
level of satisfaction, Improve the services through targeting the significant factors as well as to
Improve the image of the company and the word of mouth that customers share.
Figure 6.2: Algorithm for Customers’ Satisfaction Procedure
23
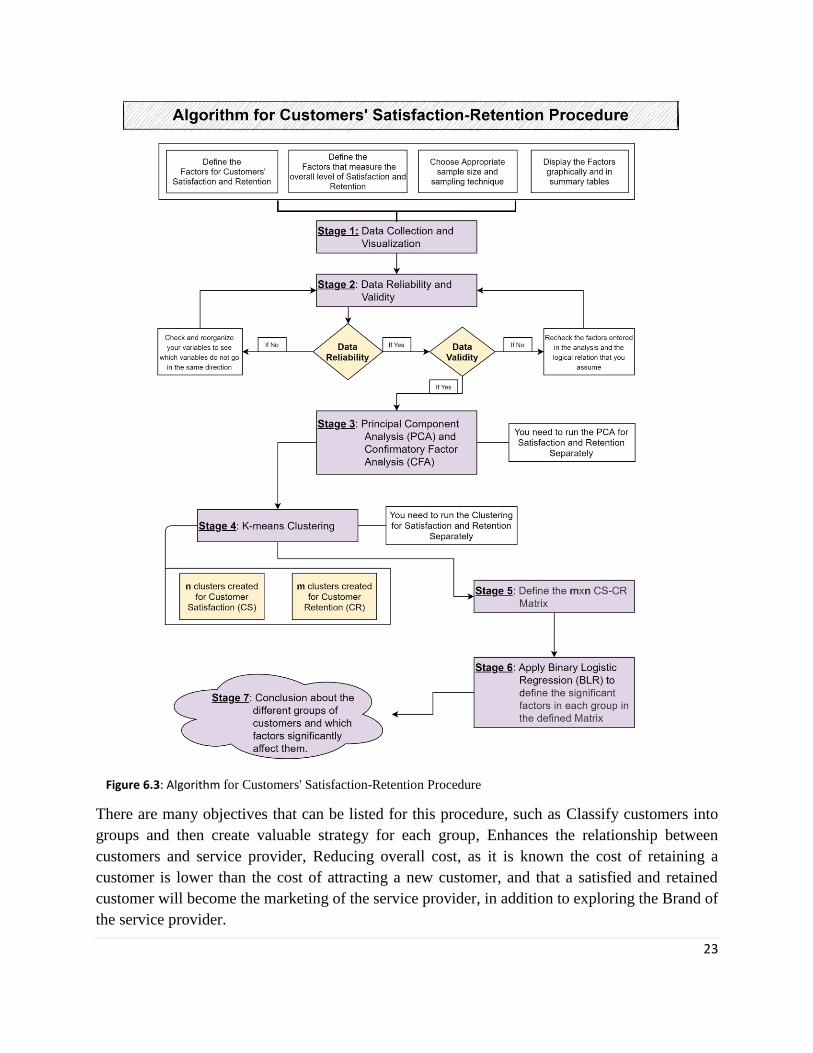
There are many objectives that can be listed for this procedure, such as Classify customers into
groups and then create valuable strategy for each group, Enhances the relationship between
customers and service provider, Reducing overall cost, as it is known the cost of retaining a
customer is lower than the cost of attracting a new customer, and that a satisfied and retained
customer will become the marketing of the service provider, in addition to exploring the Brand of
the service provider.
Figure 6.3: Algorithm for Customers' Satisfaction-Retention Procedure
24
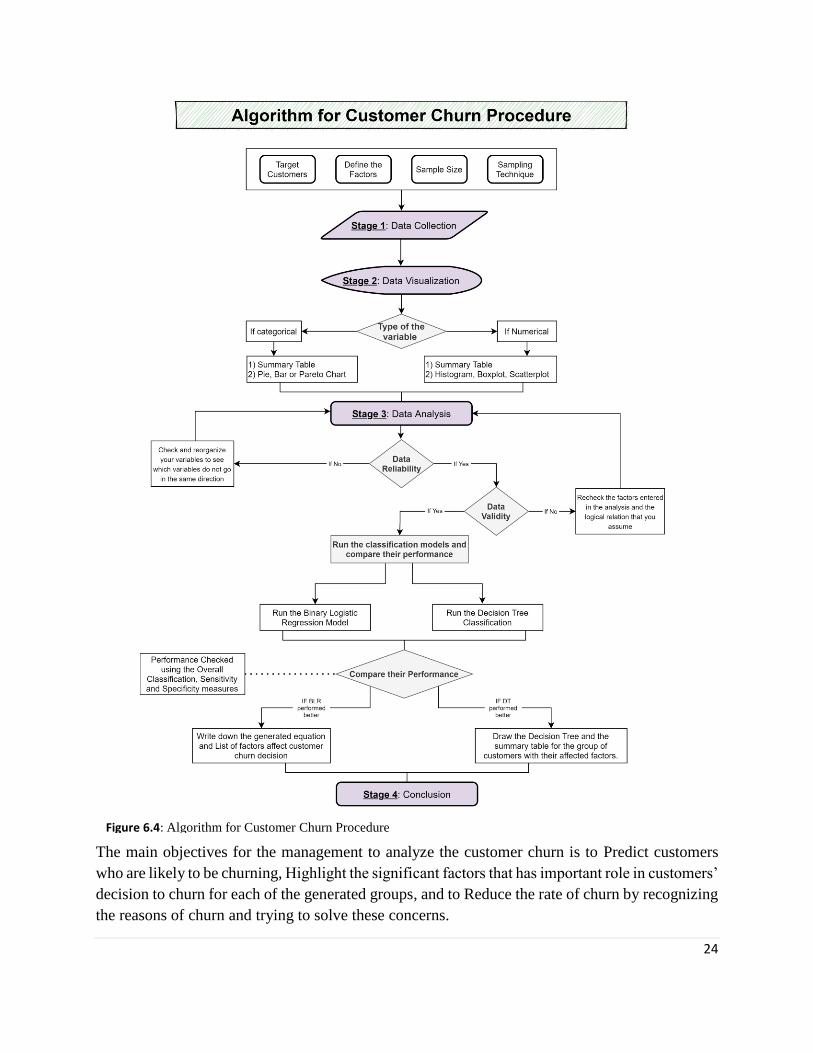
The main objectives for the management to analyze the customer churn is to Predict customers
who are likely to be churning, Highlight the significant factors that has important role in customers’
decision to churn for each of the generated groups, and to Reduce the rate of churn by recognizing
the reasons of churn and trying to solve these concerns.
Figure 6.4: Algorithm for Customer Churn Procedure
25
Chapter 7
Conclusion of the Thesis
The aim of the thesis is to enhance telecommunications service performance through means of
statistical analysis. In the telecommunications sector, telecommunications equipment and
consumers are the two key components that play an important role in overall performance.
Equipment in the telecommunications industry is a vital aspect of delivering better services, and
so researching the reliability of the equipment would contribute to increased service life and
quality for consumers. As for consumers who are the backbone of service-based companies, such
as telecommunications, the quest for long-term relations is one of the essential reasons for
improving the company's sales and thus influences the performance of the telecommunications
service. Therefore, we developed our thesis on the basis of seven chapters that help to complete
the management system and increase the performance of the telecommunications service.
In chapter 1, we have introduced the telecommunication system and defined the two immediate
objectives to enhance the telecommunication service performance which are ‘increasing the
equipment’s lifetime’ and ‘Increase and maintain the number of subscribers’. Chapters 2 and 3
aimed to identify the key indicators of telecommunication equipment and Customer Relationship,
this was done through the literature review for the telecommunication equipment, focusing on the
different maintenance actions that can be applied, as well as for the Customer Relationship key
indicators and listing the significant factors of each indicator. In chapter 4, the statistical research
methodologies were listed for the purpose of equipment maintenance analysis as well as for
customer relationship analysis. Chapter 5 presented different statistical application in
telecommunication sector. this chapter was intended to validate the approaches outlined in the
previous chapter in order to prepare a set of different management procedures that will help to
complete their management system. In Chapter 6, four management procedures have been
established with a view to growing the life of the equipment and improving the relationship
between the service provider and its customers. These procedures provide a comprehensive
methodology for management to be used in order to establish techniques that improve their
performance.
Research Limitation
This research took place from January 2018 to January 2021, and it is only limited by three years
to make the research for enhancing the performance of telecommunication service using statistical
analysis. The study shows how the performance can be enhanced, just from two perspectives, the
telecommunication equipment and customer relationship. Despite the Covid-19 pandemic and the
various difficulties we faced while dealing with security constraints, we were able to receive good
strategies that can be implemented by management to boost their company’s efficiency.

26
In this thesis, the analysis for telecommunications equipment studied only the reliability,
availability and maintenance of the equipment. Due to security restrictions and time limits, the
application used for the predictive maintenance procedure has been extended to one of the
equipment of which the other components of the communications infrastructure can be evaluated
using the same procedure. As far as Customer Relationship is concerned, the research analyzed
only five key indicators, the Satisfaction, Retention, Loyalty, Attraction and Customer Churn.
Such indicators are essential, but other indicators may also be added to the analysis, such as the
Consumer's perceptions and the effect of employees on telecommunication services. In addition,
due to time constraints, the applications made in our analysis were completed on in Kuwait region
and for a small sample size, which made the target of the application to demonstrate how the
analysis can be carried out and not to reach a summary that management can directly adopt in their
strategies.
Work Originality
Several contributions have been made to this report. We began with a literature review to combine
all the relevant research that have previously been done to summarize all the contributions that
have led us to recognize the required additions that need to be made to the literature. Our attention
has been given to the fact that the styles of maintenance, the key measures of customer relations
and their significant variables, as well as the different forms of statistical strategies, have not been
extensively explored, and thus we have agreed to concentrate on these things and have rendered it
more valuable for managers to start properly in order to increase their service efficiency and overall
results.
In addition, quantitative methods were made by collecting and evaluating data utilizing various
statistical tools to test the methodologies used for the analysis of data. These applications made it
possible for management to see the research process and to illustrate important considerations in
the implementation of strategies. Moreover, the key addition to the study is the algorithms
developed for managers to complete their management system and improve the efficiency of
telecommunications services.
Future Research
There are also points that can be further analyzed in the future which can be a continuation and an
added contribution to our thesis. If we consider telecommunications equipment, the application of
the predictive maintenance procedure can be extended to other equipment. Moreover, prices and
warranties for telecommunications equipment can be measured in order to minimize the operating
expense of the service. For Customer Relationship Management, re-run the analysis for greater
sample sizes and extend the analysis in various countries so that our analysis can be extended to
include the MENA area as an example. In contrast, staff performance and skills are other essential
variables that have the potential to dramatically increase the efficiency of telecommunications
companies.
27
Summary of Published Articles
1. ISI indexed conferences
Abiad, M., Kadry, S. and Ionescu, S., (2019, November) - Statistical Analysis of Customer Relationship
Management in Telecommunication Sector. Proceeding of the 9th ICMIE 2019, Vol Management
Perspective in the Digital Transformation, Ed. Niculescu 2019, ISSN 2344-0937 page 802-813, UPB 14-
16 Nov, 2019.
Abiad, M., Kadry, S. and Ionescu, S., (2019, November) - Statistical Methodologies Used in Business
Engineering Research. Proceeding of the 9th ICMIE 2019, Vol Management Perspective in the Digital
Transformation, Ed. Niculescu 2019, ISSN 2344-0937 page 223-235, UPB 14-16 Nov, 2019.
2. Articles in indexed databases
Abiad, M., Ionescu, S., (2021) – Reengineering of Telecommunication Companies. FAIMA Business &
Management Journal, nr. 1/2021. ISSN 2344-4088, page 58-69.
Abiad, M., Ionescu, S., (2020) – Building an Algorithm for Predictive Maintenance. Scientific Bulletin UPB
series D, nr. 4/2020. ISSN 1454-2358, page 337-348
Abiad, M., Ionescu, S., (2020) – Customer Churn Analysis Using Binary Logistic Regression Model. BAU
Journal – Science and Technology. Beirut Arab University, Vol.1, Issue 2. ISSN: 2706-784X, Article 7.
Abiad, M., Kadry, S., Ionescu, S. and Niculescu, A., (2019) - Customers' Perception of Telecommunication
Services. FAIMA Business & Management Journal, nr. 2/2019. ISSN 2344-4088, page 51-62.
3. International Conferences
Abiad, M. and Ionescu, S., (2019, October). A Proposed Algorithm for Predictive Maintenance Using
Statistics. Proceeding of the 11th International Statistics Congress. ISBN: 978-605-031-529-5, Page 39,
Bodrum, Turkey 4-8 Oct, 2019.
Abiad, M. and Ionescu, S., (2019, October). Application of Statistical Methodologies for Customer Churn: A
case study of Kuwait Telecommunication Sector. Proceeding of the 11th International Statistics Congress.
ISBN: 978-605-031-529-5, Page 38, Bodrum, Turkey 4-8 Oct, 2019.
Abiad, M., Kadry, S. and Ionescu, S., (2018, September). Preventive & Predictive Maintenance of
Telecommunication Equipment-A Review. Proceeding of the 4th International Conference on Applied
and Theoretical Computing and Communication Technology. IEEE, E-ISBN:978-1-5386-7706-3. Page
154-159, Mangalore, India 4-8 Sep, 2018. doi: 10.1109/iCATccT44854.2018.9001972.
Abiad, M., Kadry, S. and Ionescu, S., (2018, September). Cost efficiency of Telecommunication Equipment-A
Review. Proceeding of the 4th International Conference on Applied and Theoretical Computing and
Communication Technology. IEEE, E-ISBN:978-1-5386-7706-3. Page 275-280, Mangalore, India 4-8
Sep, 2018. doi: 10.1109/iCATccT44854.2018.9001962.
28
Letter of Interest from
Telecommunications Company

29
Bibliography 1. Afthanorhan, A., Awang, Z., Rashid, N., Foziah, H., & Ghazali, P. (2019). Assessing the effects
of service quality on customer satisfaction. Management Science Letters, 9(1), 13-24.
2. Agustiady, T. K., & Cudney, E. A. (2018). Total productive maintenance. Total Quality
Management & Business Excellence, 1-8.
3. ALRashed, S. (2017). Factors of Successful Customer Relationship Management (CRM)
Systems in Telecommunication Sector in Saudi Arabia. IT Cost Management Strategies, 3(1), 1-
8.
4. Alsabti, K., Ranka, S., & Singh, V. (1997). An efficient k-means clustering algorithm.
5. Ayers, M. L. (2012). Telecommunications system reliability engineering, theory, and practice
(Vol. 21). John Wiley & Sons.
6. Bhuian, S. N., Balushi, M. A., & Butt, I. (2018). Antecedents and consequences of customer
loyalty in Qatar. Journal for Global Business Advancement, 11(1), 41-63.
7. Chatzipapas, A., Alouf, S., & Mancuso, V. (2011, September). On the minimization of power
consumption in base stations using on/off power amplifiers. In 2011 IEEE Online Conference on
Green Communications (pp. 18-23). IEEE.
8. Core.ecu.edu. (2019). [online] Available at:
http://core.ecu.edu/psyc/wuenschk/MV/Multreg/Logistic-SPSS.PDF [Accessed 22 Jul. 2019].
9. Durivage, M. (2015). Practical engineering, process, and reliability statistics. LynelleKorte.
10. Ellegaard, C., & Ritter, T. (2006). Customer attraction and its purchasing potential. In 22nd IMP
Conference, Milan.
11. Endrenyi, J., Aboresheid, S., Allan, R. N., Anders, G. J., Asgarpoor, S., Billinton, R., ... & Singh,
C. (2001). The present status of maintenance strategies and the impact of maintenance on
reliability. IEEE Transactions on power systems, 16(4), 638-646.
12. Eruguz, A. S., Tan, T., & van Houtum, G. J. (2018). Integrated maintenance and spare part
optimization for moving assets. IISE Transactions, 50(3), 230-245.
13. Hafaifa, A., Abdellah, K., Mouloud, G., & Hadroug, N. (2016). Reliability analysis using
Weibull distribution applied to a booster pump used in oil drilling installations. Journal of the
Technical University Sofia, Branch Plovdiv, Bulgaria, Fundamental Sciences and Applications,
22, 31-37.
14. Hassouna, M., Tarhini, A., Elyas, T., & Abou Trab, M. (2015). Customer Churn in Mobile
Markets: A Comparison of Techniques. International Business Research, 8(6), 225. doi:
10.5539/ibr.v8n6p224
15. Kerkhoff, K., Kaul, K., Hilletofth, P., & Eriksson, D. (2017). Sourcing from China: a literature
review of motivations, outcomes, problems, and solutions. Operations and Supply Chain
Management, 10(4), 226-239.

30
16. Khalil, S. (2019). Adopting the cloud: how it affects firm strategy. Journal of Business Strategy.
17. Kottler, P. (1997). Marketing management: analysis, planning, implementation and control.
Kotler.‒8th ed.‒1994.
18. Kotler, P. & Armstrong, G., (2018). Principles of marketing, 17th edition. Pearson education.
19. Koutitas, G., & Demestichas, P. (2010). A review of energy efficiency in telecommunication
networks. Telfor journal, 2(1), 2-7.
20. Liu, X., & Zhang, N. (2020). Research on Customer Satisfaction of Budget Hotels Based on
Revised IPA and Online Reviews. Science Journal of Business and Management, 8(2), 50.
21. Mahajan, V., Misra, R., & Mahajan, R. (2017). Review on factors affecting customer churn in
telecom sector. International Journal of Data Analysis Techniques and Strategies, 9(2), 122-144.
22. MAPS (2015). MAPS™ GSM Abis Interface Emulator (GSM Abis Interface Emulation).
Retrieved 15 June 2019, from https://www.gl.com/maps-gsmabis.html
23. Montgomery, D. C., & Runger, G. C. (2014). Applied statistics and probability for engineers.
Wiley & Sons, 978-1-118-74412-3, Singapore.
24. Oviroh, P. O., & Jen, T. C. (2018). The energy cost analysis of hybrid systems and diesel
generators in powering selected base transceiver station locations in Nigeria. Energies, 11(3),
687.
25. Richter, F., Fehske, A. J., & Fettweis, G. P. (2009, September). Energy efficiency aspects of base
station deployment strategies for cellular networks. In 2009 IEEE 70th Vehicular Technology
Conference Fall (pp. 1-5). IEEE.
26. Schober, P., Boer, C., & Schwarte, L. A. (2018). Correlation coefficients: appropriate use and
interpretation. Anesthesia & Analgesia, 126(5), 1763-1768.
27. Subramanian, N., Abdulrahman, M. D., & Rahman, S. (2014). Sourcing complexity factors on
contractual relationship: Chinese suppliers’ perspective. Production & Manufacturing Research,
2(1), 558-585.
28. Sulaimon, O.S., Emmanuel, O.E. and Bilqis, B.B., (2016). Relevant Drivers for Customers Churn
and Retention Decision in the Nigerian Mobile Telecommunication Industry. Journal of
Competitiveness, 8(3).
29. Taber, K. S. (2018). The use of Cronbach’s alpha when developing and reporting research
instruments in science education. Research in Science Education, 48(6), 1273-1296.
30. Thomas, A. (2020). Topic: Telecommunications equipment. Retrieved 26 December 2020, from
https://www.statista.com/topics/2844/telecommunications-equipment/
31. Zhang, H., Gladisch, A., Pickavet, M., Tao, Z., & Mohr, W. (2010). Energy efficiency in
communications. IEEE Communications Magazine, 48(11), 48-49.
32. Zineldin, M. (2006). The royalty of loyalty: CRM, quality and retention, Journal of consumer
marketing, Vol. 23, No. 7, pp.430-437, 0736-3761
Related Documents