Increased Numbers of IL-7 Receptor Molecules on CD4+CD252CD107a+ T-Cells in Patients with Autoimmune Diseases Affecting the Central Nervous System Nalini Kumar Vudattu 1 , Sharon Kuhlmann-Berenzon 2 , Mohsen Khademi 3 , Vicki Seyfert 4 , Thomas Olsson 3 , Markus J. Maeurer 1,5 * 1 Department of Microbiology, Tumor and Cell Biology (MTC), Karolinska Institutet, Stockholm, Sweden, 2 Smittskyddsinstitutet, Biostatistics and Epidemiological Modelling, Department of Epidemiology, Swedish Institute for Infectious Disease Control, Stockholm, Sweden, 3 Neuroimmunology Unit Department of Clinical Neuroscience, Karolinska Institutet at Karolinska University Hospital, Solna, Sweden, 4 Immune Tolerance Network, Department of Medicine, University of California San Francisco, San Francisco, California, United States of America, 5 Smittskyddsinstitutet, Section of Translational Immunology, Stockholm, Sweden Abstract Background: High content immune profiling in peripheral blood may reflect immune aberrations associated with inflammation in multiple sclerosis (MS) and other autoimmune diseases affecting the central nervous system. Methods and Findings: Peripheral blood mononuclear cells from 46 patients with multiple sclerosis (MS), 9 patients diagnosed with relapsing remitting MS (RRMS), 13 with secondary progressive multiple sclerosis (SPMS), 9 with other neurological diseases (OND) and well as 15 healthy donors (HD) were analyzed by 12 color flow cytometry (TCRab, TCRcd, CD4, CD8a, CD8b, CD45RA, CCR7, CD27, CD28, CD107a, CD127, CD14) in a cross-sectional study to identify variables significantly different between controls (HD) and patients (OND, RRMS, SPMS). We analyzed 187 individual immune cell subsets (percentages) and the density of the IL-7 receptor alpha chain (CD127) on 59 individual immune phenotypes using a monoclonal anti-IL-7R antibody (clone R34.34) coupled to a single APC molecule in combination with an APC-bead array. A non-parametric analysis of variance (Kruskal-Wallis test) was conducted in order to test for differences among the groups in each of the variables. To correct for the multiplicity problem, the FDR correction was applied on the p-values. We identified 19 variables for immune cell subsets (percentages) which allowed to segregate healthy individuals and individuals with CNS disorders. We did not observe differences in the relative percentage of IL-7R-positive immune cells in PBMCs. In contrast, we identified significant differences in IL-7 density, measured on a single cell level, in 2/59 variables: increased numbers of CD127 molecules on TCRab+CD4+CD25 (intermed) T-cells and on TCRab+CD4+CD252CD107a+ T-cells (mean: 28376 Il-7R binding sites on cells from HD, 48515 in patients with RRMS, 38195 in patients with SPMS and 33692 IL-7 receptor binding sites on cells from patients with OND). Conclusion: These data show that immunophenotyping represents a powerful tool to differentiate healthy individuals from individuals suffering from neurological diseases and that the number of IL-7 receptor molecules on differentiated TCRab+CD4+CD252CD107a+ T-cells, but not the percentage of IL-7R-positive cells, segregates healthy individuals from patients with neurological disorders. Citation: Vudattu NK, Kuhlmann-Berenzon S, Khademi M, Seyfert V, Olsson T, et al. (2009) Increased Numbers of IL-7 Receptor Molecules on CD4+CD252CD107a+ T-Cells in Patients with Autoimmune Diseases Affecting the Central Nervous System. PLoS ONE 4(8): e6534. doi:10.1371/ journal.pone.0006534 Editor: Derya Unutmaz, New York University School of Medicine, United States of America Received February 25, 2009; Accepted May 28, 2009; Published August 6, 2009 Copyright: ß 2009 Vudattu et al. This is an open-access article distributed under the terms of the Creative Commons Attribution License, which permits unrestricted use, distribution, and reproduction in any medium, provided the original author and source are credited. Funding: The work was in part supported by an NIH grant provided to the Immune Tolerance Network, USA and by Cancerfonden, VR to MM, Sweden. The funders had no role in study design, data collection and analysis, decision to publish, or preparation of the manuscript. Competing Interests: The authors have declared that no competing interests exist. * E-mail: [email protected] Introduction Complex genetic traits and environmental factors [1] may contribute to immune responses associated with multiple sclerosis (MS), a demyelinating disease of the central nervous system characterized by a wide clinical variability [2] More recent studies addressed the question whether alterations in immune cell subsets in the peripheral circulation contribute to and reflect CNS inflamma- tion in patients with MS [3]. MRI-active and MRI-inactive patients showed significant differences in the relative composition of several immune cell subsets, including TCRab+CD4+CCR72CD45RA2 peripheral memory T-cells [3] and a reduction of CD8low+CD56+ natural killer cells [4]. Profiling immune cell subsets in peripheral blood with an attempt to identify patterns associated with MS has been carried out since more than 25 years [5]. The advent of high content flow cytometric analysis enables now to look at a comprehensive number of immune cell subsets simultaneously at the single cell level. Most studies examined either the relative PLoS ONE | www.plosone.org 1 August 2009 | Volume 4 | Issue 8 | e6534

Welcome message from author
This document is posted to help you gain knowledge. Please leave a comment to let me know what you think about it! Share it to your friends and learn new things together.
Transcript
Increased Numbers of IL-7 Receptor Molecules onCD4+CD252CD107a+ T-Cells in Patients withAutoimmune Diseases Affecting the Central NervousSystemNalini Kumar Vudattu1, Sharon Kuhlmann-Berenzon2, Mohsen Khademi3, Vicki Seyfert4, Thomas
Olsson3, Markus J. Maeurer1,5*
1 Department of Microbiology, Tumor and Cell Biology (MTC), Karolinska Institutet, Stockholm, Sweden, 2 Smittskyddsinstitutet, Biostatistics and Epidemiological
Modelling, Department of Epidemiology, Swedish Institute for Infectious Disease Control, Stockholm, Sweden, 3 Neuroimmunology Unit Department of Clinical
Neuroscience, Karolinska Institutet at Karolinska University Hospital, Solna, Sweden, 4 Immune Tolerance Network, Department of Medicine, University of California San
Francisco, San Francisco, California, United States of America, 5 Smittskyddsinstitutet, Section of Translational Immunology, Stockholm, Sweden
Abstract
Background: High content immune profiling in peripheral blood may reflect immune aberrations associated withinflammation in multiple sclerosis (MS) and other autoimmune diseases affecting the central nervous system.
Methods and Findings: Peripheral blood mononuclear cells from 46 patients with multiple sclerosis (MS), 9 patientsdiagnosed with relapsing remitting MS (RRMS), 13 with secondary progressive multiple sclerosis (SPMS), 9 with otherneurological diseases (OND) and well as 15 healthy donors (HD) were analyzed by 12 color flow cytometry (TCRab, TCRcd,CD4, CD8a, CD8b, CD45RA, CCR7, CD27, CD28, CD107a, CD127, CD14) in a cross-sectional study to identify variablessignificantly different between controls (HD) and patients (OND, RRMS, SPMS). We analyzed 187 individual immune cellsubsets (percentages) and the density of the IL-7 receptor alpha chain (CD127) on 59 individual immune phenotypes using amonoclonal anti-IL-7R antibody (clone R34.34) coupled to a single APC molecule in combination with an APC-bead array. Anon-parametric analysis of variance (Kruskal-Wallis test) was conducted in order to test for differences among the groups ineach of the variables. To correct for the multiplicity problem, the FDR correction was applied on the p-values. We identified19 variables for immune cell subsets (percentages) which allowed to segregate healthy individuals and individuals with CNSdisorders. We did not observe differences in the relative percentage of IL-7R-positive immune cells in PBMCs. In contrast, weidentified significant differences in IL-7 density, measured on a single cell level, in 2/59 variables: increased numbers ofCD127 molecules on TCRab+CD4+CD25 (intermed) T-cells and on TCRab+CD4+CD252CD107a+ T-cells (mean: 28376 Il-7Rbinding sites on cells from HD, 48515 in patients with RRMS, 38195 in patients with SPMS and 33692 IL-7 receptor bindingsites on cells from patients with OND).
Conclusion: These data show that immunophenotyping represents a powerful tool to differentiate healthy individuals fromindividuals suffering from neurological diseases and that the number of IL-7 receptor molecules on differentiatedTCRab+CD4+CD252CD107a+ T-cells, but not the percentage of IL-7R-positive cells, segregates healthy individuals frompatients with neurological disorders.
Citation: Vudattu NK, Kuhlmann-Berenzon S, Khademi M, Seyfert V, Olsson T, et al. (2009) Increased Numbers of IL-7 Receptor Molecules onCD4+CD252CD107a+ T-Cells in Patients with Autoimmune Diseases Affecting the Central Nervous System. PLoS ONE 4(8): e6534. doi:10.1371/journal.pone.0006534
Editor: Derya Unutmaz, New York University School of Medicine, United States of America
Received February 25, 2009; Accepted May 28, 2009; Published August 6, 2009
Copyright: � 2009 Vudattu et al. This is an open-access article distributed under the terms of the Creative Commons Attribution License, which permitsunrestricted use, distribution, and reproduction in any medium, provided the original author and source are credited.
Funding: The work was in part supported by an NIH grant provided to the Immune Tolerance Network, USA and by Cancerfonden, VR to MM, Sweden. Thefunders had no role in study design, data collection and analysis, decision to publish, or preparation of the manuscript.
Competing Interests: The authors have declared that no competing interests exist.
* E-mail: [email protected]
Introduction
Complex genetic traits and environmental factors [1] may
contribute to immune responses associated with multiple sclerosis
(MS), a demyelinating disease of the central nervous system
characterized by a wide clinical variability [2] More recent studies
addressed the question whether alterations in immune cell subsets in
the peripheral circulation contribute to and reflect CNS inflamma-
tion in patients with MS [3]. MRI-active and MRI-inactive patients
showed significant differences in the relative composition of several
immune cell subsets, including TCRab+CD4+CCR72CD45RA2
peripheral memory T-cells [3] and a reduction of CD8low+CD56+natural killer cells [4]. Profiling immune cell subsets in peripheral
blood with an attempt to identify patterns associated with MS has
been carried out since more than 25 years [5]. The advent of high
content flow cytometric analysis enables now to look at a
comprehensive number of immune cell subsets simultaneously at
the single cell level. Most studies examined either the relative
PLoS ONE | www.plosone.org 1 August 2009 | Volume 4 | Issue 8 | e6534

distribution or absolute numbers of immune cell subsets in PBMCs.
In contrast, the number of biologically relevant molecules, e.g.
CD127, the alpha chain of the IL-7 receptor, on single cells has not
yet been addressed: IL-7, signaling through the IL-7 receptor, has
been shown to increase antigen-specific T-cell responses in patients
with MS [6] and provide long-term T-cell survival and thymic
output [7], which may lead to the expansion of auto-reactive T-cell
clones [8]. We examined in the current report the percentage of 187
individual T-cell subsets for association with IL-7R expression. This
approach addresses differences in immune cell composition in
peripheral blood mononuclear cells (PBMCs), but it does not
measure differences of IL-7R expression on a single cell level. We
measured therefore CD127 antibody binding sites on a more
limited number of immune cell subsets (n = 59) to objectively define
the number of IL-7R molecules on distinct T-cell phenotypes to
identify cellular markers associated with MS.
Results
Cluster analysis of immune phenotypes segregateshealthy blood donors from individuals with neurologicaldiseases
187 individual phenotypes (see supplementary Table S1, i.e.
S1.3) were measured to define the percentage of immune cell
subsets in peripheral blood mononuclear cells (PBMCs) from
Table 1. Clinical profile of patient enrolled in the study.
Sample ID Treatment SexAge atsampling Diag:G1 Diag:G2 Diag:G3 Diagnosis EDSS
OB or IgIndex MRI MRI lesions
P1 No F 31 MS RR RR-rem RRMS-rem 1 Yes Positive 9 or more
P2 No F 35 CIS CIS CIS-relaps CIS-Myelitis 3 Yes Positive 9 or more
P3 No F 30 MS RR RR-rem RRMS-rem 2 Yes Positive 3 to 5
P4 No F 39 OND OND OND Hypothyreosis andsensory disturbance
1 No Normal 0
P5 No F 25 OND OND OND Paresthesia 0 No Normal 0
P6 No F 45 OND.INF OND.INF OND.INF Neuroborreliosis NA No Not done NA
P7 SimvastatinGabapentinAtenolol
F 67 MS SP SPMS SPMS 3 Yes Positive 9 or more
P8 No F 39 OND.INF OND.INF OND.INF Reccurent Myelitis 3 No Normal 0
P9 No F 66 OND.INF OND.INF OND.INF Neuroinflammatorysymptoms, potentialside effects of earlieranti-TNF treatment
NA Yes Atypical 3 to 5
P10 Betaferon F 36 MS RR RR-rem RRMS rem 1 No Atypical 9 or more
P11 No F 43 OND OND OND Paresthesia 0 No Normal 0
P12 No F 44 MS RR RR-rem MS 1.5 No Positive 9 or more
P13 No M 27 OND OND OND Parasthesia 1 No Not done NA
P14 Citalopram F 34 OND OND OND Carpal TunnelSyndrome
NA No Normal 0
P15 No F 55 CIS CIS CIS-rem CIS Supratentorial 2.5 Yes Positive 9 or more
P16 No F 31 MS RR RR-rem RRMS rem 0 LP not done Positive 6 to 8
P17 No M 59 MS SP SPMS SPMS 3.5 Yes NA NA
P18 No F 45 MS SP SPMS SPMS 4 Yes NA NA
P19 No M 51 MS SP SPMS SPMS 5.5 Yes NA NA
P20 No M 45 MS SP SPMS SPMS 6 Yes NA NA
P21 No F 60 MS SP SPMS SPMS 4.5 Yes NA NA
P22 No F 62 MS SP SPMS SPMS 6 Yes NA NA
P23 No F 57 MS SP SPMS SPMS 5.5 Yes NA NA
P24 No F 62 MS SP SPMS SPMS 6 Yes NA NA
P25 No M 54 MS SP SPMS SPMS 6 Yes NA NA
P26 No F 62 MS SP SPMS SPMS 5.5 Yes NA NA
P27 No M 43 MS SP SPMS SPMS 4 Yes NA NA
P28 No F 28 MS RR RR-rem RRMS rem 1.5 Yes Positive 9 or more
P29 No M 25 MS RR RR-rem RRMS rem 2 Yes Positive 9 or more
P30 No M 35 MS RR RR-rem RRMS rem 2.5 Yes Positive 9 or more
P31 No F 44 MS SP SPMS SPMS 3 Yes Positive 9 or more
NA = not applicable, rem = remittent.doi:10.1371/journal.pone.0006534.t001
Il-7R Density in MS
PLoS ONE | www.plosone.org 2 August 2009 | Volume 4 | Issue 8 | e6534
healthy individuals and in patients with neurological disorders
(Table 1), age and sex distribution for each individual group is
provided in Table 2. A Kruskal-Wallis test was conducted and p-
values were corrected using the FDR method. This resulted in 19
significant variables which differentiated healthy individuals and
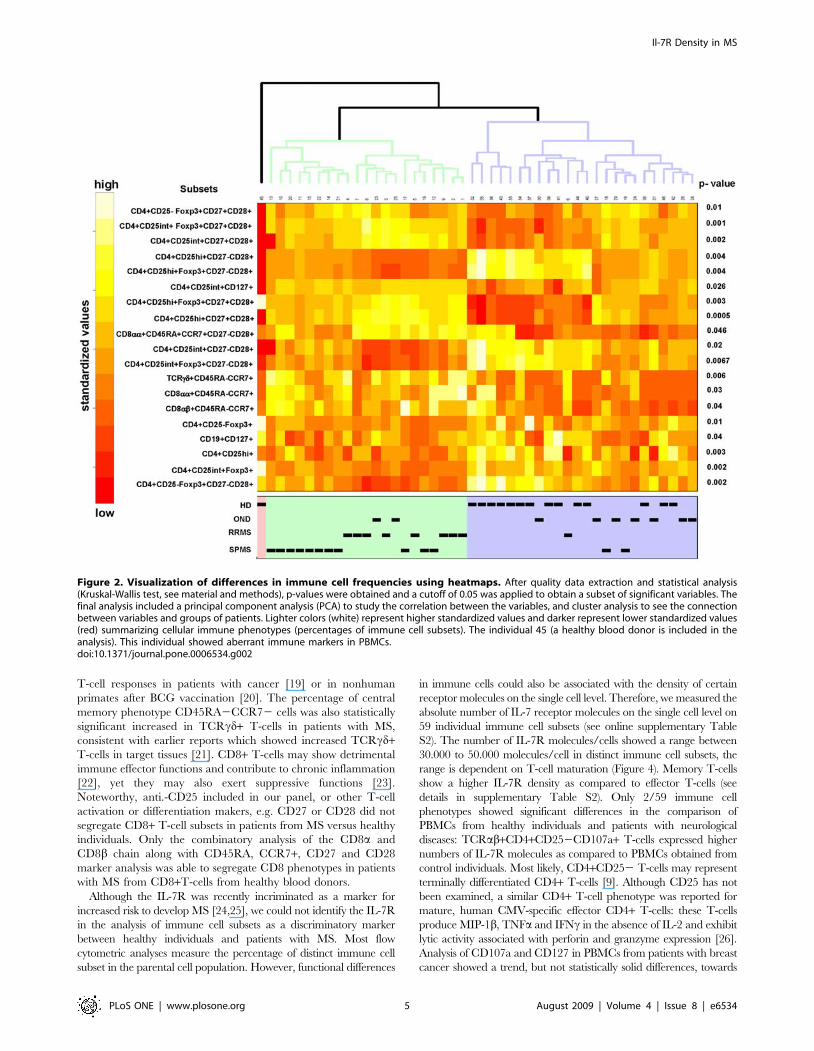
individuals with neurological disorders (Figure 1). We performed a
heatmap analysis in order to visualize differences in the relative
distribution of immune cell subsets in PBMCs obtained from
healthy donors and from individuals with neurological diseases.
Analysis of PBMCs obtained from individual number 45, a
healthy donor, showed a very different pattern of immune cell
subsets as compared to the rest of the individuals. The statistical
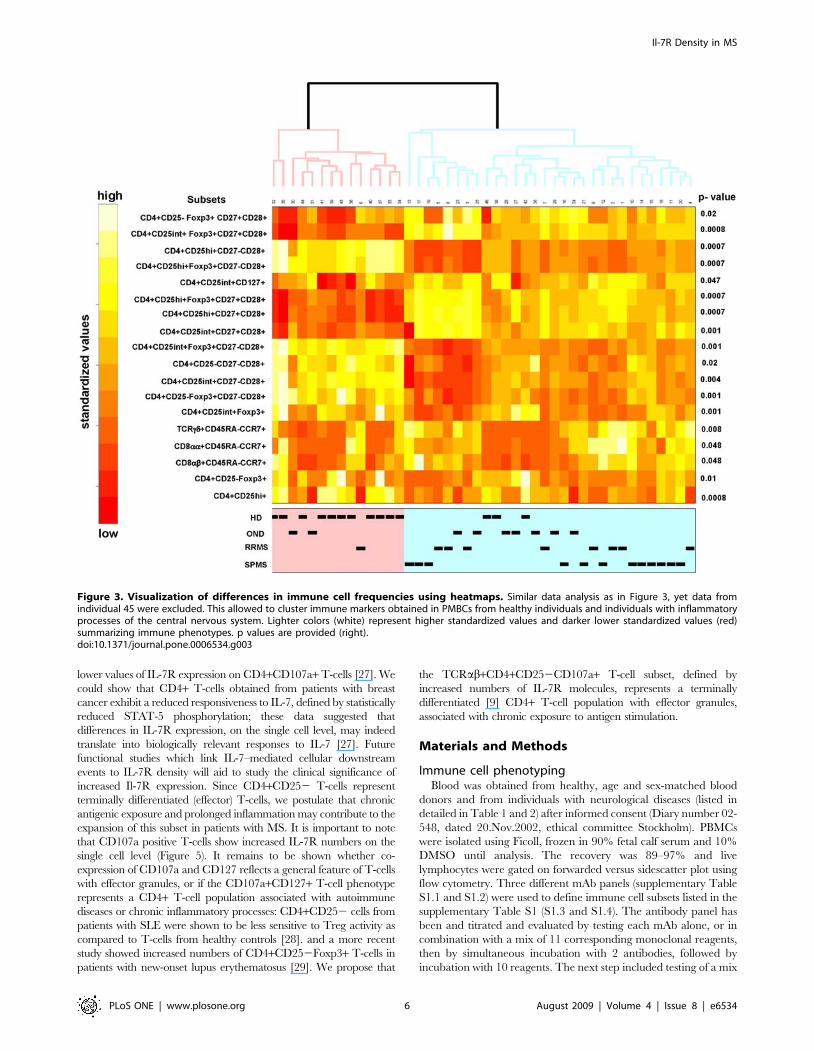
testing and multiplicity correction were therefore run in two
different variants: including (Figure 2) and excluding individual
number 45 (Figure 3) from the statistical analysis. The significant 19
variables are listed with the corresponding p-values in heatmaps,
each color represents a defined percentage of the target immune cell
population in lymphocytes. It is evident that all phenotypic variables
(percentages of immune cell subsets) are slightly different in each
individual. In general, clustering the 19 different variables showed
that phenotypic markers, defined by flow cytometry, allow to
segregate healthy individuals from individuals with neurological
diseases. This exercise also confirmed the results that individual #45 (a healthy blood donor) exhibited a different phenotypic pattern
in PBMCs (Figures 2 and 3), clinically very well defined populations
are crucial for the identification of markers which allow to identify
an individual as ‘healthy’ or suffering from a (inflammatory,
neurological) disease. The heatmap analysis also indicated that
certain immunophenotype subgroups discern between HD and
OND groups and patients with MS (RRMS and SPMS). In general,
two groups were formed: healthy donors on one side, and OND,
RRMS, and SPMS on the other. Differences could be identified in
the relative percentages of Treg cells, including CD3+CD4+/
CD25high+/Foxp3+/CD27+CD28+ T-cells; increased percentages
could also be identified in TCRcd+/CD45RA2CCR7+ T-cells, in
TCRab+/CD8aa+/CD45RA2CCR7+ T-cells as well as in the
TCRab+/CD8aa+/CD45RA+CCR7+/CD272CD28+ T-cell
subset.
Differences in IL-7R density on immune cell subsetsAlthough we identified 19 significantly different immune
markers in PBMCs which allowed to segregate healthy individuals
and individuals with neurological disease, none of these markers
were associated with expression of the Il-7 receptor. The analysis
addressed only the percentage of Il-7R-positive T-cells in
lymphocytes, it reflected the relative composition of IL-7R+ cells
in PBMCs. Differences in immune cell subsets, as well as biological
responses may not only be associated with the relative distribution
of immune cells, but also with the absolute number of (IL-7R)
molecules on single cells. We extended therefore the analysis of
cellular immune abnormalities associated with CNS inflammation
to the number of Il-7R molecules on the single cell level. 59
immune cell subsets (listed in the supplementary Table S1 online,
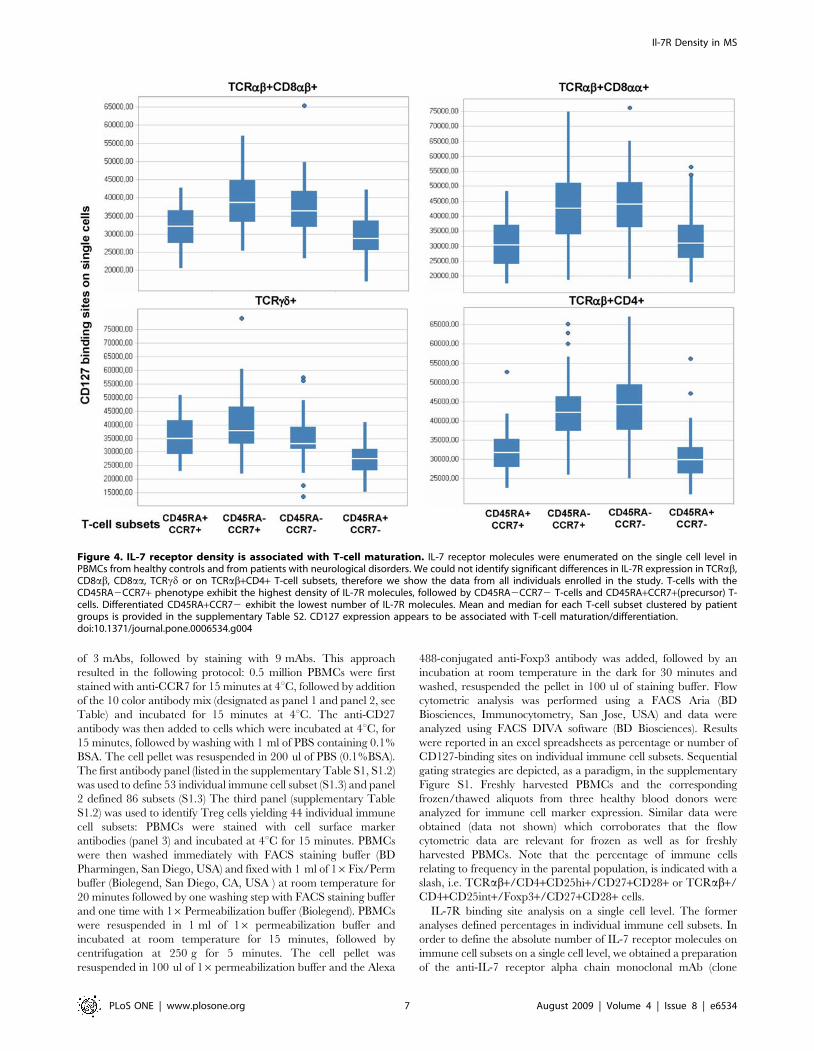
S1.4) were examined for differences in IL-7 receptor densities. IL-
7R density was associated with physiological alterations in immune
cell subsets reflecting T-cell maturation/differentiation. Differen-
tiated T-cells, defined by the CD45RA+CCR72 phenotype,
exhibited the lowest number of IL-7 receptor molecules (Figure 4)
and central/peripheral memory T-cells (CD45RA2CCR7+ or
CD45RA2CCR72) exhibited the highest IL-7R density. Mean,
median values and standard deviation for the enumeration of Il-
7R molecules are provided for each of the 59 individual immune
cell subsets, segregated for each patient group and healthy donors
(Supplementary Table S2). We could not identify statistical
significant differences within these T-cell subsets, defined by
CD45RA and CCR7 expression, which segregate healthy
individuals and individuals with neurological diseases. However,
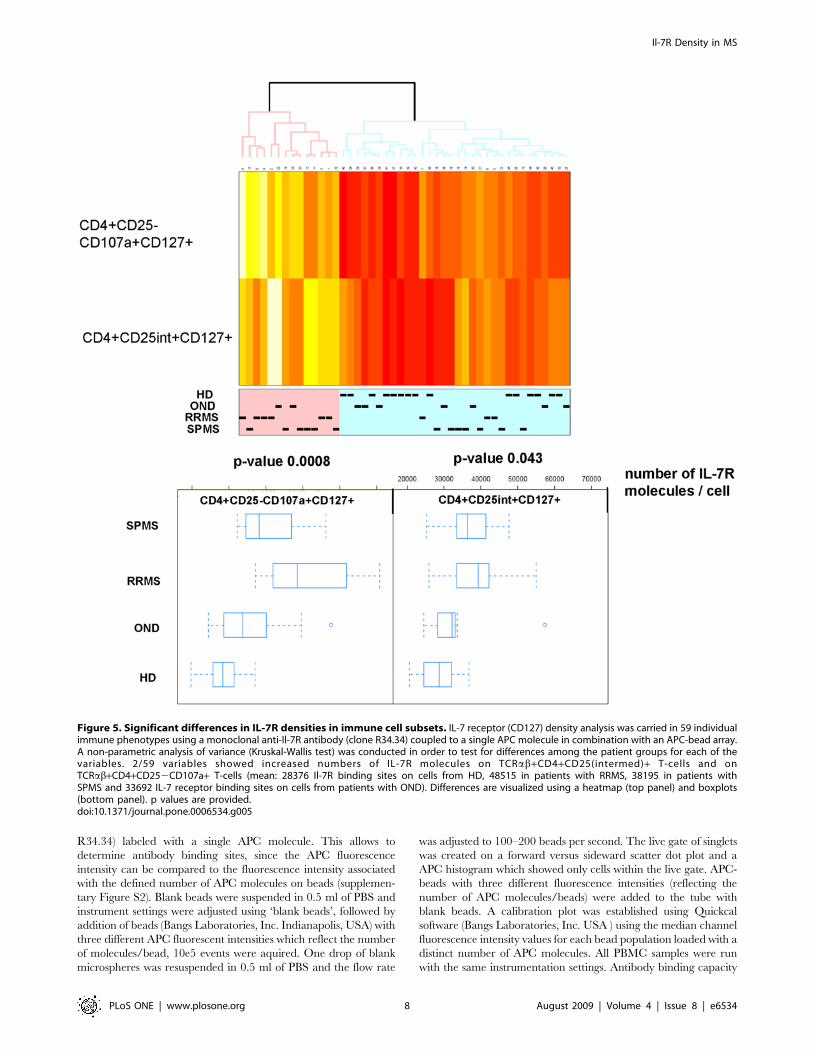
we could identify two immune cell subsets which showed
significant differences in IL-7R density on the single cell level. A
clear difference among PBMCs from healthy blood donors and
individuals with neurological diseases can be seen in the boxplots
of TCRab+CD4+CD252CD107a+CD127+ T-cells (p = 0.0008)
and less clearly in TCRab+CD4+CD25int+CD127+(p = 0.043)
(Figure 5), the absolute number of events for each T-cell
population segregated by groups is provided in the supplementary
Table S3. With these two variables, the clustering of individuals
provided a rather good discrimination of PBMCs from healthy
individuals, less clear discrimination of OND and RRMS, and
none at all of SPMS based on heatmap cluster analysis (data not
shown). PBMCs from healthy donors showed 28664 (mean value)
IL-7R molecules on TCRab+CD4+CD252CD107a+CD127+ T-
cells, 50734 (mean value) molecules were observed on the same T-
cell subset in PBMCs from patients with RRMS, 40634 (mean
value) molecules were identified on TCRab+CD4+CD252C-
D107a+CD127+ T-cells from individuals with SPMS and 36331
(mean value) molecules were enumerated on this T-cell subsets in
PBMCs from patients with OND.
Discussion
Among 187 individual immune cell phenotypes, only a few
turned out to be statistically different in patients with MS as
compared to healthy controls. High content flow cytometric
analysis allows to analyze a plenitude of immune cell markers
visualizing changes in distinct immune cell subsets. Only the
combination of appropriate cell surface makers enabled us to
define differences in distinct immune cell subsets. For instance, a
population of of CD8low+CD42 cells was recently identified in
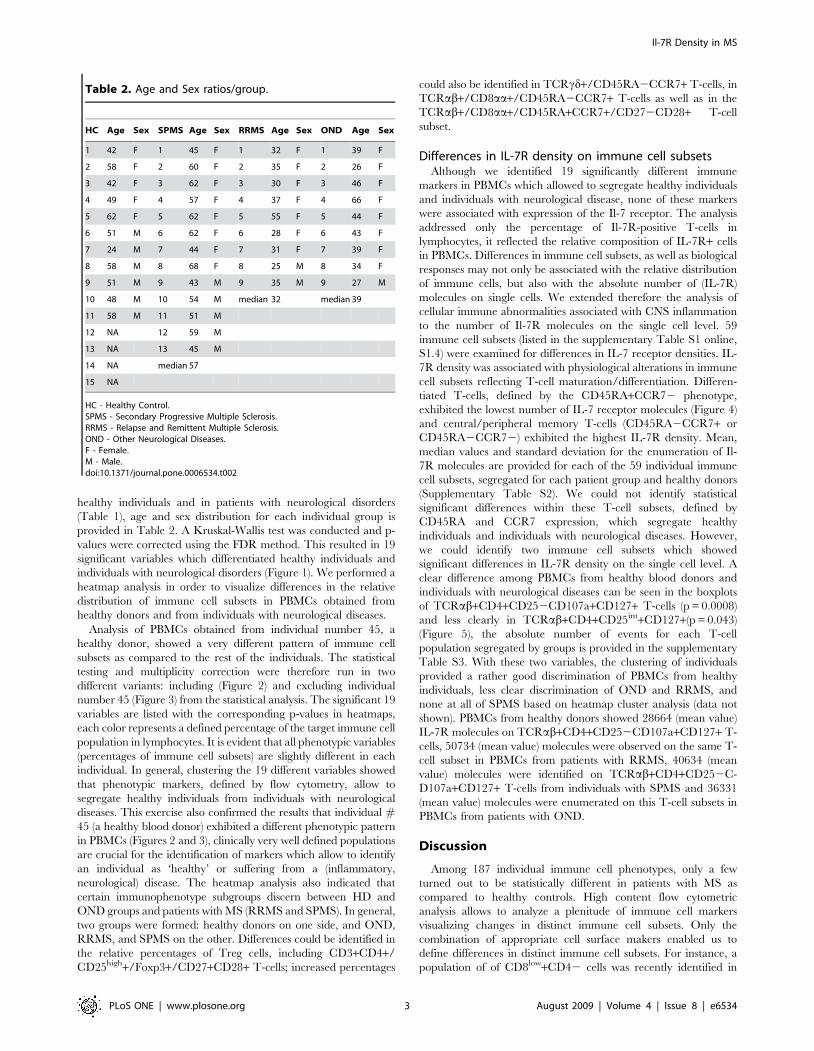
Table 2. Age and Sex ratios/group.
HC Age Sex SPMS Age Sex RRMS Age Sex OND Age Sex
1 42 F 1 45 F 1 32 F 1 39 F
2 58 F 2 60 F 2 35 F 2 26 F
3 42 F 3 62 F 3 30 F 3 46 F
4 49 F 4 57 F 4 37 F 4 66 F
5 62 F 5 62 F 5 55 F 5 44 F
6 51 M 6 62 F 6 28 F 6 43 F
7 24 M 7 44 F 7 31 F 7 39 F
8 58 M 8 68 F 8 25 M 8 34 F
9 51 M 9 43 M 9 35 M 9 27 M
10 48 M 10 54 M median 32 median 39
11 58 M 11 51 M
12 NA 12 59 M
13 NA 13 45 M
14 NA median 57
15 NA
HC - Healthy Control.SPMS - Secondary Progressive Multiple Sclerosis.RRMS - Relapse and Remittent Multiple Sclerosis.OND - Other Neurological Diseases.F - Female.M - Male.doi:10.1371/journal.pone.0006534.t002
Il-7R Density in MS
PLoS ONE | www.plosone.org 3 August 2009 | Volume 4 | Issue 8 | e6534

untreated RRMS patients, as well as in individuals with a clinically
isolated demyelation syndrome; these differences had been
attributed to a reduction in CD8low+CD56+CD32 natural killer
cells [4]. A more detailed prospective study in twenty patients who
were observed longitudinally [3] showed significant differences in
ten lymphocyte subsets associated with active MS and these
markers included the innate and the adaptive arms, i.e.
TCRab+CD4+CCR72CD45RA2 T-cells, TCRcd+CCR5+ T-
cells and regulatory T-cells. If we exclude individual 45 (Figure 3)
which showed a very similar profile as compared to individuals
with neurological diseases, we could also identify reduced numbers
of TCRab+CD4+CD25high+ T-cells (p = 0.0008). The simulta-
neous analysis of multiple markers (i.e. TCRab, CD25, Foxp3,
CD27, CD28 and CD127) for Treg cells showed a relative
increase of TCRab+CD4+CD25high+CD27+CD28+ T-cells with-
in the CD4+CD25high+ T-cell population, as well as an increase of
CD3+CD4+CD25int+Foxp3+CD27+CD28+ T-cells. These
CD4+ T-cell subsets suggest an enrichment of activated T-cells
with the CD27+,CD28+ phenotype since Foxp3 expression is not
only a marker of Treg cells, it also indicates T-cells activation: IL-
2, IL-15, as well as IL-7 are able to transiently induce Foxp3 in
CD4+CD252 effector T-cells [9].
The reduction of CD4+CD25high T-cells was due to a reduction
in TCRab+CD4+CD25high+ CD272CD28+ as well as in
CD3+CD4+CD25high+Foxp3+CD272CD28+ T-cells. Of note,
the Treg subsets, which showed to be decreased in patients with
MS as compared to healthy individuals, expressed CD28 and
some Treg subsets expressed invariably CD27 (Figures 2 and 3)
consistent with the notion that CD28 engagement controls
homeostasis of CD4+CD25+ Treg cells [10]. A decrease of Treg
cells in the peripheral circulation has been described in patients
with MS [11], and in other autoimmune diseases, i.e. RA [12].
Natural regulatory T-cells express CD25 which resulted in the
differentiation of regulatory (CD25high), activated (CD25in-
termed) and ‘precursor’ CD4+CD25low T-cells [13]. We did not
observe significant differences between healthy donors or patients
with neurological diseases in IL-7R (CD127+) frequency or
receptor density on Treg cells. Low CD127 expression, along
with high CD25 expression has been shown to better define Treg
cells as compared to T-cells which express FOXP3+:
CD4+CD25high+CD127low+ T-cells show highly suppressive activ-
ity [14,15]. Expression of CD127 is negatively associated with
FOXP3 due to promoter-interaction [16]. However, there is a
minor, yet detectable population in CD4+CD25high+CD127+cells, these T-cells showed higher proliferative capacity and
produced more IFNc and IL-2 as compared to cells from healthy
control individuals [17] suggesting an abnormal function of
CD4+CD25high, CD127+ T-cells in patients with MS.
We observed an increase in the percentage of central memory
TCRab (CD45RA2CCR7+) in CD8ab+ and CD8aa+ T-cell
subsets. The latter immune cell population presents a distinct
memory T-cell subset, presumably associated with long-term
antigen exposure. CD8aa+ T-cells have been shown to be present
in chronic infections [18] and they are enriched in antigen specific
Figure 1. Boxplots of significant different frequencies of immune cells in healthy individuals versus patients with neurologicaldiseases. Peripheral blood mononuclear cells from 46 patients with multiple sclerosis (MS), 9 patients diagnosed with relapsing remitting MS(RRMS), 13 with secondary progressive multiple sclerosis (SPMS), 9 with other neurological diseases (OND) and well as 15 healthy donors (HD) wereanalyzed (prior to therapy) by 12 color flow cytometry (TCRab, TCRcd, CD4, CD8a, CD8b, CD45RA, CCR7, CD27, CD28, CD107a, CD127, CD14) in across-sectional study to identify variables significantly different between controls (HD) and patients (OND, RRMS, SPMS). We analyzed 187 individualimmune cell subsets (percentages), 19/187 variables segregated PBMCs obtained from healthy individuals from individuals with neurologicaldiseases. We show 18/19 variables, the number of CD127+CD19+ B-cells proved also to be different in HDs versus patients with autoimmune disease(data not shown).doi:10.1371/journal.pone.0006534.g001
Il-7R Density in MS
PLoS ONE | www.plosone.org 4 August 2009 | Volume 4 | Issue 8 | e6534
T-cell responses in patients with cancer [19] or in nonhuman
primates after BCG vaccination [20]. The percentage of central
memory phenotype CD45RA2CCR72 cells was also statistically
significant increased in TCRcd+ T-cells in patients with MS,
consistent with earlier reports which showed increased TCRcd+T-cells in target tissues [21]. CD8+ T-cells may show detrimental
immune effector functions and contribute to chronic inflammation
[22], yet they may also exert suppressive functions [23].
Noteworthy, anti.-CD25 included in our panel, or other T-cell
activation or differentiation makers, e.g. CD27 or CD28 did not
segregate CD8+ T-cell subsets in patients from MS versus healthy
individuals. Only the combinatory analysis of the CD8a and
CD8b chain along with CD45RA, CCR7+, CD27 and CD28
marker analysis was able to segregate CD8 phenotypes in patients
with MS from CD8+T-cells from healthy blood donors.
Although the IL-7R was recently incriminated as a marker for
increased risk to develop MS [24,25], we could not identify the IL-7R
in the analysis of immune cell subsets as a discriminatory marker
between healthy individuals and patients with MS. Most flow
cytometric analyses measure the percentage of distinct immune cell
subset in the parental cell population. However, functional differences
in immune cells could also be associated with the density of certain
receptor molecules on the single cell level. Therefore, we measured the
absolute number of IL-7 receptor molecules on the single cell level on
59 individual immune cell subsets (see online supplementary Table
S2). The number of IL-7R molecules/cells showed a range between
30.000 to 50.000 molecules/cell in distinct immune cell subsets, the
range is dependent on T-cell maturation (Figure 4). Memory T-cells
show a higher IL-7R density as compared to effector T-cells (see
details in supplementary Table S2). Only 2/59 immune cell
phenotypes showed significant differences in the comparison of
PBMCs from healthy individuals and patients with neurological
diseases: TCRab+CD4+CD252CD107a+ T-cells expressed higher
numbers of IL-7R molecules as compared to PBMCs obtained from
control individuals. Most likely, CD4+CD252 T-cells may represent
terminally differentiated CD4+ T-cells [9]. Although CD25 has not
been examined, a similar CD4+ T-cell phenotype was reported for
mature, human CMV-specific effector CD4+ T-cells: these T-cells
produce MIP-1b, TNFa and IFNc in the absence of IL-2 and exhibit
lytic activity associated with perforin and granzyme expression [26].
Analysis of CD107a and CD127 in PBMCs from patients with breast
cancer showed a trend, but not statistically solid differences, towards
Figure 2. Visualization of differences in immune cell frequencies using heatmaps. After quality data extraction and statistical analysis(Kruskal-Wallis test, see material and methods), p-values were obtained and a cutoff of 0.05 was applied to obtain a subset of significant variables. Thefinal analysis included a principal component analysis (PCA) to study the correlation between the variables, and cluster analysis to see the connectionbetween variables and groups of patients. Lighter colors (white) represent higher standardized values and darker represent lower standardized values(red) summarizing cellular immune phenotypes (percentages of immune cell subsets). The individual 45 (a healthy blood donor is included in theanalysis). This individual showed aberrant immune markers in PBMCs.doi:10.1371/journal.pone.0006534.g002
Il-7R Density in MS
PLoS ONE | www.plosone.org 5 August 2009 | Volume 4 | Issue 8 | e6534
lower values of IL-7R expression on CD4+CD107a+ T-cells [27]. We
could show that CD4+ T-cells obtained from patients with breast
cancer exhibit a reduced responsiveness to IL-7, defined by statistically
reduced STAT-5 phosphorylation; these data suggested that
differences in IL-7R expression, on the single cell level, may indeed
translate into biologically relevant responses to IL-7 [27]. Future
functional studies which link IL-7–mediated cellular downstream
events to IL-7R density will aid to study the clinical significance of
increased Il-7R expression. Since CD4+CD252 T-cells represent
terminally differentiated (effector) T-cells, we postulate that chronic
antigenic exposure and prolonged inflammation may contribute to the
expansion of this subset in patients with MS. It is important to note
that CD107a positive T-cells show increased IL-7R numbers on the
single cell level (Figure 5). It remains to be shown whether co-
expression of CD107a and CD127 reflects a general feature of T-cells
with effector granules, or if the CD107a+CD127+ T-cell phenotype
represents a CD4+ T-cell population associated with autoimmune
diseases or chronic inflammatory processes: CD4+CD252 cells from
patients with SLE were shown to be less sensitive to Treg activity as
compared to T-cells from healthy controls [28]. and a more recent
study showed increased numbers of CD4+CD252Foxp3+ T-cells in
patients with new-onset lupus erythematosus [29]. We propose that
the TCRab+CD4+CD252CD107a+ T-cell subset, defined by
increased numbers of IL-7R molecules, represents a terminally
differentiated [9] CD4+ T-cell population with effector granules,
associated with chronic exposure to antigen stimulation.
Materials and Methods
Immune cell phenotypingBlood was obtained from healthy, age and sex-matched blood
donors and from individuals with neurological diseases (listed in
detailed in Table 1 and 2) after informed consent (Diary number 02-
548, dated 20.Nov.2002, ethical committee Stockholm). PBMCs
were isolated using Ficoll, frozen in 90% fetal calf serum and 10%
DMSO until analysis. The recovery was 89–97% and live
lymphocytes were gated on forwarded versus sidescatter plot using
flow cytometry. Three different mAb panels (supplementary Table
S1.1 and S1.2) were used to define immune cell subsets listed in the
supplementary Table S1 (S1.3 and S1.4). The antibody panel has
been and titrated and evaluated by testing each mAb alone, or in
combination with a mix of 11 corresponding monoclonal reagents,
then by simultaneous incubation with 2 antibodies, followed by
incubation with 10 reagents. The next step included testing of a mix
Figure 3. Visualization of differences in immune cell frequencies using heatmaps. Similar data analysis as in Figure 3, yet data fromindividual 45 were excluded. This allowed to cluster immune markers obtained in PMBCs from healthy individuals and individuals with inflammatoryprocesses of the central nervous system. Lighter colors (white) represent higher standardized values and darker lower standardized values (red)summarizing immune phenotypes. p values are provided (right).doi:10.1371/journal.pone.0006534.g003
Il-7R Density in MS
PLoS ONE | www.plosone.org 6 August 2009 | Volume 4 | Issue 8 | e6534
of 3 mAbs, followed by staining with 9 mAbs. This approach
resulted in the following protocol: 0.5 million PBMCs were first
stained with anti-CCR7 for 15 minutes at 4uC, followed by addition
of the 10 color antibody mix (designated as panel 1 and panel 2, see
Table) and incubated for 15 minutes at 4uC. The anti-CD27
antibody was then added to cells which were incubated at 4uC, for
15 minutes, followed by washing with 1 ml of PBS containing 0.1%
BSA. The cell pellet was resuspended in 200 ul of PBS (0.1%BSA).
The first antibody panel (listed in the supplementary Table S1, S1.2)
was used to define 53 individual immune cell subset (S1.3) and panel
2 defined 86 subsets (S1.3) The third panel (supplementary Table
S1.2) was used to identify Treg cells yielding 44 individual immune
cell subsets: PBMCs were stained with cell surface marker
antibodies (panel 3) and incubated at 4uC for 15 minutes. PBMCs
were then washed immediately with FACS staining buffer (BD
Pharmingen, San Diego, USA) and fixed with 1 ml of 16Fix/Perm
buffer (Biolegend, San Diego, CA, USA ) at room temperature for
20 minutes followed by one washing step with FACS staining buffer
and one time with 16Permeabilization buffer (Biolegend). PBMCs
were resuspended in 1 ml of 16 permeabilization buffer and
incubated at room temperature for 15 minutes, followed by
centrifugation at 250 g for 5 minutes. The cell pellet was
resuspended in 100 ul of 16permeabilization buffer and the Alexa
488-conjugated anti-Foxp3 antibody was added, followed by an
incubation at room temperature in the dark for 30 minutes and
washed, resuspended the pellet in 100 ul of staining buffer. Flow
cytometric analysis was performed using a FACS Aria (BD
Biosciences, Immunocytometry, San Jose, USA) and data were
analyzed using FACS DIVA software (BD Biosciences). Results
were reported in an excel spreadsheets as percentage or number of
CD127-binding sites on individual immune cell subsets. Sequential
gating strategies are depicted, as a paradigm, in the supplementary
Figure S1. Freshly harvested PBMCs and the corresponding
frozen/thawed aliquots from three healthy blood donors were
analyzed for immune cell marker expression. Similar data were
obtained (data not shown) which corroborates that the flow
cytometric data are relevant for frozen as well as for freshly
harvested PBMCs. Note that the percentage of immune cells
relating to frequency in the parental population, is indicated with a
slash, i.e. TCRab+/CD4+CD25hi+/CD27+CD28+ or TCRab+/
CD4+CD25int+/Foxp3+/CD27+CD28+ cells.
IL-7R binding site analysis on a single cell level. The former
analyses defined percentages in individual immune cell subsets. In
order to define the absolute number of IL-7 receptor molecules on
immune cell subsets on a single cell level, we obtained a preparation
of the anti-IL-7 receptor alpha chain monoclonal mAb (clone
Figure 4. IL-7 receptor density is associated with T-cell maturation. IL-7 receptor molecules were enumerated on the single cell level inPBMCs from healthy controls and from patients with neurological disorders. We could not identify significant differences in IL-7R expression in TCRab,CD8ab, CD8aa, TCRcd or on TCRab+CD4+ T-cell subsets, therefore we show the data from all individuals enrolled in the study. T-cells with theCD45RA2CCR7+ phenotype exhibit the highest density of IL-7R molecules, followed by CD45RA2CCR72 T-cells and CD45RA+CCR7+(precursor) T-cells. Differentiated CD45RA+CCR72 exhibit the lowest number of IL-7R molecules. Mean and median for each T-cell subset clustered by patientgroups is provided in the supplementary Table S2. CD127 expression appears to be associated with T-cell maturation/differentiation.doi:10.1371/journal.pone.0006534.g004
Il-7R Density in MS
PLoS ONE | www.plosone.org 7 August 2009 | Volume 4 | Issue 8 | e6534
R34.34) labeled with a single APC molecule. This allows to
determine antibody binding sites, since the APC fluorescence
intensity can be compared to the fluorescence intensity associated
with the defined number of APC molecules on beads (supplemen-
tary Figure S2). Blank beads were suspended in 0.5 ml of PBS and
instrument settings were adjusted using ‘blank beads’, followed by
addition of beads (Bangs Laboratories, Inc. Indianapolis, USA) with
three different APC fluorescent intensities which reflect the number
of molecules/bead, 10e5 events were aquired. One drop of blank
microspheres was resuspended in 0.5 ml of PBS and the flow rate
was adjusted to 100–200 beads per second. The live gate of singlets
was created on a forward versus sideward scatter dot plot and a
APC histogram which showed only cells within the live gate. APC-
beads with three different fluorescence intensities (reflecting the
number of APC molecules/beads) were added to the tube with
blank beads. A calibration plot was established using Quickcal
software (Bangs Laboratories, Inc. USA ) using the median channel
fluorescence intensity values for each bead population loaded with a
distinct number of APC molecules. All PBMC samples were run
with the same instrumentation settings. Antibody binding capacity
Figure 5. Significant differences in IL-7R densities in immune cell subsets. IL-7 receptor (CD127) density analysis was carried in 59 individualimmune phenotypes using a monoclonal anti-Il-7R antibody (clone R34.34) coupled to a single APC molecule in combination with an APC-bead array.A non-parametric analysis of variance (Kruskal-Wallis test) was conducted in order to test for differences among the patient groups for each of thevariables. 2/59 variables showed increased numbers of IL-7R molecules on TCRab+CD4+CD25(intermed)+ T-cells and onTCRab+CD4+CD252CD107a+ T-cells (mean: 28376 Il-7R binding sites on cells from HD, 48515 in patients with RRMS, 38195 in patients withSPMS and 33692 IL-7 receptor binding sites on cells from patients with OND). Differences are visualized using a heatmap (top panel) and boxplots(bottom panel). p values are provided.doi:10.1371/journal.pone.0006534.g005
Il-7R Density in MS
PLoS ONE | www.plosone.org 8 August 2009 | Volume 4 | Issue 8 | e6534
values per cell were determined using the median value of CD127
(in APC molecules) of each immune cell subset using Quick Cal soft
using the beads-calibration plot.
Data management and data analysisData were originally compiled in excel files with different sheets
containing data for the variables tested. Each patient had a unique
identification code and the corresponding disease group. Analyses
were conducted separately for the immune phenotypes (percent-
ages for immune subsets) and the Il-7R density analysis. Quality
control of the data was performed by summary statistics to
detected anomalies in the data sets. Each individual variable was
tested for the null hypothesis of ‘no difference’ among the disease
groups using the non-parametric Kruskal-Wallis test. The
alternative hypothesis is that at least one disease group differed
from the other disease group (or the healthy control group). We
choose a non-parametric approach due to the small number of
individuals in each group. Given the limited data and thus low
statistical power, no further tests to identify the deviating group (or
groups) were conducted. Since a large number of tested were
conducted, i.e. multiple comparisons, we applied a method that
controls for false discovery rate (FDR) [30] and obtained new
adjusted p-values for each variable. The significance level was set
to 0.05. To visualize the results, boxplots for the significant
variables were drawn. We clustered the individuals based on their
values of the significant variables. The clustering algorithm was an
agglomerative hierarchical method based on Euclidean distance of
the average [31]. Heatmaps were produced to visualize the
clustering results (Alexander Ploner, unpublished: Heatplus: A
heatmap displaying covariates and coloring clusters, R package
version 1.6.0). The heatmaps displayed the flow cytometric
markers (in percentage of the parental T-cell population) for each
individual patient. First, the top and bottom 1 percent of the values
were trimmed to avoid extreme values, and then normalized for
each marker by subtracting the mean and divided by the standard
deviation. The values were represented on a 12-step equidistant
scale, lighter colors (white) represent higher standardized values
and darker colors (red) represent lower standardized values. All
analyses were carried out in the statistical language R, version
2.6.2. (http://www.R-project.org)
Supporting Information
Figure S1 Detailed gating strategies for T-cell subsets, including
Tregs.
Found at: doi:10.1371/journal.pone.0006534.s001 (0.07 MB
PDF)
Figure S2 Paradigm of IL-7R (CD127) enumeration on immune
cells. A. Cells from the lymphogate were subjected to further
gating (n = 59 different subsets). The anti-IL-7 receptor alpha
chain monoclonal mAb (clone R34.34) labeled with a single APC
molecule was used to define CD127 antibody binding sites, since
the APC fluorescence intensity can be compared to the
fluorescence intensity associated with the defined number of
APC molecules on beads (middle panel) with different APC
molecules (top panel, right). A calibration plot was established
using Quickcal software V2.3 (Bangs Laboratories, Inc. USA)
using the median channel fluorescence intensity values for each
bead population loaded with a distinct number of APC molecules.
All PBMC samples were run with the same instrumentation
settings. Antibody binding capacity values per cell were deter-
mined using the median value of CD127 (in APC) of each immune
cell subset using Quick Cal soft using the beads calibration plot. B.
Although the number of CD127+ T-cells may be different, e.g.
lower in individuals with autoimmune disease, the expression of
CD127 molecules on single cells may be higher.
Found at: doi:10.1371/journal.pone.0006534.s002 (0.05 MB
PDF)
Table S1 Compilation of monoclonal antibodies and immune
cell subsets.
Found at: doi:10.1371/journal.pone.0006534.s003 (0.03 MB
PDF)
Table S2 Mean and Median values of IL-7 Receptor densities
on T-cell subsets
Found at: doi:10.1371/journal.pone.0006534.s004 (0.08 MB
PDF)
Table S3 Number of events (min-max) for TCRab+CD4+CD252CD107a+CD127+ and TCRab+CD4+CD25intermed+CD127+ T-cell subsets
Found at: doi:10.1371/journal.pone.0006534.s005 (0.02 MB
PDF)
Author Contributions
Conceived and designed the experiments: NV TO MM. Performed the
experiments: NV. Analyzed the data: NV SKB MK VSM TO MM.
Contributed reagents/materials/analysis tools: SKB MK. Wrote the paper:
NV SKB MM.
References
1. Sospedra M, Martin R (2005) Immunology of multiple sclerosis. Annu Rev
Immunol 23: 683–747.
2. Noseworthy JH, Lucchinetti C, Rodriguez M, Weinshenker BG (2000) Multiple
sclerosis. N Engl J Med 343: 938–952.
3. Rinaldi L, Gallo P, Calabrese M, Ranzato F, Luise D, et al. (2006) Longitudinal
analysis of immune cell phenotypes in early stage multiple sclerosis: distinctive
patterns characterize MRI-active patients. Brain 129: 1993–2007.
4. De Jager PL, Rossin E, Pyne S, Tamayo P, Ottoboni L, et al. (2008) Cytometric
profiling in multiple sclerosis uncovers patient population structure and areduction of CD8low cells. Brain.
5. Reinherz EL, Weiner HL, Hauser SL, Cohen JA, Distaso JA, et al. (1980) Loss
of suppressor T cells in active multiple sclerosis. Analysis with monoclonalantibodies. N Engl J Med 303: 125–129.
6. Bielekova B, Muraro PA, Golestaneh L, Pascal J, McFarland HF, et al. (1999)Preferential expansion of autoreactive T lymphocytes from the memory T-cell
pool by IL-7. J Neuroimmunol 100: 115–123.
7. Mackall CL, Fry TJ, Bare C, Morgan P, Galbraith A, et al. (2001) IL-7 increasesboth thymic-dependent and thymic-independent T-cell regeneration after bone
marrow transplantation. Blood 97: 1491–1497.
8. Calzascia T, Pellegrini M, Lin A, Garza KM, Elford AR, et al. (2008) CD4 T
cells, lymphopenia, and IL-7 in a multistep pathway to autoimmunity. Proc Natl
Acad Sci U S A 105: 2999–3004.
9. Passerini L, Allan SE, Battaglia M, Di Nunzio S, Alstad AN, et al. (2008)
STAT5-signaling cytokines regulate the expression of FOXP3 in CD4+CD25+regulatory T cells and CD4+CD252 effector T cells. Int Immunol 20: 421–
431.
10. Tang Q, Henriksen KJ, Boden EK, Tooley AJ, Ye J, et al. (2003) Cutting edge:
CD28 controls peripheral homeostasis of CD4+CD25+ regulatory T cells.J Immunol 171: 3348–3352.
11. Viglietta V, Baecher-Allan C, Weiner HL, Hafler DA (2004) Loss of functional
suppression by CD4+CD25+ regulatory T cells in patients with multiplesclerosis. J Exp Med 199: 971–979.
12. Ehrenstein MR, Evans JG, Singh A, Moore S, Warnes G, et al. (2004)Compromised function of regulatory T cells in rheumatoid arthritis and reversal
by anti-TNFalpha therapy. J Exp Med 200: 277–285.
13. Dieckmann D, Plottner H, Berchtold S, Berger T, Schuler G (2001) Ex vivoisolation and characterization of CD4(+)CD25(+) T cells with regulatory
properties from human blood. J Exp Med 193: 1303–1310.
14. Seddiki N, Santner-Nanan B, Martinson J, Zaunders J, Sasson S, et al. (2006)
Expression of interleukin (IL)-2 and IL-7 receptors discriminates between humanregulatory and activated T cells. J Exp Med 203: 1693–1700.
15. Liu W, Putnam AL, Xu-Yu Z, Szot GL, Lee MR, et al. (2006) CD127
expression inversely correlates with FoxP3 and suppressive function of human
CD4+ T reg cells. J Exp Med 203: 1701–1711.
Il-7R Density in MS
PLoS ONE | www.plosone.org 9 August 2009 | Volume 4 | Issue 8 | e6534
16. Hohlfeld R, Wekerle H (2004) Autoimmune concepts of multiple sclerosis as a
basis for selective immunotherapy: from pipe dreams to (therapeutic) pipelines.Proc Natl Acad Sci U S A 101 Suppl 2: 14599–14606.
17. Michel L, Berthelot L, Pettre S, Wiertlewski S, Lefrere F, et al. (2008) Patients
with relapsing-remitting multiple sclerosis have normal Treg function when cellsexpressing IL-7 receptor alpha-chain are excluded from the analysis. J Clin
Invest 118: 3411–3419.18. Madakamutil LT, Christen U, Lena CJ, Wang-Zhu Y, Attinger A, et al. (2004)
CD8alphaalpha-mediated survival and differentiation of CD8 memory T cell
precursors. Science 304: 590–593.19. Magalhaes I, Vudattu NK, Jager E, Maeurer MJ (2008) Tumor antigen-specific
T-cells are Present in the CD8alphaalpha+ T-cell effector-memory pool.J Immunother 31: 840–848.
20. Magalhaes I, Sizemore DR, Ahmed RK, Mueller S, Wehlin L, et al. (2008)rBCG induces strong antigen-specific T cell responses in rhesus macaques in a
prime-boost setting with an adenovirus 35 tuberculosis vaccine vector. PLoS
ONE 3: e3790.21. Selmaj K, Brosnan CF, Raine CS (1991) Colocalization of lymphocytes bearing
gamma delta T-cell receptor and heat shock protein hsp65+ oligodendrocytes inmultiple sclerosis. Proc Natl Acad Sci U S A 88: 6452–6456.
22. McDole J, Johnson AJ, Pirko I (2006) The role of CD8+ T-cells in lesion
formation and axonal dysfunction in multiple sclerosis. Neurol Res 28: 256–261.23. Johnson AJ, Suidan GL, McDole J, Pirko I (2007) The CD8 T cell in multiple
sclerosis: suppressor cell or mediator of neuropathology? Int Rev Neurobiol 79:73–97.
24. Gregory SG, Schmidt S, Seth P, Oksenberg JR, Hart J, et al. (2007) Interleukin
7 receptor alpha chain (IL7R) shows allelic and functional association with
multiple sclerosis. Nat Genet 39: 1083–1091.
25. Lundmark F, Duvefelt K, Hillert J (2007) Genetic association analysis of the
interleukin 7 gene (IL7) in multiple sclerosis. J Neuroimmunol 192: 171–173.
26. Casazza JP, Betts MR, Price DA, Precopio ML, Ruff LE, et al. (2006)
Acquisition of direct antiviral effector functions by CMV-specific CD4+ T
lymphocytes with cellular maturation. J Exp Med 203: 2865–2877.
27. Vudattu NK, Magalhaes I, Schmidt M, Seyfert-Margolis V, Maeurer MJ (2007)
Reduced numbers of IL-7 receptor (CD127) expressing immune cells and IL-7-
signaling defects in peripheral blood from patients with breast cancer.
Int J Cancer 121: 1512–1519.
28. Venigalla RK, Tretter T, Krienke S, Max R, Eckstein V, et al. (2008) Reduced
CD4+,CD252 T cell sensitivity to the suppressive function of
CD4+,CD25high,CD1272/low regulatory T cells in patients with active
systemic lupus erythematosus. Arthritis Rheum 58: 2120–2130.
29. Zhang B, Zhang X, Tang FL, Zhu LP, Liu Y, et al. (2008) Clinical significance
of increased CD4+CD252Foxp3+ T cells in patients with new-onset systemic
lupus erythematosus. Ann Rheum Dis 67: 1037–1040.
30. Benjamini Y, Hochberg Y (1995) Controlling the false discovery rate: a practical
and powerful approach to multiple testing. J Royal Statistical Soc, Series B 57:
289–300.
31. Kaufman L, Rousseeeuw PJ (1990) Finding Groups in Data: An Introduction to
Cluster Analysis. New York: Wiley.
Il-7R Density in MS
PLoS ONE | www.plosone.org 10 August 2009 | Volume 4 | Issue 8 | e6534
Related Documents
![Review Article ...concurrently with OVA, inhibited both airway neutrophilia andeosinophilia[48].Itwasalsoshownthatallergen-specific CD4+CD25+ Tregs can suppress allergic airway disease](https://static.cupdf.com/doc/110x72/613135a61ecc51586944974c/review-article-concurrently-with-ova-inhibited-both-airway-neutrophilia-andeosinophilia48itwasalsoshownthatallergen-speciic.jpg)