Citation: Chen, Y.-S.; Chen, M.-H.; Wang, P.-M.; Lu, C.-H.; Chen, H.-L.; Lin, W.-C. Increased Levels of Plasma Alzheimer’s Disease Biomarkers and Their Associations with Brain Structural Changes and Carotid Intima-Media Thickness in Cognitively Normal Obstructive Sleep Apnea Patients. Diagnostics 2022, 12, 1522. https://doi.org/ 10.3390/diagnostics12071522 Academic Editor: Panteleimon Giannakopoulos Received: 11 May 2022 Accepted: 20 June 2022 Published: 22 June 2022 Publisher’s Note: MDPI stays neutral with regard to jurisdictional claims in published maps and institutional affil- iations. Copyright: © 2022 by the authors. Licensee MDPI, Basel, Switzerland. This article is an open access article distributed under the terms and conditions of the Creative Commons Attribution (CC BY) license (https:// creativecommons.org/licenses/by/ 4.0/). diagnostics Article Increased Levels of Plasma Alzheimer’s Disease Biomarkers and Their Associations with Brain Structural Changes and Carotid Intima-Media Thickness in Cognitively Normal Obstructive Sleep Apnea Patients Yueh-Sheng Chen 1 , Meng-Hsiang Chen 1 , Pei-Ming Wang 2 , Cheng-Hsien Lu 3 , Hsiu-Ling Chen 1, * and Wei-Che Lin 1, * 1 Department of Diagnostic Radiology, Kaohsiung Chang Gung Memorial Hospital, Chang Gung University College of Medicine, Kaohsiung 833, Taiwan; [email protected] (Y.-S.C.); [email protected] (M.-H.C.) 2 Department of Family Medicine, Kaohsiung Chang Gung Memorial Hospital, Kaohsiung 833, Taiwan; [email protected] 3 Department of Neurology, Kaohsiung Chang Gung Memorial Hospital, Chang Gung University College of Medicine, Kaohsiung 833, Taiwan; [email protected] * Correspondence: [email protected] (H.-L.C.); [email protected] (W.-C.L.); Tel.: +886-7-731-7123 (ext. 3027) (H.-L.C. & W.-C.L.); Fax: +886-7-731-7123 (ext. 2523) (H.-L.C. & W.-C.L.) Abstract: Obstructive sleep apnea (OSA) has been linked to Alzheimer’s disease (AD) and amyloid deposition in the brain. OSA is further linked to the development of cardiovascular and cerebrovas- cular diseases. In this study, we analyzed the plasma levels of AD neuropathology biomarkers and their relationships with structural changes of the brain and atherosclerosis. Thirty OSA patients with normal cognition and 34 normal controls were enrolled. Cognitive functions were assessed by the Wechsler Adult Intelligence Scale third edition and Cognitive Ability Screening Instrument. Plasma Aβ-40, Aβ-42, and T-tau levels were assayed using immunomagnetic reduction. The carotid intima-media thickness was measured to assess the severity of atherosclerosis. Structural MR images of brain were acquired with voxel-based morphometric analysis of T1 structural images. The OSA patients exhibited significantly elevated plasma levels of Aβ-42 and T-tau, as well as increased gray matter volume in the right precuneus. Plasma T-tau level is associated with carotid intima-media thickness and gray matter volume of the precuneus. These findings may indicate early changes that precede clinically apparent cognitive impairment. The measurement of these biomarkers may aid in the early detection of OSA-associated morbidity and possible treatment planning for the prevention of irreversible neuronal damage and cognitive dysfunction. Keywords: obstructive sleep apnea; Alzheimer’s disease; biomarker; neuroimaging 1. Introduction Obstructive sleep apnea (OSA) is a common breathing disorder during sleep which is associated with intermittent hypoxia and sleep fragmentation [1]. OSA is associated with Alzheimer ’s disease (AD) and amyloid deposition in the brain [2,3]. Amyloid β (Aβ) aggre- gation with plaque development and tau-hyperphosphorylation forming neurofibrillary tangles are hallmarks of AD neuropathology [4]. The possible mechanisms responsible for AD neuropathology in OSA patients include intermittent hypoxia, sleep fragmentation, and elevated intrathoracic and intracranial pressures [5]. Currently, methods for assess- ing AD neuropathology in a clinical setting include positron electron tomography (PET) imaging, cerebrospinal fluid (CSF)-based analysis, and blood-based analysis. Among these, blood-based analysis is less invasive and more cost-effective for routine clinical use [6]. As normal functioning of the sleep-wake cycle is necessary for regulating the clearance of amyloid, the characteristic sleep disruption in OSA patients may impair such clearance, Diagnostics 2022, 12, 1522. https://doi.org/10.3390/diagnostics12071522 https://www.mdpi.com/journal/diagnostics

Welcome message from author
This document is posted to help you gain knowledge. Please leave a comment to let me know what you think about it! Share it to your friends and learn new things together.
Transcript

Citation: Chen, Y.-S.; Chen, M.-H.;
Wang, P.-M.; Lu, C.-H.; Chen, H.-L.;
Lin, W.-C. Increased Levels of Plasma
Alzheimer’s Disease Biomarkers and
Their Associations with Brain
Structural Changes and Carotid
Intima-Media Thickness in
Cognitively Normal Obstructive
Sleep Apnea Patients. Diagnostics
2022, 12, 1522. https://doi.org/
10.3390/diagnostics12071522
Academic Editor: Panteleimon
Giannakopoulos
Received: 11 May 2022
Accepted: 20 June 2022
Published: 22 June 2022
Publisher’s Note: MDPI stays neutral
with regard to jurisdictional claims in
published maps and institutional affil-
iations.
Copyright: © 2022 by the authors.
Licensee MDPI, Basel, Switzerland.
This article is an open access article
distributed under the terms and
conditions of the Creative Commons
Attribution (CC BY) license (https://
creativecommons.org/licenses/by/
4.0/).
diagnostics
Article
Increased Levels of Plasma Alzheimer’s Disease Biomarkersand Their Associations with Brain Structural Changes andCarotid Intima-Media Thickness in Cognitively NormalObstructive Sleep Apnea PatientsYueh-Sheng Chen 1, Meng-Hsiang Chen 1, Pei-Ming Wang 2, Cheng-Hsien Lu 3, Hsiu-Ling Chen 1,*and Wei-Che Lin 1,*
1 Department of Diagnostic Radiology, Kaohsiung Chang Gung Memorial Hospital, Chang Gung UniversityCollege of Medicine, Kaohsiung 833, Taiwan; [email protected] (Y.-S.C.); [email protected] (M.-H.C.)
2 Department of Family Medicine, Kaohsiung Chang Gung Memorial Hospital, Kaohsiung 833, Taiwan;[email protected]
3 Department of Neurology, Kaohsiung Chang Gung Memorial Hospital, Chang Gung University College ofMedicine, Kaohsiung 833, Taiwan; [email protected]
* Correspondence: [email protected] (H.-L.C.); [email protected] (W.-C.L.);Tel.: +886-7-731-7123 (ext. 3027) (H.-L.C. & W.-C.L.); Fax: +886-7-731-7123 (ext. 2523) (H.-L.C. & W.-C.L.)
Abstract: Obstructive sleep apnea (OSA) has been linked to Alzheimer’s disease (AD) and amyloiddeposition in the brain. OSA is further linked to the development of cardiovascular and cerebrovas-cular diseases. In this study, we analyzed the plasma levels of AD neuropathology biomarkers andtheir relationships with structural changes of the brain and atherosclerosis. Thirty OSA patientswith normal cognition and 34 normal controls were enrolled. Cognitive functions were assessedby the Wechsler Adult Intelligence Scale third edition and Cognitive Ability Screening Instrument.Plasma Aβ-40, Aβ-42, and T-tau levels were assayed using immunomagnetic reduction. The carotidintima-media thickness was measured to assess the severity of atherosclerosis. Structural MR imagesof brain were acquired with voxel-based morphometric analysis of T1 structural images. The OSApatients exhibited significantly elevated plasma levels of Aβ-42 and T-tau, as well as increased graymatter volume in the right precuneus. Plasma T-tau level is associated with carotid intima-mediathickness and gray matter volume of the precuneus. These findings may indicate early changes thatprecede clinically apparent cognitive impairment. The measurement of these biomarkers may aid inthe early detection of OSA-associated morbidity and possible treatment planning for the preventionof irreversible neuronal damage and cognitive dysfunction.
Keywords: obstructive sleep apnea; Alzheimer’s disease; biomarker; neuroimaging
1. Introduction
Obstructive sleep apnea (OSA) is a common breathing disorder during sleep which isassociated with intermittent hypoxia and sleep fragmentation [1]. OSA is associated withAlzheimer’s disease (AD) and amyloid deposition in the brain [2,3]. Amyloid β (Aβ) aggre-gation with plaque development and tau-hyperphosphorylation forming neurofibrillarytangles are hallmarks of AD neuropathology [4]. The possible mechanisms responsible forAD neuropathology in OSA patients include intermittent hypoxia, sleep fragmentation,and elevated intrathoracic and intracranial pressures [5]. Currently, methods for assess-ing AD neuropathology in a clinical setting include positron electron tomography (PET)imaging, cerebrospinal fluid (CSF)-based analysis, and blood-based analysis. Among these,blood-based analysis is less invasive and more cost-effective for routine clinical use [6].
As normal functioning of the sleep-wake cycle is necessary for regulating the clearanceof amyloid, the characteristic sleep disruption in OSA patients may impair such clearance,
Diagnostics 2022, 12, 1522. https://doi.org/10.3390/diagnostics12071522 https://www.mdpi.com/journal/diagnostics

Diagnostics 2022, 12, 1522 2 of 12
resulting in the development of AD neuropathology. Furthermore, vascular injury isan important factor in the development of Aβ plaque pathology, possibly due to theimpaired neuronal supply of nutrients and reduced Aβ clearance [4]. In OSA patients,there is considerable evidence of its association with the development of cardiovascular andcerebrovascular diseases [7,8]. Carotid intima-media thickness (IMT), a valuable markerfor atherosclerosis, has been investigated for its association with OSA patients [9,10]. Thepresence of increased oxidative stress and inflammation in OSA patients may contributeto vessel injury and the development of atherosclerotic diseases [9]. Meanwhile, vasculardamage may also contribute to the development of AD neuropathology and cognitiveimpairment [11].
Magnetic resonance imaging (MRI) is an effective tool for investigating changes of thebrain non-invasively. Voxel-based morphometry (VBM) is an assumption-free, objective,data-driven approach for evaluating gray matter volume (GMV) differences in a voxel-wise manner throughout the brain. Previous studies have reported inconsistent findingswith regards to the potential link between structural and functional brain changes in OSApatients. More specifically, studies have reported both increased and decreased GMV andfunctional connectivity in various brain regions in OSA groups as compared to normalcontrols [12,13].
In this study, we investigated the hypothesis that OSA patients would exhibit increasedplasma levels of AD neuropathology biomarkers. We also explored the relationships amongthese biomarkers, IMT, and structural changes of the brain. By studying patients withpreserved cognitive function, our results may indicate early changes prior to the occurrenceof irreversible brain damage and cognitive impairment.
2. Materials and Methods2.1. Subjects
This retrospective cross-sectional study consisted of 30 OSA patients and 34 age-matched normal controls (NCs). The OSA patients and 17 of the NCs were recruited fromthe Kaohsiung Chang Gung Memorial Hospital Sleep Center with a primary complaintof snoring. Another 17 NCs were enrolled from the community without sleep-relatedsymptoms. All participants with snoring had an overnight polysomnography (PSG) exami-nation and were divided into patient and control groups based on the standard diagnosticcriteria [14]. The definition for apnea/hypopnea index (AHI) was the number of apneasand hypopneas per hour in the sleep time. The diagnosis of OSA was made if the patientshave OSA symptoms while having an AHI of more than 5/h or those solely having anAHI of more than 15/h. We excluded participants with central type sleep apnea. None ofthe participants had received OSA-related treatment. We excluded all participants withmajor neurological or psychiatric disorders, head trauma, stroke, diabetes mellitus, obesity(BMI ≥ 30), and major cardiovascular disorders. The Kaohsiung Chang Gung MemorialHospital Ethics Committee approved this study.
2.2. Neuropsychological Assessments and Carotid IMT Measurement
The neuropsychological testing included subtests from the Chinese versions of theWechsler Adult Intelligence Scale-III (WAIS-III) [15] and the Cognitive Ability ScreeningInstrument (CASI) [16], which were performed by a clinical psychologist who was blindedto the grouping status of each participant. The attention function was assessed by the digitspan test from WAIS-III, and the attention and orientation tests from CASI. The executivefunction was assessed by the digit symbol coding and arithmetic tests from WAIS-III, andthe abstract thinking test from CASI. The memory function was assessed by the short-termand long-term memory tests from WAIS-III, and the information test from CASI. The speechand language function was assessed by the comprehension test from WAIS-III, and thelanguage and semantic fluency tests from CASI. The visuospatial function was assessedby the picture completion and block design tests from WAIS-III, and the drawing testfrom CASI.
Diagnostics 2022, 12, 1522 3 of 12
IMT is defined by the distance between the intima–blood interface and the adventitia–media junction. The carotid IMT measurement was conducted in accordance with aprevious report [9]. The extracranial color-coded duplex sonography (ECCS) examinationwas conducted using the B-mode ultrasound system (Philips HDI 5000 System, 4–10 MHzlinear array transducer; Advanced Technology Laboratories-Philips, Bothell, WA, Australia).The images were obtained at the common carotid artery in the longitudinal plane along a1-cm length proximal to the carotid bulb. The measurement was done automatically bythe QLAB quantification software (ATL-Philips). All IMT measurements were performedby the same experienced sonographer, who was blinded to the participants’ condition, bymeasuring both sides of the common carotid artery and reporting the average.
2.3. Blood Samples and Assessment of Plasma AD Biomarkers (Aβ-40, Aβ-42, T-tau)
All participants received a forearm vein venipuncture between 10:00 a.m.–11:30 a.m.to avoid potential interference due to the sleep-wake cycle. Blood samples were collectedusing a 10-mL K3-EDTA tube (Greiner Bio-One 455036) and centrifugation was conductedat 1500–2500× g at a temperature of 15–25 ◦C for 15 min using a swing-out rotor. Then,0.5 mL of plasma was removed from the blood tube and transferred into a fresh 1.5 mLEppendorf tube. Prior to performing the assays, the aliquoted plasma samples were frozenat a temperature of −80 ◦C within 3 h of the blood draw.
The analysis of AD biomarkers using immunomagnetic reduction (IMR) technologyhas been described in previous reports [17,18]. Various kits for assaying the concentrationsof AD biomarkers consisting of magnetic Fe3O4 nanoparticles reagents (total tau (T-tau)(MF-TAU-0060, MagQu), Aβ-40 (MF-AB0-0060, MagQu), Aβ-42 (MF-AB2-0060, MagQu))that were biofunctionalized with monoclonal antibodies (sc-12767, Santa Cruz Biotech)were used. Eighty microliters of reagents were mixed with 40µL of plasma for assayingthe concentrations of T-tau and Aβ-40. Sixty microliters of reagents were mixed with 60µLof plasma for assaying the concentration of Aβ-42. The IMR signals from the magneticconcentrations of the immunocomplex were detected using a superconducting-quantum-interference-device (SQUID)-based alternative current (ac) magnetosusceptometer (XacPro-S, MagQu). The signals were then transformed into biomarker concentrations via theconcentration-dependent IMR signal. A duplicate measurement was performed for eachbiomarker testing. The detected concentrations were determined by the average value of theduplicated measurements. The coefficient of variation (CV), defined as standard deviationdivided by average, was used for quality control. A CV below 20% was consideredacceptable. If a CV of greater than 20% occurred, we performed an additional measurement.We selected two of the three measurements resulting in a CV below 20% for averaging toachieve the final concentration of the biomarker. The limit of detection in Tau, Ab40 andAb42 with IMR are 0.026, 0.53, and 0.77 pg/mL, respectively [19,20].
2.4. MRI Data AcquisitionImage Acquisition
The MRI scan was performed using a 3.0 Tesla whole-body GE Signa MRI system (Gen-eral Electric Healthcare, Milwaukee, WI, USA) equipped with an eight-channel head coil.Each participant’s head was immobilized with foam pillows in the coil to minimize motion.The T1-weighted image was acquired along the AC-PC line using the three-dimensionalfluid-attenuated inversion-recovery fast spoiled gradient recalled echo sequence (3D IR-FSPGR, repetition time(TR)/echo time(TE)/inversion time = 9.5/3.9/450 ms, flip angle = 20◦,FOV = 25.6 cm, matrix size = 512 × 512, voxel size = 0.47 × 0.47 × 1.3 mm3, 110 sliceswithout gaping). An experienced neuroradiologist examined all images to check for thepresence of any brain abnormalities.
2.5. Image Preprocessing
The images were preprocessed by Statistical Parametric Mapping 12 (SPM12; Univer-sity College London) running on Matlab R2016a (Mathworks). The T1-weighted structural
Diagnostics 2022, 12, 1522 4 of 12
MR images were segmented into gray matter (GM), white matter (WM), and cerebrospinalfluid (CSF) compartments during the segmentation process. The DARTEL (DiffeomorphicAnatomical Registration Through Exponentiated Lie Algebra) algorithm was applied forthe normalization process. The study-specific tissue templates were created using MRimages from all participants. The GM segments were warped into the new reference spacewith interpolation to 1.5 mm isotropic voxels. Modulation was performed to preserve theactual volumetric information, and the warped GM segments were affine transformed intoMontreal Neurological Institute (MNI) space. Smoothing was conducted on the modulatedGM segments using an 8-mm full-width-at-half-maximum (FWHM) Gaussian kernel. Theprobability threshold was set at 0.2 to avoid an edge effect for possible incorporation oftissue with lower GM probability. Total intracranial volumes (TIV) were calculated byadding up the total voxels of GM, WM, and CSF in the native space separately.
2.6. Statistical Analyses2.6.1. Analyses of Demographic Data, Plasma Biomarkers, Clinical Assessments, andNeuropsychological Testing
Age and BMI data were analyzed using independent t tests, while sex data werecompared using the Pearson chi-square test. The plasma biomarkers, polysomnographyparameters, and IMT of CCA were compared by analysis of covariance (ANCOVA) aftercontrolling for age and sex. The neuropsychological testing scores were compared byANCOVA after controlling for age, sex, and education level. Only tests where OSA patientshad significantly different scores than controls were considered for correlation analysis.Correlations between plasma biomarkers, GMV, and clinical assessments were conductedby partial correlation analysis with age and sex as covariates. Continuous variables werepresented as mean ± standard deviation. Statistical analysis was performed using theStatistical Product and Service Solutions software version 19 (IBM SPSS). A p value lessthan 0.05 was considered statistically significant.
2.6.2. Voxel-Based Morphometry Analysis
The GMV comparison between OSA patients and normal controls was performed us-ing voxel-wise group comparisons with full factorial design. Age, sex, and total intracranialvolume (TIV: calculated as the sum of the total voxels of GM, WM, and CSF) were includedas covariates. This facilitated the detection of any regional GMV differences that may existbetween the two groups. The results were considered significant under the criteria offamily-wise error (FWE)-corrected p value < 0.05, using Monte Carlo simulation with acluster size of at least 228 voxels (AFNI 3dClusterSim with the following parameters: singlevoxel p value < 0.001, full width at half maximum (FWHM) = 8 mm with gray matter mask,and 10,000 simulations).
3. Results3.1. Baseline Clinical Characteristics of OSA Patients and Controls
The baseline clinical demographic data and neuro-psychological assessment scores ofall subjects are shown in Table 1. The OSA group had significantly more males than thecontrol group. There were no significant age or BMI differences between the OSA patientsand controls. As expected, there were significant differences in the polysomnographyparameters and IMT of CCA between the OSA patients and controls. None of the subtestsin all five domains of NPT showed significant differences between the two groups.

Diagnostics 2022, 12, 1522 5 of 12
Table 1. Demographic data, plasma biomarker, clinical assessment, and neuro-psychological assess-ment data of patients with OSA and controls.
Clinical Demographics and Plasma Biomarker OSA (n = 30) Control (n = 34) p Value
Age (year) 41.93 ± 1.65 43.21 ± 2.25 0.65Sex (M, F) 27:3 17 ± 17 0.001 *BMI 26.18 ± 0.52 24.83 ± 0.54 0.08T-tau (pg/mL) 21.43 ± 0.55 18.27 ± 0.85 0.025 *Aβ42 (pg/mL) 16.17 ± 0.12 15.37 ± 0.26 0.041 *Aβ40 (pg/mL) 53.00 ± 0.90 54.61 ± 1.25 0.414Aβ42/Aβ40 0.30 ± 0.04 0.29 ± 0.08 0.219
Polysomnography parameters andIMT of CCA #
AHI 41.93 ± 4.33 2.68 ± 0.29 <0.001 *ODI 32.75 ± 4.22 0.91 ± 0.21 <0.001 *O2 < 90% (% per night) 8.47 ± 1.44 0.44 ± 0.28 <0.001 *Average O2 95.00 ± 0.27 97.06 ± 0.19 <0.001 *Snoring index 374.00 ± 33.82 233.62 ± 56.32 0.052IMT 0.65 ± 0.12 0.54 ± 0.07 0.003 *
Neuro-psychological assessmentsAttention Function
Digit span 10.27 ± 2.57 11.53 ± 2.97 0.112Attention 7.60 ± 0.72 7.74 ± 0.51 0.843Orientation 17.93 ± 0.37 17.94 ± 0.24 0.332
Executive FunctionDigit symbol coding 10.87 ± 2.30 11.32 ± 2.04 0.943Arithmetic 10.77 ± 2.24 10.53 ± 2.31 0.590Abstract thinking 9.93 ± 1.26 10.03 ± 1.66 0.879
Memory FunctionShort-term memory 10.40 ± 1.34 10.33 ± 1.34 0.738Long-term memory 9.87 ± 0.51 9.94 ± 0.34 0.510Information 10.80 ± 3.02 11.21 ± 3.31 0.131
Speech and LanguageComprehension 10.83 ± 2.45 11.12 ± 2.63 0.435Language 9.85 ± 0.35 9.85 ± 0.36 0.693Semantic fluency 8.80 ± 1.71 8.59 ± 1.78 0.884
Visuospatial FunctionPicture completion 11.50 ± 2.40 10.68 ± 2.67 0.504Block design 11.37 ± 2.55 10.41 ± 3.00 0.555Drawing 9.97 ± 0.18 9.94 ± 0.24 0.276
Abbreviations: OSA, obstructive sleep apnea; BMI, body mass index; Aβ, amyloid beta; AHI, apnea-hypopneaIndex; ODI, oxygen desaturation Index; IMT, intima-media thickness; CCA, common carotid artery. Sex datawere compared by Pearson chi-square test. Age and BMI data were compared by independent t test. Theplasma biomarker, polysomnography parameters, and IMT of CCA were compared by analysis of covariance(ANCOVA) after controlling for age and sex. Neuro-psychological assessment data were compared by ANCOVAafter controlling for age, sex, and education level. Data are presented as mean ± standard error of the meanfor age, BMI, AD biomarker level, and polysomnography parameters. Data are presented as mean ± standarddeviation for rest of the data. * p < 0.05. # Among 34 controls, data were only available in 17 subjects.
3.2. Plasma Biomarkers between OSA Patients and Controls
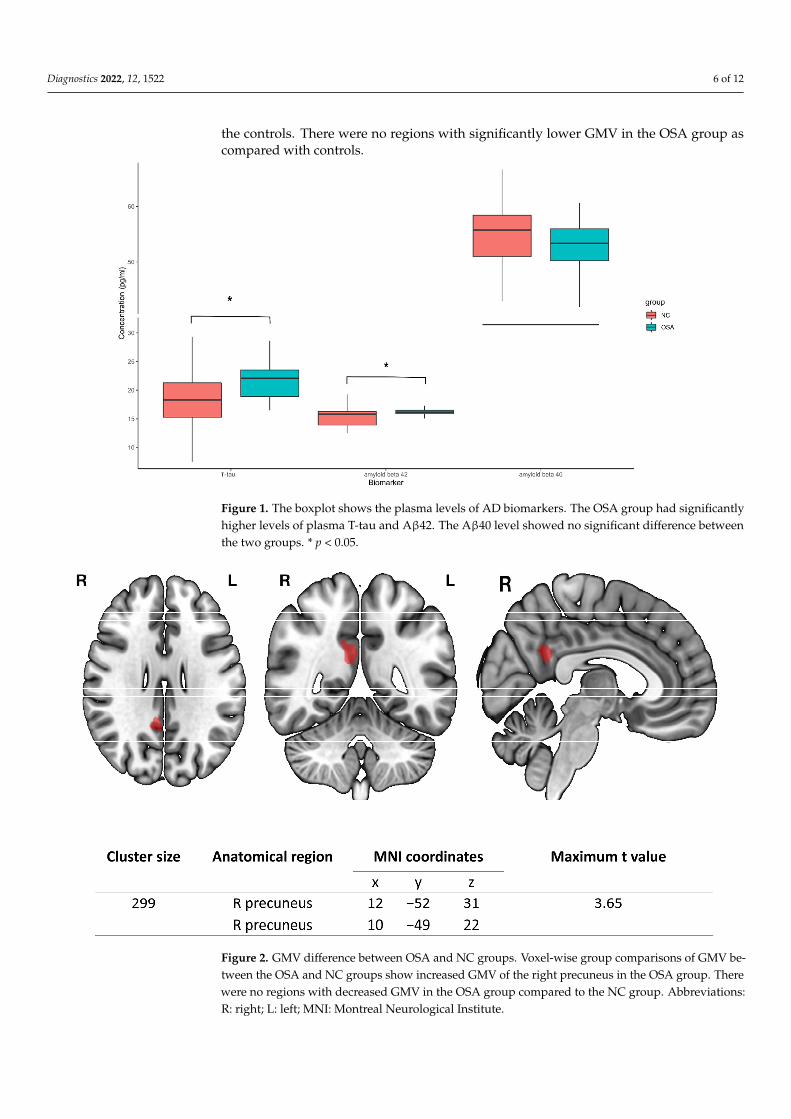
The levels of plasma biomarkers were analyzed using IMR. The OSA patients hadsignificantly higher plasma T-tau (21.43 ± 0.55 pg/mL in OSA patients; 18.27 ± 0.85 pg/mLin normal controls) and Aβ42 (16.17 ± 0.12 pg/mL in OSA patients; 15.37 ± 0.26 pg/mLin normal controls). Aβ40 (53.00 ± 0.90 pg/mL in OSA patients; 54.61 ± 1.25 pg/mL innormal controls) showed no significant difference between the two groups (Figure 1).
3.3. Comparison of Regional GMV between OSA Patients and Controls
The results of the voxel-wise whole brain analysis with full factorial design are demon-strated in Figure 2. OSA patients had significantly higher GMV in the right precuneus than
Diagnostics 2022, 12, 1522 6 of 12
the controls. There were no regions with significantly lower GMV in the OSA group ascompared with controls.
Diagnostics 2022, 12, x FOR PEER REVIEW 6 of 13
3.2. Plasma Biomarkers between OSA Patients and Controls The levels of plasma biomarkers were analyzed using IMR. The OSA patients had
significantly higher plasma T-tau (21.43 ± 0.55 pg/mL in OSA patients; 18.27 ± 0.85 pg/mL in normal controls) and Aβ42 (16.17 ± 0.12 pg/mL in OSA patients; 15.37 ± 0.26 pg/mL in normal controls). Aβ40 (53.00 ± 0.90 pg/mL in OSA patients; 54.61 ± 1.25 pg/mL in normal controls) showed no significant difference between the two groups (Figure 1).
Figure 1. The boxplot shows the plasma levels of AD biomarkers. The OSA group had significantly higher levels of plasma T-tau and Aβ42. The Aβ40 level showed no significant difference between the two groups. * p < 0.05.
3.3. Comparison of Regional GMV between OSA Patients and Controls The results of the voxel-wise whole brain analysis with full factorial design are
demonstrated in Figure 2. OSA patients had significantly higher GMV in the right precu-neus than the controls. There were no regions with significantly lower GMV in the OSA group as compared with controls.
Figure 1. The boxplot shows the plasma levels of AD biomarkers. The OSA group had significantlyhigher levels of plasma T-tau and Aβ42. The Aβ40 level showed no significant difference betweenthe two groups. * p < 0.05.
Diagnostics 2022, 12, x FOR PEER REVIEW 7 of 13
Figure 2. GMV difference between OSA and NC groups. Voxel-wise group comparisons of GMV between the OSA and NC groups show increased GMV of the right precuneus in the OSA group. There were no regions with decreased GMV in the OSA group compared to the NC group. Abbre-viations: R: right; L: left; MNI: Montreal Neurological Institute.
3.4. Correlations between Plasma Biomarkers, Clinical Parameters, and Volumes of the Right Precuneus
The partial correlation analysis controlling for age and sex among plasma bi-omarkers, clinical parameters, and volumes of right precuneus are shown in Figure 3. The plasma T-tau level was positively correlated with plasma Aβ42, the IMT of the common carotid artery, and the GMV of the right precuneus. The IMT of the common carotid artery was also positively correlated with the apnea-hypopnea index (AHI) and the GMV of the right precuneus.
Figure 2. GMV difference between OSA and NC groups. Voxel-wise group comparisons of GMV be-tween the OSA and NC groups show increased GMV of the right precuneus in the OSA group. Therewere no regions with decreased GMV in the OSA group compared to the NC group. Abbreviations:R: right; L: left; MNI: Montreal Neurological Institute.

Diagnostics 2022, 12, 1522 7 of 12
3.4. Correlations between Plasma Biomarkers, Clinical Parameters, and Volumes of theRight Precuneus
The partial correlation analysis controlling for age and sex among plasma biomarkers,clinical parameters, and volumes of right precuneus are shown in Figure 3. The plasmaT-tau level was positively correlated with plasma Aβ42, the IMT of the common carotidartery, and the GMV of the right precuneus. The IMT of the common carotid artery wasalso positively correlated with the apnea-hypopnea index (AHI) and the GMV of theright precuneus.
Diagnostics 2022, 12, x FOR PEER REVIEW 8 of 13
Figure 3. Correlations among plasma AD biomarkers, IMT, and GMV of the right precuneus. The T-tau plasma level is correlated with plasma levels of Aβ42, IMT of CCA, and GMV of the right precuneus. The IMT of CCA is correlated with GMV of the right precuneus and AHI.
3.5. Correlations between Cognitive Function and Plasma Biomarkers, Clinical Parameters, and Volumes of Right Precuneus
Due to the exploratory nature of this study, correlation analysis between other pa-rameters and NPT including digit span, orientation, information, comprehension, and drawing were conducted (Supplementary Table S1). None of the cognitive subtest showed significant correlation with plasma biomarkers, clinical parameters, and volume of right precuneus. The volume of right precuneus showed a trend for weak correlation with the information subtest score (r = 0.201; p = 0.111).
4. Discussion For this study, we enrolled a group of OSA patients without associated cardiovascu-
lar or cerebral disorders, revealing three major findings. First, we identified elevated plasma levels of AD biomarkers in the group of OSA patients with normal cognition. Sec-ond, OSA patients had increased GMV in the right precuneus as compared to controls. Third, the level of plasma T-tau correlated with structural changes of the right precuneus and the IMT of the common carotid artery.
In contrast to many previous studies using the enzyme-linked immunosorbent assay (ELISA) method [21–23], in this study we used immunomagnetic reduction (IMR) tech-nology for ultra-high-sensitivity detection (at pg/mL level) of plasma AD neuropathology biomarkers [24]. We found elevated levels of Aβ42 and T-tau in the OSA patients com-pared to NC. These findings are consistent with previous studies reporting increased CSF and blood amyloid and tau levels in OSA patients [5,25]. The plasma level of amyloid β is correlated with CSF amyloid β level and amyloid deposition in the brain [26], while the level of plasma tau correlates with CSF tau level [27]. The possible role and mechanism for peripheral amyloid β include the clearance of brain amyloid β into plasma via the blood-brain barrier (BBB) transporter [28], and blood-derived amyloid β crossing the BBB,
Figure 3. Correlations among plasma AD biomarkers, IMT, and GMV of the right precuneus. TheT-tau plasma level is correlated with plasma levels of Aβ42, IMT of CCA, and GMV of the rightprecuneus. The IMT of CCA is correlated with GMV of the right precuneus and AHI.
3.5. Correlations between Cognitive Function and Plasma Biomarkers, Clinical Parameters, andVolumes of Right Precuneus
Due to the exploratory nature of this study, correlation analysis between other pa-rameters and NPT including digit span, orientation, information, comprehension, anddrawing were conducted (Supplementary Table S1). None of the cognitive subtest showedsignificant correlation with plasma biomarkers, clinical parameters, and volume of rightprecuneus. The volume of right precuneus showed a trend for weak correlation with theinformation subtest score (r = 0.201; p = 0.111).
4. Discussion
For this study, we enrolled a group of OSA patients without associated cardiovascularor cerebral disorders, revealing three major findings. First, we identified elevated plasmalevels of AD biomarkers in the group of OSA patients with normal cognition. Second, OSApatients had increased GMV in the right precuneus as compared to controls. Third, thelevel of plasma T-tau correlated with structural changes of the right precuneus and the IMTof the common carotid artery.
In contrast to many previous studies using the enzyme-linked immunosorbent assay(ELISA) method [21–23], in this study we used immunomagnetic reduction (IMR) technol-
Diagnostics 2022, 12, 1522 8 of 12
ogy for ultra-high-sensitivity detection (at pg/mL level) of plasma AD neuropathologybiomarkers [24]. We found elevated levels of Aβ42 and T-tau in the OSA patients comparedto NC. These findings are consistent with previous studies reporting increased CSF andblood amyloid and tau levels in OSA patients [5,25]. The plasma level of amyloid β iscorrelated with CSF amyloid β level and amyloid deposition in the brain [26], while thelevel of plasma tau correlates with CSF tau level [27]. The possible role and mechanism forperipheral amyloid β include the clearance of brain amyloid β into plasma via the blood-brain barrier (BBB) transporter [28], and blood-derived amyloid β crossing the BBB, whichmay trigger amyloid β production in the brain [29]. The plasma amyloid β may also reflectthe compensatory clearance function from peripheral organs such as the liver, kidney, andgastrointestinal tract [30,31]. As our study found increased levels of AD neuropathologyplasma biomarkers in the group of OSA patients without cognitive impairment, the ob-served increase in the plasma biomarkers may be interpreted as early changes that precedethe development of cognitive impairment in OSA patients. However, future longitudinalstudies are needed to confirm these temporal relationships.
Our investigation further revealed increased GMV in the precuneus of OSA patients.The precuneus is not only a key node in the default mode network at rest, but it also playsan important role in memory tasks [32]. Previous studies have shown that, as comparedto controls, OSA patients exhibit an overactivation of the precuneus [33,34]. Meanwhile,previous studies have reported disparate findings with regards to structural changes in thebrain of OSA patients. Some studies have reported increased GMV in OSA patients [34–37],while other studies have reported decreased GMV [12,38]. The discrepancies may bedue to differing sample sizes, disease severity, or imaging modalities. In the presentstudy and others [35,36], the enrollment of patients without cognitive impairment orpatients with milder disease severity may have facilitated the detection of earlier stagebrain structural changes.
Possible mechanisms for increased GMV include a compensatory effect, higher brainreserve, cerebral vasogenic edema related to hypoxia, or that the increased GMV may pre-cede volume loss and hypometabolism [37,39,40]. Our previous study reported increasedGMV at the precuneus, insula, and cerebellum, which were reversible after surgery in OSApatients who failed continuous positive airway pressure (CPAP) therapy [37], supportingthe hypothesis that the increased GMV may be attributed to vasogenic edema caused byhypoxia. The correlation analysis showed no significant correlation between AHI and brainstructural changes, which could be due to the fact that we enrolled patients with milderdisease severity and in earlier stages.
The study identified a correlation between increased plasma T-tau level and increasedGMV of the precuneus. This is consistent with a previous study showing colocalizationof increased amyloid burden with increased GMV in the precuneus in a group of sleep-disordered breathing patients without cognitive impairment [41]. By using a multimodalimaging study including structural MRI, fluroine 18–labeled (18F), florbetapir PET, and 18F-fluorodeoxyglucose (FDG) PET scans, André C et al. reported increased amyloid burden,GMV, perfusion, and metabolism in the posterior cingulate gyrus and precuneus [41].The correlation may be due to a common underlying pathophysiology. The intermittenthypoxia in OSA patients causes increased oxidative stress and neuroinflammation, whichmay cause both increased AD neuropathology and structural changes of the brain [37,42].Furthermore, since we enrolled patients without cognitive impairment, the findings of apositive correlation between GMV and T-tau level may indicate early changes of the brainprior to atrophy, which may subsequently progress to irreversible structural deficit [37,43].This information may be pertinent to the clinical setting, as timely intervention for OSApatients before the loss of reversibility in structural changes may result in better prognosis.Due to the exploratory nature of this study, we conducted correlation analysis on the digitspan, orientation, information, comprehension, and drawing subtest. The results showedtrend for positive correlation between the volume of the right precuneus and informationsubtest score without reaching statistical significance. The information subtest measures

Diagnostics 2022, 12, 1522 9 of 12
general information knowledge from the culture and is least affected by age [44]. Ourresult is in accordance with a previous study showing positive correlation between graymatter volume and information subtest in highly educated older adults [45]. In this studythere was no significant correlation between cognitive function test scores and plasma ADbiomarker, which may be due to the limited discriminating ability of the cognitive testsused in this study. Future studies using more sensitive neuropsychological assessmentand the enrollment of patients with mild cognitive impairment or dementia may furtherelucidate their relationships.
OSA is associated with cardiovascular conditions such as hypertension, coronaryartery disease, diabetes, metabolic syndrome, and cerebrovascular disease [8]. The relation-ship between increased carotid IMT and OSA has been reported by previous studies [9,10].This correlation may be due to increased oxidative stress and inflammation exhibited inOSA patients [9,10]. The correlation among carotid IMT, plasma T-tau, and precuneus GMVidentified in this study may be due to a common underlying mechanism; more specifically,the increased oxidative stress and inflammation can cause vascular damage and braininjury [8,37,42,46]. Alternatively, the vascular damage may lead to dysfunction of the BBBand hypoperfusion of the brain, resulting in the accumulation of tau and amyloid β [11].Since APOE genotype is a major risk for AD and is strongly associated with cardiovasculardiseases [47], future studies including this information with longitudinal design may eluci-date the temporal relationship and the complex interaction among atherosclerotic disease,AD neuropathology, and brain structural changes in OSA patients.
5. Limitations
This study has several limitations. First, as cross-sectional data was analyzed, causalrelationships cannot be inferred from correlations. Second, not all participants in the normalcontrols had PSG examinations; however, since subjects not having received a PSG exami-nation had no complaints of sleep-related symptoms, the possibility of misclassification islikely not high. Third, there was indeed a significant difference between the sex of the twogroups. Although sex was adjusted for in every statistical test, we could not exclude theeffect of it on the results, such that the readers should interpret the results with caution.A larger study in the future that could perform separate analyses on both genders mayclarify its interaction with brain structural changes and plasma AD biomarkers. Fourth, inthis study we tested for T-tau to assess the general condition of neurodegeneration in OSApatients. A future study testing for phosphorylated tau (P-tau), which is a more specificmarker for AD, may help to delineate the potential tractography of cognitive functionin OSA patients. Lastly, there was no significant correlation between cognitive functionand AD neuropathology or brain structural alterations, which may be partially due to theenrollment of only cognitively normal individuals in this study. The use of more sensitivecognitive tests for participants with normal cognition may elucidate their relationship inpatients with normal cognition. Future longitudinal studies including patients with cogni-tive impairment may also provide more insight into the complex relationships betweencognitive function, plasma AD biomarkers, and brain structural changes in OSA patients.
In conclusion, our study demonstrates that a group of OSA patients with preservedcognitive function exhibited elevated plasma levels of AD neuropathology biomarkers. Thepositive correlation between structural changes in the brain and the plasma level of T-tauin these patients may indicate early changes. The measurement of these biomarkers mayaid in the early detection of OSA-associated morbidity and possible treatment planning forthe prevention of irreversible neuronal damage and cognitive dysfunction.
Supplementary Materials: The following supporting information can be downloaded at: https://www.mdpi.com/article/10.3390/diagnostics12071522/s1, Table S1: Correlations between cognitivefunction and plasma biomarkers, clinical parameters, and volumes of right precuneus.

Diagnostics 2022, 12, 1522 10 of 12
Author Contributions: Conceptualization, H.-L.C. and W.-C.L.; methodology, H.-L.C.; validation,M.-H.C. and P.-M.W.; formal analysis, Y.-S.C.; investigation, Y.-S.C.; resources, C.-H.L.; data curation,M.-H.C.; writing—original draft preparation, Y.-S.C.; writing—review and editing, W.-C.L.; visual-ization, Y.-S.C.; supervision, H.-L.C. and W.-C.L. All authors have read and agreed to the publishedversion of the manuscript.
Funding: This research received no external funding.
Institutional Review Board Statement: The study was conducted in accordance with the Declarationof Helsinki, and approved by the Institutional Review Board of Kaohsiung Chang Gung MemorialHospital (IRB number: 201900052B0, date of approval: 2019.02.11).
Informed Consent Statement: Informed consent was obtained from all subjects involved in the study.
Conflicts of Interest: The authors declare no conflict of interest.
References1. Malhotra, A.; White, D.P. Obstructive sleep apnoea. Lancet 2002, 360, 237–245. [CrossRef]2. Spira, A.P.; Yager, C.; Brandt, J.; Smith, G.S.; Zhou, Y.; Mathur, A.; Kumar, A.; Brasic, J.R.; Wong, D.F.; Wu, M.N.
Objectively Measured Sleep and beta-amyloid Burden in Older Adults: A Pilot Study. SAGE Open Med. 2014, 2,2050312114546520. [CrossRef] [PubMed]
3. Yun, C.H.; Lee, H.Y.; Lee, S.K.; Kim, H.; Seo, H.S.; Bang, S.A.; Kim, S.E.; Greve, D.N.; Au, R.; Shin, C.; et al. Amyloid Burden inObstructive Sleep Apnea. J. Alzheimers Dis. 2017, 59, 21–29. [CrossRef]
4. Blennow, K.; de Leon, M.J.; Zetterberg, H. Alzheimer’s disease. Lancet 2006, 368, 387–403. [CrossRef]5. Bubu, O.M.; Pirraglia, E.; Andrade, A.G.; Sharma, R.A.; Gimenez-Badia, S.; Umasabor-Bubu, O.Q.; Hogan, M.M.; Shim, A.M.;
Mukhtar, F.; Sharma, N.; et al. Obstructive sleep apnea and longitudinal Alzheimer’s disease biomarker changes. Sleep 2019, 42,zsz048. [CrossRef] [PubMed]
6. Shi, Y.; Lu, X.; Zhang, L.; Shu, H.; Gu, L.; Wang, Z.; Gao, L.; Zhu, J.; Zhang, H.; Zhou, D.; et al. Potential Value of PlasmaAmyloid-beta, Total Tau, and Neurofilament Light for Identification of Early Alzheimer’s Disease. ACS Chem. Neurosci. 2019, 10,3479–3485. [CrossRef] [PubMed]
7. Yaggi, H.K.; Concato, J.; Kernan, W.N.; Lichtman, J.H.; Brass, L.M.; Mohsenin, V. Obstructive sleep apnea as a risk factor forstroke and death. N. Engl. J. Med. 2005, 353, 2034–2041. [CrossRef]
8. Yeghiazarians, Y.; Jneid, H.; Tietjens, J.R.; Redline, S.; Brown, D.L.; El-Sherif, N.; Mehra, R.; Bozkurt, B.; Ndumele, C.E.; Somers, V.K.Obstructive Sleep Apnea and Cardiovascular Disease: A Scientific Statement From the American Heart Association. Circulation2021, 144, e56–e67. [CrossRef]
9. Chang, Y.T.; Lin, H.C.; Chang, W.N.; Tsai, N.W.; Huang, C.C.; Wang, H.C.; Kung, C.T.; Su, Y.J.; Lin, W.C.; Cheng, B.C.; et al. Impactof inflammation and oxidative stress on carotid intima-media thickness in obstructive sleep apnea patients without metabolicsyndrome. J. Sleep Res. 2017, 26, 151–158. [CrossRef]
10. Ciccone, M.M.; Scicchitano, P.; Zito, A.; Cortese, F.; Boninfante, B.; Falcone, V.A.; Quaranta, V.N.; Ventura, V.A.; Zucano, A.; DiSerio, F.; et al. Correlation between inflammatory markers of atherosclerosis and carotid intima-media thickness in ObstructiveSleep Apnea. Molecules 2014, 19, 1651–1662. [CrossRef]
11. Nelson, A.R.; Sweeney, M.D.; Sagare, A.P.; Zlokovic, B.V. Neurovascular dysfunction and neurodegeneration in dementia andAlzheimer’s disease. Biochim. Biophys. Acta 2016, 1862, 887–900. [CrossRef] [PubMed]
12. Shi, Y.; Chen, L.; Chen, T.; Li, L.; Dai, J.; Lui, S.; Huang, X.; Sweeney, J.A.; Gong, Q. A Meta-analysis of Voxel-based BrainMorphometry Studies in Obstructive Sleep Apnea. Sci. Rep. 2017, 7, 10095. [CrossRef] [PubMed]
13. Yeung, A.W.K. Morphometric and functional connectivity changes in the brain of patients with obstructive sleep apnea: Ameta-analysis. J. Sleep Res. 2019, 28, e12857. [CrossRef] [PubMed]
14. Epstein, L.J.; Kristo, D.; Strollo, P.J., Jr.; Friedman, N.; Malhotra, A.; Patil, S.P.; Ramar, K.; Rogers, R.; Schwab, R.J.;Weaver, E.M.; et al. Clinical guideline for the evaluation, management and long-term care of obstructive sleep apnea in adults. J.Clin. Sleep Med. 2009, 5, 263–276. [PubMed]
15. Wechsler, D. Wechsler Memory Scale-(WMS-III) Chinese Version: Administration and Scoring Manual; The Chinese Behavioral ScienceCorporation: Taibei, Taiwan, 2005.
16. Lin, K.N.; Wang, P.N.; Liu, H.C.; Teng, E.L. Cognitive Abilities Screening Instrument, Chinese Version 2.0 (CASI C-2.0): Adminis-tration and clinical application. Acta Neurol. Taiwan 2012, 21, 180–189.
17. Lin, C.H.; Yang, S.Y.; Horng, H.E.; Yang, C.C.; Chieh, J.J.; Chen, H.H.; Liu, B.H.; Chiu, M.J. Plasma alpha-synuclein predictscognitive decline in Parkinson’s disease. J. Neurol. Neurosurg. Psychiatry 2017, 88, 818–824. [CrossRef]
18. Yang, S.Y.; Chiu, M.J.; Lin, C.H.; Horng, H.E.; Yang, C.C.; Chieh, J.J.; Chen, H.H.; Liu, B.H. Development of an ultra-high sensitiveimmunoassay with plasma biomarker for differentiating Parkinson disease dementia from Parkinson disease using antibodyfunctionalized magnetic nanoparticles. J. Nanobiotechnol. 2016, 14, 41. [CrossRef]
19. Teunissen, C.E.; Chiu, M.J.; Yang, C.C.; Yang, S.Y.; Scheltens, P.; Zetterberg, H.; Blennow, K. Plasma Amyloid-beta (Abeta42)Correlates with Cerebrospinal Fluid Abeta42 in Alzheimer’s Disease. J. Alzheimers Dis. 2018, 62, 1857–1863. [CrossRef]

Diagnostics 2022, 12, 1522 11 of 12
20. Yang, S.Y.; Chiu, M.J.; Chen, T.F.; Lin, C.H.; Jeng, J.S.; Tang, S.C.; Lee, Y.F.; Yang, C.C.; Liu, B.H.; Chen, H.H.; et al. Analyticalperformance of reagent for assaying tau protein in human plasma and feasibility study screening neurodegenerative diseases. Sci.Rep. 2017, 7, 9304. [CrossRef]
21. Ju, Y.E.; Finn, M.B.; Sutphen, C.L.; Herries, E.M.; Jerome, G.M.; Ladenson, J.H.; Crimmins, D.L.; Fagan, A.M.; Holtzman, D.M.Obstructive sleep apnea decreases central nervous system-derived proteins in the cerebrospinal fluid. Ann. Neurol. 2016, 80,154–159. [CrossRef]
22. Kheirandish-Gozal, L.; Philby, M.F.; Alonso-Alvarez, M.L.; Teran-Santos, J.; Gozal, D. Biomarkers of Alzheimer Disease inChildren with Obstructive Sleep Apnea: Effect of Adenotonsillectomy. Sleep 2016, 39, 1225–1232. [CrossRef] [PubMed]
23. Sharma, R.A.; Varga, A.W.; Bubu, O.M.; Pirraglia, E.; Kam, K.; Parekh, A.; Wohlleber, M.; Miller, M.D.; Andrade, A.; Lewis, C.; et al.Obstructive Sleep Apnea Severity Affects Amyloid Burden in Cognitively Normal Elderly. A Longitudinal Study. Am. J. Respir.Crit. Care Med. 2018, 197, 933–943. [CrossRef] [PubMed]
24. Yang, S.Y.; Chiu, M.J.; Chen, T.F.; Horng, H.E. Detection of Plasma Biomarkers Using Immunomagnetic Reduction: A PromisingMethod for the Early Diagnosis of Alzheimer’s Disease. Neurol. Ther. 2017, 6, 37–56. [CrossRef] [PubMed]
25. Bu, X.L.; Liu, Y.H.; Wang, Q.H.; Jiao, S.S.; Zeng, F.; Yao, X.Q.; Gao, D.; Chen, J.C.; Wang, Y.J. Serum amyloid-beta levels areincreased in patients with obstructive sleep apnea syndrome. Sci. Rep. 2015, 5, 13917. [CrossRef] [PubMed]
26. Nakamura, A.; Kaneko, N.; Villemagne, V.L.; Kato, T.; Doecke, J.; Dore, V.; Fowler, C.; Li, Q.X.; Martins, R.; Rowe, C.; et al. Highperformance plasma amyloid-beta biomarkers for Alzheimer’s disease. Nature 2018, 554, 249–254. [CrossRef]
27. Chen, Z.; Mengel, D.; Keshavan, A.; Rissman, R.A.; Billinton, A.; Perkinton, M.; Percival-Alwyn, J.; Schultz, A.; Properzi, M.;Johnson, K.; et al. Learnings about the complexity of extracellular tau aid development of a blood-based screen for Alzheimer’sdisease. Alzheimers Dement. 2019, 15, 487–496. [CrossRef]
28. Ovod, V.; Ramsey, K.N.; Mawuenyega, K.G.; Bollinger, J.G.; Hicks, T.; Schneider, T.; Sullivan, M.; Paumier, K.; Holtzman, D.M.;Morris, J.C.; et al. Amyloid beta concentrations and stable isotope labeling kinetics of human plasma specific to central nervoussystem amyloidosis. Alzheimers Dement. 2017, 13, 841–849. [CrossRef]
29. Bu, X.L.; Xiang, Y.; Jin, W.S.; Wang, J.; Shen, L.L.; Huang, Z.L.; Zhang, K.; Liu, Y.H.; Zeng, F.; Liu, J.H.; et al. Blood-derivedamyloid-beta protein induces Alzheimer’s disease pathologies. Mol. Psychiatry 2018, 23, 1948–1956. [CrossRef]
30. Wang, Y.R.; Wang, Q.H.; Zhang, T.; Liu, Y.H.; Yao, X.Q.; Zeng, F.; Li, J.; Zhou, F.Y.; Wang, L.; Yan, J.C.; et al. Associations BetweenHepatic Functions and Plasma Amyloid-Beta Levels-Implications for the Capacity of Liver in Peripheral Amyloid-Beta Clearance.Mol. Neurobiol. 2017, 54, 2338–2344. [CrossRef]
31. Xiang, Y.; Bu, X.L.; Liu, Y.H.; Zhu, C.; Shen, L.L.; Jiao, S.S.; Zhu, X.Y.; Giunta, B.; Tan, J.; Song, W.H.; et al. Physiologicalamyloid-beta clearance in the periphery and its therapeutic potential for Alzheimer’s disease. Acta Neuropathol. 2015, 130,487–499. [CrossRef]
32. Utevsky, A.V.; Smith, D.V.; Huettel, S.A. Precuneus is a functional core of the default-mode network. J. Neurosci. 2014, 34,932–940. [CrossRef] [PubMed]
33. Castronovo, V.; Canessa, N.; Strambi, L.F.; Aloia, M.S.; Consonni, M.; Marelli, S.; Iadanza, A.; Bruschi, A.; Falini,A.; Cappa, S.F. Brain activation changes before and after PAP treatment in obstructive sleep apnea. Sleep 2009, 32,1161–1172. [CrossRef] [PubMed]
34. Fatouleh, R.H.; Hammam, E.; Lundblad, L.C.; Macey, P.M.; McKenzie, D.K.; Henderson, L.A.; Macefield, V.G. Functional andstructural changes in the brain associated with the increase in muscle sympathetic nerve activity in obstructive sleep apnoea.Neuroimage Clin. 2014, 6, 275–283. [CrossRef] [PubMed]
35. Baril, A.A.; Gagnon, K.; Brayet, P.; Montplaisir, J.; De Beaumont, L.; Carrier, J.; Lafond, C.; L’Heureux, F.; Gagnon, J.F.; Gosselin, N.Gray Matter Hypertrophy and Thickening with Obstructive Sleep Apnea in Middle-aged and Older Adults. Am. J. Respir. Crit.Care Med. 2017, 195, 1509–1518. [CrossRef] [PubMed]
36. Cross, N.E.; Memarian, N.; Duffy, S.L.; Paquola, C.; LaMonica, H.; D’Rozario, A.; Lewis, S.J.G.; Hickie, I.B.; Grunstein, R.R.;Naismith, S.L. Structural brain correlates of obstructive sleep apnoea in older adults at risk for dementia. Eur. Respir. J. 2018, 52,1800740. [CrossRef] [PubMed]
37. Lin, W.C.; Huang, C.C.; Chen, H.L.; Chou, K.H.; Chen, P.C.; Tsai, N.W.; Chen, M.H.; Friedman, M.; Lin, H.C.; Lu, C.H. Longitudinalbrain structural alterations and systemic inflammation in obstructive sleep apnea before and after surgical treatment. J. Transl.Med. 2016, 14, 139. [CrossRef] [PubMed]
38. Huang, X.; Tang, S.; Lyu, X.; Yang, C.; Chen, X. Structural and functional brain alterations in obstructive sleep apnea: Amultimodal meta-analysis. Sleep Med. 2019, 54, 195–204. [CrossRef]
39. Benzinger, T.L.; Blazey, T.; Jack, C.R., Jr.; Koeppe, R.A.; Su, Y.; Xiong, C.; Raichle, M.E.; Snyder, A.Z.; Ances, B.M.;Bateman, R.J.; et al. Regional variability of imaging biomarkers in autosomal dominant Alzheimer’s disease. Proc. Natl. Acad. Sci.USA 2013, 110, E4502–E4509. [CrossRef]
40. Stern, Y.; Arenaza-Urquijo, E.M.; Bartres-Faz, D.; Belleville, S.; Cantilon, M.; Chetelat, G.; Ewers, M.; Franzmeier, N.; Kempermann,G.; Kremen, W.S.; et al. Whitepaper: Defining and investigating cognitive reserve, brain reserve, and brain maintenance.Alzheimers Dement. 2020, 16, 1305–1311. [CrossRef]
41. Andre, C.; Rehel, S.; Kuhn, E.; Landeau, B.; Moulinet, I.; Touron, E.; Ourry, V.; Le Du, G.; Mezenge, F.; Tomadesso, C.; et al.Association of Sleep-Disordered Breathing With Alzheimer Disease Biomarkers in Community-Dwelling Older Adults: ASecondary Analysis of a Randomized Clinical Trial. JAMA Neurol. 2020, 77, 716–724. [CrossRef]

Diagnostics 2022, 12, 1522 12 of 12
42. Bubu, O.M.; Andrade, A.G.; Umasabor-Bubu, O.Q.; Hogan, M.M.; Turner, A.D.; de Leon, M.J.; Ogedegbe, G.; Ayappa, I.; Jean-Louis, G.G.; Jackson, M.L.; et al. Obstructive sleep apnea, cognition and Alzheimer’s disease: A systematic review integratingthree decades of multidisciplinary research. Sleep Med. Rev. 2020, 50, 101250. [CrossRef] [PubMed]
43. Pegueroles, J.; Vilaplana, E.; Montal, V.; Sampedro, F.; Alcolea, D.; Carmona-Iragui, M.; Clarimon, J.; Blesa, R.; Lleo, A.;Fortea, J.; et al. Longitudinal brain structural changes in preclinical Alzheimer’s disease. Alzheimers Dement. 2017, 13,499–509. [CrossRef] [PubMed]
44. Ryan, J.J.; Sattler, J.M.; Lopez, S.J. Age effects on Wechsler Adult Intelligence Scale-III subtests. Arch. Clin. Neuropsychol. 2000, 15,311–317. [CrossRef]
45. Elkana, O.; Soffer, S.; Eisikovits, O.R.; Oren, N.; Bezalel, V.; Ash, E.L. WAIS Information Subtest as an indicator of crystallizedcognitive abilities and brain reserve among highly educated older adults: A three-year longitudinal study. Appl. Neuropsychol.Adult 2020, 27, 525–531. [CrossRef] [PubMed]
46. Rosenzweig, I.; Glasser, M.; Polsek, D.; Leschziner, G.D.; Williams, S.C.; Morrell, M.J. Sleep apnoea and the brain: A complexrelationship. Lancet Respir. Med. 2015, 3, 404–414. [CrossRef]
47. Mahley, R.W. Apolipoprotein E: From cardiovascular disease to neurodegenerative disorders. J. Mol. Med. 2016, 94,739–746. [CrossRef]
Related Documents