MANUAL ON THE BIOMARKERS RECOMMENDED FOR THE MED POL BIOMONITORING PROGRAMME

Welcome message from author
This document is posted to help you gain knowledge. Please leave a comment to let me know what you think about it! Share it to your friends and learn new things together.
Transcript
MANUAL ON THE BIOMARKERS RECOMMENDED FOR THE MED POL BIOMONITORING PROGRAMME
I
PREFACE
The scope of this manual is to serve as an initial source of technical reference for laboratories interested to start routine biological-effects pollution monitoring. A number of biomarkers have been considered in this manual, starting from those capable of giving a general indication of biological stress due to pollution. These biomarkers of stress (general stress indices) include the assessment of damage to genetic and subcellular components.
Both the elevation of enzymatic activity of the mixed function oxygenase system (MFO) and the induction of metallothionein (MT) protein synthesis also termed as biomarkers of exposure (specific stress indices), are considered.
The potential use of the last two biomarkers is considerable, since these biomarkers are able to show the cellular response to heavy metals (MT) and aromatic organic xenobiotic compounds (MFO), both of which are considered as being major pollutants in coastal areas. Such biomarkers seem to offer the best information on the biological response of the animals to the two classes of toxic pollutants therefore reporting an early warning signal that environmental damage is in progress. They have been carefully characterized in a number of marine organisms and proved to be suitable to identify a biological response induced by the effects of the chemical pollutants.
However, due to the complex nature of these biological responses, extreme caution should be exercised when coming to interpret monitoring results from field stations. These responses have to be assessed in the light of the physiological status of the test organisms at the time of sampling which can be ascertained by the measurement of the two general stress indices mentioned above (genetic damage and alteration of lysosomal activity). This manual also attempts to address a number of technical pitfalls and whenever possible, suggests ways how to enhance the certainty of biomonitoring results.
Important note on health safety
Safety deserves special attention. Most of the chemicals and equipment listed in the following sections are relatively harmless, provided they are not abused. Disposable items should be used wherever possible, as should safety items such as gloves, lab coats and special waste disposal containers for carcinogenic substances.
Acknowledgements
The first draft of this manual was prepared by Mr. Charles Galdies, Euro-Mediterranean Center on Insular Coastal Dynamics (lCoD), Foundation for International Studies, University of Malta. Several Mediterranean scientists and in particular Professor A. Viarengo of the University of Genoa, Italy, Dr. Claudia Bolognesi from the Cancer Institute of Genoa, Italy, and Dr. Sylvie Tambutté of the Department for the Environment, Urbanism and Construction, Principality of Monaco, have provided their comments and remarks which have been included in this document. UNEP/MAP is especially pleased for the cooperation which was established with the RAMOGE agreement which has allowed to complement the present manual with a video cassette showing the techniques used. UNEP/MAP thanks all concerned for their cooperation.
II
TABLE OF CONTENTS
PREFACE __________________________________________________________________ I Important note on health safety ______________________________________________ I Acknowledgements ________________________________________________________ I
TABLE OF CONTENTS_________________________________________________________ II 1. INTRODUCTION ___________________________________________________________ 1 1.1 Mutagenic processes ____________________________________________________ 1 1.2 Cvtoplasmic injuries_____________________________________________________ 2 1.3 Alteration of normal biochemical pathways ___________________________________ 2 1.3.1 Induction of cytochrome P450-dependent mono-oxygenase system ____________ 2 1.3.2 Increased cytosolic levels of metal-binding proteins ________________________ 3
1.4 Utilisation of sub-lethal responses as diagnostic tools___________________________ 3 1.4.1 Monitoring criteria and sample acquisition ________________________________ 3 1.4.2 Choice of species____________________________________________________ 4 1.4.3 Interpretation of results: some practical considerations______________________ 5 1.4.4 Effects due to complex mixtures of pollutants _____________________________ 5
1.5 Conclusion ____________________________________________________________ 6 2. EVALUATION OF LYSOSOMAL MEMBRANE STABILITY______________________________ 7 2.1 Background:___________________________________________________________ 7 2.2 Assessment of Lysosomal membrane stability: cytochemical assay of cryostat sections 7 2.2.1 Principle __________________________________________________________ 7 2.2.2 Solutions and chemicals ______________________________________________ 7 2.2.3 Preparation of tissue _________________________________________________ 8 2.2.4 Enzymatic determination of membrane stability____________________________ 8 2.2.5 Interpretation of results ______________________________________________ 9
2.3 Determination of lysosomal membrane stability in living cells: neutral red retention assay __________________________________________________________________ 10 2.3.1 Chemicals and solutions _____________________________________________ 10 2.3.2 Practical evaluation_________________________________________________ 11
3. EVALUATION OF GENOTOXIC EFFECTS________________________________________ 11 3.1 Alkaline filter elution method_____________________________________________ 11 3.1.1 Equipment________________________________________________________ 12 3.1.2 Chemicals and Solutions _____________________________________________ 12 3.1.3 Sample preparation from tissues of aquatic organisms _____________________ 13 3.1.3.1 For fish liver_____________________________________________________ 13 3.1.3.2 For mussel gill cells _______________________________________________ 13 3.1.3.3 For mussel haemolymph ___________________________________________ 13 3.1.4 Sample application _________________________________________________ 13 3.1.5 Lysing of cells _____________________________________________________ 13 3.1.6 Elution of single stranded DNA ________________________________________ 14 3.1.7 Microfluorimetric determination of DNA _________________________________ 14 3.1.8 Calculation _______________________________________________________ 14 3.1.8.1 Calculation of the slope of the elution curves (elution rate) ________________ 14 3.1.8.2 Calculation of Strand Scission Factor (SSR . ____________________________ 14
3.2 Determination of micronuclei frequency ____________________________________ 16 3.2.1 Background_______________________________________________________ 16 3.2.2 Equipment________________________________________________________ 17 3.2.3 Chemicals and solutions _____________________________________________ 17 3.2.4 Method __________________________________________________________ 17 3.2.4.1 Preparation of cell suspension _______________________________________ 17
III
3.2.4.2 Slide preparation _________________________________________________ 17 3.2.4.3 Slide scorinq ____________________________________________________ 17
4. EVALUATION OF MIXED FUNCTION OXIDASE ACTIVITY ___________________________ 18 4.1 Background and principle________________________________________________ 18 4.1.1 Sampling_________________________________________________________ 18 4.1.2 Equipment________________________________________________________ 19 4.1.3 Solutions and chemicals _____________________________________________ 19 4.1.4 Preparation of samples for analysis ____________________________________ 19 4.1.4.1 Tissue dissection and preparation for analysis __________________________ 20 4.1.4.2 Homoqenization of tissue___________________________________________ 20 4.1.4.3 Preparation of S-9 fraction and 100.000 x q pellet (microsomes)____________ 20 4.1.5 Protein determination |______________________________________________ 20 4.1.6 Ethoxyresorufin 0-deethylase (EROD) determination (Suteau et al., 1988) _____ 21 4.1.6.1 Preparation _____________________________________________________ 21 4.1.6.2 Enzymatic reaction________________________________________________ 21 4.1.6.3 Quantification of the resorufin produced _______________________________ 21 4.1.7 Calculation of the activity ____________________________________________ 21 4.1.8 Interpretation of results _____________________________________________ 22 4.1.9 Future developments _______________________________________________ 22
5. EVALUATION OF METALLOTHIONEIN (MT) LEVEL ________________________________ 22 5.1 Backqround __________________________________________________________ 22 5.2 Spectrophotometric determination of the -SH groups usinq Ellman's reagent _______ 23 5.2.1 Principle _________________________________________________________ 23
5.3 Practical evaluation ____________________________________________________ 23 5.3.1 Equipment________________________________________________________ 24 5.3.2 Solutions and Chemicals _____________________________________________ 24 5.3.3 Sample and enriched MT fraction preparation ____________________________ 24 5.3.3.1 Homogenization __________________________________________________ 24 5.3.3.2 Centrifugation ___________________________________________________ 25 5.3.3.3 Ethanolic precipitation _____________________________________________ 25 5.3.3.4 Resuspension of the MT enriched fraction ______________________________ 25 5.3.4 DTNB assay (Ellman's reaction) _______________________________________ 25 5.3.4.1 Glutathione reference standard curve _________________________________ 25 5.3.4.2 MT spectrophotometric evaluation____________________________________ 25 5.3.5 Calculation and interpretation of result__________________________________ 26 5.3.5.1 Plotting of a standard curve_________________________________________ 26 5.3.5.2 Quantitative determination of MT content ______________________________ 26
6. REFERENCES ____________________________________________________________ 27
1
1. INTRODUCTION
Upon exposure to harmful contaminants, marine organisms start manifesting a number of symptoms that are indicative of biological damage, the first ones appearing after a short while at the subcellular level. These ‘sublethal’ effects, when integrated, often converge to visible harm for the organisms and to the whole population at a later stage, when it is too late to limit the extent of biological damage resulting from environmental deterioration.
Most of these symptoms have been reproducibly obtained in the laboratory and the various biological mechanisms of response to major xenobiotics are now sufficiently well understood. The use of biomarkers1 has, since then, came into common practice by ecotoxicologists who used these responses as ‘early warning’ pollution monitoring tools to signal the onset of harmful effects at the cellular and sub-cellular levels. The following discussion briefly describes a number of common sublethal effects, exhibited by marine organisms as well as their correct application as biomarkers of biological harm resulting from marine pollution.
1.1 Mutagenic processes
Abnormal DNA replication, transcription as well translational processes of RNA (Eichorn, 1973) often represent symptoms following the interaction between, xenobiotics and the nuclear material. In vitro studies show that heavy metals, for example, can easily alter the complementing hydrogen bonding capability of nucleic acids and thus facilitate the onset of the above processes.
Metabolic by-products of bioaccumulated xenobiotics can also generate harmful effects on the integrity of genetic material. Within the eukaryotic cell, organic xenobiotics are biotransformed into several mutagenic and carcinogenic metabolites by cytochrome P-450 enzymes and the epoxide hydrase function (see 1.3 below). These metabolites are highly reactive by-products with an affinity for nucleophilic sites on cellular macromolecules, like DNA. The interaction of these reactive substances with DNA can lead to the formation of DNA lesions. Unless inhibited by certain types of contaminants, such as heavy metals, specialized nuclear enzymes are able to correct these lesions thus minimizing misexpression of the genome. Inefficient repair of the genome also characterizes one of the first steps which lead to chemical carcinogenesis and malignancy. This could have a serious implication if such processes are detected within the reproductive tissues of marine organisms, for this would negatively affect its reproductive success.
So far, the study of genotoxicity has mainly been confined to human and other mammalian systems. Direct correlation of those genotoxic effects onto other, different organisms, is not advisable since these may be influenced by quite different mechanisms, such as differential accumulation capabilities, differences in metabolic pathways or complements of enzymes which are characteristic of different phyla.
It was only recently that the successful use of standard method determine genotoxic damage has rendered it possible to substantiate mutagenic effects in marine invertebrates (Shugart, 1988) and reveal a direct correlation between chromosomal abnormalities, nuclear enzyme inhibition and other related events with the bioaccumulation of heavy metals (Dixon, 1983) and polycycle aromatic hydrocarbons (PAHs) (Bolognesi et al., 1991).
The benefits of using these responses to monitor genotoxic risks is evident, and are creating the need for both the systematic screening of major marine pollutants for their DNA-altering potentials as well as unmasking suspected pollution sources. In fact they have been
1 Two other categories fall under biological effects monitoring: (1) bioassay testing and (2) ecosystem responses
2
instrumental in detecting such pollution hazards along specified coastal stretches in the Mediterranean (Scarpato et al., 199X Bolognesi et al., 1991).
1.2 Cvtoplasmic injuries
As known, eukaryotic cells respond to common pollutants by exhibiting a series of cellular changes that ultimately can lead to cellular death. Such change that involve alterations of plasma membrane and the activity of the different intracellular compartments.
One subcellular component which has proved to be very sensitive to presence of contaminants is the lysosomal vacuolar system. The importance of lysosomes lies in their normal degradative role of cellular and extracellular macromolecules by means of hydrolytic enzymes segregated within them (such as proteases, lipases, nucleases, phosphatases, etc.). Damage to lysosomes often involve loss of integrity of their membranes, this leading to functional alteration eventually to a release of their hydrolytic enzymes into the cytosol. Marine environmental contaminants, including aromatic hydrocarbons, carbon tetrachloride asbestos, silica, aminoazobenzene derivatives, beryllium, metals and viruses are known to be sequestered into lysosomes under certain conditions (Moore, 1985). As mentioned, overloading of the lysosomes leads to membrane destabilisation and an extreme consequence to cellular necrosis due to the release of degradation of lysosomal enzymes. Undoubtedly, a negative consequence of the alteration of lysosomal vacuolar system would be a perturbed intracellular digestion, rapidly affecting the nutritional status of the cell and eventually of the organism.
The evaluation of lysosomal injury has now become widely accepted as sensitive index of cellular health, where the destabilisation of the lysosomal membrane bears a quantitative relationship to the magnitude of the stress response.
In vitro (Moore, 1990) and in vivo (Lowe et al., 1992) investigations on lysosomal damage have been successfully carried out along pollution gradients using both teleosts and invertebrates, and have been correlated with total tissue burdens and benthic sediments for a range of contaminants.
1.3 Alteration of normal biochemical pathways
1.3.1 Induction of cytochrome P450-dependent mono-oxygenase system
This multi-enzyme complex consists of a group of hemoproteins associated with the smooth endoplasmic reticulum. Among the wide range of different types of reactions, they are able to catalyse metabolically-important reactions as well as the oxidative hydroxylation of organic aromatic compounds such as hydrocarbons, O-N- and S-dealkylation reactions, N-oxidation, sulphoxidation and deamination reaction. In a nutshell, the role of cytochrome P450 is to convert lipophilic, endogenous and xenobiotic organic substances into water-soluble compounds (biotransformation) to facilitate their elimination from the body.
Of particular interest to pollution monitoring is that in vertebrates the P450 gene expression and enzymatic activity can be markedly induced by a number of chemical compounds which belong to common classes of environmental pollutants, including PAHs, polychlorinated dibenzo-p-dioxines and dibenzofurans, polyhalogenated biphenyls and other halogenated organic compounds such as pesticides and herbicides. The induction of the P450 isoenzymes has therefore attracted the interest of ecotoxicologists for its application as a field sublethal bioassay that is diagnostic for PAH exposure. Their interest also focused on the biotransformation of these xenobiotics which, unlike normal endogenous compounds, tends to be deleterious since their transformation could lead to a more chemically reactive species (Heidelberger, 1973). Studies show that these intermediate metabolites are able to bind to DNA and promote mutagenesis.
Cytochrome P450 activity in marine vertebrates, and to some extent also in invertebrates, has proven to be one of the most sensitive indicators of environmental
3
contamination (Payne, 1977) as this assessment is based on a sound knowledge of the properties and regulation of this enzyme complex (Stegeman, 1989). Toxicity studies demonstrate that this biomarker is a more sensitive indicator of pollution stress than other physiological variables such as osmoregulation and energy metabolism (Nikunen, 1985). This system responds relatively rapidly to a variety of organic environmental pollutants as well as to complex mixtures including municipal and industrial effluents. Induction can be detected fairly rapidly and elevated activities of P450 can persist for weeks after a contaminant exposure has ceased (Kloepper-Sams and Stegeman, 1989).
In field situations, P450 activities in fish (EROD) were shown to give ; sensitive responses to a PAH pollution gradient over a broad area in the north-western Mediterranean region, validated by a concomitant PAH concentration in the sediments (Garrigues et al., 1990). Preliminary investigations in the Mediterranean to measure benzo(a)pyrene-mono-oxygenase (BaPMO) activity in Mytilus galloprovincialis seem to indicate the possibility of using these molluscs for the detection of PAH pollution gradients (Selli et al., 1994). However, further research is required to fully understanding his response in molluscs.
1.3.2 Increased cytosolic levels of metal-binding proteins
Another biological response occurring at the subcellular level is the induced rate of synthesis of a class of metal-binding proteins, known as metallothioneins (MT), following exposure to heavy metals. This is considered to be a sublethal detoxification response, but the induced synthesis of these proteins could result in biological costs which reduce the fitness of the individual.
Extensive studies using many different organisms (Hamer, 1986) indicate that these proteins have three major physiological roles: (1) Detoxification of heavy metals that penetrate into the cells at toxic concentrations (Goering and Klaasse, 1984), which is strongly supported by the inducibility of MT genes by heavy metals accumulated within the cell (Hamer et al., 1985); (2) Internal homeostasis of Cu and Zn by (a) keeping intracellular concentrations of free Zn and Cu cations at a low level by binding excess metals in a non-toxic form as well as (b) acting as a storage of Cu and Zn for later use and reactivation of apoproteins that require these metals for their activity (Brouwer et al., 1986) and (3) Participation in metabolic functions, including scavenging of free radicals (Thornalley and Vasak, 1985; Brouwer and Brouwer, 1998) and protection against damage due to ionising radiation (Karin, 1985) and, as recently proposed, regulation of gene expression (Roesijadi et al., 1998).
The use of this biomarker for biomonitoring the environmental metal impact has now been validated and a number of biomonitoring exercises using this index have been conducted in various areas within the Mediterranean. (Viarengo et al. 1988a; Pavicic et al., 1991; Galdies, 1995; UNEP, 1997a; 1997b; Tambutté et al. 1998).
1.4 Utilisation of sub-lethal responses as diagnostic tools
1.4.1 Monitoring criteria and sample acquisition
Sampling of biological material to monitor sublethal responses has its specimen requirements. Allowance should be given to a number of biotic and abiotic factors which can potentially influence, and thereby disturb, the analysis. The investigator has to make sure that changes in the magnitude of the responses are only due to temporal pollution fluxes rather than to any other source of variation; to do this, the stress indices have to be measured in the same test species at the same time and place (UNEP/FAO/IAEA, 1993). Inconsistent sampling tends to add noise to the data and makes it harder to identify meaningful trends. Temporal monitoring should also take into account fluctuations in the population density in a way not to interfere with statistical sampling. Allowance should also be given to geographical variation which might affect the physiology of bioindicator species.
Values of T, pH and possibly salinity of the water, where the animals are collected should be provided. The site location should be clearly indicated by geographical co-ordinates.
4
Once collected, samples are to be handled in the same way as in previous sampling occasions and are to be adequately stored to prevent degradation of their biochemical entities or activities. Studies show that most biochemical parameters can only survive short periods of time at ambient temperatures and for this reason, either dry ice or liquid nitrogen could be required for temporal storage of animals or tissues prior to storage in a deep freeze at –80°C.
It is important to point out that the utilization of animals, caged for brief period of time (weeks) in farms that guarantee animals with standard characteristics, instead of wild animals represents a well recognised tool to reduce the effects of biotic and abiotic factors on the physiological status of the selected sentinel organisms.
1.4.2 Choice of species
The choice of the test organism must be guided by several criteria including its abundance and geographical distribution along the Mediterranean coasts, longevity (to allow sampling of more than one-year class if desired), ease of sampling all year round, whether it is amenable to laboratory investigations. It is also important that the animal physiology and biochemistry should be quite well known. Having done this, one soon realises that there is available a limited choice of marine vertebrates and invertebrates2. Based on previous research work in the field, a number of species have been identified.
Teleosts such as combers (Serranus spp.) tend to be sensitive to PAH pollution (Narbonne et al., 1991) and are therefore chosen as test organisms to monitor the activity of their cytochrome P-450. The selection of this hermaphroditic species provides the investigator with some advantages, both in terms of eliminating sex-linked variations in the magnitude of the response as well as due to its sedentary mode of life.
Seabass (Dicentrarchus labrax) also responds well towards PAH contamination in terms of P450 activity. Sexually immature representatives (weighing up to 75±�17g) are preferred to eliminate sex-type differences in enzyme activity levels. This fish is reared in aquaculture farms and therefore represents an ideal species for caging experiments in biomonitoring programmes.
Striped mullet (Mullus barbatus) has also been successfully used and proved to be an excellent bioindicator to monitor P-450 activities (Mathieu et al., 1991). It has been categorised as belonging to the high hepatic xenobiotic-metabolising activity fish group, showing a higher enzymatic activity than do combers, seabass and other fish. Mullets exhibit an increased enzyme activity from October to February which decreases just before spawning. Sex-type differences in P450 activity is also exhibited by this species, with males showing a higher P-450 activity than females during the reproductive period.
Mytilus galloprovincialis is the recommended mollusc but if not available Patella sp. can be used. The recommended species for caging is Mytilus galloprovincialis. In particular molluscs are recommended to evaluate lysosomal membrane stability, metallothionein content and DNA alterations.
Sessile marine molluscs such as mussels for biological monitoring are generally preferred because they exhibit the necessary criteria that qualifies them as good bioindicators (Viarengo and Canesi, 1991). They can bioaccumulate a number of contaminants and are particularly responsive to the major classes of environmental pollutants. However, mussels are not widely distributed in the Mediterranean and therefore other species have to be selected where absent when spatial biomonitoring data is to be compared. Other drawbacks for those wanting to use these molluscs include their low level of both their MFO activity as well as its responsiveness to organic xenobiotics. As a comparison, the level of benzo(a)pyrene hydroxylase activity is increased by only about 50 in mussels from polluted areas (Suteau et al., 1988) but by at least three times in fish collected from the same area (Addison and
2 Apart from animals, investigations are being carried out to use similar responses in marine plants, such as Posidonia oceanica
5
Edwards, 1988). With regard to MT measurement, mussel tissues (such as gills) prove to be a good indicator of Cd, Cu and Hg, but not of Zn pollution (George and Olsson, 1994).
Patella species have been recently utilized in the framework of the MED POL biomonitoring programme, in coastal areas were mussels are not present (Israel, Malta), obtaining encouraging results for the biomarkers utilized.
One other thing regarding invertebrates is that although many aspects of metabolising systems are similar, there nevertheless exist significant differences between various invertebrates even within the same phyla. For example, the ability of synthesizing MT proteins in response to Cd is clearly not uniform among molluscs and is due to interspecific differences in bioaccumulation (Langston et al., 1989).
General stress indices (such as genetic and subcellular injuries) seem to be ubiquitous in all eukaryotic cells, thus precluding problems when coming to choose the test species. Obviously, care should always be taken to try to establish a good signal-to-noise ratio as much as possible.
1.4.3 Interpretation of results: some practical considerations
A prerequisite for using biomarkers is the knowledge of their normal physiological fluctuation range but also their real meaning. Consideration has to be given to any background variability in order to obtain a good signal-to-noise ratio.
It is important to note that the strong variations of environmental parameters may influence the physiological status of the sentinel organisms. It has been observed that the integrity of the lysosomal membrane can be destabilised by non-chemical stressors such as hypoxia, hyperthermia, osmotic shocks, etc. (Moore, 1985). These factors were found to modulate the response of the P-450 enzymes to environmental pollutants. Changes in salinity, temperature, and oxygen availability are among the most significant factors influencing mono-oxygenase activity (Goksoyr and Forlin, 1992) and metallothionein levels in mussel (Viarengo et al., 1988b) and in fish. (Engel, 1988).
A good example of a major physiological factor influencing the activity of some of these biomarkers in vertebrates, particularly mono-oxygenase activity, is a change in the levels of reproductive hormones. In many fish species, mono-oxygenase activity usually decreases shortly before or during spawning season. Differences in liver mono-oxygenase activities between fish sexes has also been recorded (Stegeman et al., 1986). Reproductive stress may also pose urgent requirements of some essential metabolic precursors, such as essential metals like Cu and Zn which in turn may stimulate the appropriate storage, transport, and release of these metals to metabolically-important sites. This process exactly fits one of the functions of metallothionein proteins (see section 1.3.2), and justifies its transient elevated synthesis during such kind of physiological states.
One may therefore conclude that conf�dent application of biomarkers in environmental monitoring very much depends upon the understanding of the regulatory processes involved and characterisation of the magnitude and timing of these changes. For these reasons, as mentioned above, the "caging system" represents the more appropriate approach to reduce the biological variability of the animals sampled in different sites along the coast.
1.4.4 Effects due to complex mixtures of pollutants
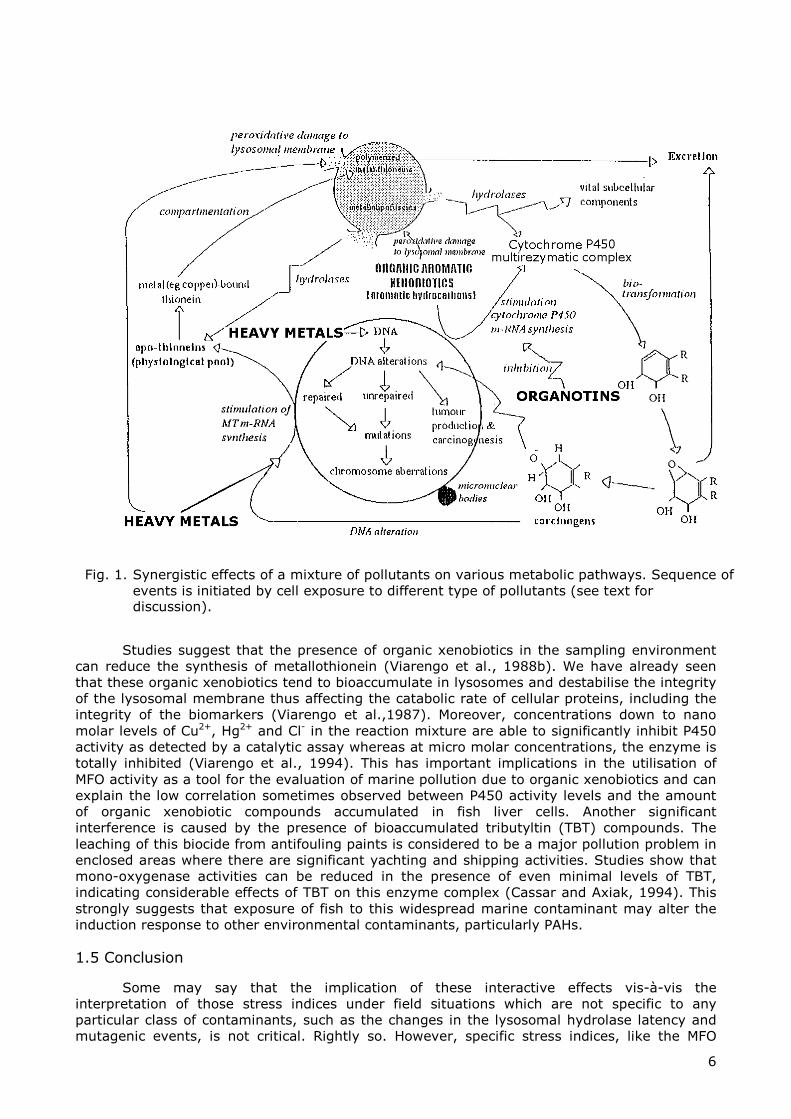
Apart from the above a/biotic factors, biomarkers can also be affected by thousands of different chemicals present in field contaminated areas; the results obtained are due, therefore, to the interactions of the different pollutants with the studied biomarkers (such as additive, synergic and/or antagonistic effects). It is very difficult to reproduce realistically these complex mixtures in the laboratory; but readers can at least glimpse at the interactive effects between the biomarkers and major type of contaminants by referring to the diagram below (Fig. 1)
6
Studies suggest that the presence of organic xenobiotics in the sampling environment can reduce the synthesis of metallothionein (Viarengo et al., 1988b). We have already seen that these organic xenobiotics tend to bioaccumulate in lysosomes and destabilise the integrity of the lysosomal membrane thus affecting the catabolic rate of cellular proteins, including the integrity of the biomarkers (Viarengo et al.,1987). Moreover, concentrations down to nano molar levels of Cu2+, Hg2+ and Cl- in the reaction mixture are able to significantly inhibit P450 activity as detected by a catalytic assay whereas at micro molar concentrations, the enzyme is totally inhibited (Viarengo et al., 1994). This has important implications in the utilisation of MFO activity as a tool for the evaluation of marine pollution due to organic xenobiotics and can explain the low correlation sometimes observed between P450 activity levels and the amount of organic xenobiotic compounds accumulated in fish liver cells. Another significant interference is caused by the presence of bioaccumulated tributyltin (TBT) compounds. The leaching of this biocide from antifouling paints is considered to be a major pollution problem in enclosed areas where there are significant yachting and shipping activities. Studies show that mono-oxygenase activities can be reduced in the presence of even minimal levels of TBT, indicating considerable effects of TBT on this enzyme complex (Cassar and Axiak, 1994). This strongly suggests that exposure of fish to this widespread marine contaminant may alter the induction response to other environmental contaminants, particularly PAHs.
1.5 Conclusion
Some may say that the implication of these interactive effects vis-à-vis the interpretation of those stress indices under field situations which are not specific to any particular class of contaminants, such as the changes in the lysosomal hydrolase latency and mutagenic events, is not critical. Rightly so. However, specific stress indices, like the MFO
Fig. 1. Synergistic effects of a mixture of pollutants on various metabolic pathways. Sequence of
events is initiated by cell exposure to different type of pollutants (see text for discussion).
7
system and MT which may be susceptible to interactive effects, are to be interpreted with caution when applied to field situations having mixtures of both organic and inorganic xenobiotics. However, it is important to emphasize that a correct approach of
biomarker utilization in biomonitoring programmes consists of the use of a battery of
biomarkers: both biomarkers of stress such as DNA damage and lysosomal
membrane stability evaluation and biomarkers of exposure i.e. metallothionein,
EROD and eventually acetylcholinesterase activity.
It is hoped that this brief introduction highlighted both the intricacies of utilising these sublethal responses as biomarkers of biological harm, as well as pitfalls often encountered if results are not interpreted correctly. Analysis of isolated homeostatic mechanisms is never encouraged, and a general picture should always be considered and translated into the overall state of health of the organism, and eventually of the population.
2. EVALUATION OF LYSOSOMAL MEMBRANE STABILITY
2.1 Background:
It is very difficult to evaluate the molecular changes affecting the permeability of the lysosomal membrane. These analyses require extensive purified lysosomal membrane preparations and their examination at molecular level. An easier way to assess this parameter is to examine whether its normal physiological function has been altered or disrupted following exposure to pollutants.
One tool which links both descriptive morphology and biochemistry to observe such pathological alterations is cytochemistry. Apart from permitting the use of very small samples of tissue, this technique is ideal to detect changes in particular target cells and tissues.
Cytochemistry has been successfully applied to assess lysosomal integrity by visualising the hydrolytic enzymes within the lysosomes, and has proved to be a rapid and sensitive investigative tool for evaluating the effects of organic xenobiotics and other injurious agents at very low intracellular concentrations. This generalised response occurs in all cell types ranging from fungi to vertebrates, so that such cytochemical test can be applied on a fairly widespread basis.
2.2 Assessment of Lysosomal membrane stability: cytochemical assay of cryostat sections
2.2.1 Principle
The following protocol is a cytochemical procedure for the determination of lysosomal membrane stability, based on the evaluation of the activity of N-acetyl-β-hexosaminidase, a lysosomal enzyme. Lysosomal destabilisation is measured as the increased permeability of the substrate (naphthol AS-BI N-acetyl-p-glucosaminide) visualized by the reaction with the enzyme into the lysosomes in presence of diazonium salt. The preparation of tissues for the examination of cell structures requires the use of specialised methodology to produce high-quality stained sections In this section all observations are related to frozen material, and this preparative technique will be described.
2.2.2 Solutions and chemicals
Lysosomal membrane labilising buffer (Solution A)
0.1 M Na-citrate Buffer - 2.5% NaCl w:v, pH 4.5 Substrate incubation medium (to be prepared just 5 minutes before use) (Solution B)
20 mg of naphtol AS-BI N-acetyl-p-D-glucosaminide (Sigma, N4006) are dissolved in 2.5 ml of 2-methoxyethanol (Merck, 859) and made up to 50 ml with solution A, containing POLYPEP (Sigma, P5115; low viscosity polypeptide to act as a section stabiliser).
8
Diazonium dye (Solution C)
0.1M Na-phosphate buffer, pH 7.4, containing 1 mg/ml of diazonium dye Fast Violet B salts (Sigma, F1631) (Note: saturated solution)
Other dyes can be utilised such as:
Fast Garnet GBC (Sigma) Fast Red Violet LB (Difco) Fast Blue BB (Sigma) Fast Blue RR (Sigma)
Fixative (Solution D)
calcium formol: 2% Ca-acetate w:v + 10% Formaldehyde v:v Mounting Medium: aqueous Mounting Medium (Vector Laboratories H1000) or Kaiser glycerin gelatin
Liquid Nitrogen
2.2.3 Preparation of tissue
Rapidly excise 5 small pieces (3-4mm3) of the organ/tissue (usually digestive gland of
mollusc or fish liver) obtained from five different animals and rapidly place them on an aluminium cryostat chuck (i.e. aligned in a straight row across the centre)
While dissecting, leave the chuck on ice and then place it for 40 seconds in a small plastic box containing pre-cooled N- hexane3 at -70°C using liquid nitrogen. Seal the chuck with 4-5 pieces of Parafilm and immediately store at -80°C. (At this temperature the tissue preparations maintain their integrity for months).
Using a Bright’s Cryostat or other equivalent equipment (cabinet temperature below -25°C), cut 10 µm thick sections using a 15° knife angle. Transfer the sections to "warm" slides (at room temperature) to flash-dry them. The slides can be stored in the cryostat (for at least 4 hours).
2.2.4 Enzymatic determination of membrane stability
Place the sections in Hdellendal jar containing solution A for different times (0, 3, 5, 10,
15, 20, 30, 40 minutes) at 37°C in order to find out the range of pre-treatment time needed to completely labilise the lysosomal membrane (i.e. labilisation period). In the last fíve minutes use shaking water-bath.
Transfer the set of slides to solution B and incubate the slides for 20 minutes at 37°C in a Hellendal jar preferably in a shaking water-bath.
Wash the slides in fíltered sea-water at room temperature or with a saline solution (3% NaCI) at 37°C for 2 to 3 minutes. Transfer the slides to solution containing the diazonium coupler for 10 min at room temperature. Rapidly rinse their slides in running tap water for 5 minutes. Fix the sections for 10 minutes in solution D at 4°C (or mount directly with glycerol gelatin), rinse in distilled water and mount in aqueous mounting medium.
3 Hexane cooling prevents the formation of ice in the tissue and hence it reduces any structural
damage to the subcelluar components.
9
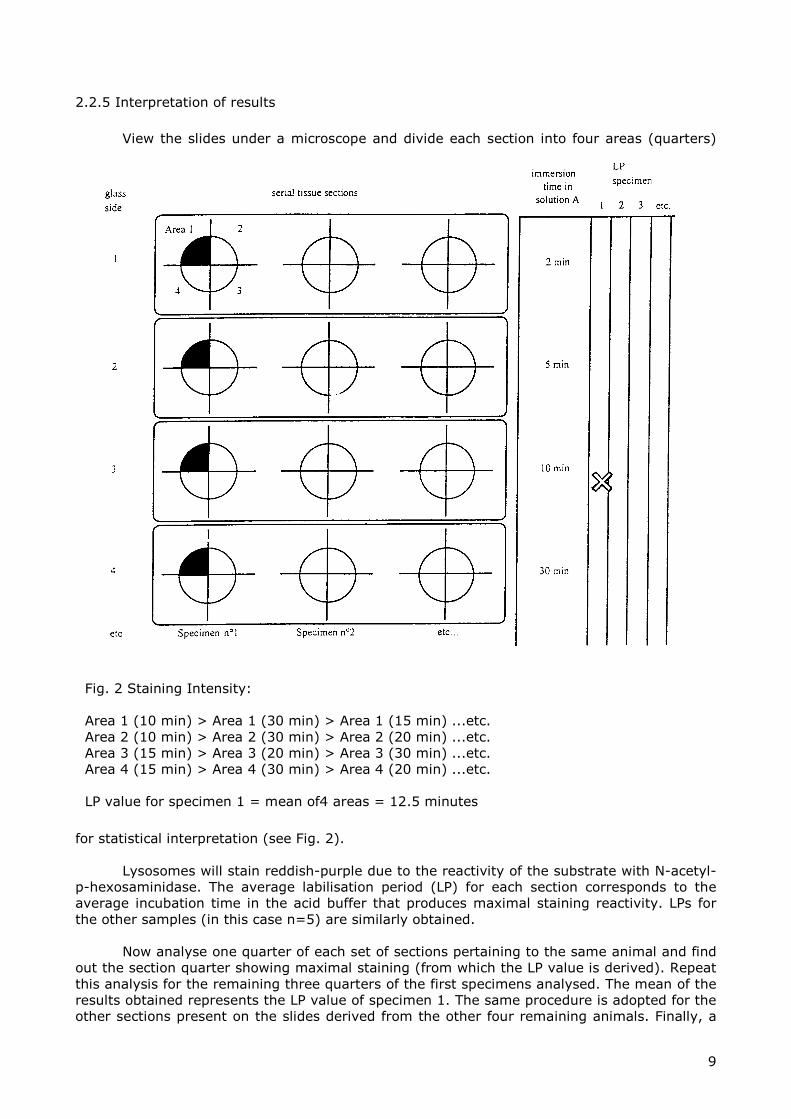
2.2.5 Interpretation of results
View the slides under a microscope and divide each section into four areas (quarters)
for statistical interpretation (see Fig. 2).
Lysosomes will stain reddish-purple due to the reactivity of the substrate with N-acetyl-p-hexosaminidase. The average labilisation period (LP) for each section corresponds to the average incubation time in the acid buffer that produces maximal staining reactivity. LPs for the other samples (in this case n=5) are similarly obtained.
Now analyse one quarter of each set of sections pertaining to the same animal and find out the section quarter showing maximal staining (from which the LP value is derived). Repeat this analysis for the remaining three quarters of the first specimens analysed. The mean of the results obtained represents the LP value of specimen 1. The same procedure is adopted for the other sections present on the slides derived from the other four remaining animals. Finally, a
Fig. 2 Staining Intensity: Area 1 (10 min) > Area 1 (30 min) > Area 1 (15 min) ...etc. Area 2 (10 min) > Area 2 (30 min) > Area 2 (20 min) ...etc. Area 3 (15 min) > Area 3 (20 min) > Area 3 (30 min) ...etc. Area 4 (15 min) > Area 4 (30 min) > Area 4 (20 min) ...etc. LP value for specimen 1 = mean of4 areas = 12.5 minutes
10
mean value of lysosomal membrane stability of the sample will be calculated utilizing the 5 data obtained from the 5 animals analysed.
Compare test samples with those taken from reference area and determine gradient of cytotoxicity. Reduction in the LP along the expected pollution gradient would indicate cellular stress due to pollution.
Any decrease in staining intensity in successive sections following that with maximal staining may be due to loss of enzyme by diffusion from fully labilised lysosomes. If there are two peaks of staining intensity, then consider only the main staining peak as the LP. This may be due to differential latent properties of the lysosomal hydrolase concerned.
"0" time will be utilised only to verify the correct lysosomal enzyme activity and it will not be considered in the evaluation of the maximal staining intensity peak. Intervals of 3 or 5 min are generally satisfactory for most test situations. The data can then be statistically tested using the Mann-Whitney U-test (Speigel, 1961) and compared with reference data. For mussel digestive gland, timing intervals of 3, 5, 10, 15, 20, 30 and 40 minutes are normally utilized.
2.3 Determination of lysosomal membrane stability in living cells: neutral red retention assay
Neutral red is a lipophilic dye and as such will freely permeate the cell membrane. within cells the compound becomes trapped by protonisation in the lysosomes and accumulated in these organelles, where it can be visualised microscopically. The degree of trapping of this lysosomotropic marker depends on the pH of the lysosome as well as the efficiency of its membrane associated proton pump (Segien, 1983).
The acid environment of lysosomes is maintained by a membrane Mg2+ ATPase
dependent H+ ion proton pump (Ohkuma et al., 1982), the neutral red retention assay reflects on the efflux of the lysosomal contents into the cytosol following damage to the membrane and, possibly, impairment of the H+ ion pump (Lowe et al., 1992). So any impairment of this latter system will result in a reduction of the dye retention assay. Studies indicate that, similarly to the cytochemical method described above, the neutral red retention assay is sensitive to the main classes of chemical pollutants (Lohse, 1990). The following protocol has been specifically adapted to be used on mussels.
2.3.1 Chemicals and solutions
Physiological saline 20mM(4.77g) Hepes 436 mM (25.48g) NaCl 53mM(13.06g) MgSO4 10mM(0.75g) KCl 10mM(1.47g) CaCl2 Dissolve these in 1 liter of distilled water. Gas for 10 minutes (95%O2:5% CO2) and adjust to pH 7.3 with 1M NaOH. Store solution in refrigerator, but use it at room temperature.
Neutral Red dye Prepare stock solution by dissolving 20 mg of neutral red powder in 1 ml of di-methyl-sulfoxide (DMSO). Transfer 5 µl of stock solution into 995 µl of physiological saline (working solution).
11
Keep neutral red in the dark and fridge when not utilized. The working solution must be prepared fresh before analysis.
2.3.2 Practical evaluation
The following procedures is according to Lowe et al. (1992) and Lowe et. (1995). Fill the eppendorf tubes with sigmacote (SIGMA) for 10-30 minutes, then return
sigmacote to container (it is reusable). Put 2 µl of Poly-L-Lysine (SIGMA) diluted 1 to 10 with distilled water, on a microscope slide and spread out with a cover slip. Leave to dry in a humidity chamber
Insert scissors half way along the ventral surface of the mussel and partially disclose
the valves to allow the insertion of the hypodermic syringe. Drain the water from the shell. Fill an hypodermic syringe with 0.5 ml of physiological saline and then aspirate 0.5 ml of haemolymph from the posterior abductor muscle of the mussel. After obtaining the haemolymph sample, discard the needle and expel the content in a siliconised eppendorf tube.
Dispense 40 µl of haemolymph-saline mixture on the slide, in the sample position where
the poly-l-lysine was added and incubate in humidity chamber for 3 minutes to allowing the cells to attach. Carefully drain the excess solution from the slide by placing the slide on its side and letting the liquid run off. Add 40 µl of the neutral red working solution and leave in a humidity chamber for 15 min (maintained 15-16°C during the analysis). Apply a cover slip and inspect the preparation under microscope.
Look at the slides every 15 minutes for the first hour then every 30 minute for the next
two hours thereafter. Determine the time at which 50% of the lysosome in the cells leaches out neutral red in the cytosol. Derive a mean value for each specimen and then a global mean for all specimens pertaining to the same pool. Compare samples from monitored field sites with those taken from reference field sites and determine gradient of cytotoxicity. An increase in leaching rates would indicate cellular stress due to pollution. Results:
Samples 0 15 30 60 90 control + + + + + treated + + ± - -
Key: + more than 50% of the lysosomes in the cells retaining neutral red - less than 50% of he lysosomes in the cells retaining neutral red
3. EVALUATION OF GENOTOXIC EFFECTS
3.1 Alkaline filter elution method
The following protocol, commonly known as the alkaline filter elution method (AFE) is a
widely used method to determine the extent of genetic damage in a wide range of marine organisms (Erickson et al., 1980). DNA single strand breaks or weak points in the alkali are identified by measuring the rate at which single-stranded DNA passes through a membrane filter of known porosity under alkaline denaturing conditions.
The sensitivity of the method depends on the complexity of the DNA, which differs
considerably among the different taxa. Thus, DNA from a lower taxon will eluate faster than
12
one of a higher one, even if completely undamaged. One good advantage in using this method is that it allows the determination of genotoxic damage in live animals, and in many instances, small tissue biopsies may be sufficient. Additionally, microfluorometric DNA determination (Cesarone et al., 1979) increases the sensitivity and reproducibility ofthe alkaline elution method.
3.1.1 Equipment
- peristaltic pumps with multiple channels (flow rate 1-10 ml/h); - spectrofluorometer: excitation: 360 nm / emission: 450 nm.; - Fraction collector; - pH meter able to measure pH>12; z - Filters (Millipore), Type GV 0.22 µm, GVWP 025004 - inverted microscope; - centrifuge; T - micro-syringe filter holder, luer inlet (XX30 02500) 4 - micro-syringe stainless support screen4 - O-ring teflon filter sealing4 - Flat gasket, teflon4
3.1.2 Chemicals and Solutions
Homogenisation buffer
O.14 M NaCl
1.47 mM KH2PO4 2.7 mM KCl
8.1 Na2HPO4 0.1 M EDTA
Bring the solution to pH 7.4 using NaOH.
HANKS' balanced salts solution 2X
273.8 mM NaCl 10.73 mM KCl
0.81 mM MgSO4�7H20 2.52 mM CaCl2�2H2O 0.674 mM Na2HPO4 2H2O 0.88 mM K2HPO4 8.33 mM NaHC03 10.09 mM D-Glucose�H2O
Lysing solution
2 M NaCl
0.02 M EDTA
0.2% N-laurylsarcosinate, sodium salt (Sigma L5125)
bring solution to pH 10.2 using NaOH 1N.
Washing solution
0.02 M EDTA. Bring solution to pH 10.2 using NaOH 1N.
Eluting solution
0.024 M EDTA. bring solution to pH 12.3 using tetraetylamonnium hydroxide (Merk 822149.0250)
4 Millipore Corp. USA
13
Working BIS solution Preparing 1.5 × 10⁻⁴ of BIS solution by dissolving 8 mg of bisbenzimide (33258 Hoechst: 2-[2-(4-hydroxy-phenyl)-6-benzimidazole]-6-(1methyl-4-piperazyl)-benzimidazole trihydrochloride (Farbwerke Hoechst Germany), MW: 533 9 in 100 ml of distilled water. Make 1 ml aliquots in Eppendorf tubes and store at 4°C in dark glass bottles and wrapped with tinfoil. Prepare the working solution by add 100 ml of water containing 0.154 M NaCl and 0.015 MNa3citrate (SSC buffer, pH 7.0) to 2 ml of BIS stock solution. The final solution is the working BIS solution. DNA standard
Calf thymus DNA was purchased from Sigma Chemical Company (St. Louis, Mo.), dissolved in sterile SSC, pH 7.0, sonicated for 10 s to increase the solubility, and diluted to a concentration of 1 mg/ml. This stock solution was diluted with SSC, pH 7.0.
3.1.3 Sample preparation from tissues of aquatic organisms
Avoid damaging DNA during handling procedures by using high EDTA concentrations
(0.03-0.1 M). Always keep materials on ice and try to work fast.
3.1.3.1 For fish liver
Excise liver and wash in homogenization buffer to remove blood residues. Proceed
immediately to the next step or store at -80°C. Homogenize the liver in the buffer using 1:5 w/v.
3.1.3.2 For mussel gill cells
Open mussels and remove gill cells. Isolate gill cells by enzymatic digestion with a
solution of dispase (Boehringer Mannheim), 0.1 mg/ml in modifíed (2X) Hanks' Balanced Salt solution, for 10 min at 37°C. The cellular suspension obtained by fíltration is centrifuged at 1,000 rpm for 10 minutes.
3.1.3.3 For mussel haemolymph
Introduce a hypodermic syringe in the large adductor muscle and draw out some
haemolymph. Dilute the sample with equal volume of Hanks' solution 2X.
3.1.4 Sample application
Prepare the elution apparatus. Place a filter (0.22 µm pore size) on a stainless support screen set on a filter holder, then put an O-ring Teflon filter sealing and screw a stainless extension barrel.
Load sample onto filter (10-20 mg físh liver per filter; 1 to 2 x 10⁶ haemocytes or gill cells per filter). Count cell concentration using a counting chamber.
3.1.5 Lysing of cells
Wash the filters with 4.5 ml of lysing solution. Repeat washing using 2.5 ml of washing
solution at the same flow rate.
14
3.1.6 Elution of single stranded DNA
Perform the elution under reduced light conditions.
Elute DNA through Durapore filters (25 mm diameter, 0.2 µm pore size placed on filter-holders (Millipore Corp. USA) with 10 ml of eluting solution at a flow rate of 0.05 ml/min (i.e. 2 ml. per fraction). Collect this volume in 5 tubes each containing 2 ml.
Recover the remaining DNA by removing the filter and immersing it in 4 ml of eluting solution. Cut it into small pieces. Shake vigorously.
Rinse the f�lter holder and tubes with 4 ml of eluting solution. This is denoted as 'dead' volume.
3.1.7 Microfluorimetric determination of DNA
Place 1 ml aliquots of each elution fraction, the DNA retained on the filter, and a wash of the filter holder in disposable glass test tubes. Neutralise each tube with 0.4 ml of 0.2 M KH2PO4, and add 0.6 ml of water to bring the volume up to 2 ml. Finally, add 1.0 ml of working BIS solution and vortex. Determine the increased fluorescence, due to binding of the fluorochrome to DNA, using a spectrofluorometer with the excitation wavelength set at 360 nm and the emission at 450 nm.
3.1.8 Calculation
3.1.8.1 Calculation of the slope of the elution curves (elution rate)
Elution slopes are calculated from semi-logarithmic plots of the fraction of DNA retained on the filter versus eluted volume or elution time and are expressed as the average rate of elution. The slope of the elution curve is a measure of the number of breaks in arbitrary units. Since the elution rate is faster for broken than for intact DNA, the amount of DNA retained on the filter is a measure of DNA single strand breaks. The elution rate decreases exponentially with elution time or volume (fraction number).
When the elution profile approaches a straight line we could use the first order kinetics equation.
For first order kinetics of alkaline elution:
y = ae-kv
where:
y = the fraction of DNA retained on the filter after the elution of the volume v
a = the quantity of DNA present on the filter at the 0 solution volume
v = vol
ln y = -kv + ln a
and
K = -ln y/v ;
The elution rate (K) could also be expressed versus t (the time of elution).
3.1.8.2 Calculation of Strand Scission Factor (SSR .
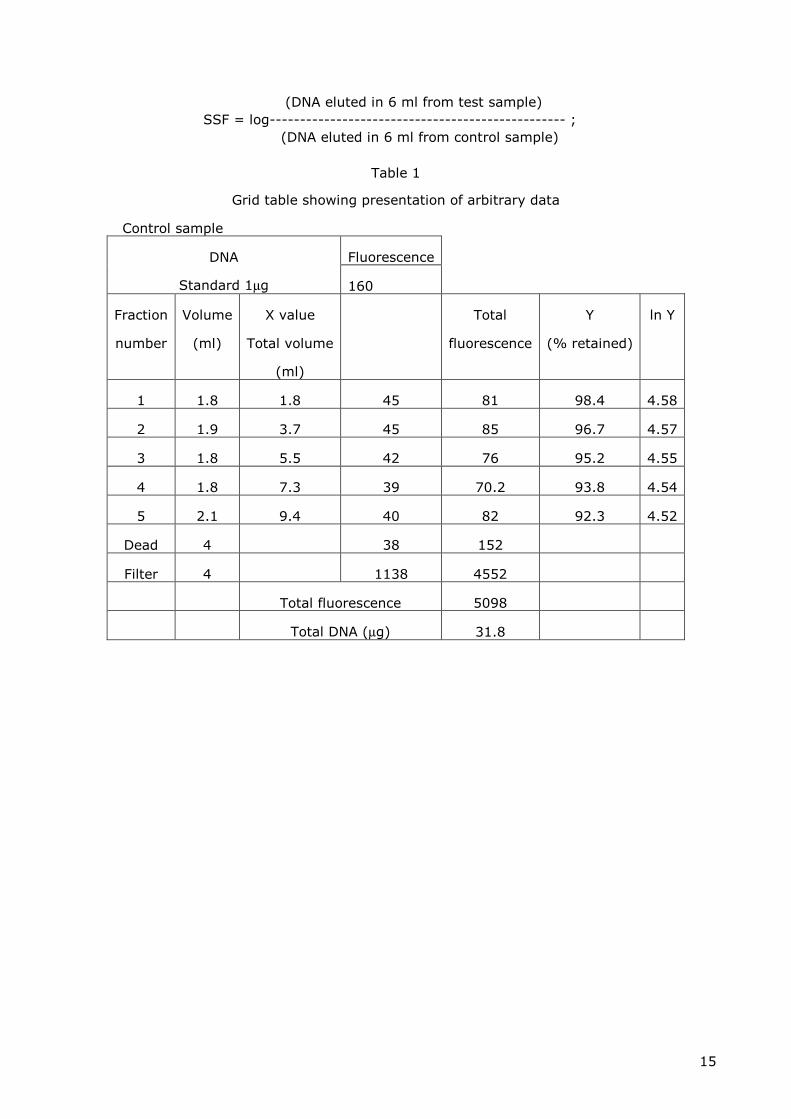
A value characterising the relative number of DNA-strand breaks, referred to as a "strand scission factor", was calculated by taking the absolute value of the log10 of the percentage of DNA retained in the treated sample eluted divided after a known elution volume by the percentage of DNA retained in the control sample eluted into the same amount of volume. Therefore, a strand scission factor of 0 indicates no DNA strand breaks. Values greater than 0 indicate a relative value for DNA breaks in the exposed cells (Meyn and Jenkins, 1983).
15
(DNA eluted in 6 ml from test sample)
SSF = log------------------------------------------------- ;
(DNA eluted in 6 ml from control sample)
Table 1
Grid table showing presentation of arbitrary data
Control sample
Fluorescence DNA
Standard 1µg 160
Fraction
number
Volume
(ml)
X value
Total volume
(ml)
Total
fluorescence
Y
(% retained)
ln Y
1 1.8 1.8 45 81 98.4 4.58
2 1.9 3.7 45 85 96.7 4.57
3 1.8 5.5 42 76 95.2 4.55
4 1.8 7.3 39 70.2 93.8 4.54
5 2.1 9.4 40 82 92.3 4.52
Dead 4 38 152
Filter 4 1138 4552
Total fluorescence 5098
Total DNA (µg) 31.8
16
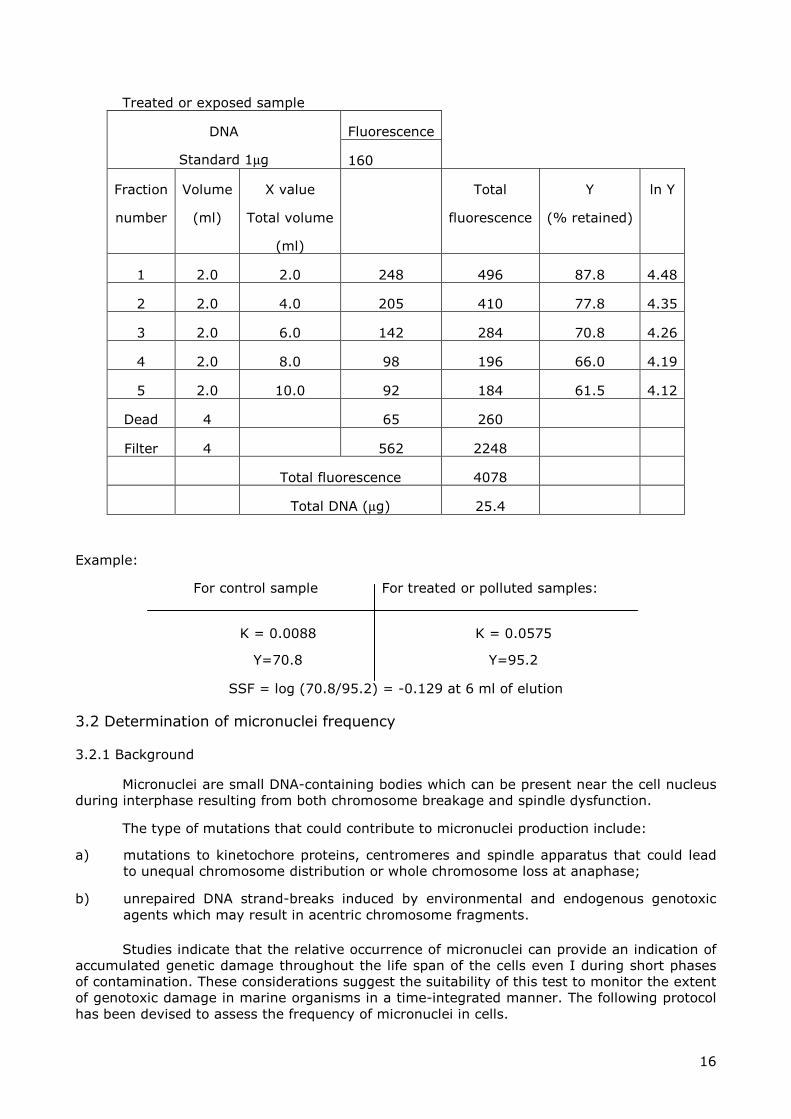
Treated or exposed sample
Fluorescence DNA
Standard 1µg 160
Fraction
number
Volume
(ml)
X value
Total volume
(ml)
Total
fluorescence
Y
(% retained)
ln Y
1 2.0 2.0 248 496 87.8 4.48
2 2.0 4.0 205 410 77.8 4.35
3 2.0 6.0 142 284 70.8 4.26
4 2.0 8.0 98 196 66.0 4.19
5 2.0 10.0 92 184 61.5 4.12
Dead 4 65 260
Filter 4 562 2248
Total fluorescence 4078
Total DNA (µg) 25.4
Example:
For control sample For treated or polluted samples:
K = 0.0088 K = 0.0575
Y=70.8 Y=95.2
SSF = log (70.8/95.2) = -0.129 at 6 ml of elution
3.2 Determination of micronuclei frequency
3.2.1 Background
Micronuclei are small DNA-containing bodies which can be present near the cell nucleus during interphase resulting from both chromosome breakage and spindle dysfunction.
The type of mutations that could contribute to micronuclei production include:
a) mutations to kinetochore proteins, centromeres and spindle apparatus that could lead to unequal chromosome distribution or whole chromosome loss at anaphase;
b) unrepaired DNA strand-breaks induced by environmental and endogenous genotoxic agents which may result in acentric chromosome fragments.
Studies indicate that the relative occurrence of micronuclei can provide an indication of accumulated genetic damage throughout the life span of the cells even I during short phases of contamination. These considerations suggest the suitability of this test to monitor the extent of genotoxic damage in marine organisms in a time-integrated manner. The following protocol has been devised to assess the frequency of micronuclei in cells.
17
3.2.2 Equipment
centrifuge,
optical microscope.
i
3.2.3 Chemicals and solutions
HANKS' balanced salts solution 2X (HBSS 2X)
273.8 mM NaCl
10.73mM KCI
0.81 mM MgS04�7H20
2.52 mM CaCl2�2H20
0.674 mM Na2HPO4�2H20
0.88 mM KH2PO4
8.33 mM NaHCO3
10.09 mM D-Glucose H20
Dispase solution
Dispase I (neutral protease; grade I, Boehringer Mannheim, Germany) 0.1 mg/ml in HBSS 2X
methanol: acetic acid (3:1)
3% Giemsa
3.2.4 Method
3.2.4.1 Preparation of cell suspension
Mussel haemolymph
Samples of haemolymph are drawn from the posterior adductor muscle sinus by an hypodermic syringe. The samples are diluted with an equal volume of Hanks' Balanced Salt solution and spinned at 1,000 rpm.
Gills of mussels
Gills are taken off and cells are isolated by enzymatic digestion with a solution of Dispase (Boehringer Mannheim, Germany), 0.1 mg/ml in modified (20‰) Hank's Balanced Salt solution, for 10 min at 37°C. The cellular suspension obtained by filtration is centrifuged at 1,000 rpm for 10 min.
3.2.4.2 Slide preparation
Aliquots of cellular pellet of mussel gills and haemolymph are fixed in methanol:acetic acid (3:1) for 20 min, then spread on slides, air dried and stained with 3 Giemsa. The slides are coded and scored blind.
3.2.4.3 Slide scorinq
Two thousands cells with preserved cytoplasm per mussel are scored under oil immersion at 1,000 x magnification. Due to the high interindividual variability of the MN frequency, 8-10 animals must be analysed for each experimental point.
The following criteria have to be met during scoring:
• only intact cells are scored;
• chromatin structure and color intensity similar to that of the main
18
• nucleus;
• on the same optical plane as the main nucleus;
• round or oval;
• not fragmented (to exclude small stain particles and apoptotic cells); • located within 4-fold the shortest axis of the nearest nucleus.
4. EVALUATION OF MIXED FUNCTION OXIDASE ACTIVITY
4.1 Background and principle
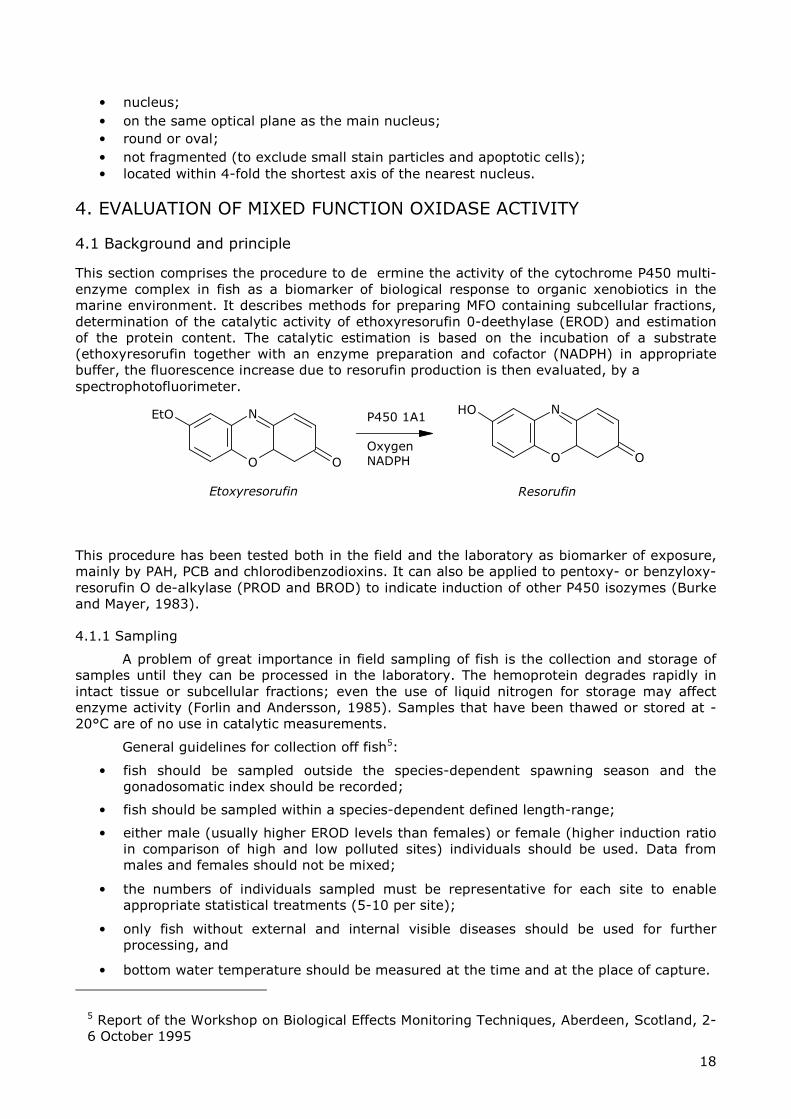
This section comprises the procedure to de�ermine the activity of the cytochrome P450 multi-enzyme complex in fish as a biomarker of biological response to organic xenobiotics in the marine environment. It describes methods for preparing MFO containing subcellular fractions, determination of the catalytic activity of ethoxyresorufin 0-deethylase (EROD) and estimation of the protein content. The catalytic estimation is based on the incubation of a substrate (ethoxyresorufin together with an enzyme preparation and cofactor (NADPH) in appropriate buffer, the fluorescence increase due to resorufin production is then evaluated, by a spectrophotofluorimeter.
This procedure has been tested both in the field and the laboratory as biomarker of exposure, mainly by PAH, PCB and chlorodibenzodioxins. It can also be applied to pentoxy- or benzyloxy-resorufin O de-alkylase (PROD and BROD) to indicate induction of other P450 isozymes (Burke and Mayer, 1983).
4.1.1 Sampling
A problem of great importance in field sampling of fish is the collection and storage of samples until they can be processed in the laboratory. The hemoprotein degrades rapidly in intact tissue or subcellular fractions; even the use of liquid nitrogen for storage may affect enzyme activity (Forlin and Andersson, 1985). Samples that have been thawed or stored at -20°C are of no use in catalytic measurements.
General guidelines for collection off fish5:
• fish should be sampled outside the species-dependent spawning season and the gonadosomatic index should be recorded;
• fish should be sampled within a species-dependent defined length-range;
• either male (usually higher EROD levels than females) or female (higher induction ratio in comparison of high and low polluted sites) individuals should be used. Data from males and females should not be mixed;
• the numbers of individuals sampled must be representative for each site to enable appropriate statistical treatments (5-10 per site);
• only fish without external and internal visible diseases should be used for further processing, and
• bottom water temperature should be measured at the time and at the place of capture.
5 Report of the Workshop on Biological Effects Monitoring Techniques, Aberdeen, Scotland, 2-6 October 1995
O
N
O
EtO
O
N
O
OHP450 1A1
OxygenNADPH
Etoxyresorufin Resorufin
19
4.1.2 Equipment
• Top-pan balance weighing to 0.1 g • Conventional dissection instruments • Ice bucket • Range of small beakers • Electric drill capable of2700 rpm • Potter-Elvehjem teflon-glass homogenizer (5 or 15 ml)
• Measuring cylinder (10 or 25 ml capacity) • Refrigerated ultracentrifuge • Graduated tubes, 5-15 m • Pasteur pipettes • Nalgene cryotubes • Micropipettes with disposable tips to deliver 10, 25, 50, 100, 200,1000 • Glass pipette to deliver 2 ml • Fluorimeter
4.1.3 Solutions and chemicals6
Solution A
150mM KCl
Solution B
10 mM HEPES containing 250 mM sucrose; 1 mM Na2EDTA, adjust to pH 7.4 with KOH (34-36, Prolabo)
Solution C
80 solution B + 20 glycerol (V/V)
Solution D
18.2 KH^PO, (Prolabo) 50mM + 22.2 Na2HPO4 (Prolabo)
200 mM bring to 100 with water, pH 7.44
Storage of solutions and chemicals
+ 4°C Solutions A, B, C, D, G-6PDH
-20°C NADP, G-6-P, Resorufin
-80°C Ethoxyresorufin (preferably)
4.1.4 Preparation of samples for analysis
This secTion describes the steps for preparing S9 fraction and microsomal samples prior to the measurement of MFOs. It is always convenient to prepare in advance as many reagents and solutions. Most, like those required for protein determinations, are stable and will withstand freezing and thawing if kept in plastic bottles. It is usually not possible to prepare nucleotide co-enzyme solutions in advance, however, and since (usually) small amounts of these are needed and as they are relatively expensive, it is desirable to preweigh appropriate amounts of
these, and keep them (cooled and desiccated) in small vials.
S9 fractions are prepared by centrifugation (e.g. 9.000 x g for 15 minutes Microsomal fractions are prepared by ultra-centrifugation (e.g. 100,000xg for 90 mins) of homogenates from fresh or frozen tissues (such as liver of hepatopancreas). Cytochrome P-450 activity measurements can be made both in this S9 supernatant and in the 100.000xg resuspended microsomal fraction.
6 All chemicals are from Sigma
20
4.1.4.1 Tissue dissection and preparation for analysis
Kill fish by severing spinal cord at the level of the pectoral fins and by insertion of a scissors blade in the brain. Weigh fish with an accuracy of ± 1%.
Dissect out the liver and avoid rupturing the gall bladder, since bile may contain MFO inhibitors. Weigh the liver (± 1%. accuracy) and place in a beaker on ice.
All subsequent operations should be performed at 4°C.
4.1.4.2 Homoqenization of tissue
Mince weighed liver (ideally ≥. 1 g, weighed to ± 0.1 g) with scissors, rinse it in solution
A and blot dry on tissue paper.
Adjust solution B by 0.1M PMSF (dissolved in ethanol).
Place the liver in a Potter glass homogeniser tube on ice and add solution B in ratio 5:1, v:w. Homogenize with 10 vertical strokes at high speed, keeping the tube cooled in ice. This produces the "crude homogenate".
4.1.4.3 Preparation of S-9 fraction and 100.000 x q pellet (microsomes)
Place the homogenate in centrifuge tubes and spin for 15 minutes at 9,000xg in a centrifuge. Collect the resultant supernatant (S-9), without the lipid phase, and subdivide it in small aliquots (100-200 µl) and store at -80°C. Utilize an aliquot of S9 for protein determination using the Bradford method (Bradford, 1976).
Alternatively, prepare 100.000 x g fraction (microsomes). Transfer S-9 fraction to an ultracentrifuge tube and re-centrifuge again at 100.000 x g for 50 min at 4°C. Discard the supernatant (cytosol) and resuspend the microsomal pellet in 1 ml of sol. C.
Transfer quantitatively this suspension into the potter, re-homogenize with 5 hand strokes using a teflon tip, keeping the homogenizer cooled in ice. Transfer the homogenized suspension in a graduated tube and record its volume. Hold on ice.
This is the microsomal preparation that is now ready for quantification of protein concentration and enzymatic activities.
Freeze aliquots (100 and 200 fJ) in Nalgene 1.5 ml cryotubes and stored at -80°C or in dry ice if required for future reference.
4.1.5 Protein determination |
This is in accordance with Bradford (1976).
1.5 ml polystirene spectrophotometer cuvettes are prepared containing various concentrations of Bovin Serum Albumine diluited with MilliQ water to a final volume of 20 microliter using 1, 2, 5, 10, 20 µg of BSA from a µg/µl stock solution.
10 µl of S9 are dispensed into the sample cuvettes. 10 µl of MilliQ water are added to obtain a final volume of 20 µl. 480 µl of MilliQ water are added to the reference and to the samples. 500 µl of Pierce Protein Assay Reagent are dispensed in all the cuvettes.
The absorbance at 595 nm is read against a blank containing only the reagents without S9 supernatant. BSA calibration curve is plotted and the protein concentration is estimated according to the regression curve.

21
4.1.6 Ethoxyresorufin 0-deethylase (EROD) determination (Suteau et al., 1988)
4.1.6.1 Preparation
Add sequentially in a tube:
1/100 volume of ethoxyresorufin (from a stock of 123 µM in DMSO) 1/10 volume ofglucose-6-phosphate (25 mM in H20) 1/10 volume NADPH (25 mM in H2O)
Bring the mixture to the desired final volume with solution D Add glucose-6-phosphate dehydrogenase (G-6-PDH) to obtain a final concentration of 1 unit ml-1. Warm the medium for 5 minutes at 30°C in a water bath.
4.1.6.2 Enzymatic reaction
While the above medium is warming, dispense individual S9 samples (10 to 100 µg in solution C) into Falcon 2018 polypropylene tubes.
For each sample, set a time "zero" in duplicate and a time "five" in duplicate.
To set a time 'zero' reaction, add 2 ml cold acetone onto the S9.
Now transfer all the tubes to the water bath and every 20 seconds add 1 ml of the warm medium to the samples and the time ‘zero’ reaction using an Eppendorf Multipette fitted with a 50 ml syringe. Vortex the tubes immediately.
Stop the reaction after 5 minutes by adding 2 ml cold acetone except the time ‘zero’ reaction tube. Vortex again the tubes.
Centrifuge the samples for 5 minutes at 6000 x g to eliminate flocculated protein.
4.1.6.3 Quantification of the resorufin produced
Having checked the extinction coefficient of the resorufin standard add 100 pmoles of resorufin to a new tube (using a 2 mM standard resorufin solution in di-methyl-sulphxide in 5 µl of a 1/100 dilution of solution C) and add 1 ml of reaction medium and 2 ml of cold acetone and vortex.
Measure the fluorescence using a spectrofluorimeter with an excitation wavelength of 537 nm and an emission wavelength of 583 nm.
Transfer the samples carefully into cuvettes leaving behind any precipitated
Autoblank on the time 'zero' reaction tube.
4.1.7 Calculation of the activity
For the calculation of EROD activity expressed in pmoles of resorufin/min/mg protein you can use the following formula
EROD activity= (IFc×c×VF)/(IF×Vc×t×P)
In which,
IFc is the fluorescence of the sample IF is the fluorescence ofthe standard (nmol/ml) c is the concentration ofthe standard (nmol/ml) VF is the f�nal volume of the mix (ml) Vc is the volume ofthe sample (ml) t is the reaction time P is protein concentration (mg/ml)
22
4.1.8 Interpretation of results
The EROD measurement is a convenient way of assessing P-450 1A1 catalytic activity and has gained widespread use in biomonitoring studies with fish. The catalytic assay can be viewed as a very useful primary test to identify biological responses due to PAH contamination. The occurrence of hepatic lesions should be recorded; it is a good idea to preserve representative sub-samples of hepatic tissue for future histological examination. Conformation of increased EROD response can be obtained by determining PAH adducts7 in fish as evidence that the EROD response is being mediated by organic aromatic xenobiotic compounds.
It is important to follow closely the proposed protocol as it is well known that standardization problems could arise due to: a) intercomparability of EROD activities in S-9 and microsomal fractions. This often tends to produce somewhat ambiguous results. b) the use of different protein estimation methods by different laboratories. c) a more pressing issue, is the use by different authors of different extinction coefficients for the reaction product - resorufin (phenoxazone) - which was found to vary between 20 to 73 mM-1 cm-1
Therefore, if the task is to intercompare and assess the EROD values amount various regional laboratories, then it is important to fully standardise the catalytic assay before any actual biomonitoring takes place.
4.1.9 Future developments
Ongoing research is taking place to detect immunochemically the induction response of P450 using antibody probes for both protein levels and mRNA level (Goksoyr et al., 1991a). In this way, the amount of a specific antibody probe cross-reacting with the P450 protein is measured chemically.
Immunochemical detection of m-RNA can prove highly advantageous since catalytic activity of induced P-450 (Gooch et al., 1989) may be inhibited by certain inducers (such as organochlorines). Consequently, analysis of catalytic activity alone might show no response, but strong induction can still be seen by immunochemical analysis of the P-450 protein or its mRNA. Apparently different types of inducers can also modulate the catalytic activity, as can endogenous compounds. In other cases the catalytic activity may be lost due to bad storage (e.g. in field sampling situations or the sample or tissue may be too small to give measurable catalytic activity (as with fish eggs and larvae) (Goksoyr et al., 1991b). In all of these cases, immundetection of P450 has been able to detect inductive responses that would not have bee
possible with catalytic measurements alone (Goksoyr et al., 1991a).
5. EVALUATION OF METALLOTHIONEIN (MT) LEVEL
5.1 Backqround
Routine quantification of MT levels often proves to be problematical due to the lack of a measurable biological activity of this metalloprotein. This has forced investigators to explore unique structural features to be exploited for the evaluation of the MT concentration. Research efforts have relied for on estimates of (1) metal content bound to this protein (e.g. by competitive metal displacement or direct quantification techniques) and (2) physical (e.g. absorption measurements), and chemical (e.g. measurement of sulphyhydryl groups and immunochemical affinities) characteristics.
Each of these approaches has its own strength and weakness. One major disadvantage common to most of these methods is the indirect estimation of metallothioneins, which may
7 PAH metabolites are not indicative of biological effects per se but can provide a| sensitive marker of exposure to bioavailable levels in the environment. PAH bioavailability can vary markedly in different f�sh species living in environments similarly contaminated with PAHs
23
lead to inconsistent results concerning the absolute value of the metallothionein concentration in the tissues. In addition, most of these procedures require expensive laboratory equipment (e.g. ultracentrifuges, AAS, chromatographic systems, etc.) and sample preparation and assay optimization require large commitments of time.
Biomolecular assay, such as the measurement of MT m-RNA, are providing some hope in developing a very sensitive technique (Swapan et al., 1991). Specific immunoassays for MT are available, but the limited inter-species compatibility provides a challenge for future development (Kay et al., 1991).
Recently, investigators are adapting simpler but still accurate and sensitive techniques to quantify the levels of MT in biological tissues. The following methodology is based on the estimation of the sulfhydryl content of MT proteins. This method has been reported to be a sensitive, time saving, and low-cost technique able to detect metallothionein content in the tissues of marine organisms (Viarengo et al., 1997) and is currently being intercalibrated and standardized by a number of laboratories within the Mediterranean.
5.2 Spectrophotometric determination of the -SH groups usinq Ellman's reagent
5.2.1 Principle
The method here described consists of the ethanol/chloroform fractionation of the 3O.OOO×g cytosolic containing fraction, to obtain a partially purified metallothionein fraction. Metallothionein concentration in the samples is then quantified by evaluating the SH residue content by a spectrophotometric method, using Ellman's reagent (DTNB: 5,5 dithiobis 2 nitrobenzoic acid) (Ellman, 1959). As known, metallothioneins are characterised by an extremely high cysteine content (about 20-30%) when compared to other proteins eventually present in the ethanolic extracts and therefore the metallothionein determination based on the SH detection allows a more selective evaluation of these metalloproteins.
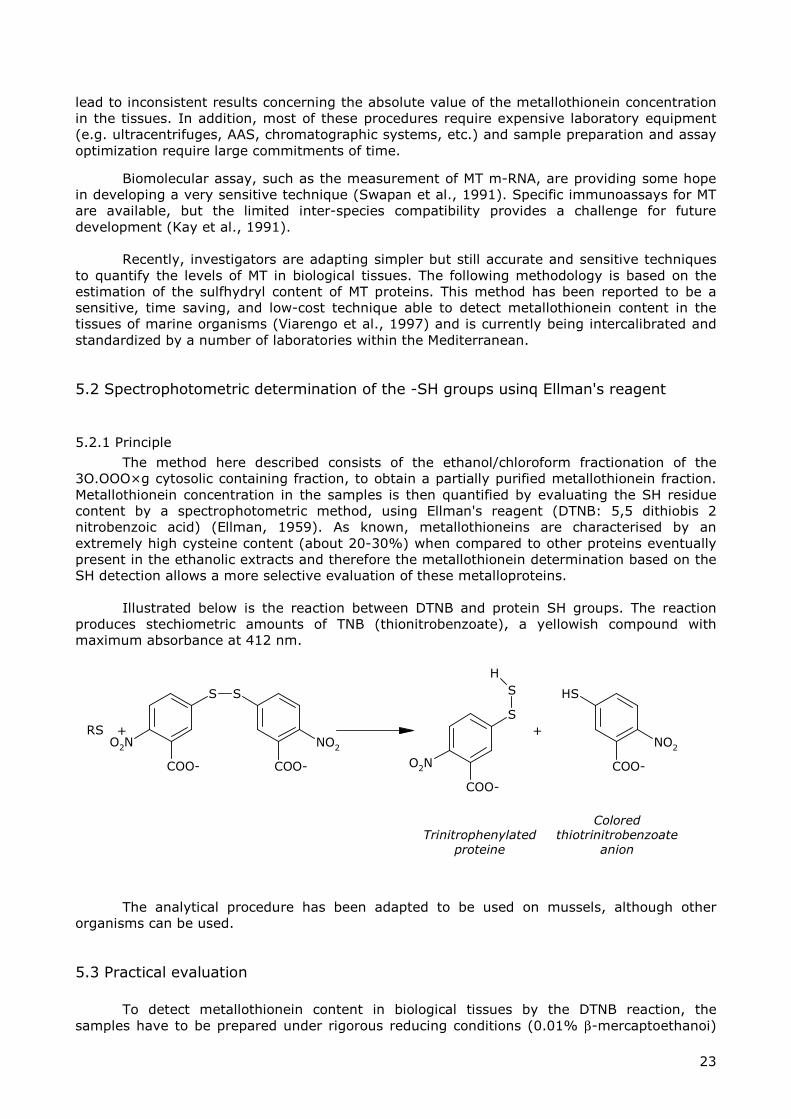
Illustrated below is the reaction between DTNB and protein SH groups. The reaction
produces stechiometric amounts of TNB (thionitrobenzoate), a yellowish compound with maximum absorbance at 412 nm.
The analytical procedure has been adapted to be used on mussels, although other
organisms can be used.
5.3 Practical evaluation
To detect metallothionein content in biological tissues by the DTNB reaction, the
samples have to be prepared under rigorous reducing conditions (0.01% β-mercaptoethanoi)
S S
COO- COO-
NO2O2N
RS
SH
COO-
NO2
S
COO-
O2N
S
H
+ +
Trinitrophenylatedproteine
Coloredthiotrinitrobenzoate
anion
24
as described in the protocol. The ethanol/chloroform fractionation allows both the elimination of low molecular weight soluble thiols, which reacting with DTNB, could interfere with metallothionein quantification, and the partial concentration of metallothioneins whose level in the tissues of uncontaminated animals is often low. During ethanolic fractionation the addition of RNA as co-precipitant and acid is essential to allow a quantitative metallothionein recovery. A final "washing" of the metallothionein extracts eliminates thiol contaminants, such as reducing agents present in the cells (glutathione, cysteine, etc.) or thiols added sample preparation ((3-mercaptoethanol). The concentrated MT pellet is resuspended in 0.25 M NaCl with addition of HCl and EDTA (to remove heavy metal cations still bound to metallothioneins), followed by the addition of a known amount of DTNB reagent in a high ionic strength medium (to completely denature metallothioneins). A calibration curve of reduced glutathione (GSH) or purified Cd, Zn thionein (commercially available) can be utilized to quantify the metallothionein content in mollusc tissues. Absorbance is evaluated at 412 nm.
5.3.1 Equipment
Cooling high speed centrifuge (having swing- and fixed-type angle rotors) Spectrophotometer Motor driven teflon/glass Potter homogenizer with teflon tip. Freezer Nitrogen gas cylinder
5.3.2 Solutions and Chemicals
Homogenization buffer
Make up: 0.5M_Sucrose-20mM TRIS pH 8.6. Leupeptin stock solution (1 mg/ml) (SIGMA L2884). Ethanolic stock solution of Phenylmethylsulfonyl fluoride (PMSF) (58 mg/ml) (SIGMA P7626).
To the desired volume of Sucrose-TRlS buffer add 3.0 Hl/ml leupeptin, 1.5 µl/ml PMSF and 0.1 µl/ml g-mercaptoethanol (equivalent to 0.01%) (MERCK 805740)
GSH (SIGMA G 4521) stock solution: freshly prepared before analysis 0.25M NaCl 0.2M phosphate buffer pH 8 containing 2M NaCl (store at room temperature) DTNB (SIGMA D8130) RNA (SIGMA R7250) (100 mg/ml) store at -20°C. cold (-20°C) absolute ethanol chloroform 37% HCI 1 N HCl/EDTA 4 mM (store at room temperature)
5.3.3 Sample and enriched MT fraction preparation
5.3.3.1 Homogenization
Rapidly dissect out and blot the digestive gland on 3 µm filter paper. Weigh a pool of
tissues belonging to at least 10 animals and homogenize about 1 g of tissue in 3 volumes of homogenizing buffer containing β-mercaptoethanol, PMSF and leupeptine, with 8 strokes in a motor driven teflon/glass Potter homogenizer.
25
5.3.3.2 Centrifugation
Centrifuge the homogenate at 30,000 x g for 20 minutes to obtain a soluble nuclei and
mitocondria free fraction containing MTs. The centrifuge rotor must be kept at 0-4°C. Note on safety: equilibrate the tubes before centrifuging. Employ (16ml) PYREX® or
COREX® glass tubes or high organic solvent resistant plastic
5.3.3.3 Ethanolic precipitation
Precipitate the high molecular weight proteins present in the supernatant using cold (-20°C) a¾solute ethanol. To 1 ml of the 30,000xg supernatant add 1.05 ml of cold (-20°C) absolute ethanol and 80 µl of chloroform. Vortex for few seconds. Centrifuge in a fixed angle or swinging rotor at 6,000xg for 10 minutes at 0-4°C. Collect the supernatant and measure the volume using a pipette.
To the 6,000xg supernatant add 40 µl of 37% HCl and 10 µl of a solution of RNA (1
mg/10 µl) followed by 3 volumes of cold ethanol. Store at -20°C for 1 hour.
Re-centrifuge at 6,000xg for 10 minutes using the swinging rotor. Discard the supernatant and wash the pellet with an ethanol/chloroform/homogenizing buffer (cold -20°C) solution (87:1:12 v/v) without the addition of β-mercaptoethanol, PMSF and leupeptin.
Centrifuge for 10 minutes at 6,000xg using a swinging rotor. Remove supernatant and dry pellet under nitrogen gas stream for about 10 min.
Note: tubes must be kept on ice during all steps.
Note on safety: Use (16ml) PYRE^ or COREX® glass tubes or organic-acid solvent
resistant plastic tubes.•
5.3.3.4 Resuspension of the MT enriched fraction
Add to the pellet 150 µl of 0.25 M NaCl solution and 150 µl of a solution made of 1N HCl
containing 4 mM EDTA (destabilising solution). Put a glass stirrer into the tube and vortex a few seconds for a complete resuspension of the sample.
5.3.4 DTNB assay (Ellman's reaction)
5.3.4.1 Glutathione reference standard curve
Make up a glutathione stock solution at 1mg/ml concentration in 0.25 M NaCl. Store in
ice. Prepare at least 3 GSH reference standard concentrations and a blank in accordance to Tab 5.1 on session § 5.3.4.2.
5.3.4.2 MT spectrophotometric evaluation
Just before analysis dissolve 0.43 mM (7.14 mg/42 ml) DTNB in 0.2 M phosphate
buffer pH 8 containing 2M NaCl. Store the solution in darkness at room temperature. Add to blank, standards and samples 4.2 ml DTNB solution. Centrifuge metallothionein
samples at 3.000xg for 5 min. at room temperature.

26
Measure the absorbance, ABS412 , using a spectrophotometer set at 412 nm utilizing reduced glutathione (GSH) as a reference standard.
GSH Stock
Solution
0.25M NaCl
1N HCl 4mM EDTA
DTNB Soln
Final Volume
Test samples 150 µl 150 µl 4.2 ml 4.5 ml Blank 150 µl 150 µl 4.2 ml 4.5 ml
Standard Stnd 20
(14.4 nmol/ml) 20 µl 130 µl 150 µl 4.2 ml 4.5 ml
Stnd 40 (28.8 nmol/ml)
40 µl 110 µl 150 µl 4.2 ml 4.5 ml
Stnd 80 (57.8 nmol/ml)
80 µl 70 µl 150 µl 4.2 ml 4.5 ml
5.3.5 Calculation and interpretation of result
5.3.5.1 Plotting of a standard curve
Express glutathione GSH reference standard as nmol/ml.
Plot a standard curve in which ABSGSH412, is a linear function of GSH concentration
(nmol/ml). ABSGSH
412 = ε [-SH]
In which (unit of measure between brackets); ABSGSH
412 (OD412), is the Optical Density of GSH samples at 412 nm , ε, (OD412/nmol/ml), is a constant representing the extinction coefficient for GSH, [-SH], (nmol/ml), represents the concentration of sulphydrylic groups in' GSH samples.
5.3.5.2 Quantitative determination of MT content
Interpolate ABSGSH
412 values obtained for metallothionein samples on the reference curve. The corresponding values found on the X-axis represents the concentrations of sulphydrylic groups belonging to metallothionein present in the samples. Taking into account the molecular features of mussel metallothionein (Mackay et al., 1993), for which cystein residues are 21 and molecular weight is 8600 DA, the final volume of DTNB reaction (4.5ml) and the dilution factor of the homogenate (4), the concentration of mussel metallothionein (ng/g tissue w.w.) present in the samples can be obtained using the following formula:
[x/21]*8,600 * 4.5 * 4 ,
in which : x (nmol/ml) represent the X-axis value coming from interpolation of ABSGSH
412 value on the reference curve.
Alternatively, determine graphically or by the use of a specific software (such as Microsoft Excel®) the equation of the line discussed on § 5.3.5.1. and use the following formula to determine metaflothionein (ng/g tissue w.w.) content in the samples:
27
[[(ABSMT412/εGSH)/21]*8600] * 4.5 * 4, (1)
in which: ABSMT
412 is the OD value red for metallothionein sample εGSH is a constant representing the extinction coefficient for GSH 21 is the number of cysteine residues of mussel metallothionein (Mackay et al 1993) 8,600 is the molecular weight of mussel metallothionein (Mackay et al., 1993) 4.5 (ml) is the final volume of DTNB reaction 4 is the dilution factor of the homogenate.
By simplifying (1) it can be obtained:
(ABSMT412/εGSH) * 7.37 * 10
-3, (2)
A higher level of sulphyhydryl content (≡MT) relative to the basal pre-existing level in reference clean samples would generally indicate the presence of a metal pollution stress in the animals at the sampling location. However, for the reasons already discussed in the introductory part of this manual, high MT levels can also be related to other factors which can influence its synthesis. For a correct approach to the use of Metallothionein as biomarker of exposure to heavy metal pollution (Viarengo et al., in press).
Coastal areas in which organisms show higher MT level than those belonging to
reference unpolluted areas should be further investigated. In this case, chemical analysis of biota and sediments is necessary to identify the type o insulting metal that particular area. Therefore it would be right to set aside a set of samples for metal analysis.
6. REFERENCES Addison RF and A.J. Edwards (1988), Hepatic microsomal mono-oxygenase activity in flounder Platichthys flesus from polluted sites in Langesundfjord and from mesocosms experimentally dosed with diesel oil and copper. MEPS Special - Biological Effects of Pollutants: Results of a practical workshop. Mar. Ecol. Prog. Ser., 46:51-54 Bradford MM. (1976), A rapid and sensitive assay of protein utilizing the principle of dye binding. Anal. Biochem.. 772:248-264 Bolognesi, C., M. Parrini, P. Roggieri, C. Ercolini and C. Pellegrino (1991), Carcinogenic and mutagenic pollutants: Impact on marine organisms. Proceedings of the FAO/UNEP/IOC Workshop on the biological effects of pollutants on marine organisms (Malta, 10-14 September 1991). MAP Technical Reports Series No. 69, UNEP, Athens, pp.113-121 Bradford, M. (1976), A rapid and sensitive assay of protein utilizing the principle of dye binding. Anal. Biochem., 772:248-264 Brouwer, M. and T.H. Brouwer (1998), Biochemical defense mechanisms against copper-induced oxidative damage in the blue crab, Callinectes sapidus. Arch. Biochem. Biophys., 351(2):257-264 Brouwer, M., P. Whaling and D.W. Engel (1986), Copper-MT in the American lobster: Potential role of Cu(l) donors to apohemocyanin. Env. Health Persp., 65:93-100 Burke, M.D. and R.T. Mayer (1983), Differential effects of phenobarbitone and 3-methylcholanthrene induction on the hepatic microsomal metabolism and cytochrome P-450-binding of phenoxazone and a homologous series of its n-alkyl ethers (alkoxyresorufíns). Chem. Biol. lnteract., 45:243-258
28
Cassar, G. and V. Axiak (1994), Effects of tributyltin on ethoxyresorufín-o-deethylase in vivo in seabream. Proceedings of the European Society for Comparative Physiology and Biochemistry. 15th Conference: Biochemical and Physiological Effects of Pollutants and Toxicological Assessment of Environmental Quality. Genova, Italy, 127 p. Cesarone, C.F., C. Bolognesi and L. Santi (1979), Improved microfluorimetric DNA determination in biological material using 33258 Hoechst. Anal. Biochem. 100:188-197 Dixon, D.R. (1983), Sister chromatid exchange and mutagens in the aquatic environment. Mar. Pollut. Bull., 14:282 Eichorn, G.L. (1973), Complexes of polynucelotides and nucleic acids. Inorganic Biochemistry, edited by G.L. Eichorn, Amsterdam, Elsevier Scientific, Vol. 2 pp.1210-1245 Ellman, G.L. (1959), Tissue sulphyhydryl groups. Arch. Biochem. Bioph., 82:70-77 Engel, D.W. (1988), The effect of biological variability on monitoring strategies: Metallothioneins as an example. Water Res. Bull., 24:981-937 Erickson, L.C., R. Osieka, N.A. Sharkey and K.W. Kohn (1980), Measurement of DNA damage in unlabelled mammalian cells analysed by alkaline elution and a fluorometric DNA assay. Anal. Biochem., 106:169-174 Forlin, L. and T. Andersson (1985), Storage conditions of rainbow trout liver cytochrome P-450 and conjugating enzymes. Comp. Biochem. Physiol., 80B:569-572 Galdies, C. (1995), The use of specific stress indices for Cu and Zn pollution monitoring of coastal waters. Unpublished MSc thesis, University of Malta Garrigues, P., C. Raoux, P. Lemaire, D. Ribera, A. Mathieu, J.F. Narbonne and M. I Lafaurie (1990), In situ correlation between PAH and PAH-metabolizing system activities in mussels and fish in íhe Mediterranean Sea: Preliminary results. Int. J. Analyt. Chem., 38:379-387 George, S.G. and Per-Erik Olsson (1994), Metallothioneins as indicators of trace metal pollution in Biomonitoring of Coastal Waters and Estuaries, edited by J.M. Kees. Boca Raton, FL 33431, Kramer CRC Press Inc, pp.151-171 Goering, P.L. and C.D. Klaassen (1984), Tolerance to Cd-induced toxicity depends on pre-synthesized MT in liver. J. Toxicol. Environ. Health., 14:803-812 Goksoyr, A. and L. Forlin (1992), The cytochrome P-450 system in fish, aquatic toxicology and environmental monitoring. Aquat. Toxicol., 22:287-312 Goksoyr, A., H.E. Larsen and A.-M. Husoy (1991a), Application of a cytochrome P- 450 IA1-ELISA in environmental monitoring and toxicological testing of fish. Comp. Biochem. Physiol., 10OC(1/2): 157-160 Goksoyr, A. T.S. Solberg and A.-M. Husoy (1991b), immunochemical detection of cytochrome P-4501A1 induction in cod (Gadus morhua) larvae and juveniles exposed to a water soluble fraction of North Sea crude oil. Mar. Pollut. Bull., 22:122-129 Gooch, J.W., A.A. Elskus, P.J. Kloepper-Sams, M.E. Hahn and J.J. Stegeman (1989), Effects of ortho- and non-ortho-substituted polychlorinated biphenyl congeners on the hepatic mono-oxygenase system in scup (Stenotomus chrysops). Toxicol. Appl. Pharmacol., 98:422-433 Hamer, D.H. (1986), Metallothionein. Annu. Rev. Biochem., 55:913-951
29
Hamer, D.H., D.J. Thiele and J.E. Lemont (1985), Function and autoregulation of yeast copperthionein. Science, 228:685-690 Heidelberger, C. (1973), Current trends in chemical carcinogenesis. Fed. Proc. 32:2154-2161 Karin, M. (1985), Metallothioneins: Proteins in search of function. Cell, 41:9-10 Kay, J., A. Cryer, B.M. Darke, P. Kille, W.E. Lees, C.G. Norey and J.M. Stark (1991). Int. J. Biochem., 23:1-5 Kloepper-Sams, P.J. and J.J. Stegeman (1989), The temporal relationships between P-450E protein content, catalytic activity and m-RNA levels in the teleost Fundulus heteroclitus follovving treatment with β-naphthoflavone. Arch. Biochem. Bioph., 268:525-535 Langston, W.J., M.J. Bebianno and Z. Mingjiang (1989), Metal-binding proteins and Cd in marine molluscs. Mar. Environ. Res., 28:195-200 Lohse, J. (1990), Distribution of organochlorine pollutants in North Sea sediments. International Conference on North sea Pollution - technical Strategies for improvement lAVVPRC, EVVPCA, NVA, Amsterdam, pp.227-236 Lowe, D., M.N. Moore and B.M. Evans (1992), Contaminant impact on interactions of molecular probes with lysosomes in living hepatocytes from dab Limanda limanda. Mar. Ecol. Progr. Ser., 91:135-140 Lowe, D.M., C. Soverchia and M.M. Moore (1995), Lysosomal membrane responses in the blood and digestive cells of mussels experimentally exposed to fluoranthene. Aquatic Toxicol., 33:105-112 Mackay, E.A., Overnell, J., Dunbar, B., Davidson, I., Hunziker, P.E., Kägi, J.H.R., Fothergill, J.E. (1993). Complete amino acid sequence of five dimeric and four monomeric forms of metallothionein from the edible mussel Mytilus edulis. Eur. J. Biochem., 218:183-194 Mathieu, A., P. Lemaire, S. Carriere, P. Drai, J. Giudicelli and M. Lafaurie (1991), Seasonal and sex-linked variations in hepatic and extrahepatic biotransformation activities in striped mullet (Mullus barbatus) Ecotox. Env. Safety, 22:45-47 Meyn, R.E. and W.T. Jenkins (1983), Variation in normal and tumor tissue sensitivity of mice to ionizing radiation-induced DNA strand breaks in vivo. Cancer Res., 43:5668-5673 Moore, M.N. (1985), Cellular responses to pollutants. Mar. Pollut. Bull., 16:134-139 Moore, M.N. (1990), Lysosomal cytochemistry in marine environmental monitoring. Histochemi. J.,22:187-191 Narbonne, J.F., P. Gamgues, D. Ribera, C. Raoux, A. Mathieu, P. Lemaire, J.P. Salaun and M. Lafaurie (1991), Mixed-function oxygenase enzymes as tools for pollution monitoring: field studies on the French coast of the Mediterranean sea. Comp. Biochem. Physiol., 100C:37-42 Nikunen, E. (1985), Toxic impact of effluents from petrochemical industry. Ecotoxicology and Environmental Safety, 9:84-91 Ohkuma, S., Y. Moriyama and T. Takano (1982), Identification and characterisation of a proton pump on lysosomes by fluorescein isothiocyanate-dextran fluorescence. Proc. Natl. Acad. Sci., 79:2758-2762 Payne, J.F. (1977), Mixed function oxidase s in marine organisms in relation to petroleum hydrocarbon metabolism and detection. Mar. Pollut. Bull., 8:112- 116

30
Pavicic, J., B. Raspor and M. Branica (1991), Metal binding proteins of Mytilus galloprovincialis, similar to metallothioneins, as a potential indicator of metal pollution. Proceedings of the FAO/UNEP/IOC Workshop on the biological effects of pollutants on marine organisms (Malta, 10-14 September 1991). MAP Technical Reports Series No. 69, UNEP, Athens, pp.217-234 Roesijadi, G, R. Bogumil, M. Vasak and J.H. Kagi (1998), Modulation of DNA binding of a tramtrack zinc finger peptide by the metallothionein-thionein conjugate pair. J. Biol. Chem., 273:17425-17432 Scarpato, R., L. Migliore, G.,,Alfinito-Cognetti and R. Barale (1990), Induction of micronuclei in gill tissue of Mytilus galloprovincialis exposed to polluted marine waters Mar. Pollut. Bull., 21:74-80 Segien, P.O. (1983), Inhibitors of lysosomal function. Meth. Enzymol., 96:737-765 Selli, A., C. Nasci, C. Pagnucco, R. Montanari and G.P. Serrazenatti (1994), Mono-oxygenase system and antioxidant enzymes in the bivalve mollusc Scapharca inaequivalvis from the Emilia-Romagna coast. Proceedings of the Biochemical and Physiological Effects of Pollutants and Toxicological Assessment of Environmental Quality. Genova, Italy, 146 p. Shugart, L. (1988), An alkaline unwinding assay for the detection of DNA damage in aquatic organisms. Mar. Environ. Res., 24:321 Speigel, M.R. (1961), Statistics. Schaum's Outline Series. Mc Graw-Hill Book Company, 359 p. Stegeman, J.J. (1989), Cytochrome P-450 forms in fish: catalytic, immunological and sequence similarities. Xenobiotica, 19:1093-1110 Stegeman, J.J., P.J. Klopper-Sams and J.W. Farrington (1986), Mono-oxygenase induction and chlorobiphenyls in the deep-sea fish Coryphaenoides armatus. Science, (Washington, DC) 231:1287-1289 Suteau, P., M. Daubeze, M.L. Migaud and J.F. Narbonne (1988), PAH-metabolizing enzymes in whole mussels as biochemical tests for chemical pollution monitoring. MEPS Special - Biological Effects of Pollutants: results of a practical workshop. Mar. Ecol. Prog. Ser., 46:45-49 Swapan, K. De, G.C. Enders and G.K. Andrews (1991), High levels of metallothionein messenger RNAs in male germ cells of the adult mouse in Molec. Endocrin., Vol. 5, No 5, pp.628-636 Tambutté, S., E. Tambutté, P. Rolland and M.-C Van Klaveren (1998), A biomonitoring program of the coastal area of the Principality of Monaco. International Symposium on Marine Pollution. Monaco, 5-9 October 1998. IEAE-SM-354/228 p. Thornalley, P.T. and M. Vasak (1985), Possible role for MT in protection against radiation-induced oxidative stress. Kinetics and mechanism of its reaction with superoxide and hydroxyl radicals. Biochim. Biophys. Acta, 827:36 UNEP (1997a), The MED POL Biomonitoring Programme Concerning the Effects of Pollutants on Marine Organisms Along the Mediterranean Coasts. UNEP(OCA)/MED WG. 132/3, Athens, 15 p. (mimeo) UNEP (1997b), Report of the Meeting of Experts to Review the MED POL Biomonitoring Programme. UNEP(OCA)/MED VVG.132/7, Athens, 19 p. (mimeo)
31
UNEP/FAO/IAEA (1993), Designing of monitoring programmes and management of data concerning chemical contaminants in marine organisms. MAP Technical Reports Series No. 77. UNEP, Athens, 236 p. Viarengo, A. and L. Canesi (1991), Mussels as biological indicators of pollution, Aquaculture, 94:225-243 Viarengo, A., M.N. Moore, G. Mancinelli, A. Mazzucotelli, P.K. Pipe and S.V. Farrar (1987), Metallothioneins and lysosomes in metal toxicity and accumulation in marine mussels: the effect of cadmium in the presence and absence of phenanthrene. Mar. Biol. , 94:251-257 Viarengo, A., G. Mancinelli, G. Martino, M. Pertica, L. Canesi and A. Mazzucotelli (1988a), Integrated stress indices in trace metal contamination: critical evaluation in a fíeld study. MEPS Special - Biological Effects of Pollutants: Results of a Practical Workshop. Mar. Ecol. Progr. Ser., 46:65-70 Viarengo, A., G. Mancinelli, M. Orunesu, G. Martino, F. Faranda and A. Mazzuccotelli (1988b), Effects of sublethal copper concentrations, temperature, salinity and oxygen levels on calcium content and on cellular distribution of copper in the gills of Mytilus galloprovincialis Lam.: a multifactorial experiment. Mar. Environ. Res, 24:227-231 Viarengo, A., Bettella, R. Fabbri, M. Lafaurie and X. Stien (1994), Heavy metal inhibition of EROD activity in liver microsomal preparation of Dicentrarchus labrax exposed to organic xenobiotics: role of GSH in the reduction of heavy metal effects. Proceedings of the European Society for Comparative Physiology and Biochemistry. 15th Conference: Biochemical and Physiological Effects of Pollutants and Toxicological Assessment of Environmental Quality. Genova, Italy, 121 p. Viarengo, A., E. Ponzano, F. Dondero and R. Fabbri (1997), A simple spectrophotometric method for MT evaluation in marine organisms: an application to Mediterranean and Antarctic molluscs. Mar. Environ. Res.44:69-84 Viarengo, A., B. Burlando, F. Dondero, A. Marro and R. Fabbri (in press), Metallothionein as a tool in biomonitoring programmes. Biomarkers
Related Documents


![Original Article Potential biomarkers for paclitaxel ... · Potential biomarkers for paclitaxel sensitivity in ... larynx and oropharynx cancer [5, 15]. ... Biomarkers for paclitaxel](https://static.cupdf.com/doc/110x72/5af0f1e17f8b9a572b901a03/original-article-potential-biomarkers-for-paclitaxel-biomarkers-for-paclitaxel.jpg)