Increased Electrification of Heating and Weather Risk in the Nordic Power System Ian M. Trotter *1,2 , Torjus F. Bolkesjø 2 , Eirik O. Jåstad 2 , and Jon Gustav Kirkerud 2 1 Institute of Public Policy and Sustainable Development/Department of Agricultural Economics, Universidade Federal de Viçosa 2 Faculty of Environmental Sciences and Natural Resource Management, Norwegian University of Life Sciences Working Paper – December 2021 Abstract Weather is one of the main drivers of both the power demand and supply, especially in the Nordic region which is characterized by high heating needs and a high share of renewable energy. Furthermore, ambitious decarbonization plans may cause power to replace fossil fuels for heating in the Nordic region, at the same time as large wind power expansions are expected, resulting in even greater exposure to weather risk. In this study, we quantify the increase in weather risk resulting from replacing fossil fuels with power for heating in the Nordic region, at the same time as variable renewable generation expands. First, we calibrate statistical weather-driven power consumption models for each of the countries Norway, Sweden, Denmark, and Fin- land. Then, we modify the weather sensitivity of the models to simulate different levels of heating electrification, and use 300 simulated weather years to investigate * Corresponding author. E-mail: [email protected] 1 arXiv:2112.02893v1 [econ.GN] 6 Dec 2021

Welcome message from author
This document is posted to help you gain knowledge. Please leave a comment to let me know what you think about it! Share it to your friends and learn new things together.
Transcript
Increased Electrification of Heating and Weather Risk
in the Nordic Power System
Ian M. Trotter∗1,2, Torjus F. Bolkesjø2, Eirik O. Jåstad2, and Jon Gustav
Kirkerud2
1Institute of Public Policy and Sustainable Development/Department of Agricultural
Economics, Universidade Federal de Viçosa
2Faculty of Environmental Sciences and Natural Resource Management, Norwegian
University of Life Sciences
Working Paper – December 2021
Abstract
Weather is one of the main drivers of both the power demand and supply, especially
in the Nordic region which is characterized by high heating needs and a high share of
renewable energy. Furthermore, ambitious decarbonization plans may cause power
to replace fossil fuels for heating in the Nordic region, at the same time as large
wind power expansions are expected, resulting in even greater exposure to weather
risk. In this study, we quantify the increase in weather risk resulting from replacing
fossil fuels with power for heating in the Nordic region, at the same time as variable
renewable generation expands. First, we calibrate statistical weather-driven power
consumption models for each of the countries Norway, Sweden, Denmark, and Fin-
land. Then, we modify the weather sensitivity of the models to simulate different
levels of heating electrification, and use 300 simulated weather years to investigate
∗Corresponding author. E-mail: [email protected]
1
arX
iv:2
112.
0289
3v1
[ec
on.G
N]
6 D
ec 2
021

Heating Electrification and Weather Risk Working Paper – December 2021
how differing weather conditions impact power consumption at each electrification
level. The results show that full replacement of fossil fuels by power for heating
in 2040 leads to an increase in annual consumption of 155 TWh (30%) compared
to a business-as-usual scenario during an average weather year, but a 178 TWh
(34%) increase during a one-in-twenty weather year. However, the increase in the
peak consumption is greater: around 50% for a normal weather year, and 70% for
a one-in-twenty weather year. Furthermore, wind and solar generation contribute
little during the consumption peaks. The increased weather sensitivity caused by
heating electrification causes greater total load, but also causes a significant increase
in inter-annual, seasonal, and intra-seasonal variations. We conclude that heating
electrification must be accompanied by an increase in power system flexibility to
ensure a stable and secure power supply.
Keywords: Power consumption · Heating electrification · Nordic power · Weather
risk
1 Introduction
Weather is one of the main drivers of both demand and supply in the power sector, and
its impact is increasing (Mideksa and Kallbekken, 2010; Staffell and Pfenninger, 2018).
On the demand side, weather conditions mainly affect power consumption related to
heating and cooling (Dryar, 1944; Quayle and Diaz, 1980; Hor et al., 2005; Trotter et al.,
2016; Rodriguez and Trotter, 2019). On the supply side, weather directly determines
wind (Foley et al., 2012) and solar power generation (Shi et al., 2012; Pfenninger and
Staffell, 2016; Sanjari and Gooi, 2017), as well as the conditions for hydropower production
(Kaunda et al., 2012; Birkedal and Bolkesjø, 2016). Therefore, weather conditions are of
fundamental importance in the power sector, and represent a significant source of variation
and uncertainty.
At the same time, two ongoing developments may further increase the Nordic power
system’s exposure to weather risk. Firstly, the transition away from fossil fuels may
result in an increase in electric heating. Due to the cold climate in the Nordic countries
2

Heating Electrification and Weather Risk Working Paper – December 2021
0
100
200
300
Denmark Finland Norway SwedenCountry
TW
h
Category
Heating
Rest
Figure 1: Heating energy demand in total final energy demand for the Nordic countriesin 2012. Based on data by Fleiter et al. (2016).
(Norway, Sweden Denmark and Finland), these countries already consume a large amount
of energy for heating purposes – approximately 480 TWh in 2012, representing almost
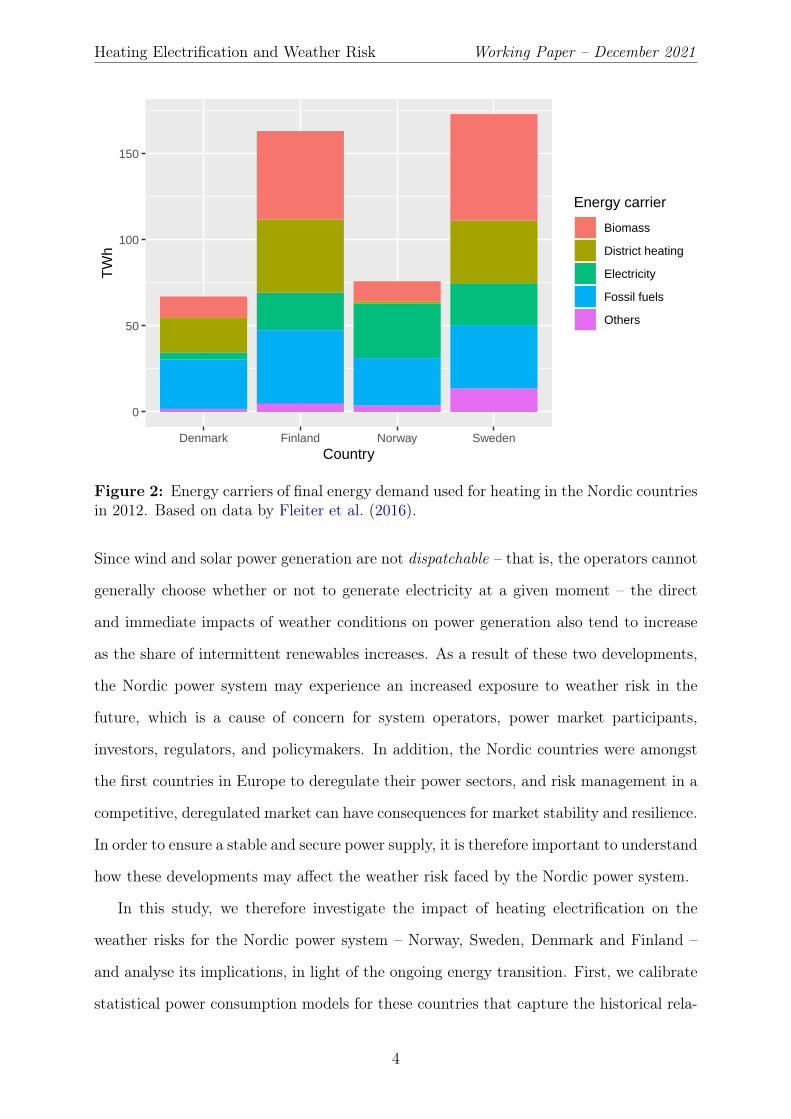
half the final energy demand (Fleiter et al., 2016), illustrated in Figure 1. In the four
countries combined, 17% of the heating energy in 2012 was provided by electricity and
28% was provided directly by fossil fuels (such as coal, fuel oil and natural gas), but
also 85% of the installed district heating capacity, which supplies around 21% of heating
energy, relies directly or indirectly on fossil fuels (Fleiter et al., 2016). Therefore, there is
a large potential for increased electric heating in the region, especially in the context of
a decarbonisation of the energy sector. As a result of increased reliance on electricity as
an energy carrier for heating, the power consumption will become increasingly sensitive
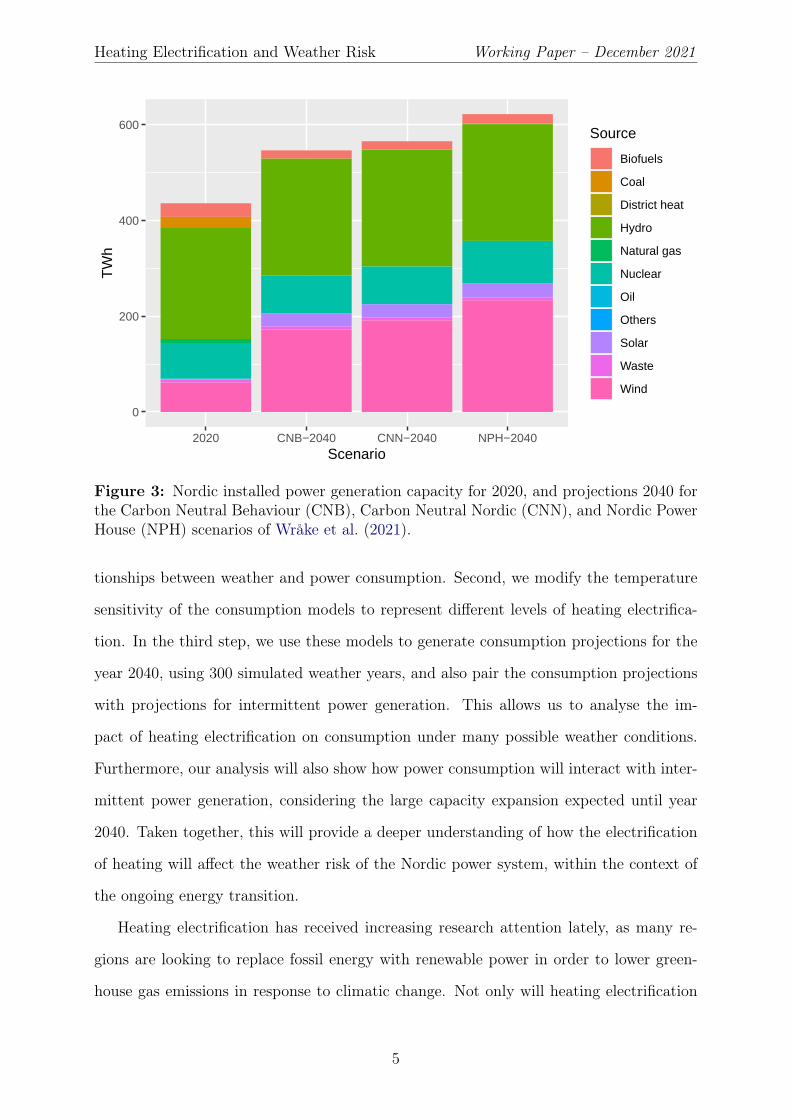
to weather conditions. Secondly, the share of intermittent renewable generation capacity,
such as wind and solar power, is increasing as part of a transition to renewable energy
sources. IEA (2016) expect wind power generation in the Nordics to increase around
five-fold from 2013 to 2050, and Wråke et al. (2021) project an increase in solar and wind
power generation of around three- or four-fold from 2020 to 2040, as illustrated in Figure 3.
3
Heating Electrification and Weather Risk Working Paper – December 2021
0
50
100
150
Denmark Finland Norway SwedenCountry
TW
h
Energy carrier
Biomass
District heating
Electricity
Fossil fuels
Others
Figure 2: Energy carriers of final energy demand used for heating in the Nordic countriesin 2012. Based on data by Fleiter et al. (2016).
Since wind and solar power generation are not dispatchable – that is, the operators cannot
generally choose whether or not to generate electricity at a given moment – the direct
and immediate impacts of weather conditions on power generation also tend to increase
as the share of intermittent renewables increases. As a result of these two developments,
the Nordic power system may experience an increased exposure to weather risk in the
future, which is a cause of concern for system operators, power market participants,
investors, regulators, and policymakers. In addition, the Nordic countries were amongst
the first countries in Europe to deregulate their power sectors, and risk management in a
competitive, deregulated market can have consequences for market stability and resilience.
In order to ensure a stable and secure power supply, it is therefore important to understand
how these developments may affect the weather risk faced by the Nordic power system.
In this study, we therefore investigate the impact of heating electrification on the
weather risks for the Nordic power system – Norway, Sweden, Denmark and Finland –
and analyse its implications, in light of the ongoing energy transition. First, we calibrate
statistical power consumption models for these countries that capture the historical rela-
4
Heating Electrification and Weather Risk Working Paper – December 2021
0
200
400
600
2020 CNB−2040 CNN−2040 NPH−2040Scenario
TW
h
Source
Biofuels
Coal
District heat
Hydro
Natural gas
Nuclear
Oil
Others
Solar
Waste
Wind
Figure 3: Nordic installed power generation capacity for 2020, and projections 2040 forthe Carbon Neutral Behaviour (CNB), Carbon Neutral Nordic (CNN), and Nordic PowerHouse (NPH) scenarios of Wråke et al. (2021).
tionships between weather and power consumption. Second, we modify the temperature
sensitivity of the consumption models to represent different levels of heating electrifica-
tion. In the third step, we use these models to generate consumption projections for the
year 2040, using 300 simulated weather years, and also pair the consumption projections
with projections for intermittent power generation. This allows us to analyse the im-
pact of heating electrification on consumption under many possible weather conditions.
Furthermore, our analysis will also show how power consumption will interact with inter-
mittent power generation, considering the large capacity expansion expected until year
2040. Taken together, this will provide a deeper understanding of how the electrification
of heating will affect the weather risk of the Nordic power system, within the context of
the ongoing energy transition.
Heating electrification has received increasing research attention lately, as many re-
gions are looking to replace fossil energy with renewable power in order to lower green-
house gas emissions in response to climatic change. Not only will heating electrification
5

Heating Electrification and Weather Risk Working Paper – December 2021
normally lead to higher power consumption (Watson et al., 2019), but it will also al-
ter the profile of the power consumption (Veldman et al., 2011; Staffell and Pfenninger,
2018). Larger amounts of electric heating would result in power consumption becoming
more weather sensitive, which again would cause greater variability and uncertainty in the
power consumption (Wilson et al., 2013), and may increase the frequency of unservicable
deficits (Quiggin and Buswell, 2016). This would translate into increased variability in
system costs, especially in systems with high VRE share (Heinen et al., 2017), and greatly
increase the need for power system flexibility (Staffell and Pfenninger, 2018; Thomaßen
et al., 2021). Despite these challenges, electrification of heating coupled with a large ex-
pansion in VRE generation is considered a viable – and even promising – strategy for
reducing emissions in several regions (Kirkerud et al., 2017; Sheikh and Callaway, 2019;
Ruhnau et al., 2020; Chen et al., 2021; Sakamoto et al., 2021), although it may only be
cost-efficient if emissions are relatively costly (Haghi et al., 2020).
In the context of the literature on heating electrification, our study makes two main
contributions. Firstly, we focus on the Nordic region, which has not been the main focus of
any earlier heating electrification studies. Although the Nordic region has been included in
the study on Northern Europe by Chen et al. (2021) and partly considered by Thomaßen
et al. (2021), there are compelling reasons to focus exclusively on this region. Due to
the harsh climate in this region, heating is a basic need and the heating requirements
are relatively large. In addition, the Nordic region has ambitious emissions reductions
targets, as the countries target carbon neutrality between 2030 and 20501 (Wråke et al.,
2021). This makes the Nordic region particularly interesting to study in the context of
heating electrification. Secondly, none of the earlier heating electrification studies focus
explicitly on weather risk, even though most agree that it is of great interest. Some
studies incorporate some degree of weather variability by considering several historical
weather years – such as Quiggin and Buswell (2016), Heinen et al. (2017), Staffell and
Pfenninger (2018) and Watson et al. (2019) – but we devote greater attention to this
aspect than previous studies on heating electrification by estimating outcome densities1The target year for carbon neutrality in Norway is 2030, 2035 in Finland, 2045 in Sweden, and 2050
in Denmark.
6

Heating Electrification and Weather Risk Working Paper – December 2021
using 300 simulated weather years.
Weather risk in power systems has been extensively studied previously, outside the
context of heating electrification. The professional community was early to incorporate
weather into load forecasting (Dryar, 1944; Heinemann et al., 1966). The meteorological
community was also early to study the link between weather and power demand (Thom,
1954; Quayle and Diaz, 1980), and the econometric community quickly followed (Fisher
and Kaysen, 1962; Halvorsen, 1975). Lately, the focus has gradually shifted from point
forecasts to probabilistic forecasts, which in some sense represent weather risk (Veall,
1987; McSharry et al., 2005; Hyndman and Fan, 2010; Sideratos and Hatziargyriou, 2012;
Tastu et al., 2014; Trotter et al., 2016; Wang et al., 2017). As climatic change gained
importance on the research agenda, the forecasting horizon also increased from hours,
days or weeks to decades (Parkpoom et al., 2004; Hyndman and Fan, 2010; Trotter et al.,
2016; Fan et al., 2019; Silva et al., 2020). A growing number of studies have also been
concerned with modelling and forecasting wind power generation (Foley et al., 2012; Tobin
et al., 2015; Kiviluoma et al., 2016; Garrido-Perez et al., 2020) and solar power generation
(Shi et al., 2012; Wild et al., 2015; Pfenninger and Staffell, 2016; Sanjari and Gooi, 2017;
Castillejo-Cuberos and Escobar, 2020). While earlier studies often considered each of
these elements in isolation, many recent studies analyse various elements in combination,
such as wind and solar (Heide et al., 2010; Bremen, 2010; Widen, 2011; Jerez et al.,
2013; Bett and Thornton, 2016; Solomon et al., 2016; Miglietta et al., 2017), solar and
hydro (Siala et al., 2021), wind and load (Sinden, 2007; Leahy and Foley, 2012; Baringo
and Conejo, 2013; Coughlin et al., 2014; Bell et al., 2015; Thornton et al., 2017), or
even wind, solar and hydro (Canales et al., 2020). Some studies incorporate additional
elements, including the impacts of weather on thermoelectric power plants (Tobin et al.,
2018), prices (Suomalainen et al., 2015), and tidal power generation (Coker et al., 2013).
Engeland et al. (2017) and Widén et al. (2015) present more comprehensive reviews of the
literature on the variability of renewable power generation. In a particularly interesting
pair of studies, van der Wiel et al. (2019b) use a large number of weather simulations
to investigate the risk of extreme shortfalls between renewable power production and
7

Heating Electrification and Weather Risk Working Paper – December 2021
demand in Europe, and van der Wiel et al. (2019a) further establish that the risk increases
during blocked circulation patterns, such as “Scandinavian blocking” and “North Atlantic
Oscillation negative”. Interestingly, the authors show that changes due to climate change
are substantially smaller than interannual weather variability. Further, focusing on the
meteorological variables, Ramsebner et al. (2021) also explore the correlations between
renewable generation and proxies for heating/cooling needs in Europe. These studies
all concern the impact of weather on the power system. Although some of the studies
present long-term projections (such as Hyndman and Fan (2010), Trotter et al. (2016)
and Rodriguez and Trotter (2019)) and even specifically investigate weather risk (such as
McSharry et al. (2005) and van der Wiel et al. (2019b)), the studies in this line of research
have not yet addressed the question of heating electrification.
Compared to the existing literature on weather risk in power systems, which gen-
erally implicitly assumes that weather sensitivity remains constant, our study therefore
contributes by simulating scenarios where the weather sensitivity of the power system
increases. Our study not only calibrates the statistical models and presents projetions,
but also modifies the models to represent fundamental changes in the underlying reality
– the electrification of heating – and thereby creating and comparing alternate scenarios.
As such, our study contributes to a deeper understanding of how heating electrification
may affect weather risk, and of the future of the Nordic power system in particular, which
is relevant to researchers, policymakers and market participants – particularly in light of
the ongoing energy transition.
This study is divided into four sections, including this introduction. The following
section details the methodology of our investigation, whereas the third section presents,
synthesizes and discusses the results of our experiment. The fourth and final section
summarizes the main conclusions of the investigation, and offers suggestions for future
investigations.
8
Heating Electrification and Weather Risk Working Paper – December 2021
2 Methodology
The objective of this study is to analyse the weather risks of the Nordic power system, un-
der conditions of increased heating electrification and increased variable renewable power
generation. Our strategy to achieve this consists of three main steps:
First we calibrate power consumption models for each of the Nordic countries – Nor-
way, Sweden, Denmark and Finland – using historical consumption and weather data.
Throughout, we work at an hourly resolution so that we capture intra-day variations in
both consumption and variable renewable generation.
Secondly, we modify the calibrated power consumption models in order to simulate
increased levels of heating electrification in the Nordic countries for the year 2040.
Thirdly, we use the consumption models together with a large amount of simulated
weather scenarios to generate a large number of possible joint paths for power consump-
tion and variable renewable generation for 2040. This will show how differing weather
conditions impact the power consumption and variable renewable power generation at
different levels of heating electrification, and allow us to estimate the density functions
of key figures such as total annual power consumption, annual peak power consumption,
and annual peak residual demand, which is the remainder when we subtract wind and
solar generation from consumption. Analysing the load duration curves of the different
electrification scenarios will also provide further insight into how heating electrification
impacts weather risk.
We now explain each step of our methodology in greater detail.
2.1 Consumption Model Calibration
A separate consumption model will be calibrated for each of the four countries – Norway,
Sweden, Denmark and Finland – at hourly resolution. The consumption models will relate
hourly power consumption to the temperature at a set of n = 5 weather stations in each
country through heating degree hours (HDH) and cooling degree hours (CDH), with cut-
off temperatures of 17◦C and 22◦C, respectively. We further include two important socio-
economic indicators in the models: gross domestic product (GDP) and population (POP).
9

Heating Electrification and Weather Risk Working Paper – December 2021
In order to capture seasonalities at different timescales, we include dummy variables for
each hour of the day (HR), each month of the year (MTH), each day of the week (WD),
and an indicator for holidays (HOL), as well as a trend variable (T). We base the model
on the natural logarithm of consumption, income and population, and calibrate the model
using ordinary least squares. As such, the estimated models can be represented in the
following functional form:
ln(Const) =a ln(GDPt) + b ln(POPt)
+n∑
i=1
ciHDHit +
n∑i=1
diCDHit
+24∑i=1
eiHRit +
12∑i=1
fiMTHit +
7∑i=1
giWDi,t + hTt + jHOLt.
The data is first split into training and validation samples, consisting of 75% and 25% of
the sample. We calibrate the models on the training samples using ordinary least-squares
regression, and measure the in-sample accuracies, as well as the out-of-sample accuracies
using the validation sample. The out-of-sample accuracies will give an indication of how
the models perform on data outside of the training set.
To measure the model accuracies, we calculate several error indices: root mean squared
error (RMSE), mean absolute error (MAE), mean absolute percentage error (MAPE) and
symmetric mean absolute percentage error (sMAPE). We then recalibrate the model on
the full dataset, and measure the in-sample accuracy, before using the models for creating
projections. In addition, we measure the relative importance of each group of model
inputs by estimating the effect sizes with Cohen’s f 2 (Selya et al., 2012), in order to
verify that weather is in fact an important determinant of power consumption.
2.2 Electrification and VRE Scenario Design
To simulate increased heating electrification, we modify the coefficients related to the
power consumption for heating purposes, specifically the coefficients for heating degree
hours, HDH. By applying a certain percentage increase to the HDH coefficient, we increase
10
Heating Electrification and Weather Risk Working Paper – December 2021
the weather-sensitivity of the power consumption, which is one of the main effects of
heating electrification on power consumption (see, for instance, Wilson et al. (2013);
Quiggin and Buswell (2016); Heinen et al. (2017); Thomaßen et al. (2021)). Based on
available data from 2012 (Fleiter et al., 2016), we calculate the percentage to increase
the HDH coefficients such that they represent the replacement of a certain proportion
of the fossil-based heating. Although more recent data may be available, we design the
electrification scenarios based on numbers from 2012 because it was a fairly typical year
for the Nordic power sector, and because it is within the later part of the calibration period
of the consumption models, ensuring that the designed scenarios are consistent with the
calibrated consumption models. This means, however, that some recent developments,
such as the recent increases in the use of biofuels for heating, are not entirely reflected in
the scenarios.
In order to calculate the percentage increase for the HDH coefficients, we must first
determine how much power will be needed to replace fossil-based heating. We distinguish
between three main uses of fossil fuels in the heating sector: direct heating of space and
water, use in district heating, and for process heat. We assume that space/water and
district heating are temperature sensitive, whilst process heat is not. Therefore, only
replacement of fossil fuels in space/water and district heating contributes to increasing
the temperature-sensitivity of power demand. In addition, some of the fossil fuel heating
may be replaced by electric heat pumps, leading to efficiency gains. Assuming that
fossil fuels for heating have around 90% efficiency, and that 75% of the temperature-
sensitive fossil fuel heating is replaced by heat pumps with a coefficient of performance
(COP) of 3 (Wilson et al., 2013), whereas 25% is replaced by resistive heating, then 1
J of fossil fuel can be replaced by 0.475 J of electricity. Table 1 shows the amount of
fossil space/water and district heating in each of the Nordic countries in 2012 (Fleiter
et al., 2016). By multiplying the sum of these by 0.475, we find how much electricity
will be needed to replace the temperature sensitive fossil-based heating. Comparing the
replacement electricity to the direct electric heating, we find how large a percentage
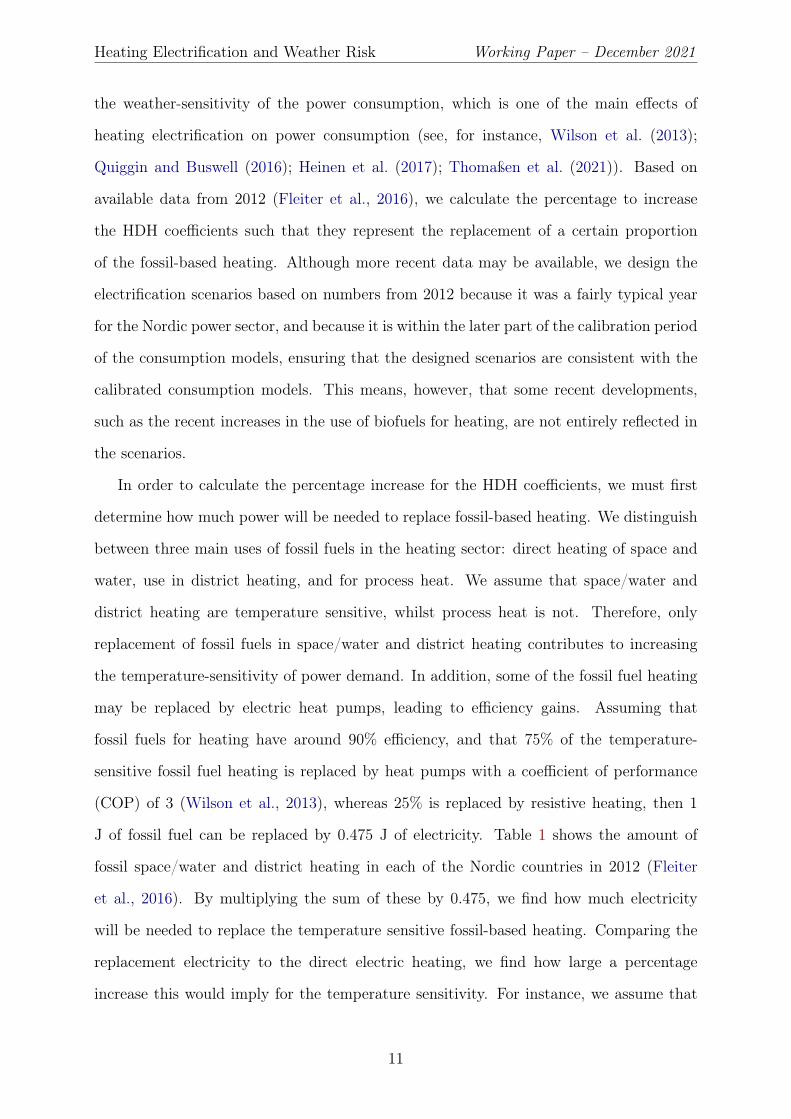
increase this would imply for the temperature sensitivity. For instance, we assume that
11
Heating Electrification and Weather Risk Working Paper – December 2021
Table 1: Calculation of consumption model modifications. Temperature sensitive fossil-based heating (space/water and district heating) could be replaced by a combination ofelectric heat pumps (75%) with a COP of 3 and electric resistive heating (25%). Such areplacement implies that temperature sensitive power consumption would increase by agiven percentage to provide the additional power. Based on data by Fleiter et al. (2016).
Norway Sweden Denmark FinlandFossil Space/Water Heating 9.7 TWh 11.0 TWh 16.9 TWh 17.9 TWhFossil-based District Heating 0.9 TWh 0 TWh 18.1 TWh 36.4 TWhTotal Temp. Sensitive Fossil 10.6 TWh 11.0 TWh 35.0 TWh 54.3 TWhReplacement Electric 5.0 TWh 5.2 TWh 16.6 TWh 25.8 TWhDirect Electric S/W Heating 29.0 TWh 21.5 TWh 2.7 TWh 20.0 TWhImplied Temp. Sensitivity Increase 17.4% 24.3% 615.7% 129.0%Fossil Process Heat 17.6 TWh 25.4 TWh 11.9 TWh 24.9 TWh
5.0 TWh of electricity could replace 10.6 TWh of temperature sensitive fossil heating
(space/water and district heating) in Norway, which would represent a 17.4% increase in
existing direct electric space/water heating (29.0 TWh).
We assume that process heat will be replaced with electricity at the same efficiency
rate, with a flat profile over the year.
Based on these assumptions, we define three different scenarios for 2040, characterised
by how large share of fossil fuels are substituted by power in the heating sector:
Business-As-Usual (BAU) is a baseline scenario that will serve as a basis for compari-
son. In this scenario, the temperature sensitivity of the original consumption models
will remain unchanged, and no additional process heat is explicitly electrified.
Half Electrification (HALF) assumes that half of the heating from fossil fuels will be
replaced by electric heating in 2040. Table 2 shows the increase in temperature
sensitivity and the additional baseload applied to the power consumption models
for this scenario.
Full Electrification (FULL) assumes that all the heating that was based on fossil fuels
in 2012 is electrified, again with 75% of the temperature sensitive heating being
replaced by heat pumps and 25% being replaced by resistive heating, and the process
heat being replaced with a flat consumption over the year. This implies, as shown
in Table 2, an increase in the temperature sensitivity for Norway of 17.4%, Sweden
12

Heating Electrification and Weather Risk Working Paper – December 2021
Table 2: Increase in the heating-related coefficient and the constant in the power con-sumption model for the different scenarios.
Country Half Electrification Full ElectrificationTemp. Sens. Increase Constant Temp. Sens. Increase Constant
Norway 8.7% 8.8 TWh 17.4% 17.6 TWhSweden 12.2% 12.7 TWh 24.3% 25.4 TWhDenmark 307.9% 6.0 TWh 615.8% 11.9 TWhFinland 64.5% 12.5 TWh 129.0% 24.9 TWh
Table 3: Assumed wind and PV capacities for 2040, from the Carbon Neutral Nordic(CNN) scenario of the Nordic Clean Energy Scenarios (Wråke et al., 2021).
Country Wind Generation Capacity 2040 PV Capacity 2040Norway 7.2 GW 0.03 GWSweden 21.8 GW 7.1 GWDenmark 20.0 GW 9.1 GWFinland 7.4 GW 7.5 GW
of 24.3%, Denmark of 615.8%, and Finland of 129%.
These scenarios are highly stylized and deliberately simplify the possible range of outcomes
of the energy transition, as well as many technical and economic aspects regarding the
efficiency and adoption of heat pumps and resistive heating. Nonetheless, we believe
that the simplicity of the scenarios will serve to draw clearer insights from this thought
experiment, and that these scenarios are capable of representing and illustrating the
potential impacts in a broad sense.
In order to explore the interaction between consumption and variable renewable power
generation, we also require assumptions regarding wind and solar power generation ca-
pacities in 2040. When combined with weather data, these assumptions will allow us to
calculate residual demand, which is the power consumption minus wind and solar power
generation. We rely on the Nordic Clean Energy Scenarios (Wråke et al., 2021) for pro-
jections of the wind and solar power generation capacities in 2040, which are shown in
Table 3. When consumption and the generation in different regions are aggregated, we
assume for simplicity that there are no transmission restrictions or losses (“copperplate
transmission”).
Comparing the projected probability distributions from the simulations of partial or
full heating electrification (HALF or FULL) to the simulations of no further heating
13
Heating Electrification and Weather Risk Working Paper – December 2021
electrification (BAU) should illustrate clearly what effects heating electrification will have
on power consumption, and the residual demand will show how variable renewable power
generation will interact with the power consumption.
2.3 Weather Scenarios
For our strategy for investigating weather risk, we generate 300 simulated weather paths
using the shifted date method, which has been shown to produce accurate probabilistic
load forecasts (Xie and Hong, 2018). In the shifted date method, we use entire historical
weather years that are shifted backwards or forwards by a certain number of days, which
ensures that each weather scenario is geographically and temporally consistent. Although
this method does not capture long-term changes that may be occurring in the climate, van
der Wiel et al. (2019a) have shown that changes due to climate change are substantially
smaller than interannual weather variability, which is the main focus of our study. We
then feed the weather paths into the consumption models, together with population and
GDP projections for 2040, in order to create a large amount of consumption scenarios for
2040 at hourly resolution under differing weather conditions.
Scenarios for variable renewable power generation – wind and solar power – are coupled
with the consumption scenarios, that is, based on the same weather paths. The scenarios
for wind and solar are based on the capacity factors used by Grams et al. (2017). Using
consumption paths coupled with wind and solar power generation based on the same
weather conditions will show how power consumption and VRE generation interact, and
provide a deeper understanding of how heating electrification will affect the weather risk
of the Nordic power system within the context of the large expected expansion in VRE
generation capacity.
2.4 Data Sources and Preprocessing
Hourly power consumption data have been provided by each countries’ power grid opera-
tor. Historical and projected GDP data have been retrieved from the long-term real GDP
forecast published by OECD (2018), whereas historical and forecasted population was re-
14
Heating Electrification and Weather Risk Working Paper – December 2021
trieved from the OECD.Stat database2. The GDP and population data were transformed
to hourly data by linear interpolation.
Hourly weather data at five locations for each of the countries from 1985 to 2016
was retrieved from the ERA5 reanalysis data on single levels, provided by Hersbach et al.
(2018) through the Copernicus Climate Change Service (C3S) Climate Data Store (CDS).
Reanalysis data are convenient for this study, as this ensures that the data is complete
and consistent.
Hourly capacity factors for wind and solar power generation were provided by Grams
et al. (2017). To calculate the power generation projections, the capacity factors were
multiplied by their respective projections for installed capacity.
3 Results and Discussion
3.1 Consumption Model Estimation
We calibrate the hourly power consumption models for each of the countries and calculate
accuracy metrics as discussed in Section 2.1. The regression results are shown in Appendix
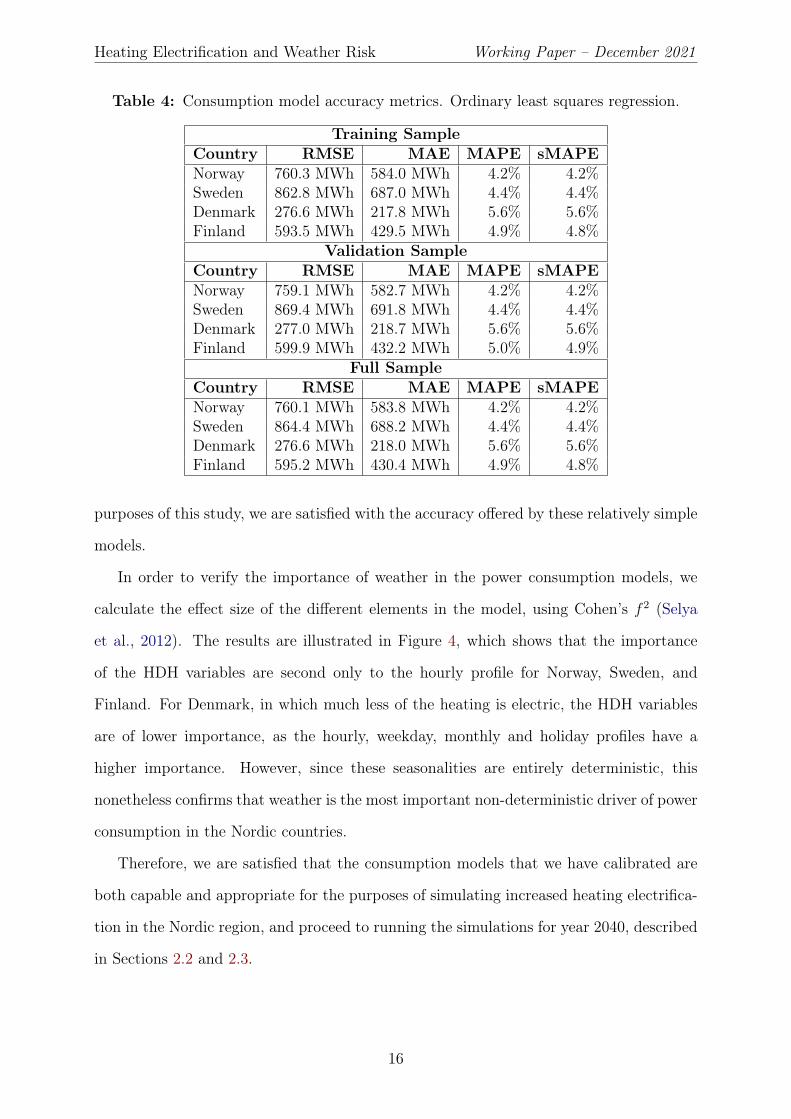
A, whereas the accuracy metrics are shown in Table 4. Generally, the mean absolute
percentage error (MAPE) appears to be around 5% for these countries, with only small
differences between the training sample, the validation sample and the full sample. The
models do not appear to suffer from overfitting, since the performance on the training
and validation samples are very close.
Overall, the accuracy of the models is reasonable for such simple models, although a
little lower than efforts with a greater focus on model accuracy (such as McSharry et al.
(2005); Hor et al. (2005); Hyndman and Fan (2010); Trotter et al. (2016); Rodriguez and
Trotter (2019)), which often achieve a MAPE of around 2%-3%. We believe it would be
possible to achieve a similar accuracy in our case, but this would introduce additional
model complexity which may not necessarily be appropriate for our purposes. For the2Historical population available at https://stats.oecd.org/Index.aspx?DataSetCode=
HISTPOP, and population projections at https://stats.oecd.org/Index.aspx?DataSetCode=POPPROJ, accessed Oct. 20, 2021.
15
Heating Electrification and Weather Risk Working Paper – December 2021
Table 4: Consumption model accuracy metrics. Ordinary least squares regression.
Training SampleCountry RMSE MAE MAPE sMAPENorway 760.3 MWh 584.0 MWh 4.2% 4.2%Sweden 862.8 MWh 687.0 MWh 4.4% 4.4%Denmark 276.6 MWh 217.8 MWh 5.6% 5.6%Finland 593.5 MWh 429.5 MWh 4.9% 4.8%
Validation SampleCountry RMSE MAE MAPE sMAPENorway 759.1 MWh 582.7 MWh 4.2% 4.2%Sweden 869.4 MWh 691.8 MWh 4.4% 4.4%Denmark 277.0 MWh 218.7 MWh 5.6% 5.6%Finland 599.9 MWh 432.2 MWh 5.0% 4.9%
Full SampleCountry RMSE MAE MAPE sMAPENorway 760.1 MWh 583.8 MWh 4.2% 4.2%Sweden 864.4 MWh 688.2 MWh 4.4% 4.4%Denmark 276.6 MWh 218.0 MWh 5.6% 5.6%Finland 595.2 MWh 430.4 MWh 4.9% 4.8%
purposes of this study, we are satisfied with the accuracy offered by these relatively simple
models.
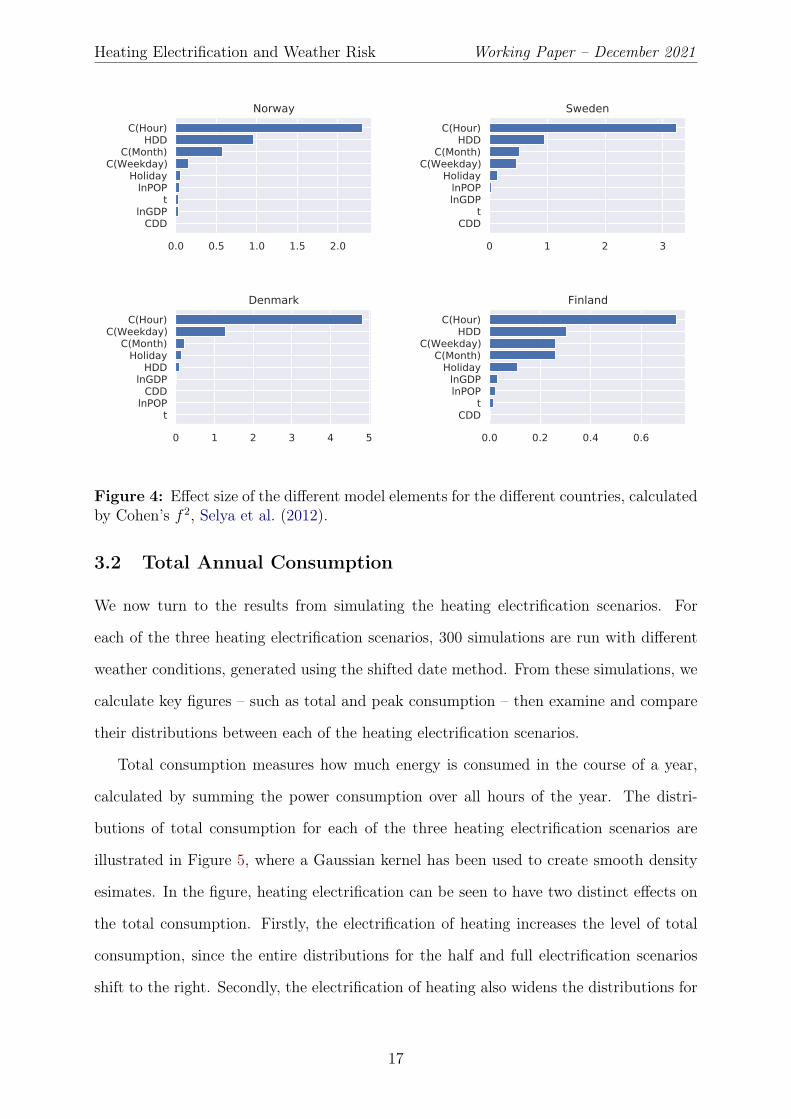
In order to verify the importance of weather in the power consumption models, we
calculate the effect size of the different elements in the model, using Cohen’s f 2 (Selya
et al., 2012). The results are illustrated in Figure 4, which shows that the importance
of the HDH variables are second only to the hourly profile for Norway, Sweden, and
Finland. For Denmark, in which much less of the heating is electric, the HDH variables
are of lower importance, as the hourly, weekday, monthly and holiday profiles have a
higher importance. However, since these seasonalities are entirely deterministic, this
nonetheless confirms that weather is the most important non-deterministic driver of power
consumption in the Nordic countries.
Therefore, we are satisfied that the consumption models that we have calibrated are
both capable and appropriate for the purposes of simulating increased heating electrifica-
tion in the Nordic region, and proceed to running the simulations for year 2040, described
in Sections 2.2 and 2.3.
16
Heating Electrification and Weather Risk Working Paper – December 2021
0.0 0.5 1.0 1.5 2.0
CDDlnGDP
tlnPOP
HolidayC(Weekday)
C(Month)HDD
C(Hour)Norway
0 1 2 3
CDDt
lnGDPlnPOP
HolidayC(Weekday)
C(Month)HDD
C(Hour)Sweden
0 1 2 3 4 5
tlnPOP
CDDlnGDP
HDDHoliday
C(Month)C(Weekday)
C(Hour)Denmark
0.0 0.2 0.4 0.6
CDDt
lnPOPlnGDP
HolidayC(Month)
C(Weekday)HDD
C(Hour)Finland
Figure 4: Effect size of the different model elements for the different countries, calculatedby Cohen’s f 2, Selya et al. (2012).
3.2 Total Annual Consumption
We now turn to the results from simulating the heating electrification scenarios. For
each of the three heating electrification scenarios, 300 simulations are run with different
weather conditions, generated using the shifted date method. From these simulations, we
calculate key figures – such as total and peak consumption – then examine and compare
their distributions between each of the heating electrification scenarios.
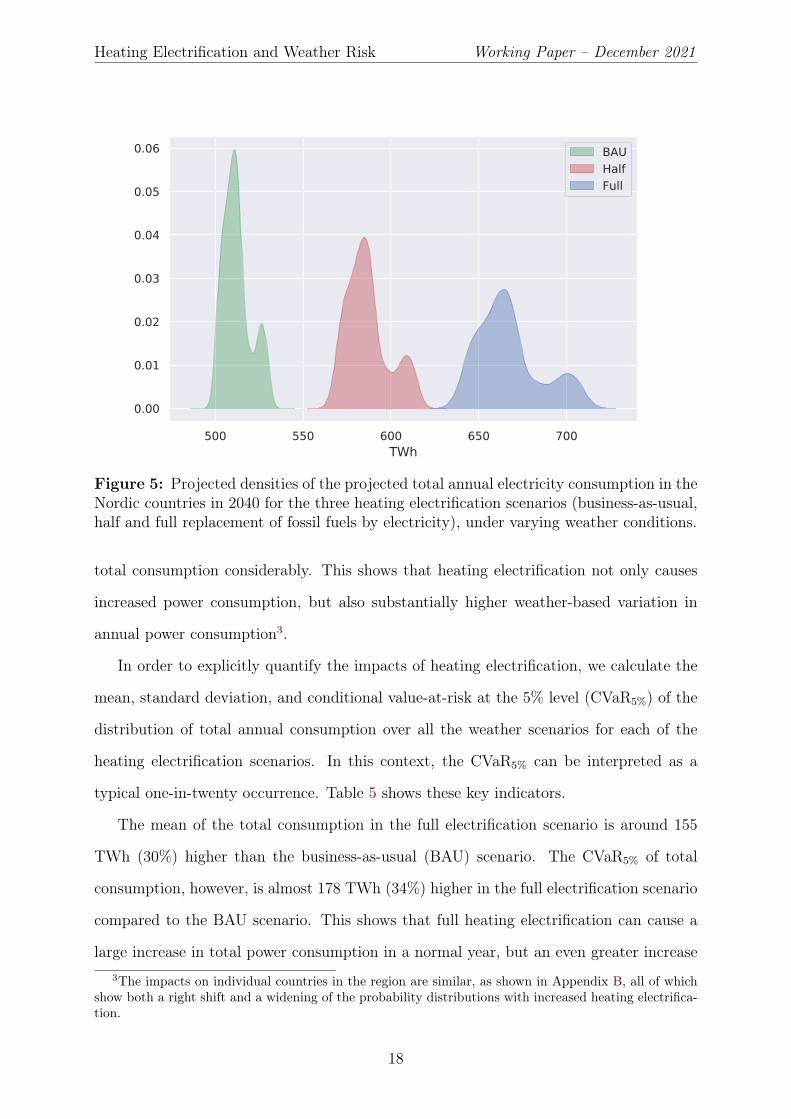
Total consumption measures how much energy is consumed in the course of a year,
calculated by summing the power consumption over all hours of the year. The distri-
butions of total consumption for each of the three heating electrification scenarios are
illustrated in Figure 5, where a Gaussian kernel has been used to create smooth density
esimates. In the figure, heating electrification can be seen to have two distinct effects on
the total consumption. Firstly, the electrification of heating increases the level of total
consumption, since the entire distributions for the half and full electrification scenarios
shift to the right. Secondly, the electrification of heating also widens the distributions for
17
Heating Electrification and Weather Risk Working Paper – December 2021
500 550 600 650 700TWh
0.00
0.01
0.02
0.03
0.04
0.05
0.06 BAUHalfFull
Figure 5: Projected densities of the projected total annual electricity consumption in theNordic countries in 2040 for the three heating electrification scenarios (business-as-usual,half and full replacement of fossil fuels by electricity), under varying weather conditions.
total consumption considerably. This shows that heating electrification not only causes
increased power consumption, but also substantially higher weather-based variation in
annual power consumption3.
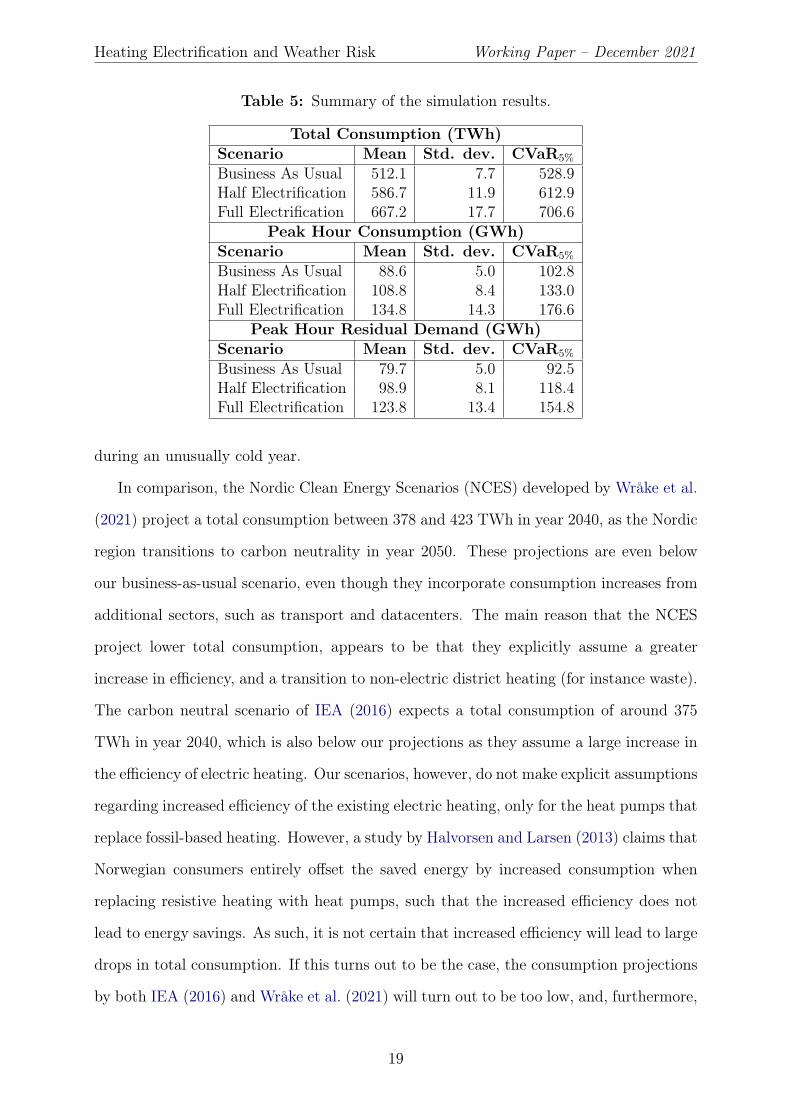
In order to explicitly quantify the impacts of heating electrification, we calculate the
mean, standard deviation, and conditional value-at-risk at the 5% level (CVaR5%) of the
distribution of total annual consumption over all the weather scenarios for each of the
heating electrification scenarios. In this context, the CVaR5% can be interpreted as a
typical one-in-twenty occurrence. Table 5 shows these key indicators.
The mean of the total consumption in the full electrification scenario is around 155
TWh (30%) higher than the business-as-usual (BAU) scenario. The CVaR5% of total
consumption, however, is almost 178 TWh (34%) higher in the full electrification scenario
compared to the BAU scenario. This shows that full heating electrification can cause a
large increase in total power consumption in a normal year, but an even greater increase3The impacts on individual countries in the region are similar, as shown in Appendix B, all of which
show both a right shift and a widening of the probability distributions with increased heating electrifica-tion.
18
Heating Electrification and Weather Risk Working Paper – December 2021
Table 5: Summary of the simulation results.
Total Consumption (TWh)Scenario Mean Std. dev. CVaR5%
Business As Usual 512.1 7.7 528.9Half Electrification 586.7 11.9 612.9Full Electrification 667.2 17.7 706.6
Peak Hour Consumption (GWh)Scenario Mean Std. dev. CVaR5%
Business As Usual 88.6 5.0 102.8Half Electrification 108.8 8.4 133.0Full Electrification 134.8 14.3 176.6
Peak Hour Residual Demand (GWh)Scenario Mean Std. dev. CVaR5%
Business As Usual 79.7 5.0 92.5Half Electrification 98.9 8.1 118.4Full Electrification 123.8 13.4 154.8
during an unusually cold year.
In comparison, the Nordic Clean Energy Scenarios (NCES) developed by Wråke et al.
(2021) project a total consumption between 378 and 423 TWh in year 2040, as the Nordic
region transitions to carbon neutrality in year 2050. These projections are even below
our business-as-usual scenario, even though they incorporate consumption increases from
additional sectors, such as transport and datacenters. The main reason that the NCES
project lower total consumption, appears to be that they explicitly assume a greater
increase in efficiency, and a transition to non-electric district heating (for instance waste).
The carbon neutral scenario of IEA (2016) expects a total consumption of around 375
TWh in year 2040, which is also below our projections as they assume a large increase in
the efficiency of electric heating. Our scenarios, however, do not make explicit assumptions
regarding increased efficiency of the existing electric heating, only for the heat pumps that
replace fossil-based heating. However, a study by Halvorsen and Larsen (2013) claims that
Norwegian consumers entirely offset the saved energy by increased consumption when
replacing resistive heating with heat pumps, such that the increased efficiency does not
lead to energy savings. As such, it is not certain that increased efficiency will lead to large
drops in total consumption. If this turns out to be the case, the consumption projections
by both IEA (2016) and Wråke et al. (2021) will turn out to be too low, and, furthermore,
19
Heating Electrification and Weather Risk Working Paper – December 2021
our electrification scenarios might also underestimate total consumption.
The long-term outlook report by the Norwegian power grid operator Statnett (Stat-
nett, 2020), however, projects a Nordic consumption of 579 TWh in year 2040, which also
includes contributions from the transport sector and datacenters, as well as increased elec-
trification in other sectors. Discounting the transport and datacenter sectors, consumption
is projected at 479 TWh. This is relatively close to the mean of our business-as-usual
scenario at 512.1 TWh, but significantly below our scenarios with heating electrification
– especially for a one-in-twenty year.
Counting both electrification in existing sectors and new power consuming sectors
such as transportation, datacenters, and hydrogen, The Norwegian Water Resources and
Energy Directorate (NVE) projected a total Nordic consumption of about 480 TWh in
year 2040 in their 2020 report (Noregs vassdrags- og energidirektorat (NVE), 2020), but
revised their projections to 526 TWh in their 2021 report (Noregs vassdrags- og energidi-
rektorat (NVE), 2021). These figures are relatively close to our business-as-usual scenario.
However, they include contributions from new sectors that have not been explicitly ac-
counted for in our projections, which simply assume a continuation general trend that
has been observed in the last few decades. Even though the upcoming changes projected
by NVE appear to imply greater consumption increases in the coming decades than has
been experienced in the last few decades, our projections still appear to be higher than
the projections by NVE.
Therefore, our results imply a total consumption that is considerably higher than
previous estimates, especially in the scenarios with heating electrification – and even
more so in a cold year: for a one-in-twenty year in the full electrification scenario, total
consumption is almost 90% above the lowest scenarios by IEA (2016), and still more
than 45% higher than the comparable projection by Statnett (2020). In that sense, it
is possible that heating electrification may present significantly larger challenges for the
Nordic power system than previously believed.
20
Heating Electrification and Weather Risk Working Paper – December 2021
80 100 120 140 160 180GWh
0.00
0.02
0.04
0.06
0.08
BAUHalfFull
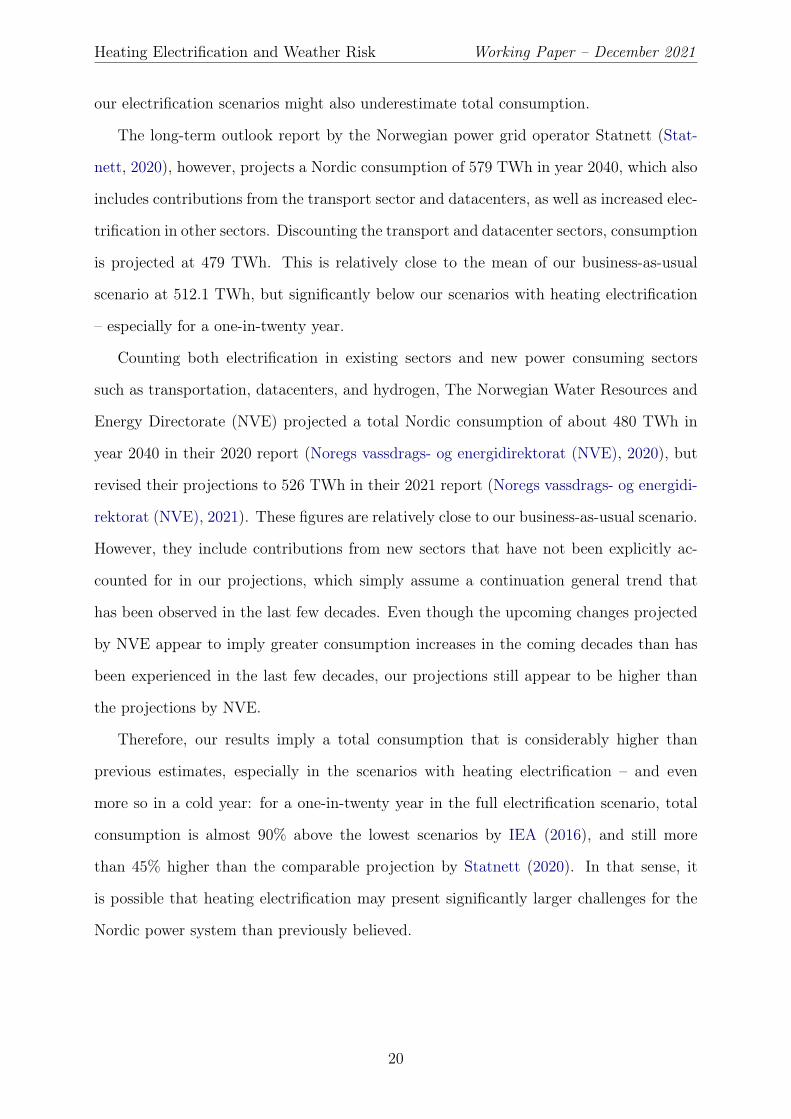
Figure 6: Projected densities of the Nordic electricity consumption in the peak hourin 2040 for the three heating electrification scenarios (business-as-usual, half and fullreplacement of fossil fuels by electricity), under varying weather conditions.
3.3 Peak Consumption and Peak Residual Demand
Peak consumption is a key figure for planning purposes, since the power system must be
designed to withstand peak load. The two central features we observed with total con-
sumption are also present in peak consumption, illustrated in Figure 6: heating electrifi-
cation shifts the distribution to the right, and at the same time widens the distribution.
Full electrification increases the consumption in the peak hour in the Nordic countries
from 88.6 GWh in the BAU scenario to 134.8 GWh in the full electrification scenario,
an increase of about 52%, for a normal weather year. For a one-in-twenty year, however,
the full electrification scenario is almost 72% above the BAU scenario. This shows that
the effects of electrification are even more serious for peak consumption than for total
consumption.
In comparison, Statnett (2020) project a peak load of 95 GW in year 2040, which
is close to the mean of our business-as-usual scenario, but significantly lower than the
electrification scenarios and our estimates for a typical one-in-twenty weather year. This
21

Heating Electrification and Weather Risk Working Paper – December 2021
also implies that the challenges posed by heating electrification may be greater than
previously believed.
Comparing the peak consumption to installed power generation capacity is a simple
and intuitive way to check if it will be possible for the power system to supply the peak
load. Wråke et al. (2021) project an installed power generation capacity between 142 and
161 GW in year 2040, which at first sight appears to be adequate for all but a one-in-
twenty weather year with full heating electrification. Generation capacity projections by
Statnett (2020) are slightly higher, at 175 GW in year 2040.
However, some of the power generation also depends directly on weather conditions
and is not dispatchable – it is not certain that this capacity can be relied on to produce
sufficient power to supply the peak. In the projections by Wråke et al. (2021), installed
capacity drops to about 70 GW if we exclude solar and wind power. Excluding non-
dispatchable capacity from the projections of Statnett (2020) gives a generation capacity
of around 68 GW.
With this in mind, we calculate the residual demand, which is the power consumption
minus solar and wind power generation. The residual demand therefore gives an idea
of how much energy must be produced by generation sources apart from the variable
renewable sources. The distribution of the residual demand in the peak hour is shown in
Figure 7, and some summary statistics are shown in Table 5. The figure shows that the
peak residual demand shares the two main features of total and peak consumption: heating
electrification causes the distribution to shift to the right, and the distribution becomes
significantly wider – higher levels and increased risk. For all three electrification scenarios,
the mean of the peak hour residual demand is about 10 GWh lower than the corresponding
peak hour consumption. That implies that when they are needed the most – in the peak
consumption hour – variable renewable sources are only providing about 12%-13% of their
nameplate capacity. The residual demand must then be supplied by power generation from
other sources. It therefore appears that the projected non-VRE generation capacity of
around 70 GW would be unable to supply the residual demand during the peak hour of
a typical weather year for none of the three electrification scenarios – business-as-usual
22
Heating Electrification and Weather Risk Working Paper – December 2021
80 100 120 140 160GWh
0.00
0.02
0.04
0.06
0.08
0.10BAUHalfFull
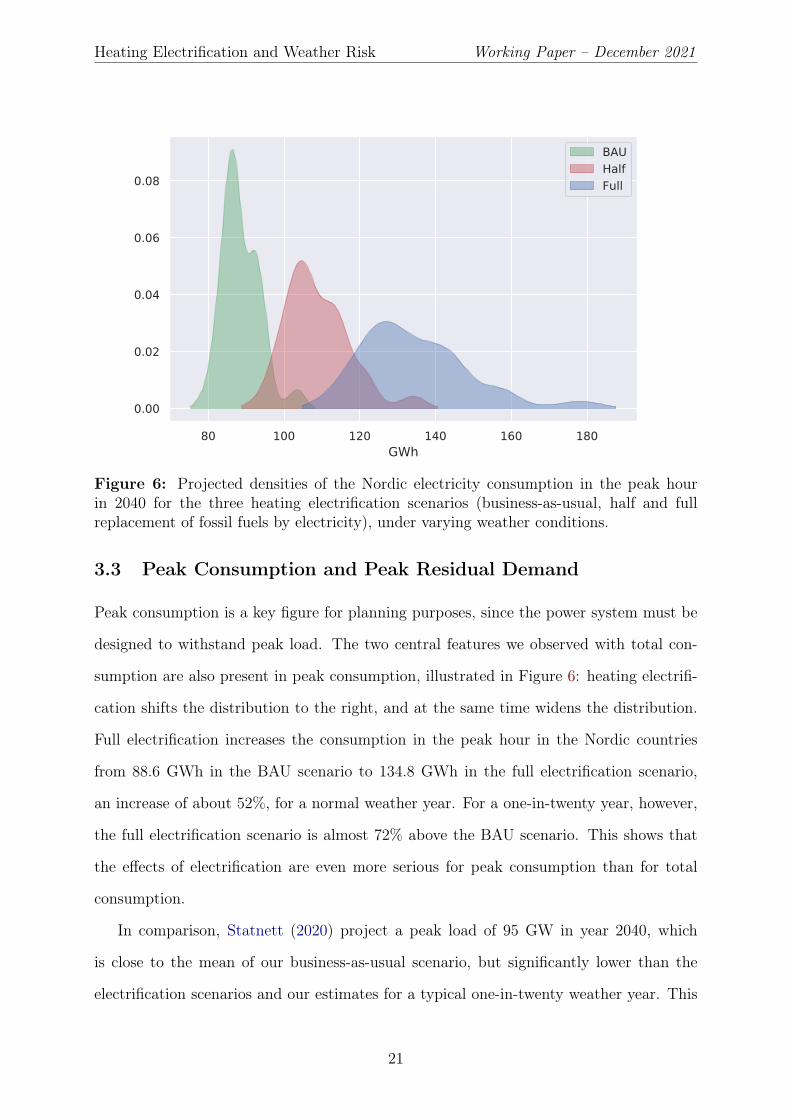
Figure 7: Projected densities of the Nordic residual electricity demand in the peak hourin 2040 for the three electrification scenarios (business-as-usual, half and full replacementof fossil fuels by electricity), under varying weather conditions.
(79.7 GWh), half electrification (98.9 GWh), or full electrification (123.8 GWh).
In addition, when calculating the aggregate peak residual demand in the entire Nordic
region, we have assumed that there are no limitations or losses related to transmission
within the region (“copperplate transmission”). There could be greater variation at the
local level, such that the situations at the local level would likely be more serious if one
were to take transmission constraints and losses into account.
Since projected non-VRE generation capacity would be insufficient to supply the resid-
ual demand during the peak hour, the Nordic countries could perhaps import power from
other countries during these critical periods. Wråke et al. (2021) project an import capac-
ity around 20 GW, bringing the non-VRE supply capacity to around 90 GW, implying
that the system could in principle rely on imports from other countries – but only dur-
ing a fairly typical weather year with lower levels of heating electrification. With full
heating electrification, a one-in-twenty weather year would require 154.8 GWh during the
peak hour, which exceeds the Nordic non-VRE supply capacity projected by Wråke et al.
(2021). This means that the Nordic power system might struggle to ensure a stable and
23
Heating Electrification and Weather Risk Working Paper – December 2021
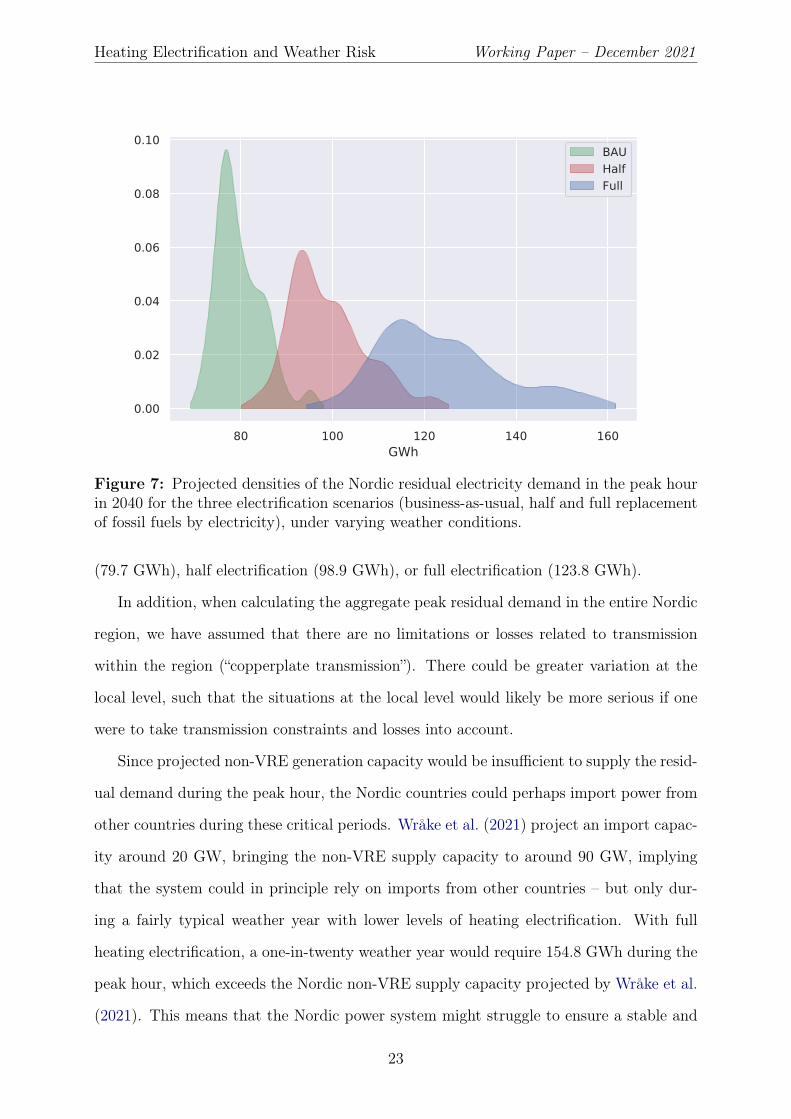
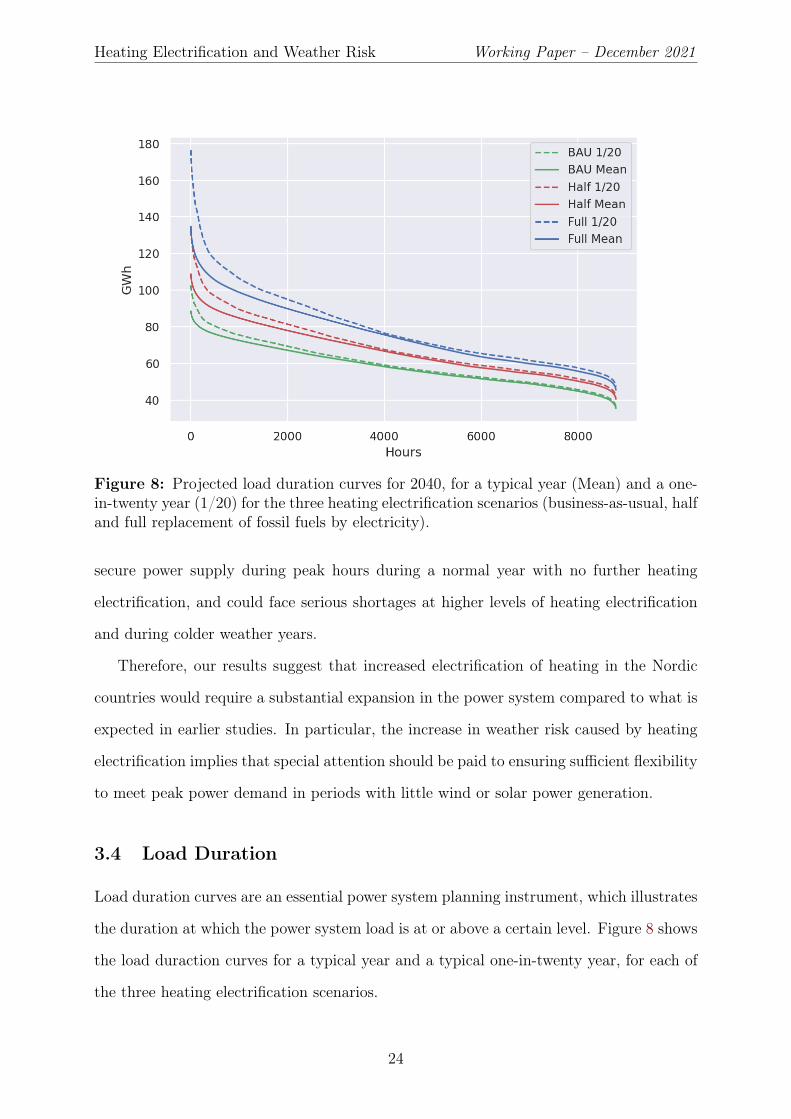
Figure 8: Projected load duration curves for 2040, for a typical year (Mean) and a one-in-twenty year (1/20) for the three heating electrification scenarios (business-as-usual, halfand full replacement of fossil fuels by electricity).
secure power supply during peak hours during a normal year with no further heating
electrification, and could face serious shortages at higher levels of heating electrification
and during colder weather years.
Therefore, our results suggest that increased electrification of heating in the Nordic
countries would require a substantial expansion in the power system compared to what is
expected in earlier studies. In particular, the increase in weather risk caused by heating
electrification implies that special attention should be paid to ensuring sufficient flexibility
to meet peak power demand in periods with little wind or solar power generation.
3.4 Load Duration
Load duration curves are an essential power system planning instrument, which illustrates
the duration at which the power system load is at or above a certain level. Figure 8 shows
the load duraction curves for a typical year and a typical one-in-twenty year, for each of
the three heating electrification scenarios.
24
Heating Electrification and Weather Risk Working Paper – December 2021
We can see from the figure that heating electrification causes the load duration curves
to become much steeper, which implies a far greater variability in the consumption. The
increase in steepness is much more pronounced for the typical one-in-twenty year.
Furthermore, the figure illustrates another serious aspect of the impacts of heating
electrification: the large increase in consumption that we observed in the total annual
consumption is in fact very disproportionally allocated throughout the year: the periods
with already high consumption also receive the largest increase in consumption. As such,
the periods that already experience the highest consumption will experience even higher
consumption, whereas low-consumption periods will experience little change.
This disproportional impact means that the power system will not only need to be
designed to serve a higher peak consumption, but that the power system must be designed
to withstand larger seasonal differences, longer continous periods of high consumption,
and larger consumption variations at every timescale. As such, the insights from this
study may have large consequences for the design of the future Nordic power system.
3.5 Discussion
In our results, we have highlighted the increase in the level, variability, and uncertainty in
Nordic power consumption caused by heating electrification, and we have compared our
results to existing projections for the Nordic power system. This has revealed that exist-
ing projections might have underestimated the impact that heating electrification would
have on the Nordic power system, and suggests that heating electrification must be ac-
companied by large increases in power system flexibility at every timescale. Qualitatively,
these findings mirror many of the conclusions in the existing scientific literature.
By and large, our results are consistent with the findings of Wilson et al. (2013), who
analysed two years of historical gas and power consumption data to show that migrating
even a small proportion of natural gas heating to power in Britain would cause a large
increase in the level, variability, and uncertainty of the power consumption. Staffell
and Pfenninger (2018) also support this conclusion in their projections of UK power
consumption in year 2030, showing increased year-to-year, seasonal and intra-seasonal
25
Heating Electrification and Weather Risk Working Paper – December 2021
variability due to heating electrification. Our results show that electrifying heating would
have similar impacts in the Nordic countries. Quiggin and Buswell (2016) further imply
that several official projections for the UK do not adequately account for the effects
of heating electrification, which may cause balancing issues for the UK power system
in year 2050. Although Watson et al. (2019) believe that Quiggin and Buswell (2016)
overestimate the peaks, they still agree on the main aspects of how heating electrification
will change power consumption in the UK. Similar to Quiggin and Buswell (2016), our
results suggest that the serious impacts of heating electrification on power consumption
may be underestimated in the projections for the Nordic power system in year 2040.
In a study of the power system in Ireland in 2030 with increased electrical heating and
VRE share, Heinen et al. (2017) find that weather would cause considerable variation in
system costs and that cold and windless weather define the most critical periods, which is
consistent with our results. The authors further suggest that pre-heating and the thermal
inertia of buildings could lower the power consumption peaks and, consequently, system
costs. We agree with this point, although our results show that heating electrification
not only increases the peaks, but also increases power consumption for longer durations,
requiring flexibility sources beyond the short term alleviation provided by thermal inertia.
Both Kirkerud et al. (2017) and Ruhnau et al. (2020) find that increased use of elec-
tricity for heating raises the wind market value, considering district heating in Northern
Europe in the former study and heat pumps in the UK in the latter. However, the results
in both studies imply that the wind-driven electric heating is to a large degree mediated
by storage, and not driven directly by wind power generation. In addition, when Chen
et al. (2021) found that electric heat pumps combined with wind power expansion would
be a promising decarbonisation strategy for Northern Europe, they also pointed out that
such a solution would require large increases in power system flexibility. In that light, it
is also not surprising that Haghi et al. (2020) found that heating electrification combined
with an expansion of natural gas power generation would be a cost-effective solution for
reducing emissions in the UK, since natural gas generation is normally relatively flexible
compared to wind power. Thomaßen et al. (2021) argue that some EU27+UK countries –
26
Heating Electrification and Weather Risk Working Paper – December 2021
mainly with warm climates – may already be well prepared for full electrification of heat-
ing, but warn that many others – often characterised by colder climates – currently have
insufficient firm generation capacity for large-scale heating electrification. On the whole,
the results from these studies are consistent with the conclusions of our study: we have
shown that the wind power output in the Nordic countries is relatively low during the
most critical periods, which means that substantial increases in power system flexibility
would be required.
Therefore, our qualitative findings are well established within the context of the exist-
ing scientific literature on heating electrification – even though we have arrived at them
by different means and for a region that has not previously been explicitly considered.
However, comparing our results with existing projections for the Nordic power system
shows that the effects we have identified do not appear to be appropriately incorporated,
and therefore may not haven been sufficiently well established until now. Furthermore,
beyond the qualitative conclusions we have reached, the magnitudes of the effects that
we have presented are also interesting and relevant to planners and policymakers, and
provide a deeper understanding of how heating electrification and VRE expansion will
impact weather risk in the Nordic power system.
3.6 Study Caveats
Given our stylised approach and the fact that we consider a year that is nearly two decades
in the future, it is important that the results of this study are interpreted correctly, and
therefore we discuss some of the main caveats of the study.
Firstly, the structure of power consumption may change in the future compared to the
calibration period of the consumption models. The impacts of the various model elements
are not fixed in reality, but change over time in response to the underlying technological
and social conditions. Policies affecting the calibration period, such as the Norwegian ban
on mineral oil for heating in 2020, might not impact year 2040 – and policies that we have
not yet imagined may have a large impact in 2040. Technological change may also cause
large differences between the calibration period and year 2040. For instance, we have not
27
Heating Electrification and Weather Risk Working Paper – December 2021
explicitly considered how improvements in buildings’ thermal efficiency may affect our
results. Until 2040, older buildings with low thermal efficiency will be replaced with new
buildings, we might see increased adoption of heat pumps, and further improvements in
building techniques – all of which will lower power consumption for heating, and is not
explicitly considered in the historical/statistical power consumption models. However, our
power consumption models do contain a trend variable, so this is only relevant if these
changes occur at a different rate than in the calibration period. New power consuming
sectors such as transportation, datacenters, hydrogen production, and so forth, are also
not explicitly represented in our approach. On the one hand, these sectors may come
to represent a large proportion of power consumption. On the other hand, there is little
historical data available to directly make quantitative estimations about the impacts of
these developments. As such, we have refrained from making explicit assumptions about
such structural developments in order to focus exclusively on heating electrification.
We may also see greater adoption of load-shifting and demand response technologies
in the future, which may reduce consumption in the peak hours. Although this could
contribute greatly to balancing the system in critical periods, such technologies are not
necessarily capable of contributing during sustained periods of high consumption and low
VRE production. Such periods would remain challenging, and further research is needed
on how to address these challenges.
Secondly, we suspect that the resampling method we used for generating the weather
scenarios may not be very well-suited for analysing extreme events, since few or no extreme
events of a particular type may have occurred in the historical dataset. Although Xie
and Hong (2018) have established that the shifted date method is a good choice for
load forecasting purposes, we suspect that simulated weather conditions from numerical
weather prediction models – such as those used by van der Wiel et al. (2019b) – might
actually provide a more comprehensive foundation for risk assessments, although at the
cost of greater complexity.
Thirdly, the possible impacts of climatic change are outside the scope of our study,
but if there are increases in temperature, then heating needs would naturally decrease.
28
Heating Electrification and Weather Risk Working Paper – December 2021
van der Wiel et al. (2019b) have concluded, however, that interannual weather variability
far exceed the impacts of climate change, and we therefore believe that this consideration
would not substantially alter our results.
Finally, generation cost or other system implications have also been outside the scope
of this study. This has allowed us to simplify the consumption models and the renewable
generation capacity projections greatly – as if they were exogenous to the power market.
However, in reality both consumption and capacity investments are endogenously deter-
mined in an interaction with a complex energy market and an even more complex political
and social environment. In particular, persistent high or low prices will affect consumer
behaviour, the development and adoption of different technologies, or investments in dif-
ferent types of generation capacity.
Although the simplifications we have made affect the results of our experiment, they do
not affect the main qualitative conclusions we have drawn: increased heating electrification
in the Nordic countries will lead to a relatively large increase in total power consumption,
and an even larger increase in weather risk due to the increased weather sensitivity,
whereas variable renewable sources seem to contribute little to mitigating the risk. Nor do
we believe that the simplifications invalidate the additional implications we have inferred
from our experiment: if heating is to be electrified, the Nordic power system must not only
be designed to supply a greater total load, but also to endure much larger inter-annual,
seasonal and intra-seasonal variations.
4 Conclusion
We have shown that replacing heating based on fossil fuels with electric heating in the
Nordic countries will result in a considerably higher total power consumption in 2040.
More importantly, however, we have shown that it will lead to greater inter-annual, sea-
sonal and intra-seasonal variability in power consumption, and the increased sensitivity
to weather conditions resulting from the electrification implies an increased exposure
weather risk. Compared to existing power system projections, our calculations suggest
that both the magnitude of the consumption increase caused by heating electrification
29
Heating Electrification and Weather Risk Working Paper – December 2021
and the increase in weather risk may previously have been underestimated. As such, a
large expansion in power system flexibility will be necessary if heating is electrified in
the Nordic countries. Although variable renewable generation capacity is projected to
increase substantially in the future, these sources appear to contribute little during the
periods of the highest consumption, which underlines the importance of ensuring sufficient
flexibility in the power system.
Given these considerations, we suggest that future research focuses on determining how
the Nordic power system can be developed to provide sufficient flexbility to handle the
changes we have identified. Such an analysis would ideally consider multiple competing
sources of flexibility, both on the demand side and the supply side, and use techniques
that could appropriately account for variability, uncertainty, and contingency in a realistic
manner.
This research is fundamental for designing a robust and resilient energy system that
accounts for the increased weather risk in power consumption and production, while at
the same time contributing to reduced greenhouse gas emissions.
References
Baringo, L., Conejo, A., 2013. Correlated wind-power production and electric load
scenarios for investment decisions. Applied Energy 101, 475–482. doi:10.1016/j.
apenergy.2012.06.002.
Bell, W.P., Wild, P., Foster, J., Hewson, M., 2015. Wind speed and electricity demand
correlation analysis in the Australian National Electricity Market: Determining wind
turbine generators’ ability to meet electricity demand without energy storage. Economic
Analysis and Policy 48, 182–191. doi:10.1016/j.eap.2015.11.009.
Bett, P.E., Thornton, H.E., 2016. The climatological relationships between wind and solar
energy supply in Britain. Renewable Energy 87, 96–110. doi:10.1016/j.renene.
2015.10.006.
30
Heating Electrification and Weather Risk Working Paper – December 2021
Birkedal, M., Bolkesjø, T.F., 2016. Determinants of Regulated Hydropower Supply in
Norway. Energy Procedia 87, 11–18. doi:10.1016/j.egypro.2015.12.352.
Bremen, L.V., 2010. Large-Scale Variability of Weather Dependent Renewable En-
ergy Sources, in: Troccoli, A. (Ed.), Management of Weather and Climate Risk in
the Energy Industry. Springer Netherlands, Dordrecht, pp. 189–206. doi:10.1007/
978-90-481-3692-6_13.
Canales, F.A., Jurasz, J., Beluco, A., Kies, A., 2020. Assessing temporal complementarity
between three variable energy sources through correlation and compromise program-
ming. Energy 192, 116637. doi:10.1016/j.energy.2019.116637.
Castillejo-Cuberos, A., Escobar, R., 2020. Understanding solar resource variability: An
in-depth analysis, using Chile as a case of study. Renewable and Sustainable Energy
Reviews 120, 109664. doi:10.1016/j.rser.2019.109664.
Chen, Y.k., Jensen, I.G., Kirkerud, J.G., Bolkesjø, T.F., 2021. Impact of fossil-free de-
centralized heating on northern European renewable energy deployment and the power
system. Energy 219, 119576. doi:10.1016/j.energy.2020.119576.
Coker, P., Barlow, J., Cockerill, T., Shipworth, D., 2013. Measuring significant variability
characteristics: An assessment of three UK renewables. Renewable Energy 53, 111–120.
doi:10.1016/j.renene.2012.11.013.
Coughlin, K., Murthi, A., Eto, J., 2014. Multi-scale analysis of wind power and load
time series data. Renewable Energy 68, 494–504. doi:10.1016/j.renene.2014.
02.011.
Dryar, H.A., 1944. The Effect of Weather on the System Load. AIEE Transactions 63,
1006–1013.
Engeland, K., Borga, M., Creutin, J.D., François, B., Ramos, M.H., Vidal, J.P.,
2017. Space-time variability of climate variables and intermittent renewable electric-
ity production – A review. Renewable and Sustainable Energy Reviews 79, 600–617.
doi:10.1016/j.rser.2017.05.046.
31
Heating Electrification and Weather Risk Working Paper – December 2021
Fan, J.L., Hu, J.W., Zhang, X., 2019. Impacts of climate change on electricity demand
in China: An empirical estimation based on panel data. Energy 170, 880–888. doi:10.
1016/j.energy.2018.12.044.
Fisher, F.M., Kaysen, C., 1962. A Study in Econometrics: The Demand for Electricity in
the United States. volume 27 of Contributions to Economic Analysis. North-Holland
Publishing Company.
Fleiter, T., Steinbach, J., Ragwitz, M., Dengler, J., Köhler, B., Reitze, F., Tuille, F.,
Hartner, M., Kranzl, L., Forthuber, S., Reiter, U., 2016. Mapping and Analyses of
the Current and Future (2020-2030) Heating/Cooling Fuel Deployment (Fossil/Renew-
ables). Technical Report. European Commission, Directorate-General for Energy.
Foley, A.M., Leahy, P.G., Marvuglia, A., McKeogh, E.J., 2012. Current methods and
advances in forecasting of wind power generation. Renewable Energy 37, 1–8. doi:10.
1016/j.renene.2011.05.033.
Garrido-Perez, J.M., Ordóñez, C., Barriopedro, D., García-Herrera, R., Paredes, D., 2020.
Impact of weather regimes on wind power variability in western Europe. Applied Energy
264, 114731. doi:10.1016/j.apenergy.2020.114731.
Grams, C.M., Beerli, R., Pfenninger, S., Staffell, I., Wernli, H., 2017. Balancing Europe’s
wind-power output through spatial deployment informed by weather regimes. Nature
Climate Change 7, 557–562. doi:10.1038/nclimate3338.
Haghi, E., Qadrdan, M., Wu, J., Jenkins, N., Fowler, M., Raahemifar, K., 2020. An
iterative approach for optimal decarbonization of electricity and heat supply systems
in the Great Britain. Energy 201, 117611. doi:10.1016/j.energy.2020.117611.
Halvorsen, B., Larsen, B.M., 2013. Hvem eier varmepumpe og hva gjør det med strøm-
forbruket? Økonomiske Analyser 2, 21–27.
Halvorsen, R., 1975. Residential Demand for Electric Energy. The Review of Economics
and Statistics 57, 12. doi:10.2307/1937858.
32
Heating Electrification and Weather Risk Working Paper – December 2021
Heide, D., von Bremen, L., Greiner, M., Hoffmann, C., Speckmann, M., Bofinger, S., 2010.
Seasonal optimal mix of wind and solar power in a future, highly renewable Europe.
Renewable Energy 35, 2483–2489. doi:10.1016/j.renene.2010.03.012.
Heinemann, G.T., Nordman, D.A., Plant, E.C., 1966. The Relationship Between Summer
Weather and Summer Loads - A Regression Analysis. IEEE TRANSACTIONS ON
POWER APPARATUS AND SYSTEMS , 11.
Heinen, S., Turner, W., Cradden, L., McDermott, F., O’Malley, M., 2017. Elec-
trification of residential space heating considering coincidental weather events and
building thermal inertia: A system-wide planning analysis. Energy 127, 136–154.
doi:10.1016/j.energy.2017.03.102.
Hersbach, H., Bell, H., Berrisford, P., Biavati, G., Horányi, A., Muñoz Sabater, J., Nico-
las, J., Peubey, C., Radu, R., Rozum, I., Schepers, D., Simmons, A., Soci, C., Dee,
D., Thépaut, J.N., 2018. ERA5 hourly data on single levels from 1979 to present.
Copernicus Climate Change Service (C3S) Climate Data Store (CDS). (Accessed on
20-OCT-2021), 10.24381/cds.adbb2d47.
Hor, C.L., Watson, S.J., Majithia, S., 2005. Analyzing the impact of weather variables
on monthly electricity demand. IEEE Transactions on Power Systems 20, 2078–2085.
doi:10.1109/TPWRS.2005.857397.
Hyndman, R.J., Fan, S., 2010. Density Forecasting for Long-Term Peak Electricity De-
mand. IEEE Transactions on Power Systems 25, 1142–1153. doi:10.1109/TPWRS.
2009.2036017.
IEA, 2016. Nordic Energy Technology Perspectives. Technical Report. International
Energy Agency.
Jerez, S., Trigo, R., Sarsa, A., Lorente-Plazas, R., Pozo-Vázquez, D., Montávez, J., 2013.
Spatio-temporal Complementarity between Solar and Wind Power in the Iberian Penin-
sula. Energy Procedia 40, 48–57. doi:10.1016/j.egypro.2013.08.007.
33
Heating Electrification and Weather Risk Working Paper – December 2021
Kaunda, C.S., Kimambo, C.Z., Nielsen, T.K., 2012. Hydropower in the Context of Sus-
tainable Energy Supply: A Review of Technologies and Challenges. ISRN Renewable
Energy 2012, 1–15. doi:10.5402/2012/730631.
Kirkerud, J.G., Bolkesjø, T.F., Trømborg, E., 2017. Power-to-heat as a flexibility measure
for integration of renewable energy. Energy 128, 776–784. doi:10.1016/j.energy.
2017.03.153.
Kiviluoma, J., Holttinen, H., Weir, D., Scharff, R., Söder, L., Menemenlis, N., Cutululis,
N.A., Danti Lopez, I., Lannoye, E., Estanqueiro, A., Gomez-Lazaro, E., Zhang, Q., Bai,
J., Wan, Y.H., Milligan, M., 2016. Variability in large-scale wind power generation:
Variability in large-scale wind power generation. Wind Energy 19, 1649–1665. doi:10.
1002/we.1942.
Leahy, P., Foley, A., 2012. Wind generation output during cold weather-driven electricity
demand peaks in Ireland. Energy 39, 48–53. doi:10.1016/j.energy.2011.07.
013.
McSharry, P., Bouwman, S., Bloemhof, G., 2005. Probabilistic Forecasts of the Magnitude
and Timing of Peak Electricity Demand. IEEE Transactions on Power Systems 20,
1166–1172. doi:10.1109/TPWRS.2005.846071.
Mideksa, T.K., Kallbekken, S., 2010. The impact of climate change on the electricity
market: A review. Energy Policy 38, 3579–3585. doi:10.1016/j.enpol.2010.02.
035.
Miglietta, M.M., Huld, T., Monforti-Ferrario, F., 2017. Local Complementarity of Wind
and Solar Energy Resources over Europe: An Assessment Study from a Meteorological
Perspective. Journal of Applied Meteorology and Climatology 56, 217–234. doi:10.
1175/JAMC-D-16-0031.1.
Noregs vassdrags- og energidirektorat (NVE), 2020. Langsiktig Kraftmarkedsanalyse
2020-2040. Long-Term Market Outlook. Noregs vassdrags- og energidirektorat (NVE).
34
Heating Electrification and Weather Risk Working Paper – December 2021
Noregs vassdrags- og energidirektorat (NVE), 2021. Langsiktig Kraftmarkedsanalyse
2021-2040. Long-Term Market Outlook. Noregs vassdrags- og energidirektorat (NVE).
OECD, 2018. Real GDP long-term forecast. doi:10.1787/d927bc18-en.
Parkpoom, S., Harrison, G.P., Bialek, J.W., 2004. Climate Change Impacts on Electricity
Demand, in: Proc. of the 39th UPEC, p. 6.
Pfenninger, S., Staffell, I., 2016. Long-term patterns of European PV output using 30
years of validated hourly reanalysis and satellite data. Energy 114, 1251–1265. doi:10.
1016/j.energy.2016.08.060.
Quayle, R.G., Diaz, H.F., 1980. Heating Degree Day Data Applied to Residential Heating
Energy Consumption. Journal of Applied Meteorology 19, 241–246. doi:10.1175/
1520-0450(1980)019<0241:HDDDAT>2.0.CO;2.
Quiggin, D., Buswell, R., 2016. The implications of heat electrification on national electri-
cal supply-demand balance under published 2050 energy scenarios. Energy 98, 253–270.
doi:10.1016/j.energy.2015.11.060.
Ramsebner, J., Linares, P., Haas, R., 2021. Estimating storage needs for renewables in
Europe: The correlation between renewable energy sources and heating and cooling
demand. Smart Energy , 100038doi:10.1016/j.segy.2021.100038.
Rodriguez, A.M.B., Trotter, I.M., 2019. Climate change scenarios for Paraguayan power
demand 2017–2050. Climatic Change doi:10.1007/s10584-019-02470-1.
Ruhnau, O., Hirth, L., Praktiknjo, A., 2020. Heating with wind: Economics of heat
pumps and variable renewables. Energy Economics 92, 104967. doi:10.1016/j.
eneco.2020.104967.
Sakamoto, S., Nagai, Y., Sugiyama, M., Fujimori, S., Kato, E., Komiyama, R., Mat-
suo, Y., Oshiro, K., Silva Herran, D., 2021. Demand-side decarbonization and elec-
trification: EMF 35 JMIP study. Sustainability Science 16, 395–410. doi:10.1007/
s11625-021-00935-w.
35
Heating Electrification and Weather Risk Working Paper – December 2021
Sanjari, M.J., Gooi, H.B., 2017. Probabilistic Forecast of PV Power Generation Based
on Higher Order Markov Chain. IEEE Transactions on Power Systems 32, 2942–2952.
doi:10.1109/TPWRS.2016.2616902.
Selya, A.S., Rose, J.S., Dierker, L.C., Hedeker, D., Mermelstein, R.J., 2012. A Practical
Guide to Calculating Cohen’s f2, a Measure of Local Effect Size, from PROC MIXED.
Frontiers in Psychology 3. doi:10.3389/fpsyg.2012.00111.
Sheikh, I., Callaway, D., 2019. Decarbonizing Space and Water Heating in Temper-
ate Climates: The Case for Electrification. Atmosphere 10, 435. doi:10.3390/
atmos10080435.
Shi, J., Lee, W.J., Liu, Y., Yang, Y., Wang, P., 2012. Forecasting Power Output
of Photovoltaic Systems Based on Weather Classification and Support Vector Ma-
chines. IEEE Transactions on Industry Applications 48, 1064–1069. doi:10.1109/
TIA.2012.2190816.
Siala, K., Chowdhury, A.K., Dang, T.D., Galelli, S., 2021. Solar energy and regional
coordination as a feasible alternative to large hydropower in Southeast Asia. Nature
Communications 12, 4159. doi:10.1038/s41467-021-24437-6.
Sideratos, G., Hatziargyriou, N.D., 2012. Probabilistic Wind Power Forecasting Using
Radial Basis Function Neural Networks. IEEE Transactions on Power Systems 27,
1788–1796. doi:10.1109/TPWRS.2012.2187803.
Silva, S., Soares, I., Pinho, C., 2020. Climate change impacts on electricity demand: The
case of a Southern European country. Utilities Policy 67, 101115. doi:10.1016/j.
jup.2020.101115.
Sinden, G., 2007. Characteristics of the UK wind resource: Long-term patterns and rela-
tionship to electricity demand. Energy Policy 35, 112–127. doi:10.1016/j.enpol.
2005.10.003.
Solomon, A., Kammen, D.M., Callaway, D., 2016. Investigating the impact of wind–solar
36
Heating Electrification and Weather Risk Working Paper – December 2021
complementarities on energy storage requirement and the corresponding supply relia-
bility criteria. Applied Energy 168, 130–145. doi:10.1016/j.apenergy.2016.01.
070.
Staffell, I., Pfenninger, S., 2018. The increasing impact of weather on electricity supply
and demand. Energy 145, 65–78. doi:10.1016/j.energy.2017.12.051.
Statnett, 2020. Langsiktig Markedsanalyse: Norden Og Europa 2020-2050. Technical
Report. Statnett.
Suomalainen, K., Pritchard, G., Sharp, B., Yuan, Z., Zakeri, G., 2015. Correlation anal-
ysis on wind and hydro resources with electricity demand and prices in New Zealand.
Applied Energy 137, 445–462. doi:10.1016/j.apenergy.2014.10.015.
Tastu, J., Pinson, P., Trombe, P.J., Madsen, H., 2014. Probabilistic Forecasts of Wind
Power Generation Accounting for Geographically Dispersed Information. IEEE Trans-
actions on Smart Grid 5, 480–489. doi:10.1109/TSG.2013.2277585.
Thom, H.C.S., 1954. The Rational Relationship Between Heating Degree Days and
Temperature. Monthly Weather Review 82, 1–6. doi:10.1175/1520-0493(1954)
082<0001:TRRBHD>2.0.CO;2.
Thomaßen, G., Kavvadias, K., Jiménez Navarro, J.P., 2021. The decarbonisation of the
EU heating sector through electrification: A parametric analysis. Energy Policy 148,
111929. doi:10.1016/j.enpol.2020.111929.
Thornton, H.E., Scaife, A.A., Hoskins, B.J., Brayshaw, D.J., 2017. The relationship
between wind power, electricity demand and winter weather patterns in Great Britain.
Environmental Research Letters 12, 064017. doi:10.1088/1748-9326/aa69c6.
Tobin, I., Greuell, W., Jerez, S., Ludwig, F., Vautard, R., van Vliet, M.T.H., Bréon, F.M.,
2018. Vulnerabilities and resilience of European power generation to 1.5 °C, 2 °C and 3
°C warming. Environmental Research Letters 13, 044024. doi:10.1088/1748-9326/
aab211.
37
Heating Electrification and Weather Risk Working Paper – December 2021
Tobin, I., Vautard, R., Balog, I., Bréon, F.M., Jerez, S., Ruti, P.M., Thais, F., Vrac,
M., Yiou, P., 2015. Assessing climate change impacts on European wind energy
from ENSEMBLES high-resolution climate projections. Climatic Change 128, 99–112.
doi:10.1007/s10584-014-1291-0.
Trotter, I.M., Bolkesjø, T.F., Féres, J.G., Hollanda, L., 2016. Climate change and elec-
tricity demand in Brazil: A stochastic approach. Energy 102, 596–604. doi:10.1016/
j.energy.2016.02.120.
van der Wiel, K., Bloomfield, H.C., Lee, R.W., Stoop, L.P., Blackport, R., Screen, J.A.,
Selten, F.M., 2019a. The influence of weather regimes on European renewable energy
production and demand. Environmental Research Letters 14, 094010. doi:10.1088/
1748-9326/ab38d3.
van der Wiel, K., Stoop, L., van Zuijlen, B., Blackport, R., van den Broek, M., Selten,
F., 2019b. Meteorological conditions leading to extreme low variable renewable energy
production and extreme high energy shortfall. Renewable and Sustainable Energy
Reviews 111, 261–275. doi:10.1016/j.rser.2019.04.065.
Veall, M.R., 1987. Boostrapping the Probability Distribution of Peak Electricity Demand.
International Economic Review 28, 203. doi:10.2307/2526867.
Veldman, E., Gibescu, M., Slootweg, H., Kling, W.L., 2011. Impact of electrification
of residential heating on loading of distribution networks, in: 2011 IEEE Trondheim
PowerTech, IEEE, Trondheim. pp. 1–7. doi:10.1109/PTC.2011.6019179.
Wang, H.z., Li, G.q., Wang, G.b., Peng, J.c., Jiang, H., Liu, Y.t., 2017. Deep learning
based ensemble approach for probabilistic wind power forecasting. Applied Energy 188,
56–70. doi:10.1016/j.apenergy.2016.11.111.
Watson, S., Lomas, K., Buswell, R., 2019. Decarbonising domestic heating: What is the
peak GB demand? Energy Policy 126, 533–544. doi:10.1016/j.enpol.2018.11.
001.
38
Heating Electrification and Weather Risk Working Paper – December 2021
Widen, J., 2011. Correlations Between Large-Scale Solar and Wind Power in a Future
Scenario for Sweden. IEEE Transactions on Sustainable Energy 2, 177–184. doi:10.
1109/TSTE.2010.2101620.
Widén, J., Carpman, N., Castellucci, V., Lingfors, D., Olauson, J., Remouit, F.,
Bergkvist, M., Grabbe, M., Waters, R., 2015. Variability assessment and forecast-
ing of renewables: A review for solar, wind, wave and tidal resources. Renewable and
Sustainable Energy Reviews 44, 356–375. doi:10.1016/j.rser.2014.12.019.
Wild, M., Folini, D., Henschel, F., Fischer, N., Müller, B., 2015. Projections of long-term
changes in solar radiation based on CMIP5 climate models and their influence on energy
yields of photovoltaic systems. Solar Energy 116, 12–24. doi:10.1016/j.solener.
2015.03.039.
Wilson, I.G., Rennie, A.J., Ding, Y., Eames, P.C., Hall, P.J., Kelly, N.J., 2013. Historical
daily gas and electrical energy flows through Great Britain’s transmission networks and
the decarbonisation of domestic heat. Energy Policy 61, 301–305. doi:10.1016/j.
enpol.2013.05.110.
Wråke, M., Karlsson, K., Kofoed-Wiuff, A., Folsland Bolkesjø, T., Lindroos, T.J., Hag-
berg, M., Bosack Simonsen, M., Unger, T., Tennback, B., Ogner Jåstad, E., Lehtilä,
A., Putkonen, N., Koljonen, T., 2021. Nordic Clean Energy Scenarios: Solutions for
Carbon Neutrality. Nordic Energy Research. doi:10.6027/NER2021-01.
Xie, J., Hong, T., 2018. Temperature Scenario Generation for Probabilistic Load Fore-
casting. IEEE Transactions on Smart Grid 9, 1680–1687. doi:10.1109/TSG.2016.
2597178.
39
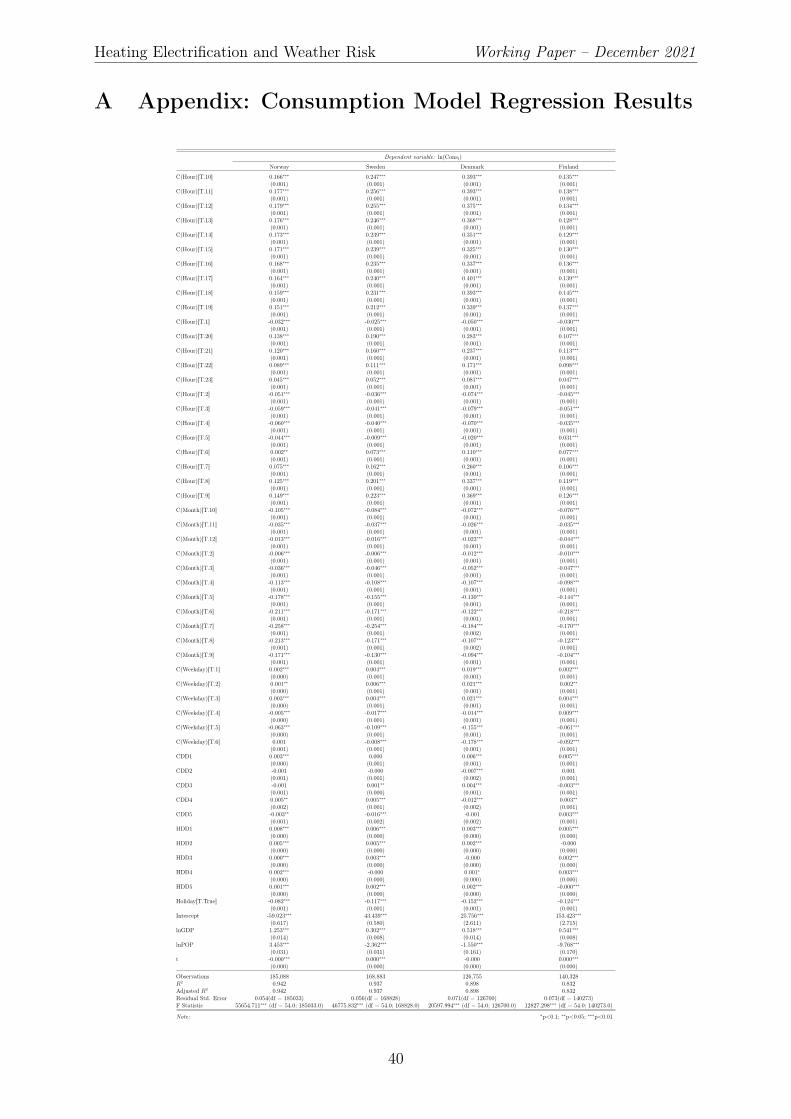
Heating Electrification and Weather Risk Working Paper – December 2021
A Appendix: Consumption Model Regression Results
Dependent variable: ln(Const)
Norway Sweden Denmark Finland
C(Hour)[T.10] 0.166∗∗∗ 0.247∗∗∗ 0.393∗∗∗ 0.135∗∗∗(0.001) (0.001) (0.001) (0.001)
C(Hour)[T.11] 0.177∗∗∗ 0.256∗∗∗ 0.393∗∗∗ 0.138∗∗∗(0.001) (0.001) (0.001) (0.001)
C(Hour)[T.12] 0.179∗∗∗ 0.255∗∗∗ 0.375∗∗∗ 0.134∗∗∗(0.001) (0.001) (0.001) (0.001)
C(Hour)[T.13] 0.176∗∗∗ 0.246∗∗∗ 0.368∗∗∗ 0.128∗∗∗(0.001) (0.001) (0.001) (0.001)
C(Hour)[T.14] 0.173∗∗∗ 0.239∗∗∗ 0.351∗∗∗ 0.129∗∗∗(0.001) (0.001) (0.001) (0.001)
C(Hour)[T.15] 0.171∗∗∗ 0.239∗∗∗ 0.325∗∗∗ 0.130∗∗∗(0.001) (0.001) (0.001) (0.001)
C(Hour)[T.16] 0.168∗∗∗ 0.235∗∗∗ 0.337∗∗∗ 0.136∗∗∗(0.001) (0.001) (0.001) (0.001)
C(Hour)[T.17] 0.164∗∗∗ 0.240∗∗∗ 0.401∗∗∗ 0.139∗∗∗(0.001) (0.001) (0.001) (0.001)
C(Hour)[T.18] 0.159∗∗∗ 0.231∗∗∗ 0.393∗∗∗ 0.145∗∗∗(0.001) (0.001) (0.001) (0.001)
C(Hour)[T.19] 0.151∗∗∗ 0.212∗∗∗ 0.339∗∗∗ 0.137∗∗∗(0.001) (0.001) (0.001) (0.001)
C(Hour)[T.1] -0.032∗∗∗ -0.025∗∗∗ -0.050∗∗∗ -0.030∗∗∗(0.001) (0.001) (0.001) (0.001)
C(Hour)[T.20] 0.138∗∗∗ 0.190∗∗∗ 0.283∗∗∗ 0.107∗∗∗(0.001) (0.001) (0.001) (0.001)
C(Hour)[T.21] 0.120∗∗∗ 0.160∗∗∗ 0.237∗∗∗ 0.113∗∗∗(0.001) (0.001) (0.001) (0.001)
C(Hour)[T.22] 0.089∗∗∗ 0.111∗∗∗ 0.171∗∗∗ 0.098∗∗∗(0.001) (0.001) (0.001) (0.001)
C(Hour)[T.23] 0.045∗∗∗ 0.052∗∗∗ 0.081∗∗∗ 0.047∗∗∗(0.001) (0.001) (0.001) (0.001)
C(Hour)[T.2] -0.051∗∗∗ -0.036∗∗∗ -0.074∗∗∗ -0.045∗∗∗(0.001) (0.001) (0.001) (0.001)
C(Hour)[T.3] -0.059∗∗∗ -0.041∗∗∗ -0.079∗∗∗ -0.051∗∗∗(0.001) (0.001) (0.001) (0.001)
C(Hour)[T.4] -0.060∗∗∗ -0.040∗∗∗ -0.070∗∗∗ -0.035∗∗∗(0.001) (0.001) (0.001) (0.001)
C(Hour)[T.5] -0.044∗∗∗ -0.009∗∗∗ -0.020∗∗∗ 0.031∗∗∗(0.001) (0.001) (0.001) (0.001)
C(Hour)[T.6] 0.002∗∗ 0.073∗∗∗ 0.110∗∗∗ 0.077∗∗∗(0.001) (0.001) (0.001) (0.001)
C(Hour)[T.7] 0.075∗∗∗ 0.162∗∗∗ 0.260∗∗∗ 0.106∗∗∗(0.001) (0.001) (0.001) (0.001)
C(Hour)[T.8] 0.125∗∗∗ 0.201∗∗∗ 0.337∗∗∗ 0.119∗∗∗(0.001) (0.001) (0.001) (0.001)
C(Hour)[T.9] 0.149∗∗∗ 0.223∗∗∗ 0.369∗∗∗ 0.126∗∗∗(0.001) (0.001) (0.001) (0.001)
C(Month)[T.10] -0.105∗∗∗ -0.084∗∗∗ -0.072∗∗∗ -0.076∗∗∗(0.001) (0.001) (0.001) (0.001)
C(Month)[T.11] -0.035∗∗∗ -0.037∗∗∗ -0.026∗∗∗ -0.035∗∗∗(0.001) (0.001) (0.001) (0.001)
C(Month)[T.12] -0.013∗∗∗ -0.016∗∗∗ -0.023∗∗∗ -0.044∗∗∗(0.001) (0.001) (0.001) (0.001)
C(Month)[T.2] -0.006∗∗∗ -0.006∗∗∗ -0.012∗∗∗ -0.010∗∗∗(0.001) (0.001) (0.001) (0.001)
C(Month)[T.3] -0.036∗∗∗ -0.046∗∗∗ -0.052∗∗∗ -0.047∗∗∗(0.001) (0.001) (0.001) (0.001)
C(Month)[T.4] -0.113∗∗∗ -0.108∗∗∗ -0.107∗∗∗ -0.098∗∗∗(0.001) (0.001) (0.001) (0.001)
C(Month)[T.5] -0.178∗∗∗ -0.155∗∗∗ -0.130∗∗∗ -0.144∗∗∗(0.001) (0.001) (0.001) (0.001)
C(Month)[T.6] -0.211∗∗∗ -0.171∗∗∗ -0.122∗∗∗ -0.218∗∗∗(0.001) (0.001) (0.001) (0.001)
C(Month)[T.7] -0.258∗∗∗ -0.254∗∗∗ -0.184∗∗∗ -0.170∗∗∗(0.001) (0.001) (0.002) (0.001)
C(Month)[T.8] -0.213∗∗∗ -0.171∗∗∗ -0.107∗∗∗ -0.123∗∗∗(0.001) (0.001) (0.002) (0.001)
C(Month)[T.9] -0.171∗∗∗ -0.130∗∗∗ -0.094∗∗∗ -0.104∗∗∗(0.001) (0.001) (0.001) (0.001)
C(Weekday)[T.1] 0.002∗∗∗ 0.004∗∗∗ 0.019∗∗∗ 0.002∗∗∗(0.000) (0.001) (0.001) (0.001)
C(Weekday)[T.2] 0.001∗∗ 0.006∗∗∗ 0.021∗∗∗ 0.002∗∗(0.000) (0.001) (0.001) (0.001)
C(Weekday)[T.3] 0.003∗∗∗ 0.004∗∗∗ 0.021∗∗∗ 0.004∗∗∗(0.000) (0.001) (0.001) (0.001)
C(Weekday)[T.4] -0.005∗∗∗ -0.017∗∗∗ -0.014∗∗∗ 0.009∗∗∗(0.000) (0.001) (0.001) (0.001)
C(Weekday)[T.5] -0.063∗∗∗ -0.109∗∗∗ -0.155∗∗∗ -0.061∗∗∗(0.000) (0.001) (0.001) (0.001)
C(Weekday)[T.6] 0.001 -0.008∗∗∗ -0.178∗∗∗ -0.092∗∗∗(0.001) (0.001) (0.001) (0.001)
CDD1 0.003∗∗∗ 0.000 0.006∗∗∗ 0.005∗∗∗(0.000) (0.001) (0.001) (0.001)
CDD2 -0.001 -0.000 -0.007∗∗∗ 0.001(0.001) (0.001) (0.002) (0.001)
CDD3 -0.001 0.001∗∗ 0.004∗∗∗ -0.003∗∗∗(0.001) (0.000) (0.001) (0.001)
CDD4 0.005∗∗ 0.005∗∗∗ -0.012∗∗∗ 0.003∗∗(0.002) (0.001) (0.002) (0.001)
CDD5 -0.003∗∗ -0.016∗∗∗ -0.001 0.003∗∗∗(0.001) (0.002) (0.002) (0.001)
HDD1 0.008∗∗∗ 0.006∗∗∗ 0.003∗∗∗ 0.005∗∗∗(0.000) (0.000) (0.000) (0.000)
HDD2 0.005∗∗∗ 0.005∗∗∗ 0.002∗∗∗ -0.000(0.000) (0.000) (0.000) (0.000)
HDD3 0.000∗∗∗ 0.003∗∗∗ -0.000 0.002∗∗∗(0.000) (0.000) (0.000) (0.000)
HDD4 0.002∗∗∗ -0.000 0.001∗ 0.003∗∗∗(0.000) (0.000) (0.000) (0.000)
HDD5 0.001∗∗∗ 0.002∗∗∗ 0.002∗∗∗ -0.000∗∗∗(0.000) (0.000) (0.000) (0.000)
Holiday[T.True] -0.082∗∗∗ -0.117∗∗∗ -0.152∗∗∗ -0.124∗∗∗(0.001) (0.001) (0.001) (0.001)
Intercept -59.023∗∗∗ 43.439∗∗∗ 25.756∗∗∗ 153.423∗∗∗(0.617) (0.580) (2.611) (2.715)
lnGDP 1.253∗∗∗ 0.302∗∗∗ 0.518∗∗∗ 0.541∗∗∗(0.014) (0.008) (0.014) (0.008)
lnPOP 3.453∗∗∗ -2.362∗∗∗ -1.550∗∗∗ -9.768∗∗∗(0.031) (0.031) (0.161) (0.170)
t -0.000∗∗∗ 0.000∗∗∗ -0.000 0.000∗∗∗(0.000) (0.000) (0.000) (0.000)
Observations 185,088 168,883 126,755 140,328R2 0.942 0.937 0.898 0.832Adjusted R2 0.942 0.937 0.898 0.832Residual Std. Error 0.054(df = 185033) 0.056(df = 168828) 0.071(df = 126700) 0.073(df = 140273)F Statistic 55654.711∗∗∗ (df = 54.0; 185033.0) 46775.832∗∗∗ (df = 54.0; 168828.0) 20597.994∗∗∗ (df = 54.0; 126700.0) 12827.298∗∗∗ (df = 54.0; 140273.0)
Note: ∗p<0.1; ∗∗p<0.05; ∗∗∗p<0.01
40
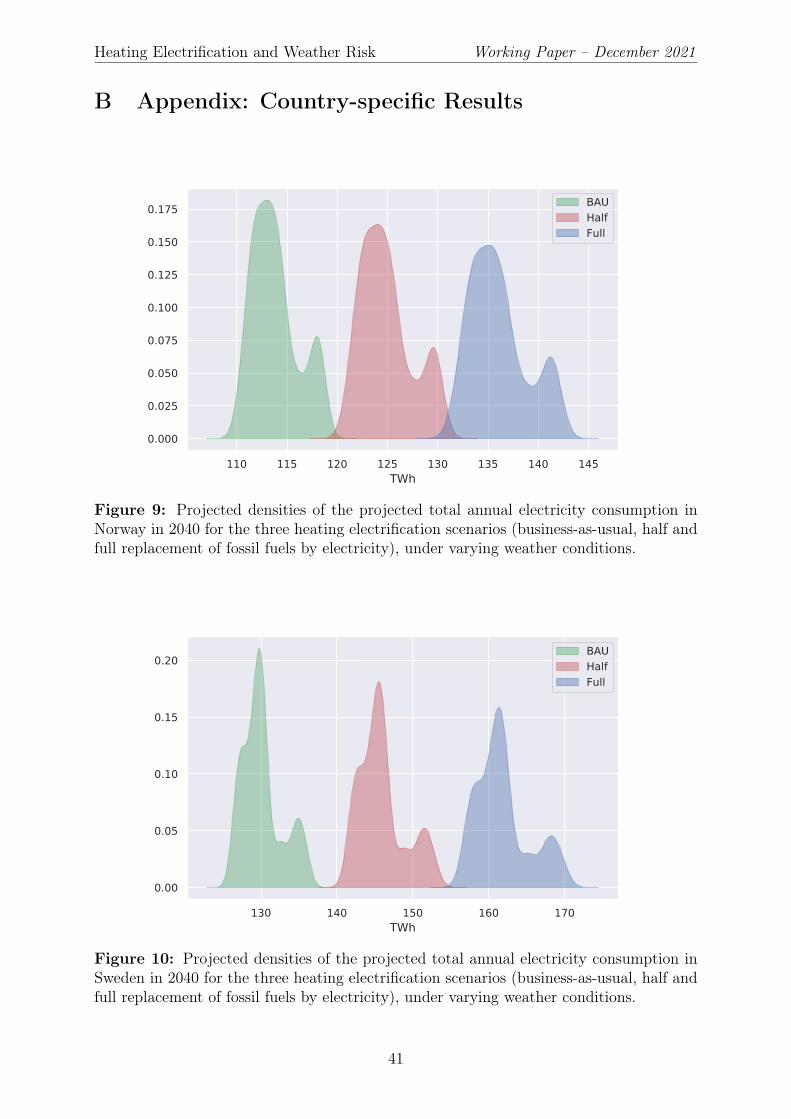
Heating Electrification and Weather Risk Working Paper – December 2021
B Appendix: Country-specific Results
110 115 120 125 130 135 140 145TWh
0.000
0.025
0.050
0.075
0.100
0.125
0.150
0.175 BAUHalfFull
Figure 9: Projected densities of the projected total annual electricity consumption inNorway in 2040 for the three heating electrification scenarios (business-as-usual, half andfull replacement of fossil fuels by electricity), under varying weather conditions.
130 140 150 160 170TWh
0.00
0.05
0.10
0.15
0.20BAUHalfFull
Figure 10: Projected densities of the projected total annual electricity consumption inSweden in 2040 for the three heating electrification scenarios (business-as-usual, half andfull replacement of fossil fuels by electricity), under varying weather conditions.
41

Heating Electrification and Weather Risk Working Paper – December 2021
40 50 60 70 80TWh
0.00
0.25
0.50
0.75
1.00
1.25
1.50
1.75BAUHalfFull
Figure 11: Projected densities of the projected total annual electricity consumption inDenmark in 2040 for the three heating electrification scenarios (business-as-usual, halfand full replacement of fossil fuels by electricity), under varying weather conditions.
220 240 260 280 300 320TWh
0.00
0.02
0.04
0.06
0.08
0.10
0.12
0.14
0.16 BAUHalfFull
Figure 12: Projected densities of the projected total annual electricity consumption inFinland in 2040 for the three heating electrification scenarios (business-as-usual, half andfull replacement of fossil fuels by electricity), under varying weather conditions.
42

Heating Electrification and Weather Risk Working Paper – December 2021
Table 6: Summary of the projected total consumption for 2040 for the three heatingelectrification scenarios.
Business-As-Usual ScenarioCountry Mean (TWh) Std. dev. (TWh) CVaR95% (TWh)Norway 113.9 2.3 118.4Sweden 130.1 2.6 135.7Denmark 37.1 0.3 37.6Finland 231.0 2.7 237.2Nordic 512.1 7.7 528.9
Half Electrification ScenarioCountry Mean (TWh) Std. dev. (TWh) CVaR95% (TWh)Norway 124.9 2.5 130.0Sweden 146.0 3.0 152.5Denmark 52.0 1.5 54.8Finland 263.9 5.1 275.6Nordic 586.7 11.9 612.9
Full Electrification ScenarioCountry Mean (TWh) Std. dev. (TWh) CVaR95% (TWh)Norway 136.1 2.8 141.8Sweden 161.9 3.4 169.4Denmark 70.1 3.7 77.2Finland 299.2 8.1 318.3Nordic 667.2 17.7 706.6
18 20 22 24 26 28 30 32GWh
0.00
0.05
0.10
0.15
0.20
0.25
0.30
0.35 BAUHalfFull
Figure 13: Projected densities of the Norwegian electricity consumption in the peakhour in 2040 for the three heating electrification scenarios (business-as-usual, half and fullreplacement of fossil fuels by electricity), under varying weather conditions.
43
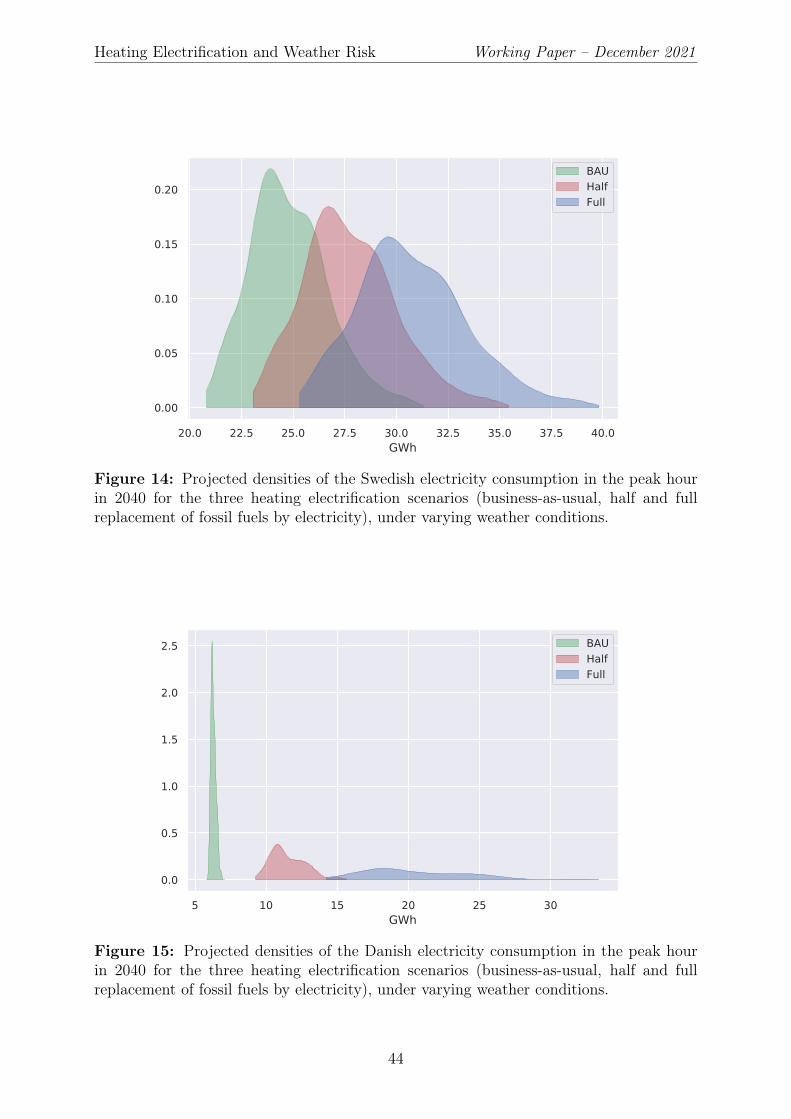
Heating Electrification and Weather Risk Working Paper – December 2021
20.0 22.5 25.0 27.5 30.0 32.5 35.0 37.5 40.0GWh
0.00
0.05
0.10
0.15
0.20BAUHalfFull
Figure 14: Projected densities of the Swedish electricity consumption in the peak hourin 2040 for the three heating electrification scenarios (business-as-usual, half and fullreplacement of fossil fuels by electricity), under varying weather conditions.
5 10 15 20 25 30GWh
0.0
0.5
1.0
1.5
2.0
2.5 BAUHalfFull
Figure 15: Projected densities of the Danish electricity consumption in the peak hourin 2040 for the three heating electrification scenarios (business-as-usual, half and fullreplacement of fossil fuels by electricity), under varying weather conditions.
44
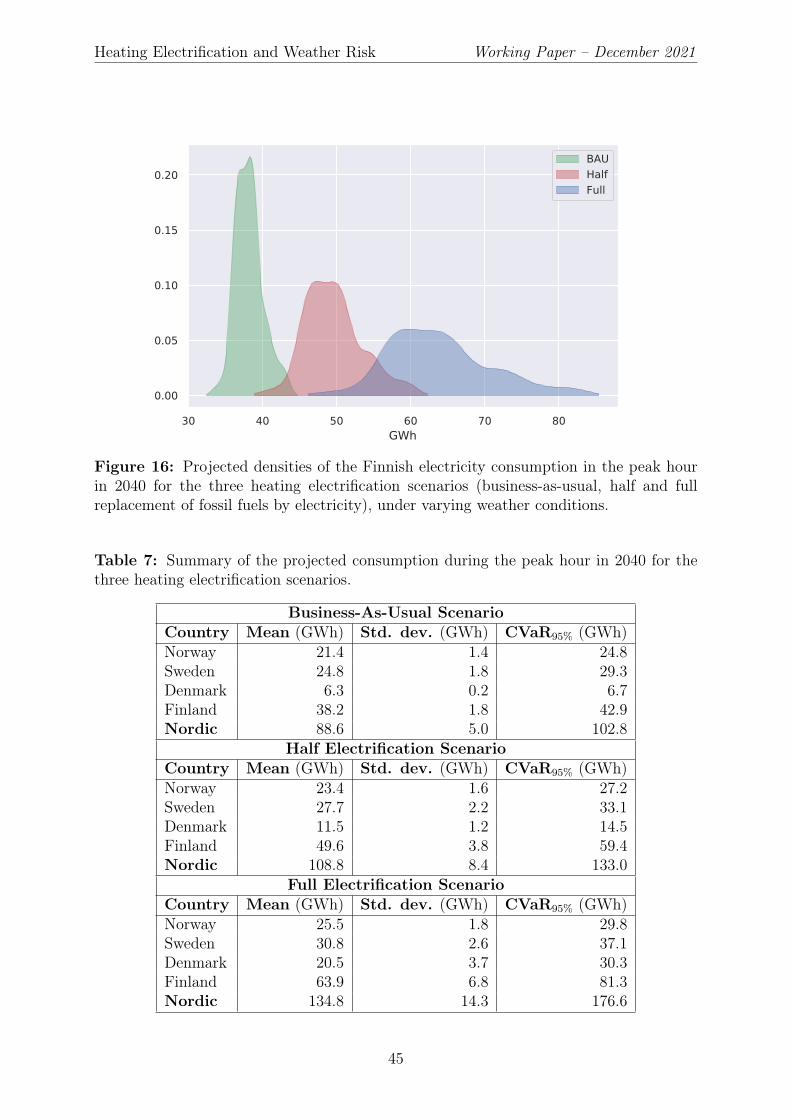
Heating Electrification and Weather Risk Working Paper – December 2021
30 40 50 60 70 80GWh
0.00
0.05
0.10
0.15
0.20BAUHalfFull
Figure 16: Projected densities of the Finnish electricity consumption in the peak hourin 2040 for the three heating electrification scenarios (business-as-usual, half and fullreplacement of fossil fuels by electricity), under varying weather conditions.
Table 7: Summary of the projected consumption during the peak hour in 2040 for thethree heating electrification scenarios.
Business-As-Usual ScenarioCountry Mean (GWh) Std. dev. (GWh) CVaR95% (GWh)Norway 21.4 1.4 24.8Sweden 24.8 1.8 29.3Denmark 6.3 0.2 6.7Finland 38.2 1.8 42.9Nordic 88.6 5.0 102.8
Half Electrification ScenarioCountry Mean (GWh) Std. dev. (GWh) CVaR95% (GWh)Norway 23.4 1.6 27.2Sweden 27.7 2.2 33.1Denmark 11.5 1.2 14.5Finland 49.6 3.8 59.4Nordic 108.8 8.4 133.0
Full Electrification ScenarioCountry Mean (GWh) Std. dev. (GWh) CVaR95% (GWh)Norway 25.5 1.8 29.8Sweden 30.8 2.6 37.1Denmark 20.5 3.7 30.3Finland 63.9 6.8 81.3Nordic 134.8 14.3 176.6
45

Heating Electrification and Weather Risk Working Paper – December 2021
18 20 22 24 26 28 30GWh
0.00
0.05
0.10
0.15
0.20
0.25
0.30
0.35
0.40 BAUHalfFull
Figure 17: Projected densities of the Norwegian residual electricity demand in thepeak hour in 2040 for the three electrification scenarios (business-as-usual, half and fullreplacement of fossil fuels by electricity), under varying weather conditions.
20.0 22.5 25.0 27.5 30.0 32.5 35.0GWh
0.00
0.05
0.10
0.15
0.20BAUHalfFull
Figure 18: Projected densities of the Swedish residual electricity demand in the peakhour in 2040 for the three electrification scenarios (business-as-usual, half and full replace-ment of fossil fuels by electricity), under varying weather conditions.
46
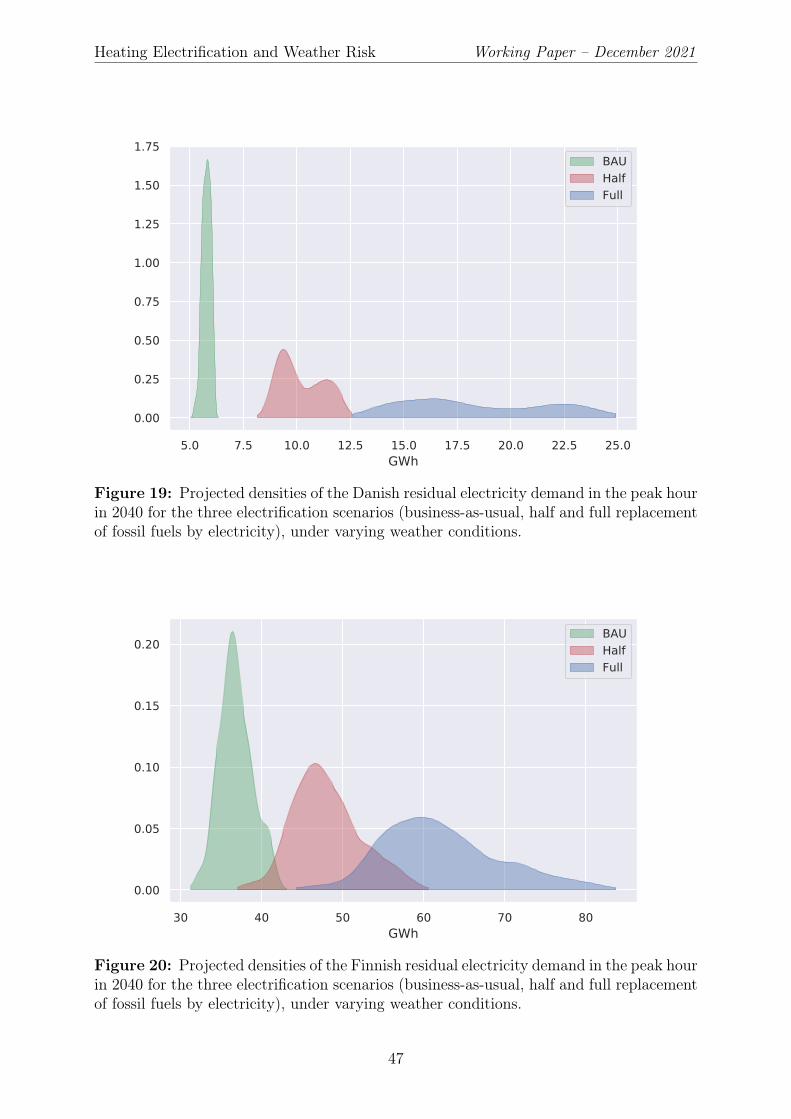
Heating Electrification and Weather Risk Working Paper – December 2021
5.0 7.5 10.0 12.5 15.0 17.5 20.0 22.5 25.0GWh
0.00
0.25
0.50
0.75
1.00
1.25
1.50
1.75BAUHalfFull
Figure 19: Projected densities of the Danish residual electricity demand in the peak hourin 2040 for the three electrification scenarios (business-as-usual, half and full replacementof fossil fuels by electricity), under varying weather conditions.
30 40 50 60 70 80GWh
0.00
0.05
0.10
0.15
0.20BAUHalfFull
Figure 20: Projected densities of the Finnish residual electricity demand in the peak hourin 2040 for the three electrification scenarios (business-as-usual, half and full replacementof fossil fuels by electricity), under varying weather conditions.
47
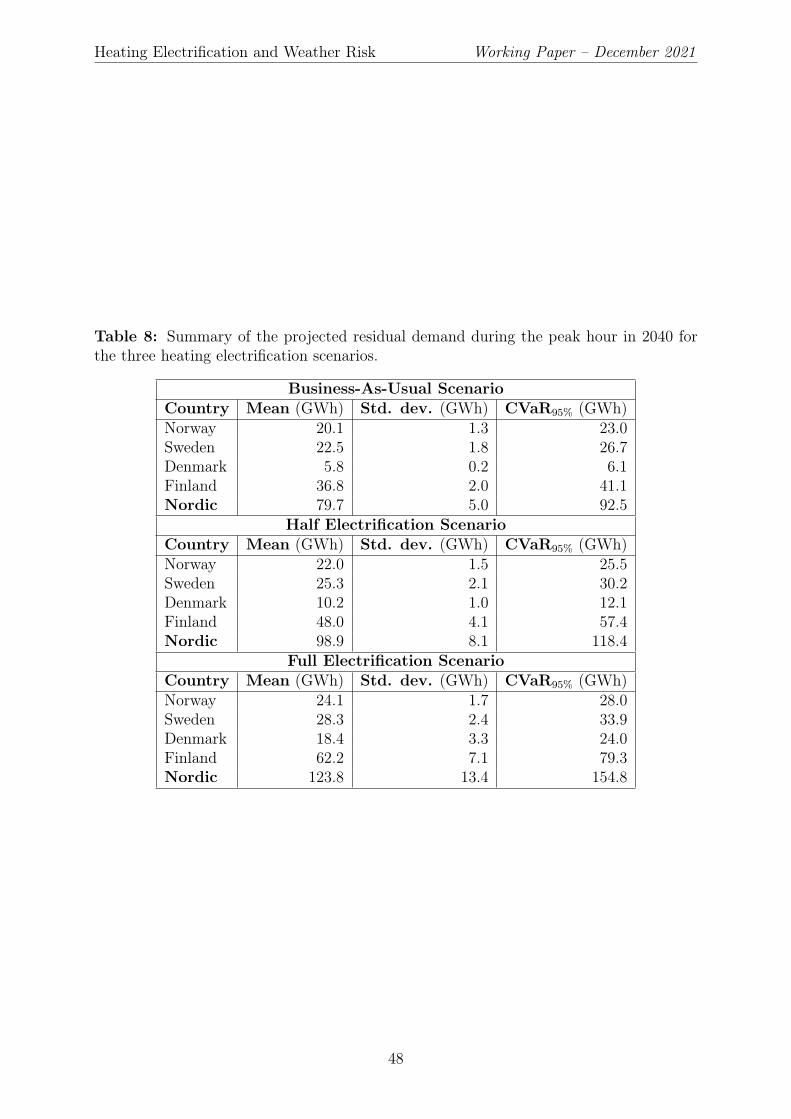
Heating Electrification and Weather Risk Working Paper – December 2021
Table 8: Summary of the projected residual demand during the peak hour in 2040 forthe three heating electrification scenarios.
Business-As-Usual ScenarioCountry Mean (GWh) Std. dev. (GWh) CVaR95% (GWh)Norway 20.1 1.3 23.0Sweden 22.5 1.8 26.7Denmark 5.8 0.2 6.1Finland 36.8 2.0 41.1Nordic 79.7 5.0 92.5
Half Electrification ScenarioCountry Mean (GWh) Std. dev. (GWh) CVaR95% (GWh)Norway 22.0 1.5 25.5Sweden 25.3 2.1 30.2Denmark 10.2 1.0 12.1Finland 48.0 4.1 57.4Nordic 98.9 8.1 118.4
Full Electrification ScenarioCountry Mean (GWh) Std. dev. (GWh) CVaR95% (GWh)Norway 24.1 1.7 28.0Sweden 28.3 2.4 33.9Denmark 18.4 3.3 24.0Finland 62.2 7.1 79.3Nordic 123.8 13.4 154.8
48
Related Documents