Increased Cortical Thickness in a Frontoparietal Network in Social Anxiety Disorder Annette Beatrix Br € uuhl, 1 * J € urgen H€ anggi, 2 Volker Baur, 2,3 Michael Rufer, 3 Aba Delsignore, 3 Steffi Weidt, 3 Lutz J€ ancke, 2 and Uwe Herwig 1,4 1 Department of Psychiatry, Psychotherapy and Psychosomatics, University Hospital for Psychiatry Z€ urich, Zurich, Switzerland 2 Division of Neuropsychology, Institute of Psychology, University of Zurich, Zurich, Switzerland 3 Department of Psychiatry and Psychotherapy, University Hospital Zurich, Zurich, Switzerland 4 Department of Psychiatry and Psychotherapy, University of Ulm, Ulm, Germany r r Abstract: Social anxiety disorder (SAD) is the second leading anxiety disorder. On the functional neu- robiological level, specific brain regions involved in the processing of anxiety-laden stimuli and in emotion regulation have been shown to be hyperactive and hyper-responsive in SAD such as amyg- dala, insula and orbito- and prefrontal cortex. On the level of brain structure, prior studies on anatomi- cal differences in SAD resulted in mixed and partially contradictory findings. Based on previous functional and anatomical models of SAD, this study examined cortical thickness in structural mag- netic resonance imaging data of 46 patients with SAD without comorbidities (except for depressed epi- sode in one patient) compared with 46 matched healthy controls in a region of interest-analysis and in whole-brain. In a theory-driven ROI-analysis, cortical thickness was increased in SAD in left insula, right anterior cingulate and right temporal pole. Furthermore, the whole-brain analysis revealed increased thickness in right dorsolateral prefrontal and right parietal cortex. This study detected no regions of decreased cortical thickness or brain volume in SAD. From the perspective of brain net- works, these findings are in line with prior functional differences in salience networks and frontoparie- tal networks associated with executive-controlling and attentional functions. Hum Brain Mapp 00:000– 000, 2013. V C 2013 Wiley Periodicals, Inc. Key words: dorsal attention network; emotion processing; amygdale; hippocampus; DLPFC; anxiety disorders; MRI; anatomy; insula; anterior cingulate r r Additional Supporting Information may be found in the online version of this article. Contract grant sponsor: Swiss National Science Foundation (SNSF); Contract grant number: 32003B_120518 *Correspondence to: Annette B. Br€ uhl, University Hospital of Psy- chiatry Zurich, Lenggstrasse 31, CH-8032 Z€ urich, Switzerland. E-mail: [email protected] Received for publication 21 March 2013; Revised 10 July 2013; Accepted 15 July 2013. DOI 10.1002/hbm.22378 Published online 00 Month 2013 in Wiley Online Library (wileyonlinelibrary.com). r Human Brain Mapping 00:00–00 (2013) r V C 2013 Wiley Periodicals, Inc.

Welcome message from author
This document is posted to help you gain knowledge. Please leave a comment to let me know what you think about it! Share it to your friends and learn new things together.
Transcript
Increased Cortical Thickness in a FrontoparietalNetwork in Social Anxiety Disorder
Annette Beatrix Br€uuhl,1* J€urgen H€anggi,2 Volker Baur,2,3 Michael Rufer,3
Aba Delsignore,3 Steffi Weidt,3 Lutz J€ancke,2 and Uwe Herwig1,4
1Department of Psychiatry, Psychotherapy and Psychosomatics, University Hospital forPsychiatry Z€urich, Zurich, Switzerland
2Division of Neuropsychology, Institute of Psychology, University of Zurich, Zurich,Switzerland
3Department of Psychiatry and Psychotherapy, University Hospital Zurich, Zurich,Switzerland
4Department of Psychiatry and Psychotherapy, University of Ulm, Ulm, Germany
r r
Abstract: Social anxiety disorder (SAD) is the second leading anxiety disorder. On the functional neu-robiological level, specific brain regions involved in the processing of anxiety-laden stimuli and inemotion regulation have been shown to be hyperactive and hyper-responsive in SAD such as amyg-dala, insula and orbito- and prefrontal cortex. On the level of brain structure, prior studies on anatomi-cal differences in SAD resulted in mixed and partially contradictory findings. Based on previousfunctional and anatomical models of SAD, this study examined cortical thickness in structural mag-netic resonance imaging data of 46 patients with SAD without comorbidities (except for depressed epi-sode in one patient) compared with 46 matched healthy controls in a region of interest-analysis and inwhole-brain. In a theory-driven ROI-analysis, cortical thickness was increased in SAD in left insula,right anterior cingulate and right temporal pole. Furthermore, the whole-brain analysis revealedincreased thickness in right dorsolateral prefrontal and right parietal cortex. This study detected noregions of decreased cortical thickness or brain volume in SAD. From the perspective of brain net-works, these findings are in line with prior functional differences in salience networks and frontoparie-tal networks associated with executive-controlling and attentional functions. Hum Brain Mapp 00:000–000, 2013. VC 2013 Wiley Periodicals, Inc.
Key words: dorsal attention network; emotion processing; amygdale; hippocampus; DLPFC; anxietydisorders; MRI; anatomy; insula; anterior cingulate
r r
Additional Supporting Information may be found in the onlineversion of this article.
Contract grant sponsor: Swiss National Science Foundation(SNSF); Contract grant number: 32003B_120518
*Correspondence to: Annette B. Br€uhl, University Hospital of Psy-chiatry Zurich, Lenggstrasse 31, CH-8032 Z€urich, Switzerland.E-mail: [email protected]
Received for publication 21 March 2013; Revised 10 July 2013;Accepted 15 July 2013.
DOI 10.1002/hbm.22378Published online 00 Month 2013 in Wiley Online Library(wileyonlinelibrary.com).
r Human Brain Mapping 00:00–00 (2013) r
VC 2013 Wiley Periodicals, Inc.
INTRODUCTION
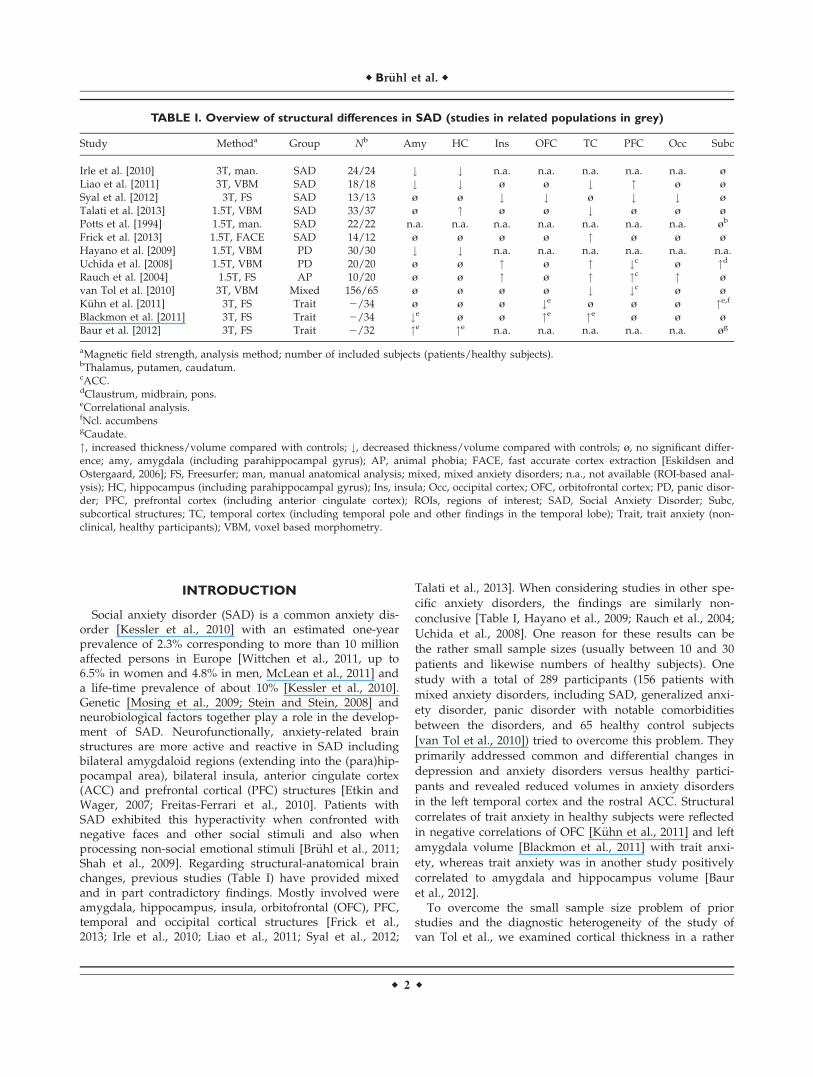
Social anxiety disorder (SAD) is a common anxiety dis-order [Kessler et al., 2010] with an estimated one-yearprevalence of 2.3% corresponding to more than 10 millionaffected persons in Europe [Wittchen et al., 2011, up to6.5% in women and 4.8% in men, McLean et al., 2011] anda life-time prevalence of about 10% [Kessler et al., 2010].Genetic [Mosing et al., 2009; Stein and Stein, 2008] andneurobiological factors together play a role in the develop-ment of SAD. Neurofunctionally, anxiety-related brainstructures are more active and reactive in SAD includingbilateral amygdaloid regions (extending into the (para)hip-pocampal area), bilateral insula, anterior cingulate cortex(ACC) and prefrontal cortical (PFC) structures [Etkin andWager, 2007; Freitas-Ferrari et al., 2010]. Patients withSAD exhibited this hyperactivity when confronted withnegative faces and other social stimuli and also whenprocessing non-social emotional stimuli [Br€uhl et al., 2011;Shah et al., 2009]. Regarding structural-anatomical brainchanges, previous studies (Table I) have provided mixedand in part contradictory findings. Mostly involved wereamygdala, hippocampus, insula, orbitofrontal (OFC), PFC,temporal and occipital cortical structures [Frick et al.,2013; Irle et al., 2010; Liao et al., 2011; Syal et al., 2012;
Talati et al., 2013]. When considering studies in other spe-
cific anxiety disorders, the findings are similarly non-
conclusive [Table I, Hayano et al., 2009; Rauch et al., 2004;
Uchida et al., 2008]. One reason for these results can be
the rather small sample sizes (usually between 10 and 30
patients and likewise numbers of healthy subjects). One
study with a total of 289 participants (156 patients with
mixed anxiety disorders, including SAD, generalized anxi-
ety disorder, panic disorder with notable comorbidities
between the disorders, and 65 healthy control subjects
[van Tol et al., 2010]) tried to overcome this problem. They
primarily addressed common and differential changes in
depression and anxiety disorders versus healthy partici-
pants and revealed reduced volumes in anxiety disorders
in the left temporal cortex and the rostral ACC. Structural
correlates of trait anxiety in healthy subjects were reflected
in negative correlations of OFC [K€uhn et al., 2011] and left
amygdala volume [Blackmon et al., 2011] with trait anxi-
ety, whereas trait anxiety was in another study positively
correlated to amygdala and hippocampus volume [Baur
et al., 2012].To overcome the small sample size problem of prior
studies and the diagnostic heterogeneity of the study ofvan Tol et al., we examined cortical thickness in a rather
TABLE I. Overview of structural differences in SAD (studies in related populations in grey)
Study Methoda Group Nb Amy HC Ins OFC TC PFC Occ Subc
Irle et al. [2010] 3T, man. SAD 24/24 # # n.a. n.a. n.a. n.a. n.a. �Liao et al. [2011] 3T, VBM SAD 18/18 # # � � # " � �Syal et al. [2012] 3T, FS SAD 13/13 � � # # � # # �Talati et al. [2013] 1.5T, VBM SAD 33/37 � " � � # � � �Potts et al. [1994] 1.5T, man. SAD 22/22 n.a. n.a. n.a. n.a. n.a. n.a. n.a. �b
Frick et al. [2013] 1.5T, FACE SAD 14/12 � � � � " � � �Hayano et al. [2009] 1.5T, VBM PD 30/30 # # n.a. n.a. n.a. n.a. n.a. n.a.Uchida et al. [2008] 1.5T, VBM PD 20/20 � � " � " #c � "d
Rauch et al. [2004] 1.5T, FS AP 10/20 � � " � " "c " �van Tol et al. [2010] 3T, VBM Mixed 156/65 � � � � # #c � �K€uhn et al. [2011] 3T, FS Trait 2/34 � � � #e � � � "e,f
Blackmon et al. [2011] 3T, FS Trait 2/34 #e � � "e "e � � �Baur et al. [2012] 3T, FS Trait 2/32 "e "e n.a. n.a. n.a. n.a. n.a. �g
aMagnetic field strength, analysis method; number of included subjects (patients/healthy subjects).bThalamus, putamen, caudatum.cACC.dClaustrum, midbrain, pons.eCorrelational analysis.fNcl. accumbensgCaudate.", increased thickness/volume compared with controls; #, decreased thickness/volume compared with controls; �, no significant differ-ence; amy, amygdala (including parahippocampal gyrus); AP, animal phobia; FACE, fast accurate cortex extraction [Eskildsen andOstergaard, 2006]; FS, Freesurfer; man, manual anatomical analysis; mixed, mixed anxiety disorders; n.a., not available (ROI-based anal-ysis); HC, hippocampus (including parahippocampal gyrus); Ins, insula; Occ, occipital cortex; OFC, orbitofrontal cortex; PD, panic disor-der; PFC, prefrontal cortex (including anterior cingulate cortex); ROIs, regions of interest; SAD, Social Anxiety Disorder; Subc,subcortical structures; TC, temporal cortex (including temporal pole and other findings in the temporal lobe); Trait, trait anxiety (non-clinical, healthy participants); VBM, voxel based morphometry.
r Br€uhl et al. r
r 2 r

large sample of patients suffering from SAD (withoutcomorbid axis I-disorders) compared with healthy partici-pants. Our analysis focused on anatomically defined bilat-eral regions of interest (ROIs) derived from the priorstudies, comprising amygdala, hippocampus and adjacentparahippocampal gyrus, anterior insula, ACC, OFC, fusi-form gyrus (FFG), superior temporal gyrus and temporalpole. In addition, we computed a whole-brain vertex-wiseanalysis to search for differences besides these theory-based predefined ROIs.
MATERIALS AND METHODS
Subjects
Participants were 50 outpatients with the current diag-nosis of generalized SAD. In four patients, anatomical datawere not analysable due to technical reasons (artefacts/defects in data). The remaining 46 patients were matchedwith 46 healthy control subjects (HCS) in terms of age andgender (see Table II). All participants were right-handed(Annett handedness questionnaire [Annett, 1970]). Theyhad completed at least regular scholar education andshowed no manifest cognitive impairments. Patients wererecruited from the outpatient clinic at the Department ofPsychiatry and Psychotherapy of the University HospitalZurich before starting a group cognitive behavior therapy(CBT) for SAD. Prior psychological treatment (except forCBT) was not used as an exclusion criterion, because theongoing symptoms and distress were severe enough forthe patients to seek treatment again, pointing to a lack ofsuccess of the prior treatment. Healthy subjects wererecruited via email-lists and personal contact. In a clinicalinterview made by an experienced psychiatrist (A.B.B.)current and previous mental and neurological disorderswere excluded. General anxiety level was measured in allsubjects with the State-Trait Anxiety Inventory (STAI, Ger-man version [Laux et al., 1981]). Social anxiety wasassessed with the Social Phobia Scale and Social Interac-tion Anxiety Scale (SPS and SIAS, German version [Stan-gier et al., 1999]) and the Liebowitz Social Anxiety Scale
(LSAS, German version) [Stangier and Heidenreich, 2005],concomitant depressiveness was assessed with Beck’sDepression Inventory (BDI, German version) [Hautzingeret al., 1995]. Diagnoses of SAD and comorbid axis I-diagnoses were made clinically by experienced psychia-trists and psychologists (MR, SW, and AD). Furthermore,the Mini-International Neuropsychiatric Interview forDSM-IV (M.I.N.I., German Version) [Ackenheil et al., 1999]was applied for confirmation. One patient fulfilled criteriafor current depressive episode; SAD, however, was theprimary diagnosis. All other patients had no axis I-comorbidities and had no history of psychiatric and neuro-logical disorders and head trauma. Exclusion criteria forall participants were pregnancy, excessive consummationof alcohol (>10 units/week), cigarettes (>2 packs/day),and caffeine (>10 cups/day), contraindications againstmagnetic resonance imaging (MRI). Control subjects werefree of medication (except oral contraceptives) as deter-mined in a semi-structured clinical interview according toDSM-IV.
Nineteen patients were taking antidepressant medication(selective serotonin reuptake inhibitors, selective sero-tonin/norepinephrine- reuptake inhibitors, mirtazapine,clomipramine, trazodone). The dosage was stable in allpatients for at least four weeks prior examination accord-ing to the preinclusion interview. After complete descrip-tion of the study, written informed consent was obtained.The study was approved by the local ethics committeeand was conducted according to the Declaration ofHelsinki.
Image Acquisition
MRI scans were acquired on a 3.0 T GE Signa HD Scan-ner (GE Medical Systems, Milwaukee) equipped with atransmit-receive body coil and a commercial eight-elementsensitivity encoding (SENSE) head coil array. A volumetricthree-dimensional T1-weighted fast spoiled gradient echo(FSPGR) scan was obtained with a measured spatial reso-lution of 0.94 3 0.94 3 1.00 mm3 (matrix 256 3 256 pixels,172 slices, axial orientation) covering the whole brain.
TABLE II. Demographic and psychometric data
HCS (N 5 46) SAD (N 5 46) Statistics
Gender 29 m, 17 f 29 m, 17 f v2; P 5 1.0Age [Mean (SD, range)] 32.96 (8.87, 18–57) 33.13 (10.61, 19–53) t 5 0.084; P 5 0.933STAI [Mean (SD, range)] 31.3 (5.88, 21–55) 51.4 (10.8, 27–76) t 5 210.947; P< 0.001LSAS [Mean (SD, range)] n. a. 66.17 (20.4, 15–103) n. a.SPS [Mean (SD, range)] n. a. 31.27 (16.12, 10–74) n. a.SIAS [Mean (SD, range)] n. a. 37.66 (11.78, 9–60) n. a.BDI [Mean (SD, range)] n. a. 16.12 (9.52, 0–41a) n. a.
aOne patient fulfilled criteria for current depressive episode, however, SAD was the primary diagnosis. All other patients were free ofcomorbid psychiatric and neurological disorders.m, male; f, female; HCS, healthy control subjects; SAD, social anxiety disorder patients; STAI, state-trait anxiety inventory—trait version;LSAS, Liebowitz Social Anxiety Scale; SPS, Social Phobia Scale; SIAS, Social Interaction Anxiety Scale; BDI, Beck’s Depression Index.
r Increased Cortical Thickness in SAD r
r 3 r
Further imaging parameters were: field of view (FOV) 2403 240 mm2, echo time (TE) 2.1 ms, repetition-time (TR) 9.2ms, inversion time (TI) 500 ms, flip-angle 20�. Total acqui-sition time was about 6 min 20 s. Furthermore, T2-weighted images were acquired to exclude possible T2-sensitive brain abnormalities. For data quality check, allMRI scans were visually inspected. Four SAD datasets hadto be excluded due to moderate to severe technical arte-facts (defects, distortions).
Image Preprocessing
Cortical surface reconstruction, cortical parcellation, andsubcortical volumetric segmentation were performed withthe FreeSurfer image analysis suite (version 4.5.0), whichis documented and available for download online (http://surfer.nmr.mgh.harvard.edu/). The technical details ofthese procedures are described in prior publications [Daleet al., 1999; Fischl and Dale, 2000; Fischl et al., 1999a,b,2001, 2002, 2004a,b]. The three-dimensional structural T1-weighted MRI scans were used to construct models ofeach subject’s cortical surface in order to measure corticalthickness. This fully automated procedure comprised seg-
mentation of the cortical white matter [Dale et al., 1999],tessellation of the grey/white matter junction, inflation ofthe folded surface tessellation patterns [Fischl et al.,1999a,b] and automatic correction of topological defects inthe resulting manifold [Fischl et al., 2001]. This surfacewas then used as starting point for a deformable surfacealgorithm designed to find the grey/white and pial (greymatter/cerebrospinal fluid (CSF)) surfaces with sub-millimetre precision [Fischl and Dale, 2000]. The proce-dures for measuring cortical thickness have been validatedagainst histological analysis [Rosas et al., 2002] and man-ual measurements [Kuperberg et al., 2003; Salat et al.,2004]. This method uses both intensity and continuityinformation from the surfaces in the deformation proce-dure in order to interpolate surface locations for regions inwhich the MRI image is ambiguous [Fischl and Dale,2000]. For each subject, cortical thickness of the corticalribbon was computed on a uniform grid (comprised byvertices) with 1 mm spacing across both cortical hemi-spheres, with the thickness being defined by the shortestdistance between the grey/white and pial surface models.The thickness maps produced are not limited to thevoxel resolution of the image and thus sensitive forsub-millimeter differences between groups [Fischl and
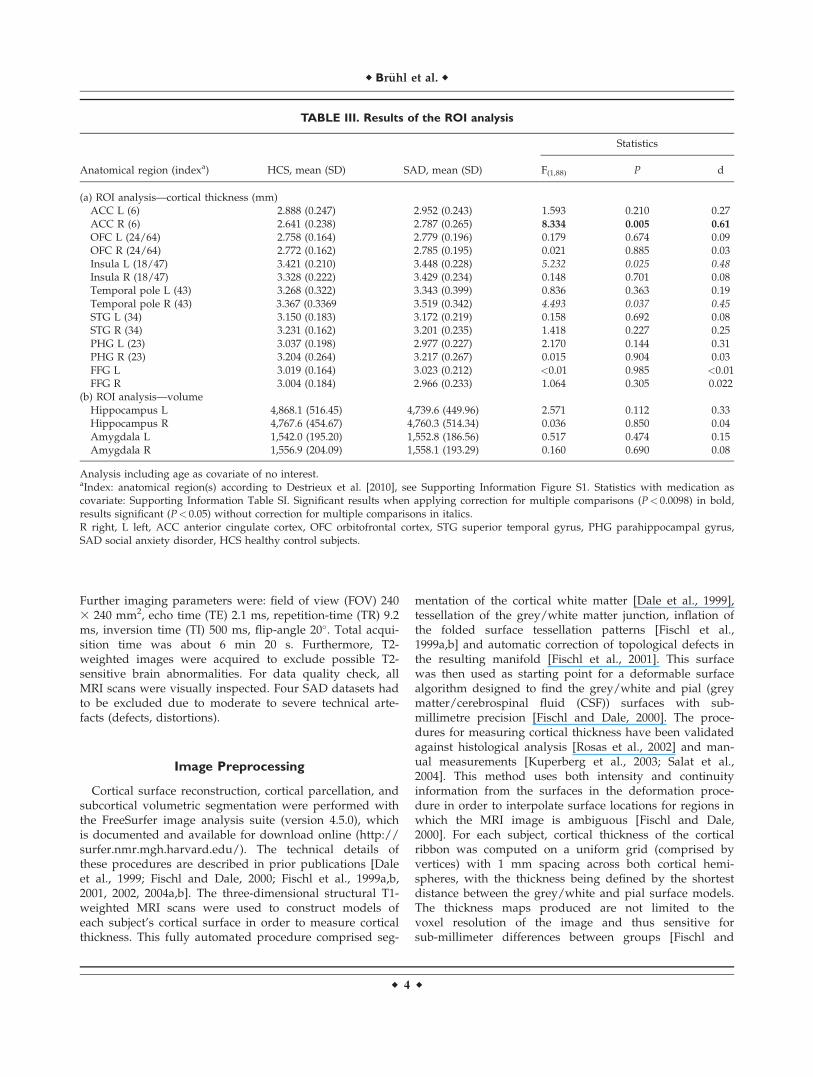
TABLE III. Results of the ROI analysis
Anatomical region (indexa) HCS, mean (SD) SAD, mean (SD)
Statistics
F(1,88) P d
(a) ROI analysis—cortical thickness (mm)ACC L (6) 2.888 (0.247) 2.952 (0.243) 1.593 0.210 0.27ACC R (6) 2.641 (0.238) 2.787 (0.265) 8.334 0.005 0.61
OFC L (24/64) 2.758 (0.164) 2.779 (0.196) 0.179 0.674 0.09OFC R (24/64) 2.772 (0.162) 2.785 (0.195) 0.021 0.885 0.03Insula L (18/47) 3.421 (0.210) 3.448 (0.228) 5.232 0.025 0.48Insula R (18/47) 3.328 (0.222) 3.429 (0.234) 0.148 0.701 0.08Temporal pole L (43) 3.268 (0.322) 3.343 (0.399) 0.836 0.363 0.19Temporal pole R (43) 3.367 (0.3369 3.519 (0.342) 4.493 0.037 0.45STG L (34) 3.150 (0.183) 3.172 (0.219) 0.158 0.692 0.08STG R (34) 3.231 (0.162) 3.201 (0.235) 1.418 0.227 0.25PHG L (23) 3.037 (0.198) 2.977 (0.227) 2.170 0.144 0.31PHG R (23) 3.204 (0.264) 3.217 (0.267) 0.015 0.904 0.03FFG L 3.019 (0.164) 3.023 (0.212) <0.01 0.985 <0.01FFG R 3.004 (0.184) 2.966 (0.233) 1.064 0.305 0.022
(b) ROI analysis—volumeHippocampus L 4,868.1 (516.45) 4,739.6 (449.96) 2.571 0.112 0.33Hippocampus R 4,767.6 (454.67) 4,760.3 (514.34) 0.036 0.850 0.04Amygdala L 1,542.0 (195.20) 1,552.8 (186.56) 0.517 0.474 0.15Amygdala R 1,556.9 (204.09) 1,558.1 (193.29) 0.160 0.690 0.08
Analysis including age as covariate of no interest.aIndex: anatomical region(s) according to Destrieux et al. [2010], see Supporting Information Figure S1. Statistics with medication ascovariate: Supporting Information Table SI. Significant results when applying correction for multiple comparisons (P< 0.0098) in bold,results significant (P< 0.05) without correction for multiple comparisons in italics.R right, L left, ACC anterior cingulate cortex, OFC orbitofrontal cortex, STG superior temporal gyrus, PHG parahippocampal gyrus,SAD social anxiety disorder, HCS healthy control subjects.
r Br€uhl et al. r
r 4 r
Dale, 2000]. The way in which the resolution of the corticalthickness maps goes beyond the resolution of the originalacquisition is conceptually similar to a (conventional) partialvolume correction procedure. The cortex is smooth at thespatial scale of a several millimetres, which is imposed asconstraint by FreeSurfer to estimate the location of the sur-face with subvoxel accuracy. For instance, if a given voxelis darker than its neighbouring grey matter it probably con-tains more CSF and so the surface model is at a slightly dif-ferent position than if the neighbouring voxels werebrighter and therefore contain probably more white matter.Thickness measures were mapped to the inflated surface ofeach participant’s brain reconstruction, this allowing visual-ization of data across the entire cortical surface (gyri andsulci) without the data being obscured by cortical folding.Data were resampled for all subjects and rendered onto acommon spherical coordinate system [Fischl et al., 1999b].Then a surface-based vertex-wise cortical thickness mapwas computed for each participant. For the whole-brainvertex-wise analysis, the data were smoothed on the surfacetessellation using an iterative nearest-neighbour averagingprocedure with 615 iterations on the left hemisphere and621 iterations on the right hemisphere, corresponding to atwo-dimensional surface-based diffusion smoothing kernelwith a FWHM of 30 mm.
In addition, the cerebral cortex was parcellated intounits based on gyral/sulcal structure as implemented inFreeSurfer [Desikan et al., 2006; Destrieux et al., 2010;Fischl et al., 2004b] to generate ROIs for a priori hypothe-sis testing. We used the following parcellations as corticalROIs (Table III, Supporting Information Fig. S1): anteriorinsula, ACC, OFC, superior temporal gyrus and temporalpole, FFG, and additionally the parahippocampal gyrus.We separated superior temporal gyrus (STG) and temporalpole to increase spatial resolution, reduce noise, and dueto their differential functional allocation (the temporal polebeing associated with the (para)limbic system [Olson et al.,2007], the STG being involved in visuo-spatial, auditiveand language functions [Karnath, 2001]), and their differ-ent anatomical connections. The boundaries of these par-cellations were described elsewhere [Destrieux et al.,2010]. Mean cortical thickness values within these ROIswere calculated from unsmoothed thickness maps.
The subcortical segmentation procedure used to mea-sure the volume of subcortical structures such as theamygdala and hippocampus takes into account three dif-ferent kinds of information to disambiguate labels: (i) theprior probability that a given tissue class occurs at a spe-cific location in the atlas, (ii) the likelihood of the imagegiven that tissue class, and (iii) the probability of the localspatial configuration of labels given the tissue class. Thislatter term represents constraints on the space of allowablesegmentations and prohibits label configurations thatnever occur in reality (e.g. the hippocampus is neverlocated anterior to the amygdala). This technique has pre-viously been shown to be comparable in accuracy to man-ual labeling [Fischl et al., 2002]. The segmentations were
visually inspected for accuracy and none of the segmenta-tions had to be excluded. Finally, the volumes of the sub-cortical structures as well as global brain measures werecomputed based on these segmentations.
Statistical Analyses of the ROIs
Differences in cortical thickness within the a prioriselected regions (ROIs) were compared with an analysis ofcovariance (ANCOVA) with healthy controls versus SADpatients as between-subject factor, and global mean corti-cal thickness and age as covariate of no interest. In the vol-umetric analyses, mean global volume was used instead ofmean cortical thickness. Taking into account possibleeffects of antidepressant medication in the patients, wealso computed an ANCOVA using additionally medicationas covariate of no interest. To analyze correlations betweenthe measures of social anxiety (LSAS, SIAS, SPS) we calcu-lated bivariate correlations with the thickness/volume ofthe ROIs. ANCOVA, correlations, and psychometric statis-tics were done using SPSS 20.
Whole-Brain Statistical Analyses
To detect local differences in cortical thickness betweenpatients with SAD and healthy subjects, we computedvertex-wise analyses using a general linear model with aninitial height threshold of P< 0.05 fully corrected for multi-ple comparisons using 2,000 synthetic z-score permutations(Monte Carlo simulations) on the cluster extent while simul-taneously controlling for global mean cortical thickness.
In the resulting clusters, correlations between individualvalues and measures of social anxiety and an ANCOVA todetect effects of medication and age were calculated usingSPSS 20.
RESULTS
Participants
We analyzed anatomical data from in total 46 patientswith SAD (29 males, mean age 33 years, Table II), whichwere matched on age and gender with 46 healthy partici-pants (29 males, mean age 33 years). The groups differedsignificantly in trait anxiety (STAI-T). The severity of socialanxiety in the SAD group ranged between mild andsevere, the mean scores of the SPS were slightly higherthan those reported for SAD patients in the German vali-dation study of this scale (mean 5 29, SD 16). Degree ofsocial anxiety (LSAS, SIAS, SPS) and general anxiousness(STAI-T) were highly correlated (LSAS/STAI: r 5 0.609,P< 0.0001, SIAS/STAI: r 5 0.505, P 5 0.001, SPS/STAI:r 5 0.442, P 5 0.006). The patients’ degree of depressionaccording to the BDI pointed to depressive symptoms,however without fulfilling the criteria for current majordepressive episode (besides one patient). These symptoms
r Increased Cortical Thickness in SAD r
r 5 r
were interpreted as secondary to the SAD symptoms andsuffering.
ROI Analysis—Global Measures
There were no significant group differences in the globalmeasures of total brain volume (t(1,90) 5 0.286, P 5 0.776)and in the mean global cortical thickness (t(1,90) 5 20.347,P 5 0.729). When adding medication as a covariate, therewas no significant change (total brain volume:F(1,89) 5 0.053, P 5 0.819, partial g2(medication) 5 0.010; meanglobal cortical thickness F(1,89) 5 1.094, P 5 0.298, partialg2(medication) 5 0.023). However, due to the strong impactof the two global measures of brain volume we integratedthem as covariates into the respective ANCOVAs (totalbrain volume for the volumetric analysis of the amygdalaand hippocampus, mean global cortical thickness for theROI-based and whole-brain cortical thickness analyses).Adding medication status as covariate brought no signifi-cant difference to the model without medication (partial g2
of the factor medication between 0.002 and 0.020, results ofthis analysis: Supporting Information Table SI). We foundno relevant effect of gender on these results (partial g2 ofthe factor gender in those structures with significant groupdifferences between 0.004 and 0.042, partial g2 of the inter-action group 3 gender between 0.001 and 0.006).
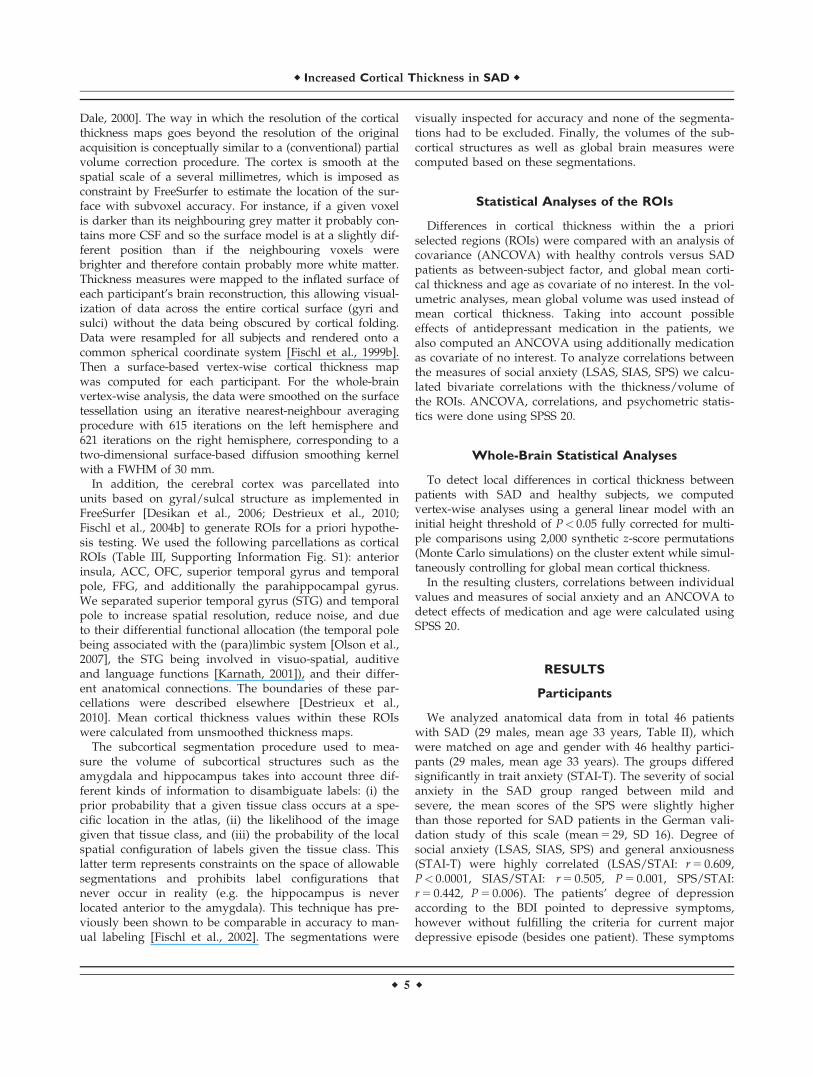
ROI Analysis—Cortical Thickness
In the ROI analysis (Table III, (a); Fig. 1), we found inSAD patients increased cortical thickness in the right tem-
poral pole, the right ACC and the left anterior insula. Theeffect sizes of these differences were small to medium. Ofthese, only the anterior cingulate cortex cluster survivedcorrection for multiple comparisons (P< 0.0098 uncor-rected corresponding to P< 0.05 corrected) when usingBonferroni-Sidak’s correction taking into account the inter-correlation between the ROIs’ cortical thicknesses (meanr 5 0.34). There were no significant differences in the otherROIs (even at P< 0.10).
Cortical thickness of the right anterior insula was posi-tively correlated with LSAS (r 5 0.357, P< 0.01) and withSPS (r 5 0.342, P< 0.04), cortical thickness of the left para-hippocampal gyrus was positively correlated with the SPS(r 5 0.385, P< 0.02). There were no further significant cor-relations between measures of social anxiety and corticalthickness.
ROI Analysis—Subcortical Volumes
There were no significant group differences in amygdalaand hippocampus [Table III; (b)]. Correlations betweenmeasures of social anxiety and volume of amygdala andhippocampus were not significant.
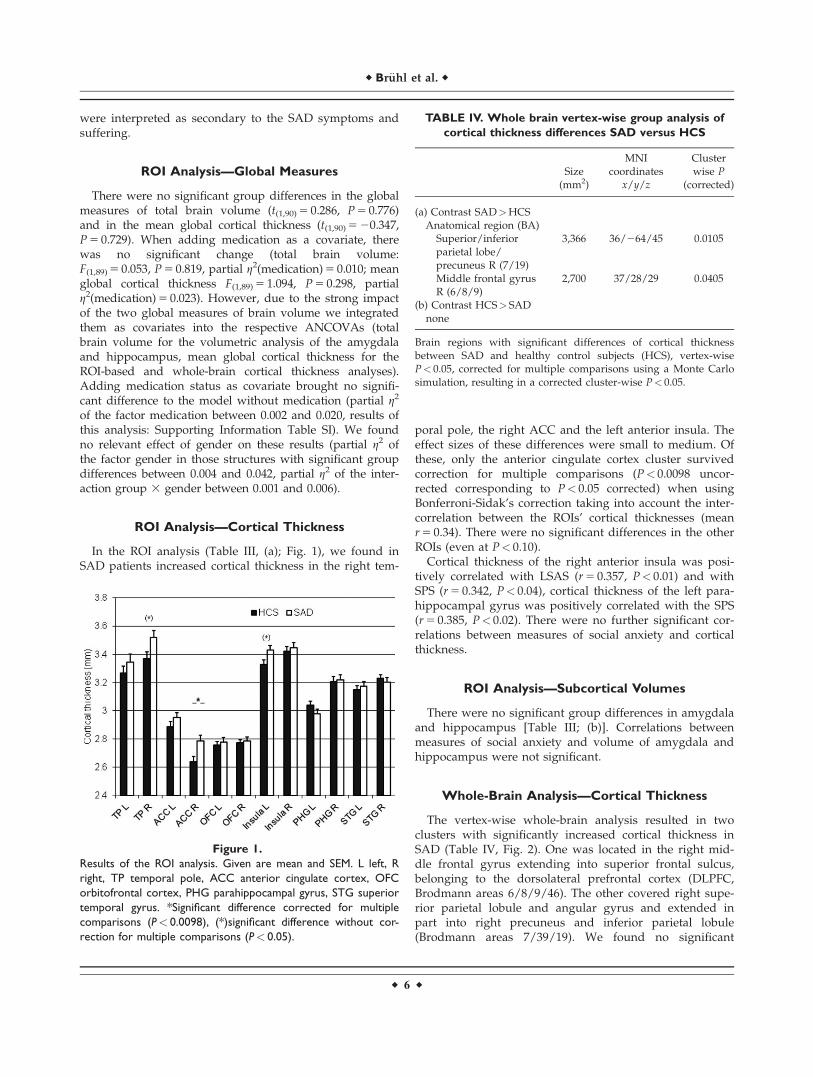
Whole-Brain Analysis—Cortical Thickness
The vertex-wise whole-brain analysis resulted in twoclusters with significantly increased cortical thickness inSAD (Table IV, Fig. 2). One was located in the right mid-dle frontal gyrus extending into superior frontal sulcus,belonging to the dorsolateral prefrontal cortex (DLPFC,Brodmann areas 6/8/9/46). The other covered right supe-rior parietal lobule and angular gyrus and extended inpart into right precuneus and inferior parietal lobule(Brodmann areas 7/39/19). We found no significant
Figure 1.
Results of the ROI analysis. Given are mean and SEM. L left, R
right, TP temporal pole, ACC anterior cingulate cortex, OFC
orbitofrontal cortex, PHG parahippocampal gyrus, STG superior
temporal gyrus. *Significant difference corrected for multiple
comparisons (P< 0.0098), (*)significant difference without cor-
rection for multiple comparisons (P< 0.05).
TABLE IV. Whole brain vertex-wise group analysis of
cortical thickness differences SAD versus HCS
Size(mm2)
MNIcoordinates
x/y/z
Clusterwise P
(corrected)
(a) Contrast SAD>HCSAnatomical region (BA)
Superior/inferiorparietal lobe/precuneus R (7/19)
3,366 36/264/45 0.0105
Middle frontal gyrusR (6/8/9)
2,700 37/28/29 0.0405
(b) Contrast HCS> SADnone
Brain regions with significant differences of cortical thicknessbetween SAD and healthy control subjects (HCS), vertex-wiseP< 0.05, corrected for multiple comparisons using a Monte Carlosimulation, resulting in a corrected cluster-wise P< 0.05.
r Br€uhl et al. r
r 6 r
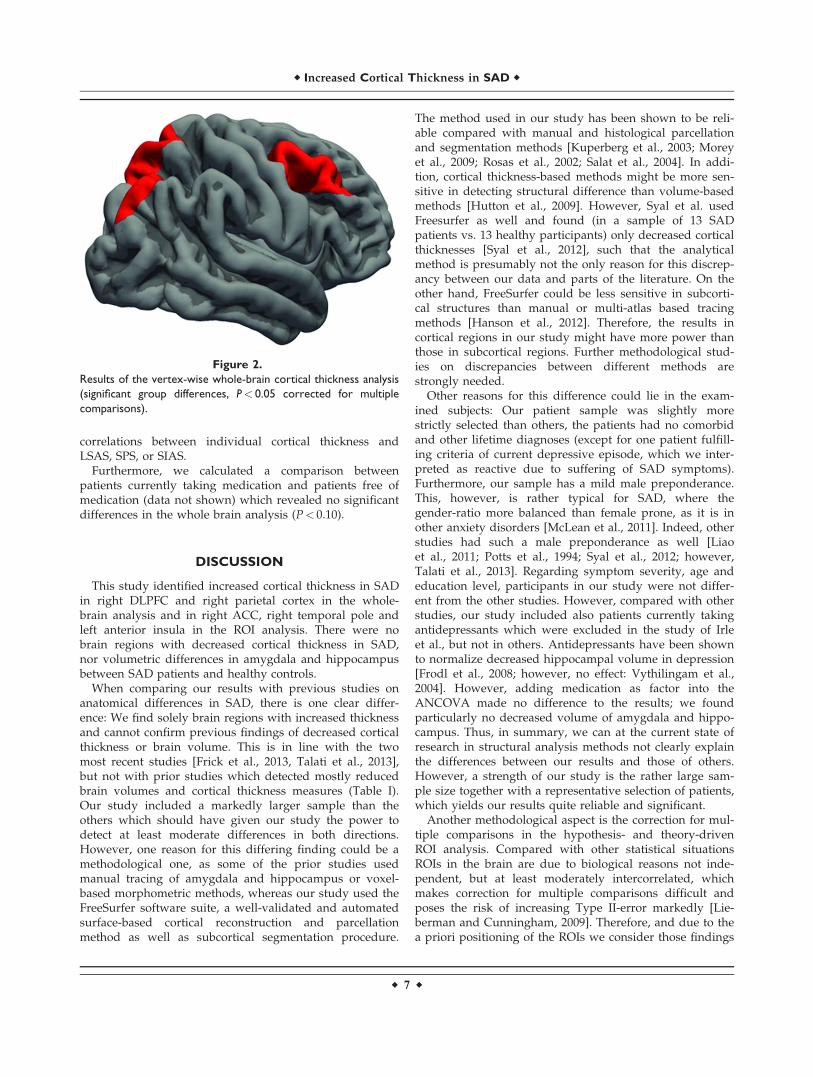
correlations between individual cortical thickness andLSAS, SPS, or SIAS.
Furthermore, we calculated a comparison betweenpatients currently taking medication and patients free ofmedication (data not shown) which revealed no significantdifferences in the whole brain analysis (P< 0.10).
DISCUSSION
This study identified increased cortical thickness in SADin right DLPFC and right parietal cortex in the whole-brain analysis and in right ACC, right temporal pole andleft anterior insula in the ROI analysis. There were nobrain regions with decreased cortical thickness in SAD,nor volumetric differences in amygdala and hippocampusbetween SAD patients and healthy controls.
When comparing our results with previous studies onanatomical differences in SAD, there is one clear differ-ence: We find solely brain regions with increased thicknessand cannot confirm previous findings of decreased corticalthickness or brain volume. This is in line with the twomost recent studies [Frick et al., 2013, Talati et al., 2013],but not with prior studies which detected mostly reducedbrain volumes and cortical thickness measures (Table I).Our study included a markedly larger sample than theothers which should have given our study the power todetect at least moderate differences in both directions.However, one reason for this differing finding could be amethodological one, as some of the prior studies usedmanual tracing of amygdala and hippocampus or voxel-based morphometric methods, whereas our study used theFreeSurfer software suite, a well-validated and automatedsurface-based cortical reconstruction and parcellationmethod as well as subcortical segmentation procedure.
The method used in our study has been shown to be reli-able compared with manual and histological parcellationand segmentation methods [Kuperberg et al., 2003; Moreyet al., 2009; Rosas et al., 2002; Salat et al., 2004]. In addi-tion, cortical thickness-based methods might be more sen-sitive in detecting structural difference than volume-basedmethods [Hutton et al., 2009]. However, Syal et al. usedFreesurfer as well and found (in a sample of 13 SADpatients vs. 13 healthy participants) only decreased corticalthicknesses [Syal et al., 2012], such that the analyticalmethod is presumably not the only reason for this discrep-ancy between our data and parts of the literature. On theother hand, FreeSurfer could be less sensitive in subcorti-cal structures than manual or multi-atlas based tracingmethods [Hanson et al., 2012]. Therefore, the results incortical regions in our study might have more power thanthose in subcortical regions. Further methodological stud-ies on discrepancies between different methods arestrongly needed.
Other reasons for this difference could lie in the exam-ined subjects: Our patient sample was slightly morestrictly selected than others, the patients had no comorbidand other lifetime diagnoses (except for one patient fulfill-ing criteria of current depressive episode, which we inter-preted as reactive due to suffering of SAD symptoms).Furthermore, our sample has a mild male preponderance.This, however, is rather typical for SAD, where thegender-ratio more balanced than female prone, as it is inother anxiety disorders [McLean et al., 2011]. Indeed, otherstudies had such a male preponderance as well [Liaoet al., 2011; Potts et al., 1994; Syal et al., 2012; however,Talati et al., 2013]. Regarding symptom severity, age andeducation level, participants in our study were not differ-ent from the other studies. However, compared with otherstudies, our study included also patients currently takingantidepressants which were excluded in the study of Irleet al., but not in others. Antidepressants have been shownto normalize decreased hippocampal volume in depression[Frodl et al., 2008; however, no effect: Vythilingam et al.,2004]. However, adding medication as factor into theANCOVA made no difference to the results; we foundparticularly no decreased volume of amygdala and hippo-campus. Thus, in summary, we can at the current state ofresearch in structural analysis methods not clearly explainthe differences between our results and those of others.However, a strength of our study is the rather large sam-ple size together with a representative selection of patients,which yields our results quite reliable and significant.
Another methodological aspect is the correction for mul-tiple comparisons in the hypothesis- and theory-drivenROI analysis. Compared with other statistical situationsROIs in the brain are due to biological reasons not inde-pendent, but at least moderately intercorrelated, whichmakes correction for multiple comparisons difficult andposes the risk of increasing Type II-error markedly [Lie-berman and Cunningham, 2009]. Therefore, and due to thea priori positioning of the ROIs we consider those findings
Figure 2.
Results of the vertex-wise whole-brain cortical thickness analysis
(significant group differences, P< 0.05 corrected for multiple
comparisons).
r Increased Cortical Thickness in SAD r
r 7 r

which are significant at an uncorrected level, but do notsurvive correction for multiple comparisons, as relevantand discuss them along with the corrected results.
From a general functional perspective, those brainregion with increased thickness in SAD fit into models ofhyperactive neural circuits involved in the processingof emotional stimuli (temporal pole, anterior insula) andof frontoparietal networks particularly associated withexecutive, emotion regulating and attentional functions(DLPFC, ACC, parietal lobe) [e.g. Etkin et al., 2009; Ochs-ner et al., 2012]. Particularly the increased thickness in theDLPFC and the superior parietal cortex in SAD are in linewith models of disturbed, overactive and dysregulatedattentional networks in anxiety disorders [Sylvester et al.,2012], which are predominantly right lateralized, similar toour findings.
The lack of correlation with symptom severity in ourstudy could further suggest that these two regions arerather a correlate of the category of disorder than of anypsychopathological dimension. On the other hand, particu-larly the higher thickness of the DLPFC as well as theACC could both be the result of continuous efforts of cop-ing or attempts of emotion regulation, thus rather a com-pensatory increase of thickness. Both, the DLPFC and theACC have been shown to be implicated in emotion regula-tion circuits in many studies [e.g. Herwig et al., 2007;Ochsner et al., 2002; meta-analyses: Diekhof et al., 2011;Kalisch, 2009]. The right DLPFC is furthermore known tobe more active during emotion suppression [Goldin et al.,2008; Phan et al., 2005], which is used more frequently inSAD patients [Kashdan and Steger, 2006], which wouldsupport the interpretation of compensatory increase ofDLPFC thickness in the current study.
Thicknesses of anterior insula and temporal pole werepositively correlated with the severity of SAD symptoms.This supports is in line with typical functional models ofSAD and other anxiety disorders which implicate anincreased activity and reactivity of amygdala and anteriorinsula in response to threatening or feared stimuli [meta-analysis: Etkin and Wager, 2007], but also to non-specificgeneral negative emotional stimuli [Br€uhl et al., 2011; Shahet al., 2009]. Increased responsiveness of the insula is inter-preted as link between internal, particularly bodily, andexternal information [Craig, 2009; Paulus and Stein, 2010]which is related to anxiety and anxiety disorders. Reducedcortical thickness in the temporal pole has been shownbilaterally in a group of violent offenders ranking high inpsychopathy, which is considered as the opposite of anxi-ety and particularly of social anxiety [Gregory et al., 2012].Together with the findings in our study, this finding sup-ports a role of the temporal pole region for anxiety, per-haps with a specific focus on social aspects of anxiety.
In addition to this increased propagation of emotionalinformation, models have suggested, that a diminishedregulation of these bottom-up processing regions by pre-frontal brain regions might play a role. Some studiesfound an increased DLPFC activity [Klumpp et al., 2012],
but disturbed connectivity [Hahn et al., 2011; Liao et al.,2011; Prater et al., 2013] and reduced structural connec-tions [Baur et al., 2011, 2013; Phan et al., 2009] are fre-quently reported, which could be interpreted as either afunctional disturbance of the DLPFC or rather disturbedregulatory connections between these regulating regionsand the subcortical and limbic targets of regulation. Ourdata would, at least from the cortical perspective, supportsuch models of disturbed regulatory connectivity which isreflected by increased thickness in both, the hyperactivelimbic and the compensatorily, but unsuccessfully hyper-active prefrontal structures.
In addition, prior studies have identified increased acti-vations in brain regions within the dorsal attention net-work [e.g. Br€uhl et al., 2011].
In summary, comparing the pattern of structural differ-ences of the current study with functional models of SAD,we found overlapping networks, such salience processingregions (insula), executive control regions (DLPFC, cingu-late) extending into the dorsal attention network (DLPFC,superior parietal cortex). However, particularly subcorticalregions show consistently altered functions, but no struc-tural differences in our study. This discrepancy couldreflect disturbed connections between subcortical circuitsand regulating cortical structures as has been shown onthe functional and structural level [Baur et al., 2011, 2013;Hahn et al., 2011; Liao et al., 2011; Phan et al., 2009].
However, when trying to transfer functional findingsand models to the here presented structural findings, onehas to take into account that the relation between corticalthickness and function is not totally clear: When a brainregion is clearly atrophic, with a marked reduction of cort-ical thickness, this is strongly related to diminished func-tion of a region, for instance in degenerative disorders[Julkunen et al., 2010; Kallianpur et al., 2012] or mentalretardation [Zhang et al., 2011]. In parallel, practicing aspecific skill is associated with increased thickness ofrespective regions in rats [Anderson et al., 2002] andhumans [Engvig et al., 2011; Wenger et al., 2012], particu-larly in younger participants. In parallel, professional golfplayers had higher grey matter volumes compared withless-skilled golfers [J€ancke et al., 2009], whereas in profes-sional ballet dancers, length of training or specific skillability were negatively correlated with grey matter volumein training- and skill-related brain structures [H€anggiet al., 2010]. In other domains again, performance andcortical thickness were correlated also in other domains[Liem et al., 2012; Yin et al., 2011]. In summary, structuraland functional or behavioural differences cannot bedirectly transferred into each other conclusively, particularnot causally. However, in some brain regions such as ininsula, temporal and prefrontal cortex, the data from func-tional and structural studies (increased thickness andincreased activity) in SAD are rather consistent and pointinto a common direction.
The question remains, wether the described differencesin SAD compared with HCS are anatomical reasons of the
r Br€uhl et al. r
r 8 r

disorder or reflect potential compensatory effects. Onecould argue that the changes in anterior insula and tempo-ral pole are caused by or correspond to anxious hyper-arousal and hyper-reactivity, paralleled by the correlationwith symptoms, which then coincide in the ACC withincreased, possibly compensatory regulatory efforts,involving prefrontal regions such as MPFC and DLPFC.The increased thickness in the parietal cortex correspondsto increased activations in functional studies [Br€uhl et al.,2011] and early information processing biases in SAD[Miskovic and Schmidt, 2012a] and could reflect hyper-functional, but dysregulated attention networks [Sylvesteret al., 2012] and disturbed connections in regulatory cir-cuits [Baur et al., 2013]. These findings extend the currentmodel of SAD [Freitas-Ferrari et al., 2010; Miskovic andSchmidt, 2012b] by emphasizing attention and visual-perception related brain regions.
Limitations and Methodological Issues
A limitation of the current study can be seen in the lackof measures of intelligence or IQ and respective matching.Total brain volume or grey matter volume have beenshown to correlate with intelligence [review: Gray andThompson, 2004], with moderate correlations between 0.21and 0.39 [McDaniel, 2005], most prominent in frontal brainregions [e.g. Colom et al., 2013]. Some volumetric studiestherefore measure and match IQ. However, this was notdone in our study. We used therefore scholar education asminimal proxy for intelligence and to exclude relevantcognitive impairments. Nearly all subjects were currentlyemployed, in training or going to college or university,which is comparable to the other mentioned studies. Fur-thermore, there are, to the best of our knowledge, no cleardata in the literature that patients suffering from SADhave specific intellectual impairments [Pubmed search,Bourke et al., 2012], which exceed possible testing-stressrelated disturbances [O’Toole and Pedersen 2011].
As another limitation could be mentioned, that we didnot assess life-time and duration of current medication inthe patient group. The requirement was that the medica-tion was stable for at least four weeks prior inclusion intothe study. However, we tested in the ANCOVA and in agroup comparison between patients with and withoutmedication for possible effects of pharmacological treat-ment. We detected no relevant influence of medication inour group.
Another potential limiting aspect is a methodological one,typical for most, if not all brain imaging studies: Research-ers have to balance their analyses between on the one handstatistical thresholds resulting in multiple results which arethen potentially biased by the problem of false positivefindings due to multiple comparisons. On the other hand,reducing multiple comparisons by using predefined ROIs(as was done in this study) has the disadvantage, that corti-cal thickness is averaged within the ROIs which could
obscure possibly existing differences and bias resultstowards the null hypothesis [Poldrack and Mumford, 2009],similar to the use of too strict statistical thresholds whencorrecting for multiple comparisons with any one methodwhich then increase Type II errors again [for a detailed dis-cussion of these problems refer to for instance, Button et al.,2013; Lieberman and Cunningham, 2009]. Therefore, ourresults cannot exclude effects in some of the examinedROIs. However, we have tried to balance as far as possibleand reasonable between these two aspects (reporting falsepositive results by using too low thresholds versus loosingrelevant findings by applying too strict thresholds) by com-bining an a priori, theory-driven ROI approach, where wereport those results surviving a correction for multiple com-parisons as well as those fulfilling merely the uncorrectedstatistical threshold, with a more exploratory whole-brainapproach where we apply a rather rigorous correction formultiple comparisons.
Future Perspective
Future studies including and overarching multiple dis-orders, for instance from the whole group of anxiety disor-ders could help clarifying (a) common and specific factorsfor the respective disorders and (b) also effects of comor-bidity compared with patients with only one disorder.Furthermore, the role of sensory and/or sensory-integrating structures in SAD is until now more or lessunderinvestigated and under-discussed. Clarifyingsensory-integrating functions associated with the dorsalattention network, perhaps also deficits or dysregulations,in SAD could provide support for therapeutic approachesaiming at attention modification [Hakamata et al., 2010;Heeren et al., 2011, 2012; Neubauer et al., 2013].
Furthermore, methodological research on the influenceof different parameters of data acquisition and analysis,including software, could help developing more generallycomparable methods and reducing the number of (seem-ingly) contradictory studies.
CONCLUSION
In conclusion, our study revealed increased thickness inprefrontal, parietal and insular cortex in SAD, but nodecreases of cortical thickness or brain volume. Theseresults fit with recent findings on the functional level,pointing more toward distributed differences in SAD onthe level of networks such as the prefrontal regulatory andthe dorsal attention network than to circumscribed distur-bances focusing, for instance, on the amygdala.
REFERENCES
Ackenheil M, Stotz G, Dietz-Bauer R, Vossen A (1999): Mini-Inter-national Neuropsychiatric Interview—German Version 5.0.0.M€unchen: Psychiatrische Universit€atsklinik M€unchen.
r Increased Cortical Thickness in SAD r
r 9 r

Anderson BJ, Eckburg PB, Relucio KI (2002): Alterations in thethickness of motor cortical subregions after motor-skill learn-ing and exercise. Learn Mem 9:1–9.
Annett M (1970): A classification of hand preference by associa-tion analysis. Br J Psychol 61:303–321.
Baur V, Bruhl AB, Herwig U, Eberle T, Rufer M, Delsignore A,Jancke L, Hanggi J (2013): Evidence of frontotemporal struc-tural hypoconnectivity in social anxiety disorder: A quantita-tive fiber tractography study. Hum Brain Mapp 34:437–446.
Baur V, Hanggi J, Jancke L (2012): Volumetric associationsbetween uncinate fasciculus, amygdala, and trait anxiety. BMCNeurosci 13:4.
Baur V, H€anggi J, Rufer M, Delsignore A, J€ancke L, Herwig U,Bruhl AB (2011): White matter alterations in social anxiety dis-order. J Psychiatr Res 45:1366–1372.
Blackmon K, Barr WB, Carlson C, Devinsky O, DuBois J, PogashD, Quinn BT, Kuzniecky R, Halgren E, Thesen T (2011): Struc-tural evidence for involvement of a left amygdala-orbitofrontalnetwork in subclinical anxiety. Psychiatry Res 194:296–303.
Bourke C, Porter RJ, Carter JD, McIntosh VV, Jordan J, Bell C,Carter F, Colhoun H, Joyce PR (2012): Comparison of neuro-psychological functioning and emotional processing in majordepression and social anxiety disorder subjects, and matchedhealthy controls. Aust NZ J Psychiatry 46:972–981.
Br€uhl AB, Rufer M, Delsignore A, Kaffenberger T, J€ancke L,Herwig U (2011): Neural correlates of altered general emotionprocessing in social anxiety disorder. Brain Res 1378:72–83.
Button KS, Ioannidis JPA, Mokrysz C, Nosek BA, Flint J,Robinson ESJ, Munafo MR (2013): Power failure: Why smallsample size undermines the reliability of neuroscience. NatRev Neurosci 14:365–376.
Colom R, Burgaleta M, Rom�an FJ, Karama S, �Alvarez-Linera J,Abad FJ, Mart�ınez K, Quiroga M �A, Haier RJ (2013): Neuroana-tomic overlap between intelligence and cognitive factors: Mor-phometry methods provide support for the key role of thefrontal lobes. Neuroimage 72:143–152.
Craig AD (2009): How do you feel—Now? The anterior insulaand human awareness. Nat Rev Neurosci 10:59–70.
Dale AM, Fischl B, Sereno MI (1999): Cortical surface-based analysis. I.Segmentation and surface reconstruction. Neuroimage 9:179–194.
Desikan RS, Segonne F, Fischl B, Quinn BT, Dickerson BC, BlackerD, Buckner RL, Dale AM, Maguire RP, Hyman BT, Albert MS,Killiany RJ (2006): An automated labeling system for subdivid-ing the human cerebral cortex on MRI scans into gyral basedregions of interest. Neuroimage 31:968–980.
Destrieux C, Fischl B, Dale A, Halgren E (2010): Automatic parcel-lation of human cortical gyri and sulci using standard anatom-ical nomenclature. Neuroimage 53:1–15.
Diekhof EK, Geier K, Falkai P, Gruber O (2011): Fear is only asdeep as the mind allows: A coordinate-based meta-analysis ofneuroimaging studies on the regulation of negative affect.Neuroimage 58:275–285.
Engvig A, Fjell AM, Westlye LT, Moberget T, Sundseth O, LarsenVA, Walhovd KB (2011): Effects of memory training on corticalthickness in the elderly. Neuroimage 52:1667–1676.
Eskildsen SF, Ostergaard LR (2006): Active surface approach forextraction of the human cerebral cortex from MRI. Med ImageComput Assist Interv 9:823–830.
Etkin A, Prater KE, Schatzberg AF, Menon V, Greicius MD (2009):Disrupted amygdalar subregion functional connectivity andevidence of a compensatory network in generalized anxietydisorder. Arch Gen Psychiatry 66:1361–1372.
Etkin A, Wager TD (2007): Functional neuroimaging of anxiety: Ameta-analysis of emotional processing in PTSD, social anxietydisorder, and specific phobia. Am J Psychiatry 164:1476–1488.
Fischl B, Dale AM (2000): Measuring the thickness of the humancerebral cortex from magnetic resonance images. Proc NatlAcad Sci USA 97:11050–11055.
Fischl B, Liu A, Dale AM (2001): Automated manifold surgery:Constructing geometrically accurate and topologically correctmodels of the human cerebral cortex. IEEE Trans Med Imaging20:70–80.
Fischl B, Salat DH, Busa E, Albert M, Dieterich M, Haselgrove C,van der Kouwe A, Killiany R, Kennedy D, Klaveness S, et al.(2002): Whole brain segmentation: Automated labeling of neu-roanatomical structures in the human brain. Neuron 33:341–355.
Fischl B, Salat DH, van der Kouwe AJ, Makris N, Segonne F,Quinn BT, Dale AM (2004a): Sequence-independent segmenta-tion of magnetic resonance images. Neuroimage 23(Suppl 1):S69–S84.
Fischl B, Sereno MI, Dale AM (1999a): Cortical surface-based anal-ysis. II: Inflation, flattening, and a surface-based coordinatesystem. Neuroimage 9:195–207.
Fischl B, Sereno MI, Tootell RB, Dale AM (1999b): High-resolutionintersubject averaging and a coordinate system for the corticalsurface. Hum Brain Mapp 8:272–284.
Fischl B, van der Kouwe A, Destrieux C, Halgren E, Segonne F,Salat DH, Busa E, Seidman LJ, Goldstein J, Kennedy D, et al.(2004b): Automatically parcellating the human cerebral cortex.Cereb Cortex 14:11–22.
Freitas-Ferrari MC, Hallak JEC, Trzesniak C, Filho AS, Machado-de-Sousa JP, Chagas MHN, Nardi AE, Crippa JAS (2010): Neu-roimaging in social anxiety disorder: A systematic review ofthe literature. Prog Neuropsychopharmacol Biol Psychiatry 34:565–580.
Frick A, Howner K, Fischer H, Eskildsen SF, Kristiansson M,Furmark T (2013): Cortical thickness alterations in social anxi-ety disorder. Neurosci Lett 536:52–55.
Frodl T, Jager M, Smajstrlova I, Born C, Bottlender R, Palladino T,Reiser M, Moller HJ, Meisenzahl EM (2008): Effect of hippo-campal and amygdala volumes on clinical outcomes in majordepression: A 3-year prospective magnetic resonance imagingstudy. J Psychiatry Neurosci 33:423–430.
Goldin PR, McRae K, Ramel W, Gross JJ (2008): The neural basesof emotion regulation: Reappraisal and suppression of nega-tive emotion. Biol Psychiatry 63:577–586.
Gray JR, Thompson PM (2004): Neurobiology of intelligence: sci-ence and ethics. Nat Rev Neurosci 5:471–482.
Gregory S, ffytche D, Simmons A, Kumari V, Howard M,Hodgins S, Blackwood N (2012): The antisocial brain: Psychop-athy matters. Arch Gen Psychiatry 69:962–972.
Hahn A, Stein P, Windischberger C, Weissenbacher A,Spindelegger C, Moser E, Kasper S, Lanzenberger R (2011):Reduced resting-state functional connectivity between amyg-dala and orbitofrontal cortex in social anxiety disorder. Neuro-image 56:881–889.
Hakamata Y, Lissek S, Bar-Haim Y, Britton JC, Fox NA, LeibenluftE, Ernst M, Pine DS (2010): Attention bias modification treat-ment: A meta-analysis toward the establishment of novel treat-ment for anxiety. Biol Psychiatry 68:982–990.
H€anggi J, Koeneke S, Bezzola L, J€ancke L (2010): Structural neuro-plasticity in the sensorimotor network of professional femaleballet dancers. Hum Brain Mapp 31:1196–1206.
r Br€uhl et al. r
r 10 r
Hanson JL, Suh JW, Nacewicz BM, Sutterer MJ, Cayo AA, StodolaDE, Burghy CA, Wang H, Avants BB, Yushkevich PA, et al.(2012): Robust automated amygdala segmentation via multi-atlas diffeomorphic registration. Front Neurosci 6:166.
Hautzinger M, Bailer M, Worall H, Keller F (1995): Beck-Depres-sions-Inventar (BDI). Bern: Hans Huber.
Hayano F, Nakamura M, Asami T, Uehara K, Yoshida T,Roppongi T, Otsuka T, Inoue T, Hirayasu Y (2009): Smalleramygdala is associated with anxiety in patients with panic dis-order. Psychiatry Clin Neurosci 63:266–276.
Heeren A, Lievens L, Philippot P (2011): How does attentiontraining work in social phobia: Disengagement from threat orre-engagement to non-threat? J Anxiety Disord 25:1108–1115.
Heeren A, Reese HE, McNally RJ, Philippot P (2012): Attentiontraining toward and away from threat in social phobia: Effectson subjective, behavioral, and physiological measures of anxi-ety. Behav Res Ther 50:30–39.
Herwig U, Baumgartner T, Kaffenberger T, Br€uhl A, Kottlow M,Schreiter-Gasser U, Abler B, J€ancke L, Rufer M (2007): Modula-tion of anticipatory emotion and perception processing by cog-nitive control. Neuroimage 37:652–662.
Hutton C, Draganski B, Ashburner J, Weiskopf N (2009): Compar-ison between voxel-based cortical thickness and voxel-basedmorphometry in normal aging. Neuroimage 48:371–380.
Irle E, Ruhleder M, Lange C, Seidler-Brandler U, Salzer S,Dechent P, Weniger G, Leibing E, Leichsenring F (2010):Reduced amygdalar and hippocampal size in adults with gen-eralized social phobia. J Psychiatry Neurosci 35:126–131.
J€ancke L, Koeneke S, Hoppe A, Rominger C, H€anggi J (2009): Thearchitecture of the Golfer’s brain. PLoS One 4:e4785.
Julkunen V, Niskanen E, Koikkalainen J, Herukka SK, PihlajamakiM, Hallikainen M, Kivipelto M, Muehlboeck S, Evans AC,Vanninen R, et al. (2010): Differences in cortical thickness inhealthy controls, subjects with mild cognitive impairment, andAlzheimer’s disease patients: A longitudinal study. J Alzhei-mers Dis 21:1141–1151.
Kalisch R (2009): The functional neuroanatomy of reappraisal:Time matters. Neurosci Biobehav Rev 33:1215–1226.
Kallianpur KJ, Kirk GR, Sailasuta N, Valcour V, Shiramizu B,Nakamoto BK, Shikuma C (2012): Regional cortical thinningassociated with detectable levels of HIV DNA. Cereb Cortex22:2065–2075.
Karnath HO (2001): New insights into the functions of the supe-rior temporal cortex. Nat Rev Neurosci 2:568–576.
Kashdan TB, Steger MF (2006): Expanding the topography ofsocial anxiety. An experience-sampling assessment of positiveemotions, positive events, and emotion suppression. PsycholSci 17:120–128.
Kessler RC, Ruscio AM, Shear K, Wittchen HU (2010): Epidemiol-ogy of anxiety disorders. Curr Top Behav Neurosci 2:21–35.
Klumpp H, Angstadt M, Phan KL (2012): Insula reactivity andconnectivity to anterior cingulate cortex when processingthreat in generalized social anxiety disorder. Biol Psychol 89:273–276.
K€uhn S, Schubert F, Gallinat J (2011): Structural correlates of traitanxiety: Reduced thickness in medial orbitofrontal cortexaccompanied by volume increase in nucleus accumbens. JAffect Disord 134:315–319.
Kuperberg GR, Broome MR, McGuire PK, David AS, Eddy M,Ozawa F, Goff D, West WC, Williams SC, van der Kouwe AJ,et al. (2003): Regionally localized thinning of the cerebral cor-tex in schizophrenia. Arch Gen Psychiatry 60:878–888.
Laux L, Glanzmann P, Schaffner P, Spielberger CD (1981): DasState-Trait-Angstinventar. Weinheim: Beltz.
Liao W, Xu Q, Mantini D, Ding J, Machado-de-Sousa JoP, HallakJEC, Trzesniak C, Qiu C, Zeng L, Zhang W, et al. (2011):Altered gray matter morphometry and resting-state functionaland structural connectivity in social anxiety disorder. BrainRes 1388:167–177.
Lieberman MD, Cunningham WA (2009): Type I and type II errorconcerns in fMRI research: Re-balancing the scale. Soc CognAffect Neurosci 4:423–428.
Liem F, Zaehle T, Burkhard A, Jancke L, Meyer M (2012): Corticalthickness of supratemporal plane predicts auditory N1 ampli-tude. Neuroreport 23:1026–1030.
McDaniel MA (2005): Big-brained people are smarter: A meta-analysis of the relationship between in vivo brain volume andintelligence. Intelligence 33:337–346.
McLean CP, Asnaani A, Litz BT, Hofmann SG (2011): Gender dif-ferences in anxiety disorders: Prevalence, course of illness,comorbidity and burden of illness. J Psychiatr Res 45:1027–1035.
Miskovic V, Schmidt LA (2012a): Early information processingbias in social anxiety disorder. Cognit Emot 26:176–185.
Miskovic V, Schmidt LA (2012b): Social fearfulness in the humanbrain. Neurosci Biobehav Rev 36:459–478.
Morey RA, Petty CM, Xu Y, Pannu Hayes J, Wagner Ii HR, LewisDV, LaBar KS, Styner M, McCarthy G (2009): A comparison ofautomated segmentation and manual tracing for quantifyinghippocampal and amygdala volumes. Neuroimage 45:855–866.
Mosing MA, Gordon SD, Medland SE, Statham DJ, Nelson EC,Heath AC, Martin NG, Wray NR (2009): Genetic and environ-mental influences on the co-morbidity between depression,panic disorder, agoraphobia, and social phobia: a twin study.Depress Anxiety 26:1004–1011.
Neubauer K, von Auer M, Murray E, Petermann F, Helbig-LangS, Gerlach AL (2013): Internet-delivered attention modificationtraining as a treatment for social phobia: A randomized con-trolled trial. Behav Res Ther 51:87–97.
O’Toole MS, Pedersen AD (2011): A systematic review of neuro-psychological performance in social anxiety disorder. Nord JPsychiatry 65:147–161.
Ochsner KN, Bunge SA, Gross JJ, Gabrieli JDE (2002): Rethinkingfeelings: An fMRI study of the cognitive regulation of emotion.J Cogn Neurosci 14:1215–1229.
Ochsner KN, Silvers JA, Buhle JT (2012): Functional imaging stud-ies of emotion regulation: A synthetic review and evolvingmodel of the cognitive control of emotion. Ann NY Acad Sci1251:E1–E24.
Olson IR, Plotzker A, Ezzyat Y (2007): The Enigmatic temporalpole: a review of findings on social and emotional processing.Brain 130:1718–1731.
Paulus MP, Stein MB (2010): Interoception in anxiety and depres-sion. Brain Struct Funct 214:451–463.
Phan KL, Fitzgerald DA, Nathan PJ, Moore GJ, Uhde TW, TancerME (2005): Neural substrates for voluntary suppression of neg-ative affect: A functional magnetic resonance imaging study.Biol Psychiatry 57:210–219.
Phan KL, Orlichenko A, Boyd E, Angstadt M, Coccaro EF,Liberzon I, Arfanakis K (2009): Preliminary evidence of whitematter abnormality in the uncinate fasciculus in generalizedsocial anxiety disorder. Biol Psychiatry 66:691–694.
Poldrack RA, Mumford JA (2009): Independence in ROI analysis:Where is the voodoo? Soc Cogn Affect Neurosci 4:208–213.
r Increased Cortical Thickness in SAD r
r 11 r
Potts NL, Davidson JR, Krishnan KR, Doraiswamy PM (1994):Magnetic resonance imaging in social phobia. Psychiatry Res52:35–42.
Prater KE, Hosanagar A, Klumpp H, Angstadt M, Luan Phan K(2013): Aberrant amygdala-frontal cortex connectivity duringperception of fearful faces and at rest in generalized socialanxiety disorder. Depress Anxiety 30:234–241.
Rauch SL, Wright CI, Martis B, Busa E, McMullin KG, Shin LM,Dale AM, Fischl B (2004): A magnetic resonance imaging studyof cortical thickness in animal phobia. Biol Psychiatry 55:946–952.
Rosas HD, Liu AK, Hersch S, Glessner M, Ferrante RJ, Salat DH,van der Kouwe A, Jenkins BG, Dale AM, Fischl B (2002):Regional and progressive thinning of the cortical ribbon inHuntington’s disease. Neurology 58:695–701.
Salat DH, Buckner RL, Snyder AZ, Greve DN, Desikan RS, BusaE, Morris JC, Dale AM, Fischl B (2004): Thinning of the cere-bral cortex in aging. Cereb Cortex 14:721–730.
Shah SG, Klumpp H, Angstadt M, Nathan PJ, Phan KL (2009):Amygdala and insula response to emotional images in patientswith generalized social anxiety disorder. J Psychiatry Neurosci34:296–302.
Stangier U, Heidenreich T (2005): Die Liebowitz Soziale Angst-Skala (LSAS). In: CIPS, editor. Internationale Skalen f€ur Psy-chiatrie. G€ottingen: Beltz.
Stangier U, Heidenreich T, Berardi A, Golbs U, Hoyer J (1999):Die Erfassung sozialer Phobie durch die Social InteractionAnxiety Scale (SIAS) und die Social Phobia Scale (SPS). Zeits-chrift f€ur Klinische Psychologie 28:28–36.
Stein MB, Stein DJ (2008): Social anxiety disorder. Lancet 371:1115–1125.
Syal S, Hattingh CJ, Fouche JP, Spottiswoode B, Carey PD,Lochner C, Stein DJ (2012): Grey matter abnormalities in socialanxiety disorder: A pilot study. Metab Brain Dis 27:299–309.
Sylvester CM, Corbetta M, Raichle ME, Rodebaugh TL, SchlaggarBL, Sheline YI, Zorumski CF, Lenze EJ (2012): Functional net-
work dysfunction in anxiety and anxiety disorders. TrendsNeurosci 35:527–535.
Talati A, Pantazatos SP, Schneier FR, Weissman MM, Hirsch J(2013): Gray matter abnormalities in social anxiety disorder:primary, replication, and specificity studies. Biol Psychiatry 73:75–84.
Uchida RR, Del-Ben CM, Busatto GF, Duran FL, Guimaraes FS,Crippa JA, Araujo D, Santos AC, Graeff FG (2008): Regionalgray matter abnormalities in panic disorder: a voxel-basedmorphometry study. Psychiatry Res 163:21–29.
van Tol M-J, van der Wee NJA, van den Heuvel OA, NielenMMA, Demenescu LR, Aleman A, Renken R, van BuchemMA, Zitman FG, Veltman DJ (2010): Regional brain volume indepression and anxiety disorders. Arch Gen Psychiatry 67:1002–1011.
Vythilingam M, Vermetten E, Anderson GM, Luckenbaugh D,Anderson ER, Snow J, Staib LH, Charney DS, Bremner JD(2004): Hippocampal volume, memory, and cortisol status inmajor depressive disorder: Effects of treatment. Biol Psychiatry56:101–112.
Wenger E, Schaefer S, Noack H, Kuhn S, Martensson J, HeinzeHJ, Duzel E, Backman L, Lindenberger U, Lovden M (2012):Cortical thickness changes following spatial navigation trainingin adulthood and aging. Neuroimage 59:3389–3397.
Wittchen HU, Jacobi F, Rehm J, Gustavsson A, Svensson M,Jonsson B, Olesen J, Allgulander C, Alonso J, Faravelli C, et al.(2011): The size and burden of mental disorders and other dis-orders of the brain in Europe 2010. Eur Neuropsychopharma-col 21:655–679.
Yin X, Zhao L, Xu J, Evans AC, Fan L, Ge H, Tang Y,Khundrakpam B, Wang J, Liu S (2011): Anatomical substrates ofthe alerting, orienting and executive control components of atten-tion: Focus on the posterior parietal lobe. PLoS One 7:e50590.
Zhang Y, Wu Y, Zhu M, Wang C, Wang J, Zhang Y, Yu C, JiangT (2011): Reduced cortical thickness in mental retardation.PLoS One 6:e29673.
r Br€uhl et al. r
r 12 r
Related Documents