Increased Adiposity, Dysregulated Glucose Metabolism and Systemic Inflammation in Galectin-3 KO Mice Jingbo Pang 1 , Davina H. Rhodes 1 , Maria Pini 1 , Rand T. Akasheh 1 , Karla J. Castellanos 1 , Robert J. Cabay 2 , Dianne Cooper 3 , Mauro Perretti 3 , Giamila Fantuzzi 1 * 1 Department of Kinesiology and Nutrition, University of Illinois at Chicago, Chicago, Illinois, United States of America, 2 Department of Pathology, University of Illinois at Chicago, Chicago, Illinois, United States of America, 3 The William Harvey Research Institute, Barts and the London School of Medicine, Queen Mary University of London, London, United Kingdom Abstract Obesity and type 2 diabetes are associated with increased production of Galectin-3 (Gal-3), a protein that modulates inflammation and clearance of glucose adducts. We used Lean and Diet-induced Obese (DIO) WT and Gal-3 KO mice to investigate the role of Gal-3 in modulation of adiposity, glucose metabolism and inflammation. Deficiency of Gal-3 lead to age-dependent development of excess adiposity and systemic inflammation, as indicated by elevated production of acute- phase proteins, number of circulating pro-inflammatory Ly6C high monocytes and development of neutrophilia, microcytic anemia and thrombocytosis in 20-week-old Lean and DIO male Gal-3 KO mice. This was associated with impaired fasting glucose, heightened response to a glucose tolerance test and reduced adipose tissue expression of adiponectin, Gal-12, ATGL and PPARc, in the presence of maintained insulin sensitivity and hepatic expression of gluconeogenic enzymes in 20- week-old Gal-3 KO mice compared to their diet-matched WT controls. Expression of PGC-1a and FGF-21 in the liver of Lean Gal-3 KO mice was comparable to that observed in DIO animals. Impaired fasting glucose and altered responsiveness to a glucose load preceded development of excess adiposity and systemic inflammation, as demonstrated in 12-week-old Gal-3 KO mice. Finally, a role for the microflora in mediating the fasting hyperglycemia, but not the excessive response to a glucose load, of 12-week-old Gal-3 KO mice was demonstrated by administration of antibiotics. In conclusion, Gal-3 is an important modulator of glucose metabolism, adiposity and inflammation. Citation: Pang J, Rhodes DH, Pini M, Akasheh RT, Castellanos KJ et al. (2013) Increased Adiposity, Dysregulated Glucose Metabolism and Systemic Inflammation in Galectin-3 KO Mice. PLoS ONE 8(2): e57915. doi:10.1371/journal.pone.0057915 Editor: Massimo Federici, University of Tor Vergata, Italy Received October 31, 2012; Accepted January 27, 2013; Published February 22, 2013 Copyright: ß 2013 Pang et al. This is an open-access article distributed under the terms of the Creative Commons Attribution License, which permits unrestricted use, distribution, and reproduction in any medium, provided the original author and source are credited. Funding: G.F. is supported by NIH grant DK083328. The funders had no role in study design, data collection and analysis, decision to publish, or preparation of the manuscript. Competing Interests: The authors have declared that no competing interests exist. * E-mail: [email protected] Introduction Obesity and its associated co-morbidities are among the most problematic health conditions modern societies have to deal with [1]. Obesity, particularly accumulation of visceral adipose tissue (VAT), is characterized by chronic inflammation that likely plays an important role in increasing the risk of chronic pathologies [1]. Individual differences in the degree of adiposity, the immune and inflammatory response, the ability of the organism to handle oxidative stress as well as composition of the gut microbiota are important factors in the development of obesity-associated co- morbidities [2]. Galectin-3 (Gal-3), a member of the galectin family, has been widely studied for its involvement in inflammatory responses [3]. Production of Gal-3 is highly increased during inflammation in both humans and animals and Gal-3 exerts pro-inflammatory effects under a variety of conditions [3]. However, the effect of Gal-3 deficiency on inflammation remains controversial. In fact, although Gal-3 KO mice exhibit decreased inflammatory responses in models of peritonitis as well as bacterial, parasitic and prion infection [3], they demonstrate exacerbated sensitivity to endotoxin [4]. Moreover, Gal-3 KO mice subjected to diet- induced atherosclerosis or diabetes-associated kidney damage experience increased oxidative stress and inflammatory responses, leading to more severe pathology [5–8]. The increased pathology of Gal-3 KO mice in these models may be secondary to the ability of Gal-3 to act as a scavenger for advanced glycation and lipoxidation end-products, with data demonstrating elevated levels of these adducts in Gal-3 KO mice, particularly when fed an atherogenic diet [6,9]. In agreement, the increased circulating levels of Gal-3 observed in patients with Type 2 Diabetes are negatively correlated with glycated hemoglobin (HbA1c), suggest- ing a possible protective role for Gal-3 in the setting of hyperglycemia [10]. On the other hand, controversial results have been published on the effect of Gal-3 deficiency in models of hepatic steatosis/inflammation, with studies indicating either protection or increased disease severity in Gal-3 KO mice [9,11,12]. However, there is agreement that Gal-3 KO mice demonstrate elevated hepatic expression of peroxisome-prolifera- tor-activated receptor c (PPARc), suggesting that Gal-3 partici- pates in the regulation of fatty acid and glucose metabolism in the liver [9,12]. Galectin-3 has also been studied in the context of obesity. In adipose tissue, Gal-3 is expressed by both adipocytes and infiltrating macrophages [13]. Evidence indicates that circulating levels and adipose tissue production of Gal-3 are elevated in PLOS ONE | www.plosone.org 1 February 2013 | Volume 8 | Issue 2 | e57915

Welcome message from author
This document is posted to help you gain knowledge. Please leave a comment to let me know what you think about it! Share it to your friends and learn new things together.
Transcript
Increased Adiposity, Dysregulated Glucose Metabolismand Systemic Inflammation in Galectin-3 KO MiceJingbo Pang1, Davina H. Rhodes1, Maria Pini1, Rand T. Akasheh1, Karla J. Castellanos1, Robert J. Cabay2,
Dianne Cooper3, Mauro Perretti3, Giamila Fantuzzi1*
1 Department of Kinesiology and Nutrition, University of Illinois at Chicago, Chicago, Illinois, United States of America, 2 Department of Pathology, University of Illinois at
Chicago, Chicago, Illinois, United States of America, 3 The William Harvey Research Institute, Barts and the London School of Medicine, Queen Mary University of London,
London, United Kingdom
Abstract
Obesity and type 2 diabetes are associated with increased production of Galectin-3 (Gal-3), a protein that modulatesinflammation and clearance of glucose adducts. We used Lean and Diet-induced Obese (DIO) WT and Gal-3 KO mice toinvestigate the role of Gal-3 in modulation of adiposity, glucose metabolism and inflammation. Deficiency of Gal-3 lead toage-dependent development of excess adiposity and systemic inflammation, as indicated by elevated production of acute-phase proteins, number of circulating pro-inflammatory Ly6Chigh monocytes and development of neutrophilia, microcyticanemia and thrombocytosis in 20-week-old Lean and DIO male Gal-3 KO mice. This was associated with impaired fastingglucose, heightened response to a glucose tolerance test and reduced adipose tissue expression of adiponectin, Gal-12,ATGL and PPARc, in the presence of maintained insulin sensitivity and hepatic expression of gluconeogenic enzymes in 20-week-old Gal-3 KO mice compared to their diet-matched WT controls. Expression of PGC-1a and FGF-21 in the liver of LeanGal-3 KO mice was comparable to that observed in DIO animals. Impaired fasting glucose and altered responsiveness to aglucose load preceded development of excess adiposity and systemic inflammation, as demonstrated in 12-week-old Gal-3KO mice. Finally, a role for the microflora in mediating the fasting hyperglycemia, but not the excessive response to aglucose load, of 12-week-old Gal-3 KO mice was demonstrated by administration of antibiotics. In conclusion, Gal-3 is animportant modulator of glucose metabolism, adiposity and inflammation.
Citation: Pang J, Rhodes DH, Pini M, Akasheh RT, Castellanos KJ et al. (2013) Increased Adiposity, Dysregulated Glucose Metabolism and Systemic Inflammation inGalectin-3 KO Mice. PLoS ONE 8(2): e57915. doi:10.1371/journal.pone.0057915
Editor: Massimo Federici, University of Tor Vergata, Italy
Received October 31, 2012; Accepted January 27, 2013; Published February 22, 2013
Copyright: � 2013 Pang et al. This is an open-access article distributed under the terms of the Creative Commons Attribution License, which permitsunrestricted use, distribution, and reproduction in any medium, provided the original author and source are credited.
Funding: G.F. is supported by NIH grant DK083328. The funders had no role in study design, data collection and analysis, decision to publish, or preparation ofthe manuscript.
Competing Interests: The authors have declared that no competing interests exist.
* E-mail: [email protected]
Introduction
Obesity and its associated co-morbidities are among the most
problematic health conditions modern societies have to deal with
[1]. Obesity, particularly accumulation of visceral adipose tissue
(VAT), is characterized by chronic inflammation that likely plays
an important role in increasing the risk of chronic pathologies [1].
Individual differences in the degree of adiposity, the immune and
inflammatory response, the ability of the organism to handle
oxidative stress as well as composition of the gut microbiota are
important factors in the development of obesity-associated co-
morbidities [2].
Galectin-3 (Gal-3), a member of the galectin family, has been
widely studied for its involvement in inflammatory responses [3].
Production of Gal-3 is highly increased during inflammation in
both humans and animals and Gal-3 exerts pro-inflammatory
effects under a variety of conditions [3]. However, the effect of
Gal-3 deficiency on inflammation remains controversial. In fact,
although Gal-3 KO mice exhibit decreased inflammatory
responses in models of peritonitis as well as bacterial, parasitic
and prion infection [3], they demonstrate exacerbated sensitivity
to endotoxin [4]. Moreover, Gal-3 KO mice subjected to diet-
induced atherosclerosis or diabetes-associated kidney damage
experience increased oxidative stress and inflammatory responses,
leading to more severe pathology [5–8]. The increased pathology
of Gal-3 KO mice in these models may be secondary to the ability
of Gal-3 to act as a scavenger for advanced glycation and
lipoxidation end-products, with data demonstrating elevated levels
of these adducts in Gal-3 KO mice, particularly when fed an
atherogenic diet [6,9]. In agreement, the increased circulating
levels of Gal-3 observed in patients with Type 2 Diabetes are
negatively correlated with glycated hemoglobin (HbA1c), suggest-
ing a possible protective role for Gal-3 in the setting of
hyperglycemia [10]. On the other hand, controversial results have
been published on the effect of Gal-3 deficiency in models of
hepatic steatosis/inflammation, with studies indicating either
protection or increased disease severity in Gal-3 KO mice
[9,11,12]. However, there is agreement that Gal-3 KO mice
demonstrate elevated hepatic expression of peroxisome-prolifera-
tor-activated receptor c (PPARc), suggesting that Gal-3 partici-
pates in the regulation of fatty acid and glucose metabolism in the
liver [9,12].
Galectin-3 has also been studied in the context of obesity. In
adipose tissue, Gal-3 is expressed by both adipocytes and
infiltrating macrophages [13]. Evidence indicates that circulating
levels and adipose tissue production of Gal-3 are elevated in
PLOS ONE | www.plosone.org 1 February 2013 | Volume 8 | Issue 2 | e57915
obesity in both humans and experimental animals, with higher
expression in VAT compared to subcutaneous adipose tissue
(SAT) [10,13,14]. Moreover, Gal-3 promotes preadipocyte differ-
entiation in vitro [15], suggesting that increased Gal-3 may help
drive the expansion of adipose tissue in obesity.
In order to more clearly understand the role of Gal-3 in obesity
and its associated metabolic and inflammatory consequences, in
the present study we investigated the effect of Gal-3 deficiency
using the model of high fat diet (HFD)-induced obesity (DIO) in
mice.
Results
Increased adiposity in Gal-3 KO miceTo evaluate whether Gal-3 deficiency affects body weight, Lean
and DIO WT and Gal-3 KO mice were studied longitudinally.
Two separate experiments were performed with comparable
results, therefore data from the two studies are presented and
analyzed together. Although Gal-3 KO mice were slightly but
significantly smaller than WT mice at 8 weeks of age, the
difference between chow-fed Lean WT and Lean Gal-3 KO mice
was not significant at any of the later time points (Fig. 1A). When
fed a HFD, both DIO WT and DIO Gal-3 KO mice became
significantly heavier than their Lean counterparts starting at 4
weeks of feeding (12 weeks of age), with DIO Gal-3 KO mice
having an accelerated growth during the last 2 weeks of feeding,
resulting in their body weight being significantly higher than that
of DIO WT mice at the 19 and 20 week time points (Fig. 1A). No
significant differences in food intake were observed between WT
and Gal-3 KO mice on either chow or HFD (Fig. 1B). Evaluation
of body composition at the end of the experiment in 20-week-old
mice demonstrated the presence of a significantly higher fat mass
in both Lean and DIO Gal-3 KO mice compared to diet-matched
WT groups both in terms of absolute fat mass (Fig. 1C) and as% of
total body weight (% fat mass was 9.8+/21.6, 25.6+/22.2,
39.9+/22.9 and 53.7+/21.1 in Lean WT, Lean KO, DIO WT
and DIO KO mice, respectively, n = 10). The increased fat mass of
Gal-3 KO mice was confirmed by significantly higher levels of
circulating leptin in 20-week-old Lean and DIO Gal-3 KO mice
compared to their respective WT groups (Fig. 1D). There was also
a trend towards bigger adipocyte size in both VAT and SAT of
male Gal-3 KO compared to WT mice, although the difference
did not reach statistical significance (Fig. 1 E–F). Significantly
elevated circulating levels of triglycerides (TG) were present in
DIO Gal-3 KO mice, with a non-significant trend in Lean Gal-3
KO mice compared to diet-matched WT groups (Fig. 1G).
Moreover, significantly reduced mRNA expression of adiponectin
(APN) was observed in VAT of both Lean and DIO Gal-3 KO
mice compared to levels observed in Lean and DIO WT controls
(Fig. 1H). On the other hand, as we previously demonstrated [13],
a significant increase in mRNA expression for APN was observed
in SAT of DIO WT mice compared to Lean WT mice, with APN
expression in SAT of Lean and DIO Gal-3 KO mice comparable
to that of DIO WT mice (Fig. 1I). Likely as a result of differential
APN expression in VAT and SAT, circulating levels of APN were
comparable in the four groups (Fig. 1J). Increased release of leptin
and decreased production of APN from VAT of Gal-3 KO mice
was confirmed ex vivo using adipose tissue cultures (Fig. 1K–L).
Evaluation of genes involved in adipose tissue metabolism
indicated a reverse relationship with adiposity among the four
groups, with significantly reduced expression of Gal-12 and
adipose tissue triglyceride lipase (ATGL) in Gal-3 KO mice
compared with diet-matched groups, as well as blunted expression
of PPARc in each group compared to Lean WT mice (Fig. 1M).
In summary, Gal-3 KO mice on either chow or HFD developed
excess adiposity at 20 weeks of age compared to WT mice that was
mirrored by measurement of biomarkers for adipose tissue
metabolism.
Liver phenotype of Lean and DIO Gal-3 KO micePrevious studies provided conflicting results on the effect of Gal-
3 deficiency on development of hepatic steatosis [9,11,12]. We did
not observe any significant difference in liver weight, ratio of liver/
body weight or degree of hepatic steatosis between WT and Gal-3
KO mice, with each animal on HFD developing marked liver
steatosis, with characteristics of mixed micro- and macrovesicular
steatosis (Fig. 2A–C and representative pictures). Measurement of
hepatic TG levels confirmed the results of histological analysis,
with significantly elevated and comparable levels in both DIO WT
and Gal-3 KO mice compared to lean groups (Fig. 2D). No
histological signs of inflammatory infiltrate were observed in the
liver regardless of diet or genotype (see pictures in Fig. 2).
Furthermore, as shown below) hepatic mRNA expression of
interleukin-6 (IL-6) was comparable in each group, confirming
lack of overt liver-derived inflammation. Expression of genes
involved in fat metabolism demonstrated a significantly increased
expression of PPARc in Lean Gal-3 KO versus Lean WT mice,
with no significant differences between DIO groups (Fig. 2E), in
agreement with previous reports [9,12]. There was also a non-
significant trend toward elevated expression of fatty acid synthase
(FAS) and acyl-CoA oxidase (ACO) in Lean Gal-3 KO versus Lean
WT mice (Fig. 2F–G). Moreover, we observed a non-significant
trend for elevated expression of carnitin palmitoyltransferase 1
(CPT1) in both Gal-3 KO groups compared to diet-matched WT
mice (Fig. 2H), with no effect of genotype on hepatic expression of
PPARa (Fig. 2I). In summary, Gal-3 deficiency did not
significantly affect the liver in terms of degree of steatosis or
inflammation, although trends toward dysregulated expression of
genes involved in fat metabolism were observed, particularly in
Lean Gal-3 KO mice.
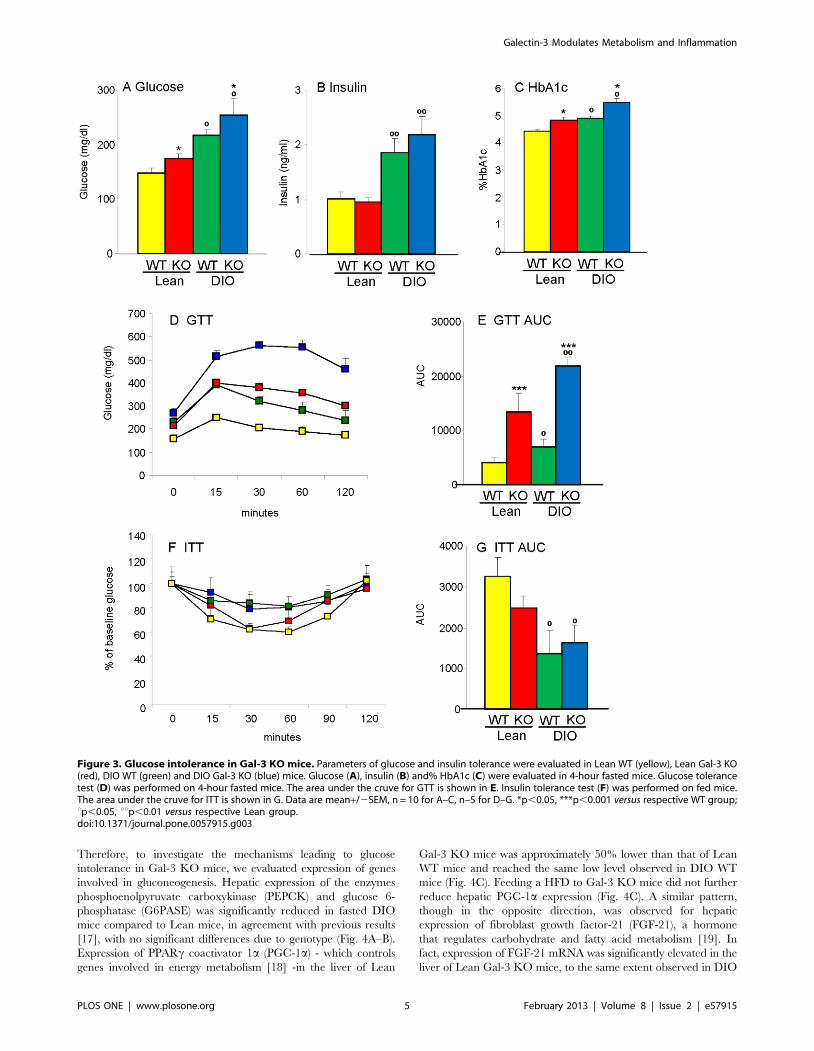
Dysregulated glucose metabolism in Gal-3 KO miceSignificantly higher fasting glucose levels were observed in 20
week-old male Lean and DIO Gal-3 KO mice compared to age-
matched Lean and DIO WT mice, with DIO groups of either
genotype being hyperglycemic compared to Lean groups (Fig. 3A).
However, fasting circulating levels of insulin were comparable
between WT and KO mice (Fig. 3B). Calculation of the
homeostatic model assessment index for insulin resistance
(HOMA-IR) indicated the presence of insulin resistance in both
DIO WT and Gal-3 KO mice compared to their respective Lean
groups, with a non-significant elevation of the index in DIO Gal-3
KO versus DIO WT mice (the HOMA2 index was 3.1+/20.3,
3.1+/20.2, 5.7+/20.5 and 8.5+/21.3 in Lean WT, Lean Gal-3
KO, DIO WT and DIO Gal-3 KO mice, respectively. Data are
mean+/2SEM of 9–10 mice per group; p,0.01 for DIO WT and
DIO Gal-3 KO versus Lean WT and Lean KO mice). Moreover,
both Lean and DIO Gal-3 KO mice had significantly higher levels
of HbA1c compared to WT mice, with Lean Gal-3 KO mice
having levels comparable to those of the DIO WT group (Fig. 3C).
A markedly exaggerated glycemic response to a glucose
tolerance test (GTT) was observed in both Lean and DIO Gal-3
KO mice; the most severe glucose intolerance was observed in
DIO Gal-3 KO mice (Fig. 3D–E). However, Gal-3 KO mice were
as insulin-sensitive as their diet-matched WT controls as evaluated
during an insulin tolerance test (ITT) (Fig. 3F–G).
Impaired fasting glucose and inability to clear a glucose load
may result from upregulated hepatic gluconeogenesis [16].
Galectin-3 Modulates Metabolism and Inflammation
PLOS ONE | www.plosone.org 2 February 2013 | Volume 8 | Issue 2 | e57915
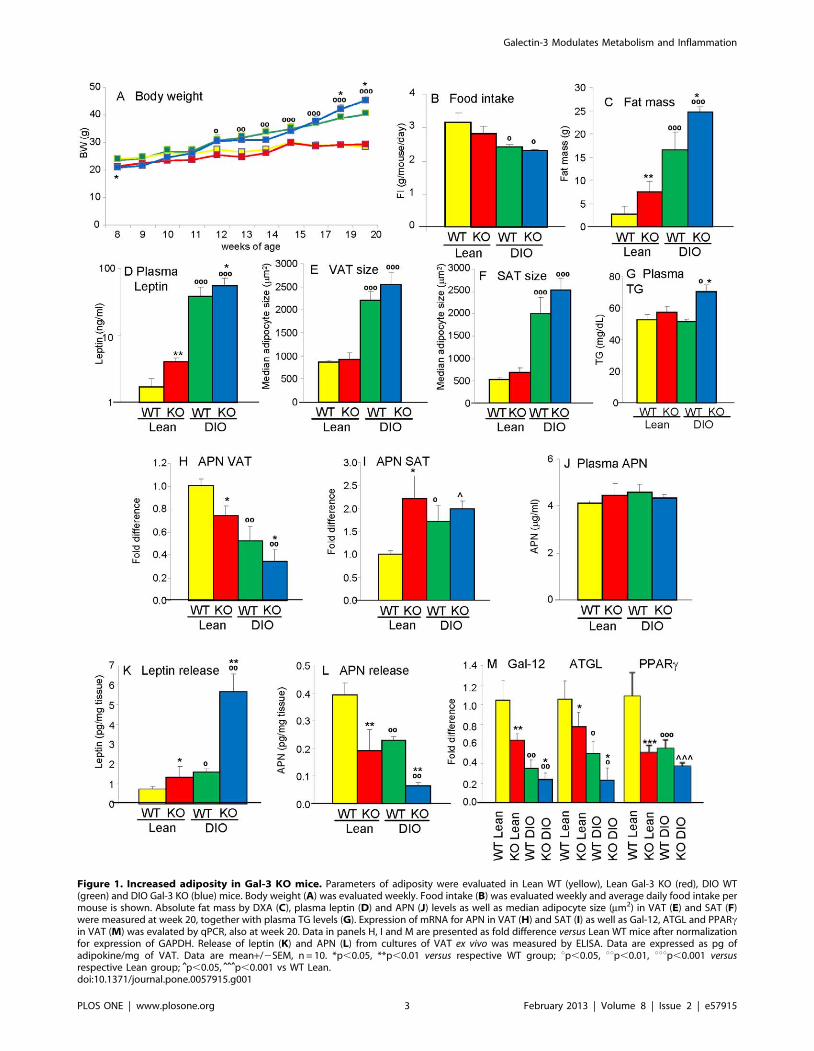
Figure 1. Increased adiposity in Gal-3 KO mice. Parameters of adiposity were evaluated in Lean WT (yellow), Lean Gal-3 KO (red), DIO WT(green) and DIO Gal-3 KO (blue) mice. Body weight (A) was evaluated weekly. Food intake (B) was evaluated weekly and average daily food intake permouse is shown. Absolute fat mass by DXA (C), plasma leptin (D) and APN (J) levels as well as median adipocyte size (mm2) in VAT (E) and SAT (F)were measured at week 20, together with plasma TG levels (G). Expression of mRNA for APN in VAT (H) and SAT (I) as well as Gal-12, ATGL and PPARcin VAT (M) was evalated by qPCR, also at week 20. Data in panels H, I and M are presented as fold difference versus Lean WT mice after normalizationfor expression of GAPDH. Release of leptin (K) and APN (L) from cultures of VAT ex vivo was measured by ELISA. Data are expressed as pg ofadipokine/mg of VAT. Data are mean+/2SEM, n = 10. *p,0.05, **p,0.01 versus respective WT group; up,0.05, uup,0.01, uuup,0.001 versusrespective Lean group; ˆp,0.05, ˆ̂ ˆp,0.001 vs WT Lean.doi:10.1371/journal.pone.0057915.g001
Galectin-3 Modulates Metabolism and Inflammation
PLOS ONE | www.plosone.org 3 February 2013 | Volume 8 | Issue 2 | e57915
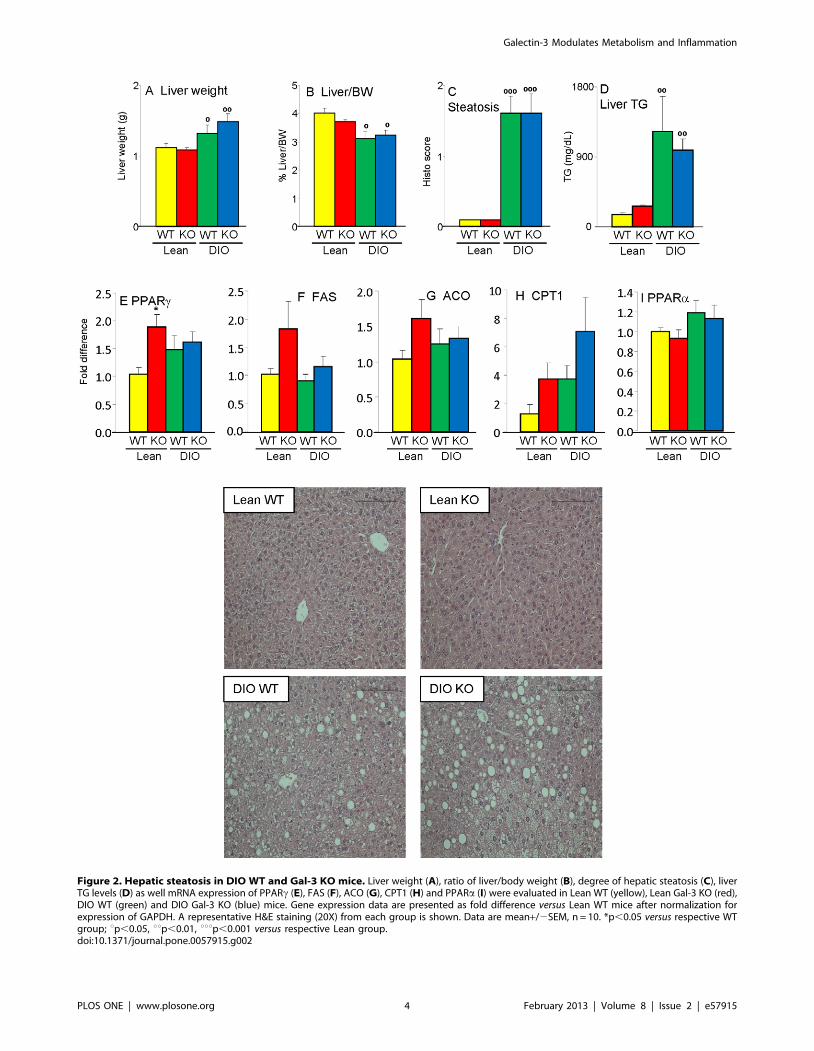
Figure 2. Hepatic steatosis in DIO WT and Gal-3 KO mice. Liver weight (A), ratio of liver/body weight (B), degree of hepatic steatosis (C), liverTG levels (D) as well mRNA expression of PPARc (E), FAS (F), ACO (G), CPT1 (H) and PPARa (I) were evaluated in Lean WT (yellow), Lean Gal-3 KO (red),DIO WT (green) and DIO Gal-3 KO (blue) mice. Gene expression data are presented as fold difference versus Lean WT mice after normalization forexpression of GAPDH. A representative H&E staining (20X) from each group is shown. Data are mean+/2SEM, n = 10. *p,0.05 versus respective WTgroup; up,0.05, uup,0.01, uuup,0.001 versus respective Lean group.doi:10.1371/journal.pone.0057915.g002
Galectin-3 Modulates Metabolism and Inflammation
PLOS ONE | www.plosone.org 4 February 2013 | Volume 8 | Issue 2 | e57915
Therefore, to investigate the mechanisms leading to glucose
intolerance in Gal-3 KO mice, we evaluated expression of genes
involved in gluconeogenesis. Hepatic expression of the enzymes
phosphoenolpyruvate carboxykinase (PEPCK) and glucose 6-
phosphatase (G6PASE) was significantly reduced in fasted DIO
mice compared to Lean mice, in agreement with previous results
[17], with no significant differences due to genotype (Fig. 4A–B).
Expression of PPARc coactivator 1a (PGC-1a) - which controls
genes involved in energy metabolism [18] -in the liver of Lean
Gal-3 KO mice was approximately 50% lower than that of Lean
WT mice and reached the same low level observed in DIO WT
mice (Fig. 4C). Feeding a HFD to Gal-3 KO mice did not further
reduce hepatic PGC-1a expression (Fig. 4C). A similar pattern,
though in the opposite direction, was observed for hepatic
expression of fibroblast growth factor-21 (FGF-21), a hormone
that regulates carbohydrate and fatty acid metabolism [19]. In
fact, expression of FGF-21 mRNA was significantly elevated in the
liver of Lean Gal-3 KO mice, to the same extent observed in DIO
Figure 3. Glucose intolerance in Gal-3 KO mice. Parameters of glucose and insulin tolerance were evaluated in Lean WT (yellow), Lean Gal-3 KO(red), DIO WT (green) and DIO Gal-3 KO (blue) mice. Glucose (A), insulin (B) and% HbA1c (C) were evaluated in 4-hour fasted mice. Glucose tolerancetest (D) was performed on 4-hour fasted mice. The area under the cruve for GTT is shown in E. Insulin tolerance test (F) was performed on fed mice.The area under the cruve for ITT is shown in G. Data are mean+/2SEM, n = 10 for A–C, n–5 for D–G. *p,0.05, ***p,0.001 versus respective WT group;up,0.05, uup,0.01 versus respective Lean group.doi:10.1371/journal.pone.0057915.g003
Galectin-3 Modulates Metabolism and Inflammation
PLOS ONE | www.plosone.org 5 February 2013 | Volume 8 | Issue 2 | e57915
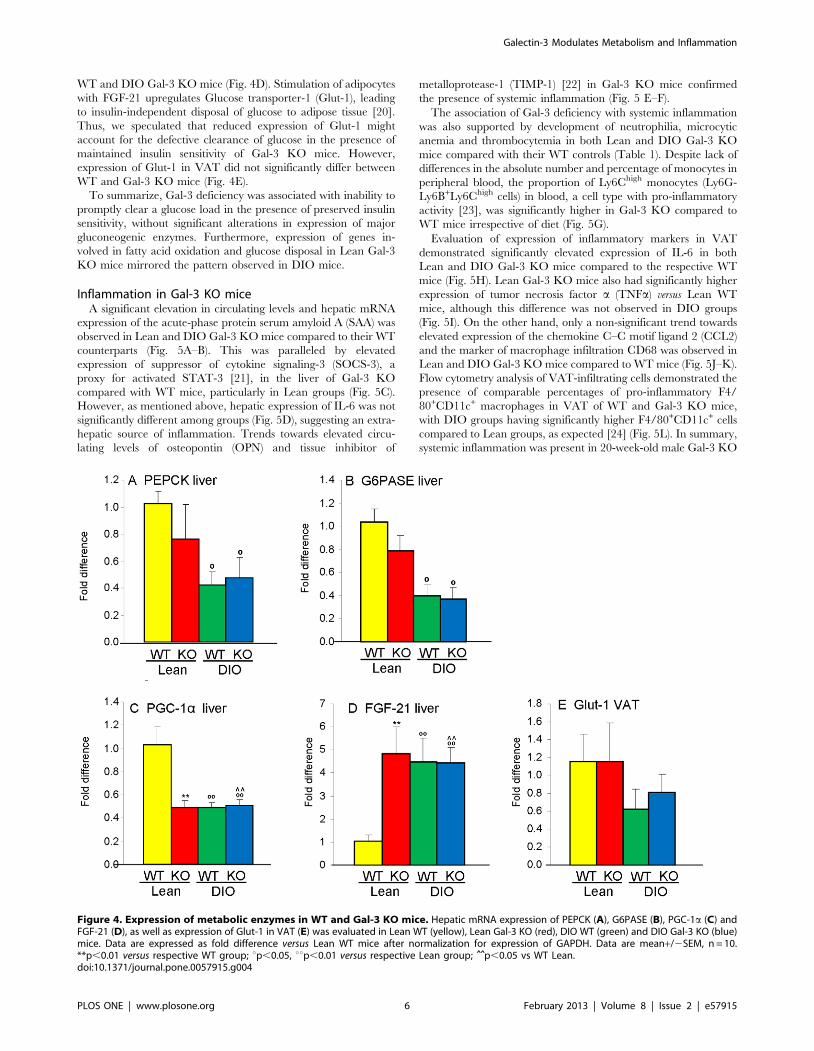
WT and DIO Gal-3 KO mice (Fig. 4D). Stimulation of adipocytes
with FGF-21 upregulates Glucose transporter-1 (Glut-1), leading
to insulin-independent disposal of glucose to adipose tissue [20].
Thus, we speculated that reduced expression of Glut-1 might
account for the defective clearance of glucose in the presence of
maintained insulin sensitivity of Gal-3 KO mice. However,
expression of Glut-1 in VAT did not significantly differ between
WT and Gal-3 KO mice (Fig. 4E).
To summarize, Gal-3 deficiency was associated with inability to
promptly clear a glucose load in the presence of preserved insulin
sensitivity, without significant alterations in expression of major
gluconeogenic enzymes. Furthermore, expression of genes in-
volved in fatty acid oxidation and glucose disposal in Lean Gal-3
KO mice mirrored the pattern observed in DIO mice.
Inflammation in Gal-3 KO miceA significant elevation in circulating levels and hepatic mRNA
expression of the acute-phase protein serum amyloid A (SAA) was
observed in Lean and DIO Gal-3 KO mice compared to their WT
counterparts (Fig. 5A–B). This was paralleled by elevated
expression of suppressor of cytokine signaling-3 (SOCS-3), a
proxy for activated STAT-3 [21], in the liver of Gal-3 KO
compared with WT mice, particularly in Lean groups (Fig. 5C).
However, as mentioned above, hepatic expression of IL-6 was not
significantly different among groups (Fig. 5D), suggesting an extra-
hepatic source of inflammation. Trends towards elevated circu-
lating levels of osteopontin (OPN) and tissue inhibitor of
metalloprotease-1 (TIMP-1) [22] in Gal-3 KO mice confirmed
the presence of systemic inflammation (Fig. 5 E–F).
The association of Gal-3 deficiency with systemic inflammation
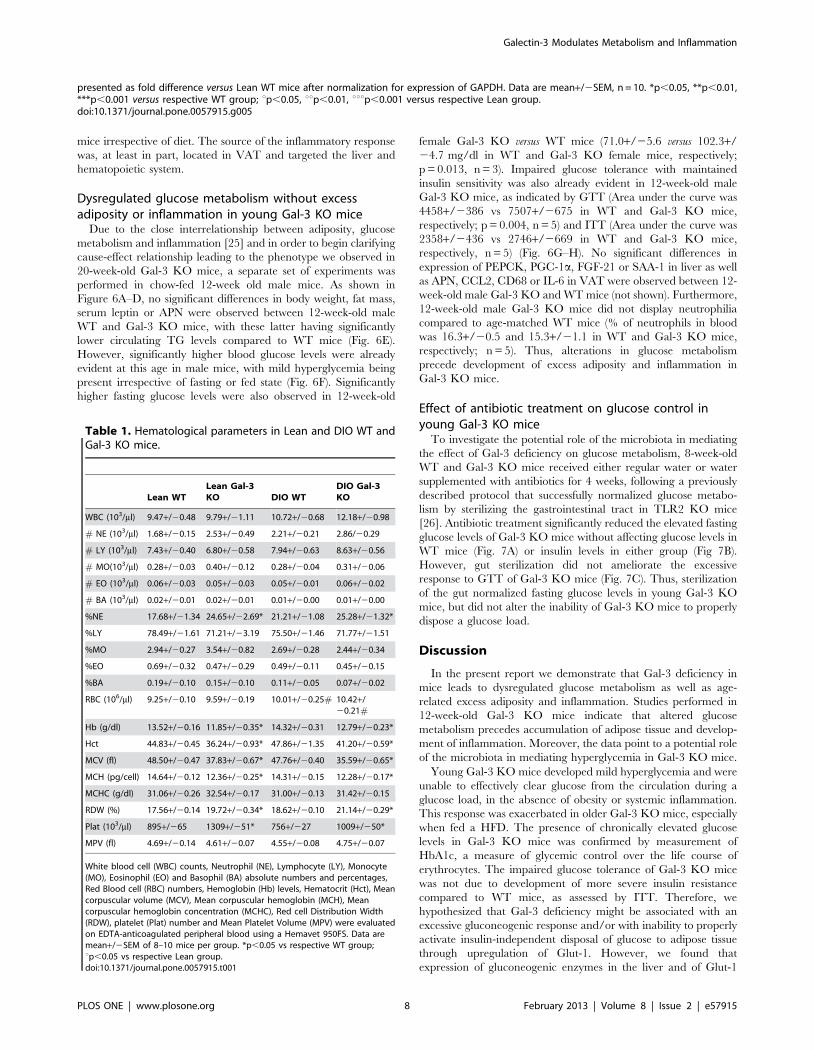
was also supported by development of neutrophilia, microcytic
anemia and thrombocytemia in both Lean and DIO Gal-3 KO
mice compared with their WT controls (Table 1). Despite lack of
differences in the absolute number and percentage of monocytes in
peripheral blood, the proportion of Ly6Chigh monocytes (Ly6G-
Ly6B+Ly6Chigh cells) in blood, a cell type with pro-inflammatory
activity [23], was significantly higher in Gal-3 KO compared to
WT mice irrespective of diet (Fig. 5G).
Evaluation of expression of inflammatory markers in VAT
demonstrated significantly elevated expression of IL-6 in both
Lean and DIO Gal-3 KO mice compared to the respective WT
mice (Fig. 5H). Lean Gal-3 KO mice also had significantly higher
expression of tumor necrosis factor a (TNFa) versus Lean WT
mice, although this difference was not observed in DIO groups
(Fig. 5I). On the other hand, only a non-significant trend towards
elevated expression of the chemokine C–C motif ligand 2 (CCL2)
and the marker of macrophage infiltration CD68 was observed in
Lean and DIO Gal-3 KO mice compared to WT mice (Fig. 5J–K).
Flow cytometry analysis of VAT-infiltrating cells demonstrated the
presence of comparable percentages of pro-inflammatory F4/
80+CD11c+ macrophages in VAT of WT and Gal-3 KO mice,
with DIO groups having significantly higher F4/80+CD11c+ cells
compared to Lean groups, as expected [24] (Fig. 5L). In summary,
systemic inflammation was present in 20-week-old male Gal-3 KO
Figure 4. Expression of metabolic enzymes in WT and Gal-3 KO mice. Hepatic mRNA expression of PEPCK (A), G6PASE (B), PGC-1a (C) andFGF-21 (D), as well as expression of Glut-1 in VAT (E) was evaluated in Lean WT (yellow), Lean Gal-3 KO (red), DIO WT (green) and DIO Gal-3 KO (blue)mice. Data are expressed as fold difference versus Lean WT mice after normalization for expression of GAPDH. Data are mean+/2SEM, n = 10.**p,0.01 versus respective WT group; up,0.05, uup,0.01 versus respective Lean group; ˆ̂ p,0.05 vs WT Lean.doi:10.1371/journal.pone.0057915.g004
Galectin-3 Modulates Metabolism and Inflammation
PLOS ONE | www.plosone.org 6 February 2013 | Volume 8 | Issue 2 | e57915
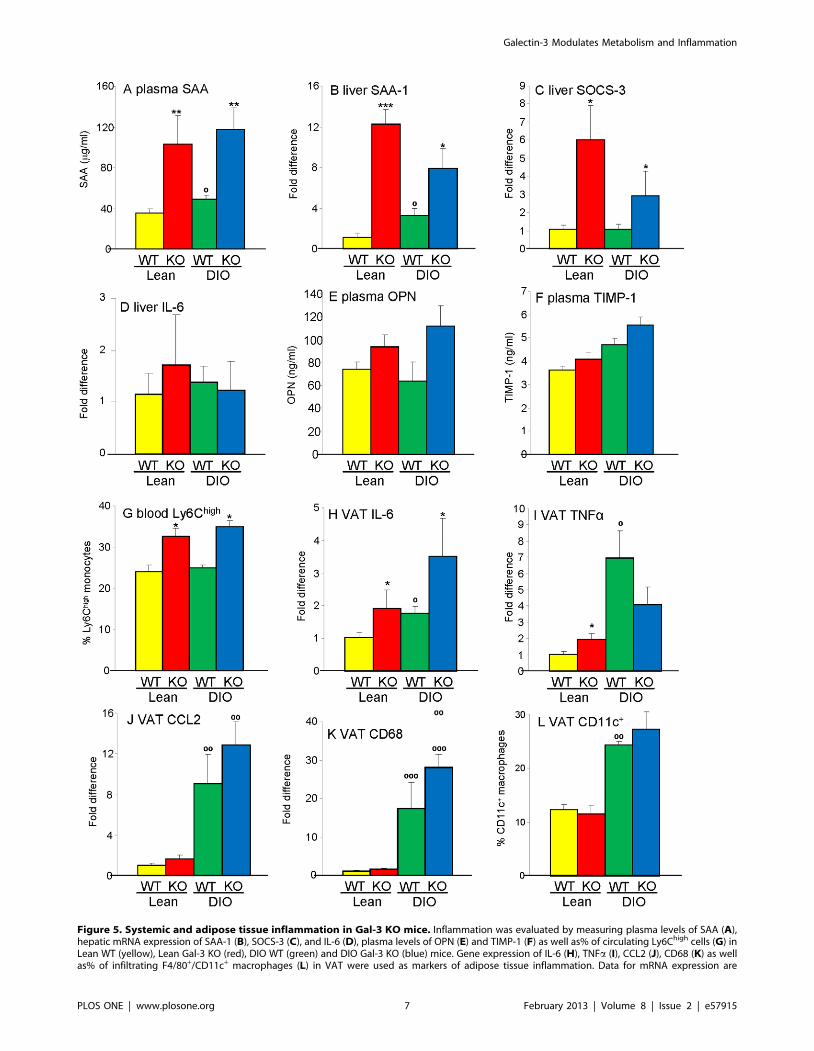
Figure 5. Systemic and adipose tissue inflammation in Gal-3 KO mice. Inflammation was evaluated by measuring plasma levels of SAA (A),hepatic mRNA expression of SAA-1 (B), SOCS-3 (C), and IL-6 (D), plasma levels of OPN (E) and TIMP-1 (F) as well as% of circulating Ly6Chigh cells (G) inLean WT (yellow), Lean Gal-3 KO (red), DIO WT (green) and DIO Gal-3 KO (blue) mice. Gene expression of IL-6 (H), TNFa (I), CCL2 (J), CD68 (K) as wellas% of infiltrating F4/80+/CD11c+ macrophages (L) in VAT were used as markers of adipose tissue inflammation. Data for mRNA expression are
Galectin-3 Modulates Metabolism and Inflammation
PLOS ONE | www.plosone.org 7 February 2013 | Volume 8 | Issue 2 | e57915
mice irrespective of diet. The source of the inflammatory response
was, at least in part, located in VAT and targeted the liver and
hematopoietic system.
Dysregulated glucose metabolism without excessadiposity or inflammation in young Gal-3 KO mice
Due to the close interrelationship between adiposity, glucose
metabolism and inflammation [25] and in order to begin clarifying
cause-effect relationship leading to the phenotype we observed in
20-week-old Gal-3 KO mice, a separate set of experiments was
performed in chow-fed 12-week old male mice. As shown in
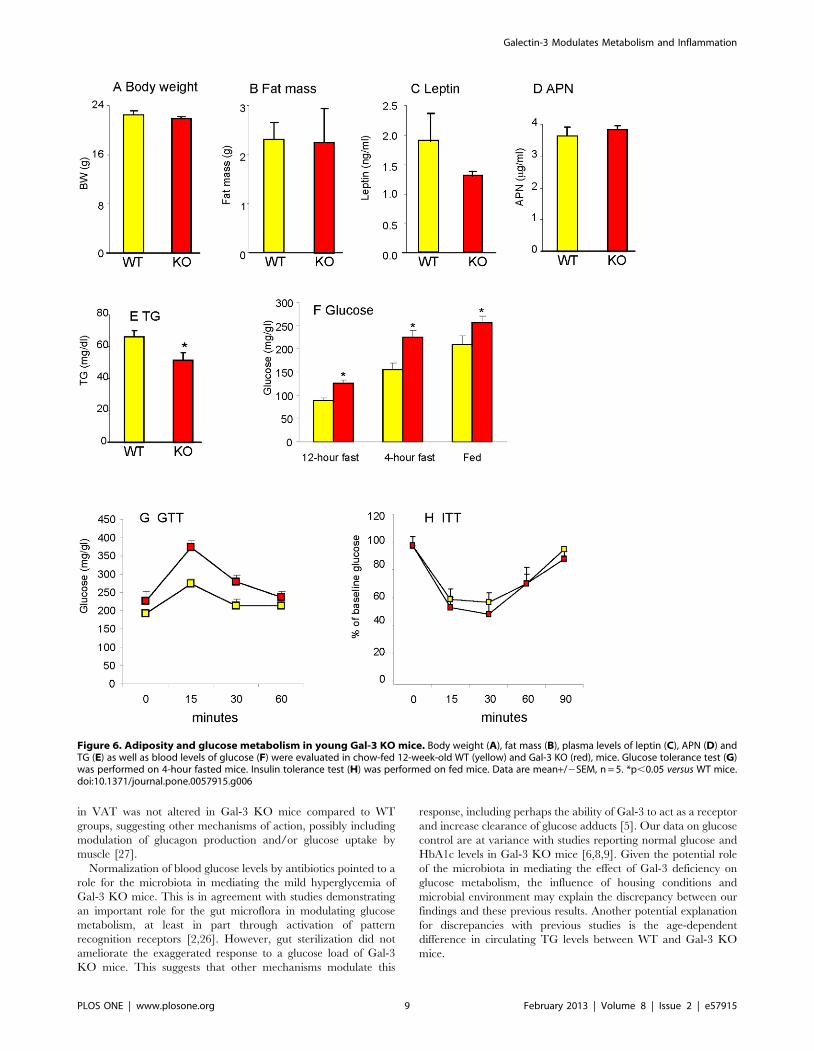
Figure 6A–D, no significant differences in body weight, fat mass,
serum leptin or APN were observed between 12-week-old male
WT and Gal-3 KO mice, with these latter having significantly
lower circulating TG levels compared to WT mice (Fig. 6E).
However, significantly higher blood glucose levels were already
evident at this age in male mice, with mild hyperglycemia being
present irrespective of fasting or fed state (Fig. 6F). Significantly
higher fasting glucose levels were also observed in 12-week-old
female Gal-3 KO versus WT mice (71.0+/25.6 versus 102.3+/
24.7 mg/dl in WT and Gal-3 KO female mice, respectively;
p = 0.013, n = 3). Impaired glucose tolerance with maintained
insulin sensitivity was also already evident in 12-week-old male
Gal-3 KO mice, as indicated by GTT (Area under the curve was
4458+/2386 vs 7507+/2675 in WT and Gal-3 KO mice,
respectively; p = 0.004, n = 5) and ITT (Area under the curve was
2358+/2436 vs 2746+/2669 in WT and Gal-3 KO mice,
respectively, n = 5) (Fig. 6G–H). No significant differences in
expression of PEPCK, PGC-1a, FGF-21 or SAA-1 in liver as well
as APN, CCL2, CD68 or IL-6 in VAT were observed between 12-
week-old male Gal-3 KO and WT mice (not shown). Furthermore,
12-week-old male Gal-3 KO mice did not display neutrophilia
compared to age-matched WT mice (% of neutrophils in blood
was 16.3+/20.5 and 15.3+/21.1 in WT and Gal-3 KO mice,
respectively; n = 5). Thus, alterations in glucose metabolism
precede development of excess adiposity and inflammation in
Gal-3 KO mice.
Effect of antibiotic treatment on glucose control inyoung Gal-3 KO mice
To investigate the potential role of the microbiota in mediating
the effect of Gal-3 deficiency on glucose metabolism, 8-week-old
WT and Gal-3 KO mice received either regular water or water
supplemented with antibiotics for 4 weeks, following a previously
described protocol that successfully normalized glucose metabo-
lism by sterilizing the gastrointestinal tract in TLR2 KO mice
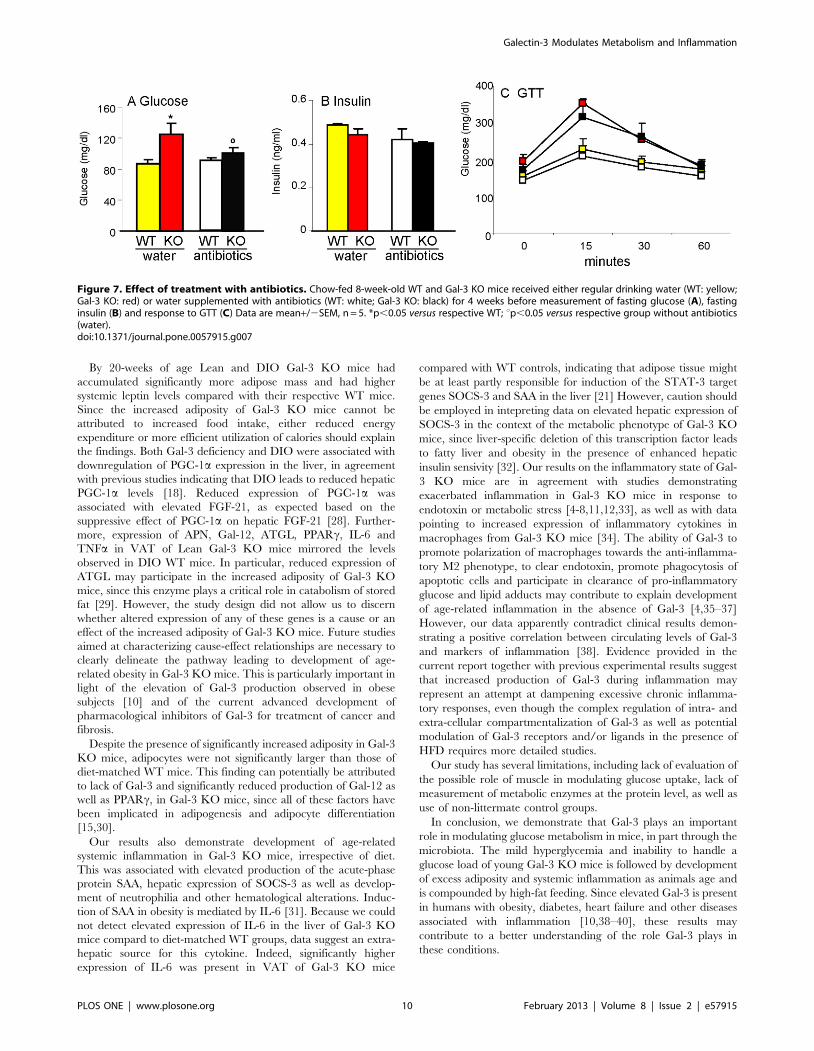
[26]. Antibiotic treatment significantly reduced the elevated fasting
glucose levels of Gal-3 KO mice without affecting glucose levels in
WT mice (Fig. 7A) or insulin levels in either group (Fig 7B).
However, gut sterilization did not ameliorate the excessive
response to GTT of Gal-3 KO mice (Fig. 7C). Thus, sterilization
of the gut normalized fasting glucose levels in young Gal-3 KO
mice, but did not alter the inability of Gal-3 KO mice to properly
dispose a glucose load.
Discussion
In the present report we demonstrate that Gal-3 deficiency in
mice leads to dysregulated glucose metabolism as well as age-
related excess adiposity and inflammation. Studies performed in
12-week-old Gal-3 KO mice indicate that altered glucose
metabolism precedes accumulation of adipose tissue and develop-
ment of inflammation. Moreover, the data point to a potential role
of the microbiota in mediating hyperglycemia in Gal-3 KO mice.
Young Gal-3 KO mice developed mild hyperglycemia and were
unable to effectively clear glucose from the circulation during a
glucose load, in the absence of obesity or systemic inflammation.
This response was exacerbated in older Gal-3 KO mice, especially
when fed a HFD. The presence of chronically elevated glucose
levels in Gal-3 KO mice was confirmed by measurement of
HbA1c, a measure of glycemic control over the life course of
erythrocytes. The impaired glucose tolerance of Gal-3 KO mice
was not due to development of more severe insulin resistance
compared to WT mice, as assessed by ITT. Therefore, we
hypothesized that Gal-3 deficiency might be associated with an
excessive gluconeogenic response and/or with inability to properly
activate insulin-independent disposal of glucose to adipose tissue
through upregulation of Glut-1. However, we found that
expression of gluconeogenic enzymes in the liver and of Glut-1
presented as fold difference versus Lean WT mice after normalization for expression of GAPDH. Data are mean+/2SEM, n = 10. *p,0.05, **p,0.01,***p,0.001 versus respective WT group; up,0.05, uup,0.01, uuup,0.001 versus respective Lean group.doi:10.1371/journal.pone.0057915.g005
Table 1. Hematological parameters in Lean and DIO WT andGal-3 KO mice.
Lean WTLean Gal-3KO DIO WT
DIO Gal-3KO
WBC (103/ml) 9.47+/20.48 9.79+/21.11 10.72+/20.68 12.18+/20.98
# NE (103/ml) 1.68+/20.15 2.53+/20.49 2.21+/20.21 2.86/20.29
# LY (103/ml) 7.43+/20.40 6.80+/20.58 7.94+/20.63 8.63+/20.56
# MO(103/ml) 0.28+/20.03 0.40+/20.12 0.28+/20.04 0.31+/20.06
# EO (103/ml) 0.06+/20.03 0.05+/20.03 0.05+/20.01 0.06+/20.02
# BA (103/ml) 0.02+/20.01 0.02+/20.01 0.01+/20.00 0.01+/20.00
%NE 17.68+/21.34 24.65+/22.69* 21.21+/21.08 25.28+/21.32*
%LY 78.49+/21.61 71.21+/23.19 75.50+/21.46 71.77+/21.51
%MO 2.94+/20.27 3.54+/20.82 2.69+/20.28 2.44+/20.34
%EO 0.69+/20.32 0.47+/20.29 0.49+/20.11 0.45+/20.15
%BA 0.19+/20.10 0.15+/20.10 0.11+/20.05 0.07+/20.02
RBC (106/ml) 9.25+/20.10 9.59+/20.19 10.01+/20.25# 10.42+/20.21#
Hb (g/dl) 13.52+/20.16 11.85+/20.35* 14.32+/20.31 12.79+/20.23*
Hct 44.83+/20.45 36.24+/20.93* 47.86+/21.35 41.20+/20.59*
MCV (fl) 48.50+/20.47 37.83+/20.67* 47.76+/20.40 35.59+/20.65*
MCH (pg/cell) 14.64+/20.12 12.36+/20.25* 14.31+/20.15 12.28+/20.17*
MCHC (g/dl) 31.06+/20.26 32.54+/20.17 31.00+/20.13 31.42+/20.15
RDW (%) 17.56+/20.14 19.72+/20.34* 18.62+/20.10 21.14+/20.29*
Plat (103/ml) 895+/265 1309+/251* 756+/227 1009+/250*
MPV (fl) 4.69+/20.14 4.61+/20.07 4.55+/20.08 4.75+/20.07
White blood cell (WBC) counts, Neutrophil (NE), Lymphocyte (LY), Monocyte(MO), Eosinophil (EO) and Basophil (BA) absolute numbers and percentages,Red Blood cell (RBC) numbers, Hemoglobin (Hb) levels, Hematocrit (Hct), Meancorpuscular volume (MCV), Mean corpuscular hemoglobin (MCH), Meancorpuscular hemoglobin concentration (MCHC), Red cell Distribution Width(RDW), platelet (Plat) number and Mean Platelet Volume (MPV) were evaluatedon EDTA-anticoagulated peripheral blood using a Hemavet 950FS. Data aremean+/2SEM of 8–10 mice per group. *p,0.05 vs respective WT group;up,0.05 vs respective Lean group.doi:10.1371/journal.pone.0057915.t001
Galectin-3 Modulates Metabolism and Inflammation
PLOS ONE | www.plosone.org 8 February 2013 | Volume 8 | Issue 2 | e57915
in VAT was not altered in Gal-3 KO mice compared to WT
groups, suggesting other mechanisms of action, possibly including
modulation of glucagon production and/or glucose uptake by
muscle [27].
Normalization of blood glucose levels by antibiotics pointed to a
role for the microbiota in mediating the mild hyperglycemia of
Gal-3 KO mice. This is in agreement with studies demonstrating
an important role for the gut microflora in modulating glucose
metabolism, at least in part through activation of pattern
recognition receptors [2,26]. However, gut sterilization did not
ameliorate the exaggerated response to a glucose load of Gal-3
KO mice. This suggests that other mechanisms modulate this
response, including perhaps the ability of Gal-3 to act as a receptor
and increase clearance of glucose adducts [5]. Our data on glucose
control are at variance with studies reporting normal glucose and
HbA1c levels in Gal-3 KO mice [6,8,9]. Given the potential role
of the microbiota in mediating the effect of Gal-3 deficiency on
glucose metabolism, the influence of housing conditions and
microbial environment may explain the discrepancy between our
findings and these previous results. Another potential explanation
for discrepancies with previous studies is the age-dependent
difference in circulating TG levels between WT and Gal-3 KO
mice.
Figure 6. Adiposity and glucose metabolism in young Gal-3 KO mice. Body weight (A), fat mass (B), plasma levels of leptin (C), APN (D) andTG (E) as well as blood levels of glucose (F) were evaluated in chow-fed 12-week-old WT (yellow) and Gal-3 KO (red), mice. Glucose tolerance test (G)was performed on 4-hour fasted mice. Insulin tolerance test (H) was performed on fed mice. Data are mean+/2SEM, n = 5. *p,0.05 versus WT mice.doi:10.1371/journal.pone.0057915.g006
Galectin-3 Modulates Metabolism and Inflammation
PLOS ONE | www.plosone.org 9 February 2013 | Volume 8 | Issue 2 | e57915
By 20-weeks of age Lean and DIO Gal-3 KO mice had
accumulated significantly more adipose mass and had higher
systemic leptin levels compared with their respective WT mice.
Since the increased adiposity of Gal-3 KO mice cannot be
attributed to increased food intake, either reduced energy
expenditure or more efficient utilization of calories should explain
the findings. Both Gal-3 deficiency and DIO were associated with
downregulation of PGC-1a expression in the liver, in agreement
with previous studies indicating that DIO leads to reduced hepatic
PGC-1a levels [18]. Reduced expression of PGC-1a was
associated with elevated FGF-21, as expected based on the
suppressive effect of PGC-1a on hepatic FGF-21 [28]. Further-
more, expression of APN, Gal-12, ATGL, PPARc, IL-6 and
TNFa in VAT of Lean Gal-3 KO mice mirrored the levels
observed in DIO WT mice. In particular, reduced expression of
ATGL may participate in the increased adiposity of Gal-3 KO
mice, since this enzyme plays a critical role in catabolism of stored
fat [29]. However, the study design did not allow us to discern
whether altered expression of any of these genes is a cause or an
effect of the increased adiposity of Gal-3 KO mice. Future studies
aimed at characterizing cause-effect relationships are necessary to
clearly delineate the pathway leading to development of age-
related obesity in Gal-3 KO mice. This is particularly important in
light of the elevation of Gal-3 production observed in obese
subjects [10] and of the current advanced development of
pharmacological inhibitors of Gal-3 for treatment of cancer and
fibrosis.
Despite the presence of significantly increased adiposity in Gal-3
KO mice, adipocytes were not significantly larger than those of
diet-matched WT mice. This finding can potentially be attributed
to lack of Gal-3 and significantly reduced production of Gal-12 as
well as PPARc, in Gal-3 KO mice, since all of these factors have
been implicated in adipogenesis and adipocyte differentiation
[15,30].
Our results also demonstrate development of age-related
systemic inflammation in Gal-3 KO mice, irrespective of diet.
This was associated with elevated production of the acute-phase
protein SAA, hepatic expression of SOCS-3 as well as develop-
ment of neutrophilia and other hematological alterations. Induc-
tion of SAA in obesity is mediated by IL-6 [31]. Because we could
not detect elevated expression of IL-6 in the liver of Gal-3 KO
mice compard to diet-matched WT groups, data suggest an extra-
hepatic source for this cytokine. Indeed, significantly higher
expression of IL-6 was present in VAT of Gal-3 KO mice
compared with WT controls, indicating that adipose tissue might
be at least partly responsible for induction of the STAT-3 target
genes SOCS-3 and SAA in the liver [21] However, caution should
be employed in intepreting data on elevated hepatic expression of
SOCS-3 in the context of the metabolic phenotype of Gal-3 KO
mice, since liver-specific deletion of this transcription factor leads
to fatty liver and obesity in the presence of enhanced hepatic
insulin sensivity [32]. Our results on the inflammatory state of Gal-
3 KO mice are in agreement with studies demonstrating
exacerbated inflammation in Gal-3 KO mice in response to
endotoxin or metabolic stress [4-8,11,12,33], as well as with data
pointing to increased expression of inflammatory cytokines in
macrophages from Gal-3 KO mice [34]. The ability of Gal-3 to
promote polarization of macrophages towards the anti-inflamma-
tory M2 phenotype, to clear endotoxin, promote phagocytosis of
apoptotic cells and participate in clearance of pro-inflammatory
glucose and lipid adducts may contribute to explain development
of age-related inflammation in the absence of Gal-3 [4,35–37]
However, our data apparently contradict clinical results demon-
strating a positive correlation between circulating levels of Gal-3
and markers of inflammation [38]. Evidence provided in the
current report together with previous experimental results suggest
that increased production of Gal-3 during inflammation may
represent an attempt at dampening excessive chronic inflamma-
tory responses, even though the complex regulation of intra- and
extra-cellular compartmentalization of Gal-3 as well as potential
modulation of Gal-3 receptors and/or ligands in the presence of
HFD requires more detailed studies.
Our study has several limitations, including lack of evaluation of
the possible role of muscle in modulating glucose uptake, lack of
measurement of metabolic enzymes at the protein level, as well as
use of non-littermate control groups.
In conclusion, we demonstrate that Gal-3 plays an important
role in modulating glucose metabolism in mice, in part through the
microbiota. The mild hyperglycemia and inability to handle a
glucose load of young Gal-3 KO mice is followed by development
of excess adiposity and systemic inflammation as animals age and
is compounded by high-fat feeding. Since elevated Gal-3 is present
in humans with obesity, diabetes, heart failure and other diseases
associated with inflammation [10,38–40], these results may
contribute to a better understanding of the role Gal-3 plays in
these conditions.
Figure 7. Effect of treatment with antibiotics. Chow-fed 8-week-old WT and Gal-3 KO mice received either regular drinking water (WT: yellow;Gal-3 KO: red) or water supplemented with antibiotics (WT: white; Gal-3 KO: black) for 4 weeks before measurement of fasting glucose (A), fastinginsulin (B) and response to GTT (C) Data are mean+/2SEM, n = 5. *p,0.05 versus respective WT; up,0.05 versus respective group without antibiotics(water).doi:10.1371/journal.pone.0057915.g007
Galectin-3 Modulates Metabolism and Inflammation
PLOS ONE | www.plosone.org 10 February 2013 | Volume 8 | Issue 2 | e57915
Materials and Methods
Ethics statementAnimal studies were approved by the Animal Care and Use
Committee of the University of Illinois at Chicago under protocol
A10-008.
AnimalsMale WT and Gal-3 KO mice (B6.Cg-Lgals3tm1Poi/J) on a
C57BL6 background were obtained from The Jackson Laborato-
ries. Animals of the two strains were age-matched but were not
littermates. For induction of DIO, mice were fed a HFD (60
Kcal% fat, 7% Kcal/fructose, Research Diets) ad libitum for 12
weeks beginning at 8 weeks of age, while Lean groups received
standard chow diet. Body composition was evaluated by dual
energy X-ray absorbtiometry (DXA) at time of euthanasia. Blood
was collected in EDTA tubes. After evaluation of hematologic
parameters using the HV950FS (Drew Scientific), 50 ml of blood
were used for flow cytometry analysis as detailed below, while the
remaining blood was centrifuged and plasma obtained and stored
at 270uC for subsequent analysis. The liver was weighed and
portions fixed in formalin for histological analysis and frozen in
liquid nitrogen for gene expression studies. Portions of epidydimal
VAT and of SAT were fixed in formalin for histological analysis
and frozen in liquid nitrogen for gene expression. A second
experiment with the same study design was performed to confirm
results. In a separate experiment, male and female WT and Gal-3
KO mice fed chow diet were studied at 12 weeks of age. Finally, 8-
week-old male WT and Gal-3 KO mice fed chow diet received
either regular drinking water or water supplemented with broad
spectrum antibiotics (1 g/L ampicillin, 1 g/L metronidazole,
0.5 g/L neomycin) for 4 weeks, following a previously described
protocol aimed at sterilizing the gastrointestinal tract [26].
Glucose and insulin tolerance tests and calculation ofinsulin resistance
For GTT, mice were fasted for 4 hours before receiving an ip
injection of 1 g/kg of dextrose. For ITT, fed mice received an ip
injection of 1 IU/Kg of insulin. Blood glucose levels were
measured from a tail nick immediately before injection of glucose
or insulin and at various times thereafter. The Homeostatic Model
of Insulin Resistance (HOMA) 2 index was determined using the
calculator available ar www.dtu.ox.ac.uk/homacalculator/, which
is based on [41].
Measurement of adipocyte size and liver steatosisFormalin-fixed portions of VAT, SAT and liver were sectioned
at 5 mm and stained with hematoxilin-eosin for analysis. For
measurement of adipocyte size in VAT and SAT the software
Image J was used. Specifically, surface area in mm2 was measured
from a total of 100 cells per mouse in three separate fields and the
median value calculated for each tissue in each animal. An
operator blinded to the experimental group performed the
analysis. Scores for livers steatosis were calculated by a pathologist
blinded to the treatment group using the following scale: 0 = ,5%
hepatocytes affected; 1 = 5–33% hepatocytes affected; 2 = 34–66%
hepatocytes affected; 3 = .67% hepatocytes affected. Evaluation
of the type of steatosis (predominantly microvesicular, predomi-
nantly macrovesicular or mixed microvesicular and macrovesicu-
lar) was also performed. Finally, histological presence of inflam-
mation was scored as follows: 0 = ,1 focus per 20X field; 1 = 1–2
foci per 20X field; 2 = 3–4 foci per 20X field; 3 = .4 foci per 20X
field.
Adipose tissue cultureA piece of ,50 mg of VAT was cultured for 24 hours in 24-well
plates in RPMI containing penicillin and streptomycin. The
supernatant was collected and frozen before measurement of
leptin and APN by ELISA.
Separation of adipocytes from the stromo-vascularfraction
Collagenase digestion was used to separate the stromo-vascular
fraction from adipocytes of epididymal VAT obtained from male
20-week-old Lean and DIO mice WT and Gal-3 KO mice, as
previously described [42]. Cells from the stromo-vascular fraction
were used for flow cytometry analysis as described below.
Flow cytometryCells from the stromo-vascular fraction were resuspended in
PBS/BSA prior to surface staining with anti-F4/80 (eBioscience)
and anti-CD11c (BD Biosciences) antibodies. Whole blood was
surface-stained with antibodies directed against Ly6C, Ly6G and
Ly6B (BD Biosciences). Following lysis of erythrocytes, samples
were analyzed on a C6 Accuri cytometer (BD Biosciences).
Measurement of biomarkersBlood glucose was measured using a glucometer and plasma
insulin by ELISA (Alpco). Levels of HbA1c were measured using
A1cNow+ (Bayer). Levels of leptin, APN, IL-6, SAA, OPN and
TIMP-1 were measured using ELISA kits from R&D Systems or
Life Technologies. Levels of TG were measured using a
colorimetric assay from Cayman Chemicals.
RNA expression analysisTotal RNA was isolated from liver, epididymal VAT and SAT
using Trizol and reverse transcribed. Gene expression of ACO,
APN, ATGL, CCL2, CD68, CPT1, FAS, FGF-21, Gal-12,
G6PASE, Glut-1, IL-6, PEPCK, PGC-1a, PPARa, PPARc,
SAA-1, SOCS-3, and TNFa was assessed by real-time RT-PCR
using the TaqMan system and primers from Applied Biosystems
(Foster City, CA). Relative expression was calculated using the
DDCT method after normalizing for expression of GAPDH.
Statistical analysisData are expressed as mean+/2SEM. Statistical significance of
differences was evaluated by ANOVA. Log transformed values
were used when data were not normally distributed. Statistical
analyses were performed with MedCalc (Mariakerke, Belgium).
Acknowledgments
We wish to thanks Dr. Jacob Haus for discussion of metabolic pathways
and for critically reviewing the manuscript.
Author Contributions
Conceived and designed the experiments: GF DHR JP. Performed the
experiments: GF DHR JP MP KJC RTA RJC. Analyzed the data: GF
DHR JP. Contributed reagents/materials/analysis tools: GF DC MP.
Wrote the paper: GF JP MP.
Galectin-3 Modulates Metabolism and Inflammation
PLOS ONE | www.plosone.org 11 February 2013 | Volume 8 | Issue 2 | e57915
References
1. Haffner SM (2007) Abdominal adiposity and cardiometabolic risk: do we have
all the answers? Am J Med 120: S10–16.2. Tremaroli V, Backhed F (2012) Functional interactions between the gut
microbiota and host metabolism. Nature 489: 242–249.3. Norling LV, Perretti M, Cooper D (2009) Endogenous galectins and the control
of the host inflammatory response. J Endocrinol 201: 169–184.
4. Li Y, Komai-Koma M, Gilchrist DS, Hsu DK, Liu FT, et al. (2008) Galectin-3 isa negative regulator of lipopolysaccharide-mediated inflammation. J Immunol
181: 2781–2789.5. Iacobini C, Menini S, Oddi G, Ricci C, Amadio L, et al. (2004) Galectin-3/
AGE-receptor 3 knockout mice show accelerated AGE-induced glomerular
injury: evidence for a protective role of galectin-3 as an AGE receptor. FASEB J18: 1773–1775.
6. Iacobini C, Menini S, Ricci C, Scipioni A, Sansoni V, et al. (2009) Acceleratedlipid-induced atherogenesis in galectin-3-deficient mice. Role of lipoxidation via
receptor-mediated mechanisms. Arterioscler Thromb Vasc Biol 29: 831–836.7. Iacobini C, Oddi G, Menini S, Amadio L, Ricci C, et al. (2005) Development of
age-dependent glomerular lesions in galectin-3/AGE-receptor-3 knockout mice.
Am J Physiol Renal Physiol 289: F611–621.8. Pugliese G, Pricci F, Iacobini C, Leto G, Amadio L, et al. (2001) Accelerated
diabetic glomerulopathy in galectin-3/AGE receptor 3 knockout mice. FASEB J15: 2471–2479.
9. Iacobini C, Menini S, Ricci C, Blasetti Fantauzzi C, Scipioni A, et al. (2011)
Galectin-3 ablation protects mice from diet-induced NASH: A major scavengingrole for galectin-3 in liver. J Hepatol 54: 975–983.
10. Weigert J, Neumeier M, Wanninger J, Bauer S, Farkas S, et al. (2010) Serumgalectin-3 is elevated in obesity and negatively correlates with glycosylated
hemoglobin in type 2 diabetes. J Clin Endocrinol Metab 95: 1404–1411.11. Nomoto K, Nishida T, Nakanishi Y, Fujimoto M, Takasaki I, et al. (2012)
Deficiency in galectin-3 promotes hepatic injury in CDAA diet-induced
nonalcoholic fatty liver disease. ScientificWorldJournal 2012: 959824.12. Nomoto K, Tsuneyama K, Abdel Aziz HO, Takahashi H, Murai Y, et al. (2006)
Disrupted galectin-3 causes non-alcoholic fatty liver disease in male mice. JPathol 210: 469–477.
13. Rhodes DH, Pini M, Castellanos KJ, Montero-Melendez T, Cooper D, et al.
(2012) Adipose tissue specific modulation of galectin expression in lean andobese mice: evidence for regulatory function. Obesity In press.
14. Darrow AL, Shohet RV, Maresh JG (2011) Transcriptional analysis of theendothelial response to diabetes reveals a role for galectin-3. Physiol Genomics
43: 1144–1152.15. Kiwaki K, Novak CM, Hsu DK, Liu F-T, Levine JA (2007) Galectin-3
stimulates preadipocyte proliferation and is up-regulated in growing adipose
tissuw. Obesity 15: 32–39.16. Bechmann LP, Hannivoort RA, Gerken G, Hotamisligil GS, Trauner M, et al.
(2012) The interaction of hepatic lipid and glucose metabolism in liver diseases. JHepatol 56: 952–964.
17. Rossmeisl M, Rim JS, Koza RA, Kozak LP (2003) Variation in type 2 diabetes--
related traits in mouse strains susceptible to diet-induced obesity. Diabetes 52:1958–1966.
18. Barroso E, Rodriguez-Calvo R, Serrano-Marco L, Astudillo AM, Balsinde J, etal. (2011) The PPARbeta/delta activator GW501516 prevents the down-
regulation of AMPK caused by a high-fat diet in liver and amplifies the PGC-1alpha-Lipin 1-PPARalpha pathway leading to increased fatty acid oxidation.
Endocrinology 152: 1848–1859.
19. Fisher FM, Chui PC, Antonellis PJ, Bina HA, Kharitonenkov A, et al. (2010)Obesity is a fibroblast growth factor 21 (FGF21)-resistant state. Diabetes 59:
2781–2789.20. Ge X, Chen C, Hui X, Wang Y, Lam KS, et al. (2011) Fibroblast growth factor
21 induces glucose transporter-1 expression through activation of the serum
response factor/Ets-like protein-1 in adipocytes. J Biol Chem 286: 34533–34541.21. Bonetto A, Aydogdu T, Kunzevitzky N, Guttridge DC, Khuri S, et al. (2011)
STAT3 activation in skeletal muscle links muscle wasting and the acute phaseresponse in cancer cachexia. PLoS One 6: e22538.
22. Pini M, Rhodes DH, Castellanos KJ, Hall AR, Cabay RJ, et al. (2012) Role of
IL-6 in the resolution of pancreatitis in obese mice. J Leukoc Biol 91: 957–966.
23. Savino B, Castor MG, Caronni N, Sarukhan A, Anselmo A, et al. (2012) Control
of murine Ly6C(high) monocyte traffic and immunosuppressive activities by
atypical chemokine receptor D6. Blood 119: 5250–5260.
24. Patsouris D, Li PP, Thapar D, Chapman J, Olefsky JM, et al. (2008) Ablation of
CD11c-positive cells normalizes insulin sensitivity in obese insulin resistant
animals. Cell Metab 8: 301–309.
25. Fantuzzi G (2005) Adipose tissue, adipokines, and inflammation. J Allergy Clin
Immunol 115: 911–919.
26. Caricilli AM, Picardi PK, de Abreu LL, Ueno M, Prada PO, et al. (2011) Gut
microbiota is a key modulator of insulin resistance in TLR 2 knockout mice.
PLoS Biol 9: e1001212.
27. Ramnanan CJ, Edgerton DS, Kraft G, Cherrington AD (2011) Physiologic
action of glucagon on liver glucose metabolism. Diabetes Obes Metab 13 Suppl
1: 118–125.
28. Estall JL, Ruas JL, Choi CS, Laznik D, Badman M, et al. (2009) PGC-1alpha
negatively regulates hepatic FGF21 expression by modulating the heme/Rev-
Erb(alpha) axis. Proc Natl Acad Sci USA 106: 22510–22515.
29. Chakrabarti P, Kandror KV (2011) Adipose triglyceride lipase: a new target in
the regulation of lipolysis by insulin. Curr Diabetes Rev 7: 270–277.
30. Yang R-Y, Hsu DK, Yu L, Chen H-Y, Liu F-T (2004) Galectin-12 is required
for adipogenic signaling and adipocyte differentiation. J Biol Chem 279: 29761–
29766.
31. Pini M, Rhodes DH, Fantuzzi G (2011) Hematological and acute-phase
responses to diet-induced obesity in IL-6 KO mice. Cytokine 56: 708–716.
32. Sachithanandan N, Fam BC, Fynch S, Dzamko N, Watt MJ, et al. (2010) Liver-
specific suppressor of cytokine signaling-3 deletion in mice enhances hepatic
insulin sensitivity and lipogenesis resulting in fatty liver and obesity. Hepatology
52: 1632–1642.
33. Iacobini C, Menini S, Ricci C, Scipioni A, Sansoni V, et al. (2009) Advanced
lipoxidation end-products mediate lipid-induced glomerular injury: role of
receptor-mediated mechanisms. J Pathol 218: 360–369.
34. Ferraz LC, Bernardes ES, Oliveira AF, Ruas LP, Fermino ML, et al. (2008)
Lack of galectin-3 alters the balance of innate immune cytokines and confers
resistance to Rhodococcus equi infection. Eur J Immunol 38: 2762–2775.
35. MacKinnon AC, Farnworth SL, Hodkinson PS, Henderson NC, Atkinson KM,
et al. (2008) Regulation of alternative macrophage activation by galectin-3. J
Immunol 180: 2650-2658.
36. Sano H, Hsu DK, Apgar JR, Yu L, Sharma BB, et al. (2003) Critical role of
galectin-3 in phagocytosis by macrophages. J Clin Invest 112: 389–397.
37. Vlassara H, Li YM, Imani F, Wojciechowicz D, Yang Z, et al. (1995)
Identification of galectin-3 as a high-affinity binding protein for advanced
glycation end products (AGE): a new member of the AGE-receptor complex.
Mol Med 1: 634–646.
38. de Boer RA, Lok DJ, Jaarsma T, van der Meer P, Voors AA, et al. (2011)
Predictive value of plasma galectin-3 levels in heart failure with reduced and
preserved ejection fraction. Ann Med 43: 60–68.
39. de Boer RA, van Veldhuisen DJ, Gansevoort RT, Muller Kobold AC, van Gilst
WH, et al. (2011) The fibrosis marker galectin-3 and outcome in the general
population. J Intern Med.
40. de Boer RA, Voors AA, Muntendam P, van Gilst WH, van Veldhuisen DJ
(2009) Galectin-3: a novel mediator of heart failure development and
progression. Eur J Heart Fail 11: 811–817.
41. Levy JC, Matthews DR, Hermans MP (1998) Correct homeostasis model
assessment (HOMA) evaluation uses the computer program. Diabetes Care 21:
2191–2192.
42. Li P, Lu M, Nguyen MT, Bae EJ, Chapman J, et al. (2010) Functional
heterogeneity of CD11c-positive adipose tissue macrophages in diet-induced
obese mice. J Biol Chem 285: 15333–15345.
Galectin-3 Modulates Metabolism and Inflammation
PLOS ONE | www.plosone.org 12 February 2013 | Volume 8 | Issue 2 | e57915
Related Documents