1 Income Indicators for the EU’s Social Inclusion Strategy Isabelle Maquet-Engsted Social Protection Committee European Commission David Stanton Social Protection Committee European Commission Abstract This paper explains how income indicators are used in the European Strategy for Social Inclusion. It describes how agreeing on a common analytical framework to poverty and its determinants can help Member States within the EU learning from each other about important social policy issues such as understanding differences in child poverty. In the concluding section, the paper considers how well the use of indicators helps understanding how different social policies work. The political endorsement and use of income indicators drawn from a common data base is a major achievement of the European policy coordination process. Keywords: Indicators, poverty, social policy Isabelle Maquet Secretary to the Indicators Sub Group of the Social Protection Committee David Stanton Chair of the Indicators Sub Group

Welcome message from author
This document is posted to help you gain knowledge. Please leave a comment to let me know what you think about it! Share it to your friends and learn new things together.
Transcript

1
Income Indicators for the EU’s Social Inclusion Strategy
Isabelle Maquet-Engsted
Social Protection Committee European Commission
David Stanton Social Protection Committee
European Commission
Abstract This paper explains how income indicators are used in the European Strategy for Social Inclusion. It describes how agreeing on a common analytical framework to poverty and its determinants can help Member States within the EU learning from each other about important social policy issues such as understanding differences in child poverty. In the concluding section, the paper considers how well the use of indicators helps understanding how different social policies work. The political endorsement and use of income indicators drawn from a common data base is a major achievement of the European policy coordination process.
Keywords: Indicators, poverty, social policy
Isabelle Maquet Secretary to the Indicators Sub Group of the Social Protection Committee
David Stanton
Chair of the Indicators Sub Group

2
INTRODUCTION
This paper concentrates on the income indicators used in the EU’s Social Inclusion Strategy, considers the strength of the way in which we measure poverty and make use of the portfolio of agreed indicators, and looks at other supplementary ways of understanding the differences in the number of people living on low incomes.
THE OPEN METHOD OF COORDINATION
The fight against poverty is a long term commitment of the Member States of the European Union and an essential element of the Union's ten years strategic goal of sustained economic growth, more and better jobs and greater social cohesion. When the Lisbon strategy was launched in 2000, European governments had very different views on how to conduct the structural reforms needed to reach this goal. Heads of States therefore opted for a voluntary, flexible and decentralised form of cooperation – the so-called Open Method of Coordination (OMC). Cooperation in the fight against poverty rests on regular reporting, peer pressure and mutual learning. (See Box 1). It involves:
• Agreeing common objectives;
• Agreeing a set of common indicators;
• Preparing national strategic reports;
• Evaluating these strategies jointly with the European Commission and the Member States;
• Learning from each others through a series of tools supported by the Commission such as peer reviews, study programs, networks, etc.
In the absence of any binding mechanism, a large part of the effectiveness of the method lies on the capacity to analyse thoroughly the situation of Member States in an international context. It is also crucial to be able to assess whether the policy priorities and corresponding policy tools they have identified at national level are appropriate to meet the commonly agreed objectives. This analytical capacity rests on the commonly agreed indicators which Member States have identified through a collective and consensual process to reflect their situation vis-à-vis the common objectives. In order to ensure the transparency and legitimacy of the assessment, EU’s analytical capacity also needs a common and agreed framework on how to use and interpret the common EU indicators. The development of indicators and of the analytical framework is carried out by the Indicators Sub-Group (ISG) of the Social Protection Committee. It was set-up in 2001 and gathers representatives of the 27 national governments that are

3
experts in monitoring policies in the field of social inclusion1. The work of the group is supported by the European Commission’s policy analysts (DG Employment, Social Affairs and equal opportunities) and statisticians (Eurostat). Finally, it draws on academic expertise, notably on the 2001 and 2006 reports on indicators for the EU social inclusion strategy, by Marlier et al2. The ISG is also a key stakeholder in the development of EU level statistical capacity and especially in the development of EU-SILC (see below). Indicators are developed with the help of the ISG’s expertise and following strict quality criteria3, but they are also subject to empirical validation using available data and then consensually adopted by all 27 Member States. The political endorsement of the indicators by the Social Protection Committee or by the Council of ministers (Laeken 2001) constitutes the specific strength of the EU portfolio of social indicators. Box1: The Open Method of Coordination in the field of social protection and social inclusion In the context of the OMC, social policy remains under the full competency of Member States. In order to coordinate their action, Member States agree on common goals (e.g. making a decisive
impact on the eradication of poverty)4 and on common indicators used to monitor progress and
compare best practices. Member States translate the common goals into their own strategic objectives, and regularly report on the policies they put in place to reach these objectives. The National Strategy Reports are analysed and assessed at EU level, and common policy conclusions drawn from this analysis are jointly adopted by the European Commission and Member States in the yearly Joint Report on Social Protection and Social Inclusion. The EU runs an action program to support mutual learning through a variety of instruments: financing of EU stakeholder networks, peer reviews on specific policy issues, independent experts network, round table, EU meeting of people experiencing poverty, transnational and awareness raising projects, studies, data collection…
Action at European level has increased political awareness of poverty and exclusion and placed the fight against poverty higher on national political agendas. It encouraged Member States to critically examine their policies. It highlighted how countries perform well in certain areas, spurring on other Member States to perform better. It also created a better basis for policy making by involving a range of actors such as NGOs, social partners, local and regional authorities and those working with people in poverty. The method also allowed creating a clear consensus about a number of common key priorities in the fight against poverty and social exclusion: child poverty, active inclusion, decent housing for all, etc…
This paper is not intended to cover all the indicators used but concentrate on the income indicators only5. Before discussing the income indicators and how they
1 When the OMC was extended to the field of pensions and health care reforms, indicators
experts in these two areas also joined the sub-group. 2 Atkinson A.B; et al. (2001) and Atkinson A.B; et al. (2007)
3 See quality criteria and list of indicators in European Commission (2009b)
4 A full description of the agreed common objectives in European Commission (2005)
5 The latest analysis of the complete list of OMC indicators is available in European Commission
(2008c)

4
have worked in the open method of coordination, we need to say something about one of the great statistical achievements, the EU Survey of Income and Living Conditions EU-SILC.
EU-SILC
EU-SILC (Community Statistics on Income and Living Conditions) is a household based survey organised under a Framework Regulation of the European Parliament and the Council (N°1177/2003). It is the reference source at EU level for statistics on income and living conditions and for common indicators for social inclusion in particular. EU-SILC was launched in 2003 on the basis of a 'gentleman’s agreement' in six Member States (Belgium, Denmark, Greece, Ireland, Luxembourg, and Austria) as well as in Norway. Since 2005, EU-SILC covers the then 25 EU Member States plus Norway and Iceland. Bulgaria, Romania, Switzerland and Turkey have launched EU-SILC in 2007. A key objective of EU-SILC is to deliver robust and comparable data on total disposable household income. Income components were defined to follow as closely as possible the international recommendations of the UN ‘Canberra Manual’6. The EU-SILC definition of total household disposable income used excludes imputed rent as well as non monetary income components, and thus in particular value of goods produced for own consumption and non-cash employee income except company car. The income reference period is a fixed 12-month period (such as the previous calendar or tax year) for all countries except UK for which the income reference period is the current year and IE for which the survey is continuous and income is collected for the last twelve months. In the so called register countries (Denmark, Norway, Iceland, Netherlands, Sweden, Finland and Slovenia), most income components and some demographic information are obtained through administrative registers while other personal information is collected through interviews. In all other countries, the full information is obtained through surveys. EU-SILC provides two types of annual data, cross-sectional (pertaining to a given time or a certain time period) and longitudinal (pertaining to individual-level changes over time usually over a four-year period). The 2007 survey has just been released and for most countries this refers to income received in 2006. This year, 2009, is the first year when there will be 4
6 United Nations (2001) or http://www.lisproject.org/links/canberra/finalreport.pdf

5
years of panel data for the 15 countries that implemented SILC in 2004 and 3 years of panels for the others. The achieved sample size equals 200.000 households (around 440.000 adults) for the EU as a whole (including Norway and Iceland). In all countries, standard errors have been calculated and the quality measured by the 95% confidence interval for the key indicator – the at-risk-poverty rate - is impressive, at around 1 percentage point. A full report on the progress made with EU-SILC can be found in a report to the European Parliament7. There will of course be areas that need some attention: two countries have two income surveys: EU-SILC and a separate one that is used for policy analysis and policy monitoring and evaluation. An important determinant of future improvements will be the extent to which the data gets used in the Open Method of Coordination but also in the research and academic world. In this context, it is worth noting the value of forums or research networks involving both data producers and data users (e.g., the Eurostat-funded Network for the analysis of EU-SILC (NET-SILC)). The work programme covers eight broad areas and the areas that are most relevant to income indicators are "Methodological issues", "Income distribution" and "Poverty and Deprivation". The quality of the data will continue to improve. Nevertheless it is important to remember what the survey cannot do even if all efforts at improving the data exceed expectations. First, and perhaps most important for monitoring social exclusion, the data by definition does not cover people not living in households: those in institutions and those who are homeless and outside the sampling frame for a household survey. These people are the most socially excluded but no household based survey can monitor the welfare of this group. Second, there is a need to further improve the timeliness of the data as explained before. Finally in most of the Member States the income data refers to year t-1 and the household information to year t. If households remain unchanged there is no problem but where households are newly formed the income collected is relevant to the household in the previous year not the household in the survey year.
7 Report from the Commission to the Council and to the European Parliament on the
implementation of Regulation (EC) No 1177/2003 of the European Parliament and of the Council of 16 June 2003 or latest assessment available in http://circa.europa.eu/Public/irc/dsis/eusilc/library?l=/quality_assessment/comparative_quality_1/co
mparative_2005/_EN_1.0_&a=d
6
INCOME INDICATORS IN THE OPEN METHOD OF CO-ORDINATION
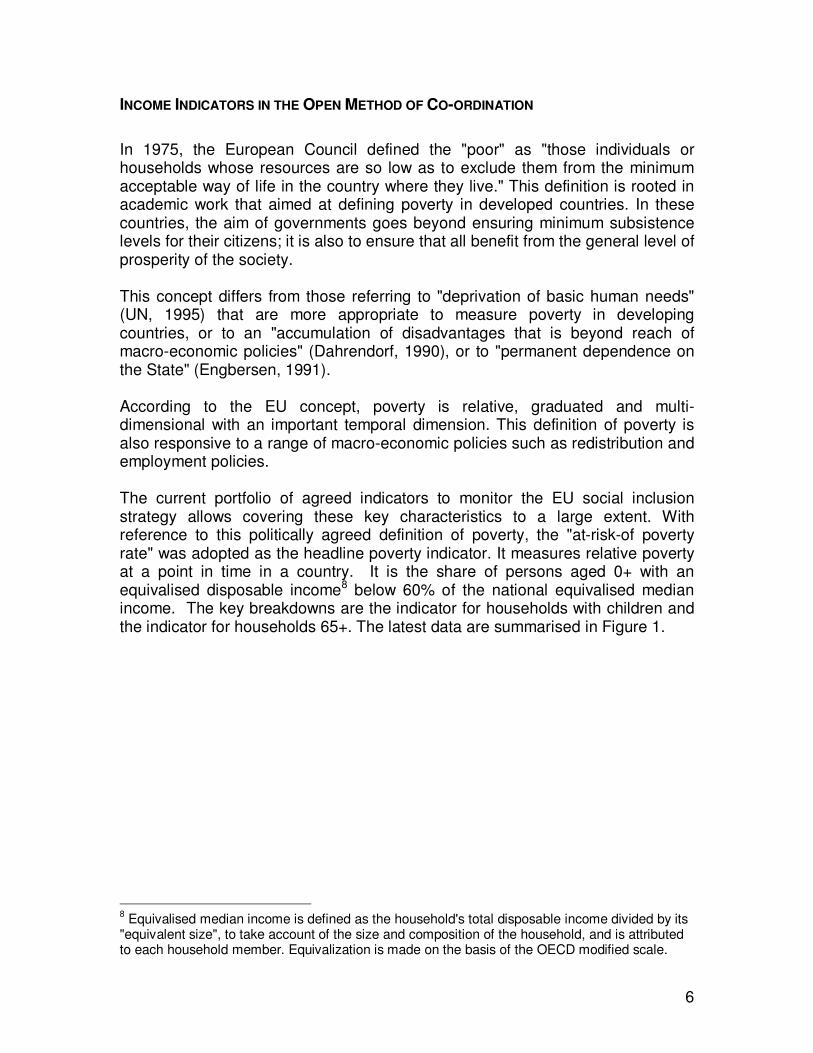
In 1975, the European Council defined the "poor" as "those individuals or households whose resources are so low as to exclude them from the minimum acceptable way of life in the country where they live." This definition is rooted in academic work that aimed at defining poverty in developed countries. In these countries, the aim of governments goes beyond ensuring minimum subsistence levels for their citizens; it is also to ensure that all benefit from the general level of prosperity of the society. This concept differs from those referring to "deprivation of basic human needs" (UN, 1995) that are more appropriate to measure poverty in developing countries, or to an "accumulation of disadvantages that is beyond reach of macro-economic policies" (Dahrendorf, 1990), or to "permanent dependence on the State" (Engbersen, 1991). According to the EU concept, poverty is relative, graduated and multi-dimensional with an important temporal dimension. This definition of poverty is also responsive to a range of macro-economic policies such as redistribution and employment policies. The current portfolio of agreed indicators to monitor the EU social inclusion strategy allows covering these key characteristics to a large extent. With reference to this politically agreed definition of poverty, the "at-risk-of poverty rate" was adopted as the headline poverty indicator. It measures relative poverty at a point in time in a country. It is the share of persons aged 0+ with an equivalised disposable income8 below 60% of the national equivalised median income. The key breakdowns are the indicator for households with children and the indicator for households 65+. The latest data are summarised in Figure 1.
8 Equivalised median income is defined as the household's total disposable income divided by its
"equivalent size", to take account of the size and composition of the household, and is attributed to each household member. Equivalization is made on the basis of the OECD modified scale.

7
Figure 1: At risk poverty rate EU 27
0
5
10
15
20
25
30
35
EU
-27
EU
-15
NM
S-1
0
Cze
ch
Rep
ublic
Neth
erla
nd
s
Slo
va
kia
Sw
eden
De
nm
ark
Hung
ary
Aus
tria
Slo
ve
nia
Fra
nc
e
Fin
lan
d
Lu
xem
bo
urg
Malt
a
Belg
ium
Ge
rmany
Cyp
rus
Po
lan
d
Irela
nd
Port
uga
l
Esto
nia
Lithu
an
ia
Unit
ed K
ingd
om
#N
/A
Spa
in
Ita
ly
Latv
ia
Bulg
ari
a
Rom
ania
% o
f c
on
ce
rne
d p
op
ula
tio
nTotal population
Elderly (65+)
Children (0-17)
51% for
elderly in
CY
Source: SILC 2007, Income data 2006; except for UK, income year 2007 and for IE moving income reference period (2006-2007) EU-27: Weighted average for the 27 Member States of the European Union. EU-15: weighted average for the 15 “old” Members
9; NMW-10: weighted average for the 10 New Members
10
This “overarching” indicator should be presented and used together with the other income indicators related to social inclusion that help capturing the multiple facets of income poverty. The at-risk of poverty rate is related to the overall level of income inequalities An important element of context to analyse the at-risk of poverty rate is the overall level of inequality of the income distribution in the country. Two indicators relate to this: the gini coefficient and the ratio of the shares of income enjoyed by the top and bottom quintile S80/S20. On average in the European Union, the total income received by the 20% richest is 5 times higher than the total income received by the 20% poorest. However, the ratio varies greatly across EU Member States, from less than 4 to more than 6 in four countries. While most of the wealthy Member States are among those with the lowest levels of inequalities, countries with lower GDP per capita can be found among both the most equal and unequal income distributions.
9 15 old Member States (EU before 2004): Belgium, Denmark, Germany, Ireland, Greece, Spain, France, Italy,
Luxembourg, the Netherlands, Austria, Portugal, Finland, Sweden, the United Kingdom. 10
10 New Member States (joined the EU in 2004): Czech Republic, Estonia, Cyprus, Latvia, Lithuania, Hungary, Malta,
Poland, Slovakia, Slovenia.

8
Figure 2: Income inequalities: gini coefficients and income quintile share ratio, EU 27
0
1
2
3
4
5
6
7
8
9
10E
U-2
7
EU
-15
NM
S-1
0
Sw
eden
Slo
venia
Slo
vakia
Czech R
epub
lic
Denm
ark
Austr
ia
Belg
ium
Fin
land
Fra
nce
Hungary
Malt
a
Luxem
bourg
Neth
erlands
Cypru
s
Germ
an
y
Spain
Irela
nd
Italy
Pola
nd
Esto
nia
United K
ingdom
Gre
ece
Lithuania
Bulg
ari
a
Latv
ia
Port
ugal
Rom
ania
0
10
20
30
40
50
60
S80/S20 (left axis) Gini coefficient (right axis)
Source: SILC 2007, Income data 2006; except for UK, income year 2007 and for IE moving income reference period (2006-2007);
Poverty is graduated The at-risk-of poverty rate needs to be interpreted together with an indicator that help us understand the shape of the income distribution around the 60% threshold and this is why in the “strand” indicators there are the risk of poverty rates using 40% 50% and 70% of the median income. In the EU as a whole, 5% of the total population (or 1/3 of the poor population) live on an income below 40% of the median income in their country, 10% below 50%, and 24% below 70%. This shows that nearly 2/3 of the population at risk of poverty would need a significant increase of at least +20% in their equivalised income to lift them out of poverty, and for 1/3 an increase of at least +50% would be necessary. Countries with similar at-risk-of-poverty rates calculated in relation to the 60% thresholds show significant variations in the number of people who are poor when more severe criteria (lower thresholds) are used. Among the countries with poverty rates below 15%, the Czech Republic, the Netherlands, Denmark and Austria have the lowest shares of very poor people. Ireland has the lowest share of very poor people among the countries with higher poverty rates.

9
Figure 3: At risk poverty rate EU 27 at different thresholds
0
5
10
15
20
25
30
35
EU
-27
EU
-15
NM
S-1
0
Cz
ech R
epu
blic
Slo
vak
ia
Sw
ed
en
Denm
ark
Neth
erlan
ds
Austr
ia
Slo
ven
ia
Hu
ngary
Fra
nce
Lu
xem
bourg
Fin
land
Belg
ium
Germ
any
Cypru
s
Ma
lta
Pola
nd
Irela
nd
Lit
huania
Po
rtugal
Esto
nia
Italy
Unite
d K
ingdom
Gre
ece
Spain
Bulg
aria
Latv
ia
Rom
ania
% o
f to
tal
po
pu
lati
on
40% 50% 60% 70%
Source: Eurostat — EU-SILC (2007); income year 2006; except for UK (income year 2007) and for IE (moving income reference period 2006-07);
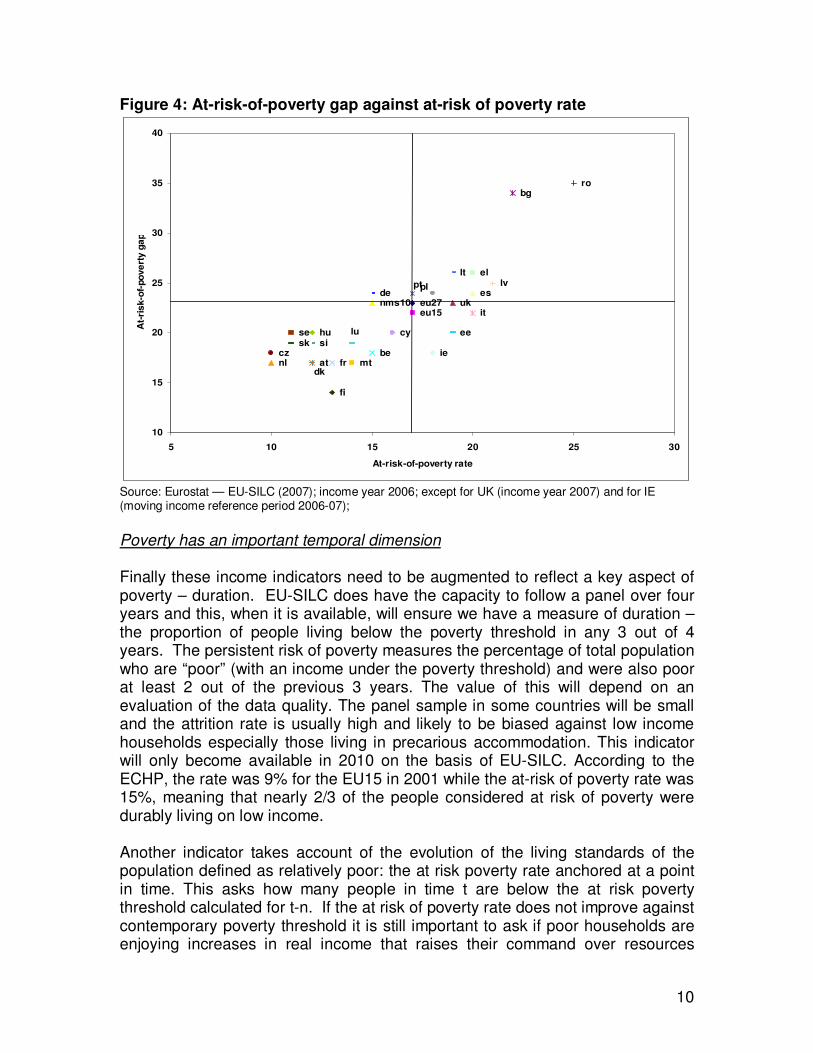
The depth of poverty is measured by the gap between the 60% threshold and the median income of the poor. In 2007 in the EU, the median income of people at risk of poverty was 22% lower than the poverty threshold. As illustrated in Figure 4, poverty tends to be more severe in countries where the shares of people at risk of poverty are highest (countries in the top right-hand corner of the graph).
10
Figure 4: At-risk-of-poverty gap against at-risk of poverty rate
eu27eu15
nms10
be
bg
cz
de
ee
ie
el
es
fr
it
cy
lvlt
hu
mtnl at
ro
sisk
fi
se
uk
dk
lu
plpt
10
15
20
25
30
35
40
5 10 15 20 25 30
At-risk-of-poverty rate
At-
ris
k-o
f-po
ve
rty
ga
p
Source: Eurostat — EU-SILC (2007); income year 2006; except for UK (income year 2007) and for IE (moving income reference period 2006-07);
Poverty has an important temporal dimension Finally these income indicators need to be augmented to reflect a key aspect of poverty – duration. EU-SILC does have the capacity to follow a panel over four years and this, when it is available, will ensure we have a measure of duration – the proportion of people living below the poverty threshold in any 3 out of 4 years. The persistent risk of poverty measures the percentage of total population who are “poor” (with an income under the poverty threshold) and were also poor at least 2 out of the previous 3 years. The value of this will depend on an evaluation of the data quality. The panel sample in some countries will be small and the attrition rate is usually high and likely to be biased against low income households especially those living in precarious accommodation. This indicator will only become available in 2010 on the basis of EU-SILC. According to the ECHP, the rate was 9% for the EU15 in 2001 while the at-risk of poverty rate was 15%, meaning that nearly 2/3 of the people considered at risk of poverty were durably living on low income. Another indicator takes account of the evolution of the living standards of the population defined as relatively poor: the at risk poverty rate anchored at a point in time. This asks how many people in time t are below the at risk poverty threshold calculated for t-n. If the at risk of poverty rate does not improve against contemporary poverty threshold it is still important to ask if poor households are enjoying increases in real income that raises their command over resources

11
compared with the real incomes received in previous years. The "anchored poverty rate" is defined as the risk of poverty associated with a 60% threshold fixed at a point in time, and adjusted for inflation. In figure 5, the indicator is put in relation to the average GDP growth prevailing in each country from 2004 to 2006. This illustrates that in all countries (except Luxembourg) with high GDP growth (>5% per year) over the 3 years period, the anchored poverty rate was dramatically reduced. In these countries the benefits of growth also reached those that were at the bottom of the income distribution in the base year by raising their living standards in comparison to previous years. However, since high growth tends to raise median income in a country, the relative position of the poor does not necessarily improve. In this group of countries the number of people living under the current poverty threshold only decreased in Poland (from 21% to 17%), Slovakia (from 13% to 11%) and Lithuania (from 21% to 19%). In all other high growth countries, relative poverty remained stable. The impact of growth on real incomes of the people at-risk of poverty is less clear for the second group of countries with average GDP growth rates between 3 and 5%. In Greece, Finland and Sweden for instance, the anchored poverty rate remain virtually unchanged despite a fair level of GDP growth. Figure 5: At-risk of poverty rate anchored at a point in time (2005) by average GDP growth; 2005-2007
0
5
10
15
20
25
EU
-25
Po
rtu
ga
l
Ita
ly
Ge
rma
ny
Fra
nc
e
Un
ite
d
Kin
gd
om
Ne
the
rla
nd
s
Be
lgiu
m
Ma
lta
De
nm
ark
Au
str
ia
Sp
ain
Fin
lan
d
Sw
ed
en
Cy
pru
s
Gre
ec
e
Hu
ng
ary
Slo
ve
nia
Po
lan
d
Lu
xe
mb
ou
rg
Ire
lan
d
Cze
ch
Re
pu
bli
c
Slo
va
kia
Lit
hu
an
ia
Es
ton
ia
La
tvia
Average
GDP growth
below 2%
Average GDP growth between
2% and 3%
Average GDP growth between
3% and 5%
Average GDP growth greater than
5%
2005 2006 2007
Source: Eurostat — AMECO database (GDP) and EU-SILC (2007, 2006 and 2005); income year 2006-05-04; except for UK (income year 2007-06-05) and for IE (moving income reference period 2006-07, 05-06, 04-05); BG and RO missing

12
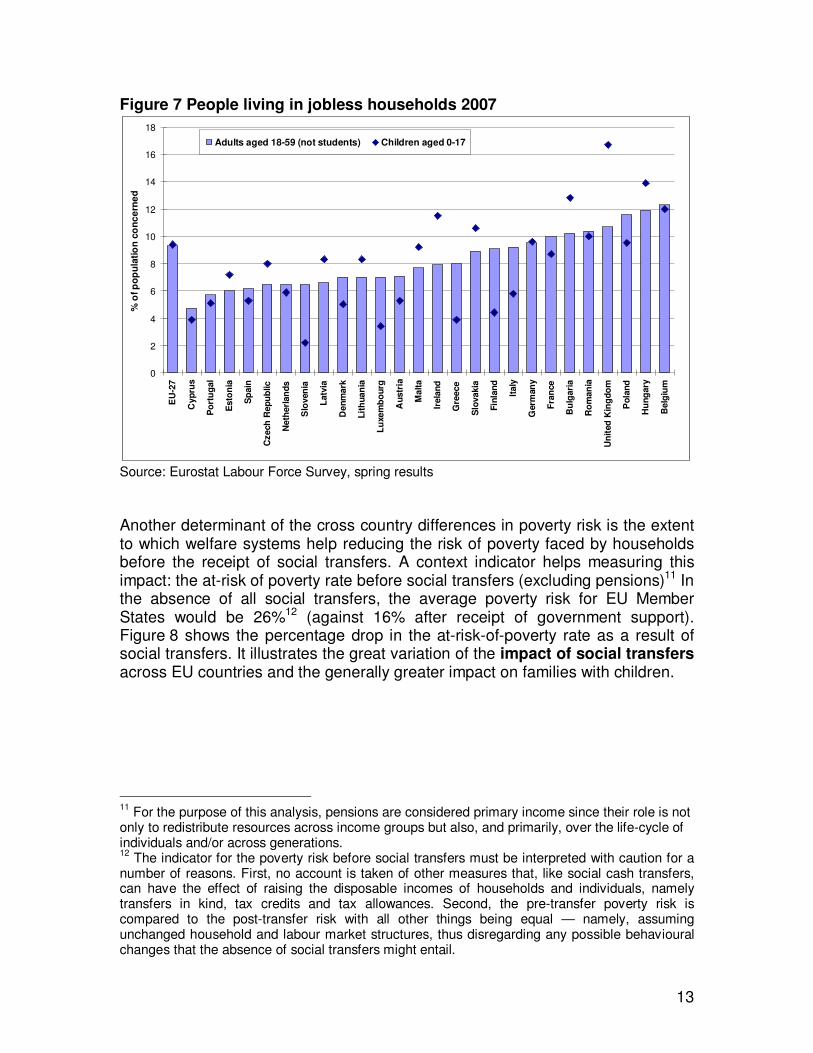
The main determinants of the risk of poverty Even on its own, the stark comparison of the data raises questions worth answering. Why can the Nordic countries with high household incomes achieve low at risk poverty rates? Why does the UK have one of the highest at risk poverty rate for households with children when its household income is also high? What drives the comparatively favourable position of the elderly in Poland, Slovakia and Hungary? Because this indicator has raised important questions, it is clear that other indicators related to the overall picture are needed. The importance of employment led to the addition of two employment related indicators: proportion of people living in jobless households and the at risk poverty rate for households with at least one person who worked. Households where no one works are at much higher risk of poverty but it is also usually true that the number at risk of poverty in work is greater. The indicator on jobless households is not strictly an income indicator but it is a complement to the working poor indicator. Figure 6: In work poverty: at risk of poverty rate of people in employment- EU-SILC 2007
0
2
4
6
8
10
12
14
16
18
20
EU
-27
EU
-15
NM
S-1
0
Cze
ch
Re
pu
blic
Be
lgiu
m
De
nm
ark
Ma
lta
Ne
the
rla
nd
s
Slo
ve
nia
Slo
va
kia
Fin
lan
d
Bu
lga
ria
Ire
lan
d
Fra
nce
Cyp
rus
Hu
ng
ary
Au
str
ia
Ge
rma
ny
Sw
ed
en
Esto
nia
Lith
ua
nia
Un
ite
d K
ing
do
m
Lu
xe
mb
ou
rg
Ita
ly
La
tvia
Po
rtu
ga
l
Sp
ain
Po
lan
d
Gre
ece
Ro
ma
nia
% o
f p
eo
ple
em
plo
ye
d a
ge
d 1
8 o
r m
ore
Source: Eurostat — EU-SILC (2007); income year 2006; except for UK (income year 2007) and for IE (moving income reference period 2006-07);
13
Figure 7 People living in jobless households 2007
0
2
4
6
8
10
12
14
16
18
EU
-27
Cyp
rus
Po
rtu
gal
Esto
nia
Sp
ain
Czech
Rep
ub
lic
Neth
erl
an
ds
Slo
ven
ia
Latv
ia
Den
mark
Lit
hu
an
ia
Lu
xem
bo
urg
Au
str
ia
Malt
a
Irela
nd
Gre
ece
Slo
vakia
Fin
lan
d
Italy
Germ
an
y
Fra
nce
Bu
lgari
a
Ro
man
ia
Un
ited
Kin
gd
om
Po
lan
d
Hu
ng
ary
Belg
ium
% o
f p
op
ula
tio
n c
on
ce
rne
dAdults aged 18-59 (not students) Children aged 0-17
Source: Eurostat Labour Force Survey, spring results
Another determinant of the cross country differences in poverty risk is the extent to which welfare systems help reducing the risk of poverty faced by households before the receipt of social transfers. A context indicator helps measuring this impact: the at-risk of poverty rate before social transfers (excluding pensions)11 In the absence of all social transfers, the average poverty risk for EU Member States would be 26%12 (against 16% after receipt of government support). Figure 8 shows the percentage drop in the at-risk-of-poverty rate as a result of social transfers. It illustrates the great variation of the impact of social transfers across EU countries and the generally greater impact on families with children.
11
For the purpose of this analysis, pensions are considered primary income since their role is not only to redistribute resources across income groups but also, and primarily, over the life-cycle of individuals and/or across generations. 12
The indicator for the poverty risk before social transfers must be interpreted with caution for a number of reasons. First, no account is taken of other measures that, like social cash transfers, can have the effect of raising the disposable incomes of households and individuals, namely transfers in kind, tax credits and tax allowances. Second, the pre-transfer poverty risk is compared to the post-transfer risk with all other things being equal — namely, assuming unchanged household and labour market structures, thus disregarding any possible behavioural changes that the absence of social transfers might entail.

14
Figure 8: Impact of social transfers (excl. pensions): Reduction in at-risk-of-poverty rate in % of poverty rate before transfers, 2007
0
10
20
30
40
50
60
70E
U-2
7
EU
-15
NM
S-1
0
Bulg
ari
a
Gre
ec
e
Spain
Italy
Rom
ania
Latv
ia
Cypru
s
Esto
nia
Po
rtugal
Lit
huania
Ma
lta
Unite
d K
ingdom
Pola
nd
Slo
vak
ia
Lux
em
bourg
Germ
any
Irela
nd
Belg
ium
Slo
ven
ia
Cz
ech R
epu
blic
Fra
nce
Austr
ia
Neth
erlan
ds
Fin
lan
d
Denm
ark
Hu
ngary
Sw
ed
en
Source: Eurostat — EU-SILC (2007); income year 2006; except for UK (income year 2007) and for IE (moving income reference period 2006-07)
At-risk of poverty rates and the diversity of living standards across EU Member States When the indicators were first developed it was agreed that the poverty threshold used in each member state should be national. Social exclusion is about how you compare yourself with others in the society in which you live. Pragmatically this also resonated with the acceptance that social policy is a Member State responsibility rather than a policy area determined at EU level. Nevertheless it was felt that the different at risk of poverty rates needed to be put in context by the use of another indicator, the poverty threshold in each country. The threshold for each Member State is shown in figure 9 for an illustrative one person household. Even if the values are expressed in purchasing power standards (PPS) to take account of the differences in the cost of living across countries, and if we consider Luxembourg as an outlier, the value of the poverty threshold in the richest countries is nearly five times higher than in the poorest.

15
Figure 9 Poverty threshold - 2007 yearly disposable income for a single person household, - in euros and in PPS
0
2000
4000
6000
8000
10000
12000
14000
16000
18000
20000
Bulg
aria
Rom
ania
Lith
uania
Latv
ia
Pola
nd
Hungary
Slo
vakia
Esto
nia
Czech R
epublic
Port
ugal
Malta
Slo
venia
Gre
ece
Spain
Italy
Cypru
s
Fra
nce
Belg
ium
Germ
any
Neth
erlands
Austr
ia
Sw
eden
Fin
land
Unite
d K
ingdom
Irela
nd
Denm
ark
Luxem
bourg
Eu
ros
or
PP
S
euros
purchasing power standards
Source: SILC 2007, Income data 2006; except for UK, income year 2007 and for IE moving income reference period (2006-2007);
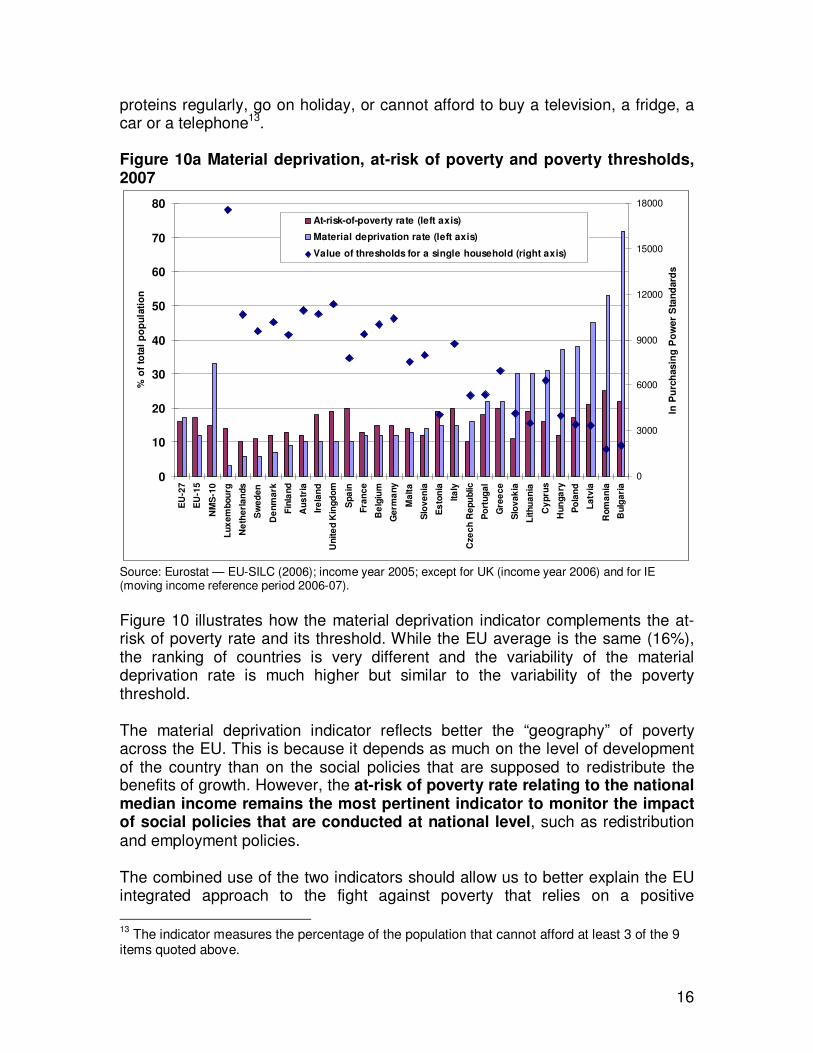
This information goes a long way to meeting the concerns of many people that the at risk of poverty indicator was in danger of being discredited. An at risk poverty rate for Luxembourg that is higher than that in the Czech and Slovak Republics needs information about the level of median household income in each country and therefore of the poverty threshold. Others have also argued for the use of material deprivation indicators to illustrate the same point. In February 2009, the Social Protection Committee (SPC) has adopted an EU indicator of material deprivation. This adoption is the result of long process. Even in 2001, the SPC had already recommended the development of indicators of material deprivation in its Laeken report on social inclusion indicators. It acknowledged the need to supplement the income based indicators by non-monetary measures of poverty. Such measures provide a measure of the availability of accumulated resources (savings, durable goods, housing, etc.) that are not captured by current income. If it is based on a common basket of basic deprivation items it also highlights the disparities in living standards across countries. This recommendation became even more relevant after the accession of 12 new Member States in 2004 and 2007. The new indicator measures the proportion of people whose living conditions are severely affected by a lack of resources. For instance, these people cannot afford to pay their rent, mortgage or utility bills, keep their home adequately warm, face unexpected expenses, eat meat or
16
proteins regularly, go on holiday, or cannot afford to buy a television, a fridge, a car or a telephone13. Figure 10a Material deprivation, at-risk of poverty and poverty thresholds, 2007
0
10
20
30
40
50
60
70
80
EU
-27
EU
-15
NM
S-1
0
Lu
xe
mb
ou
rg
Ne
the
rla
nd
s
Sw
ed
en
De
nm
ark
Fin
lan
d
Au
str
ia
Ire
lan
d
Un
ite
d K
ing
do
m
Sp
ain
Fra
nc
e
Be
lgiu
m
Ge
rma
ny
Ma
lta
Slo
ve
nia
Es
ton
ia
Ita
ly
Cze
ch
Re
pu
blic
Po
rtu
ga
l
Gre
ec
e
Slo
va
kia
Lit
hu
an
ia
Cy
pru
s
Hu
ng
ary
Po
lan
d
La
tvia
Ro
ma
nia
Bu
lga
ria
% o
f to
tal
po
pu
lati
on
0
3000
6000
9000
12000
15000
18000
In P
urc
has
ing
Po
we
r S
tan
dard
s
At-risk-of-poverty rate (left axis)
Material deprivation rate (left axis)
Value of thresholds for a single household (right axis)
Source: Eurostat — EU-SILC (2006); income year 2005; except for UK (income year 2006) and for IE (moving income reference period 2006-07).
Figure 10 illustrates how the material deprivation indicator complements the at-risk of poverty rate and its threshold. While the EU average is the same (16%), the ranking of countries is very different and the variability of the material deprivation rate is much higher but similar to the variability of the poverty threshold. The material deprivation indicator reflects better the “geography” of poverty across the EU. This is because it depends as much on the level of development of the country than on the social policies that are supposed to redistribute the benefits of growth. However, the at-risk of poverty rate relating to the national median income remains the most pertinent indicator to monitor the impact of social policies that are conducted at national level, such as redistribution and employment policies. The combined use of the two indicators should allow us to better explain the EU integrated approach to the fight against poverty that relies on a positive
13
The indicator measures the percentage of the population that cannot afford at least 3 of the 9 items quoted above.

17
interaction between the growth and jobs strategy and the social inclusion strategy. The material deprivation rate highlights better the disparities in living conditions across Europe and thereby the need for a greater territorial, social and economic cohesion within the European Union. Disparities in material deprivation rate reflect the large differences that remain between EU countries. Figure 10b shows that over the last 3 years14, in the 15 old EU Member States both the risk of poverty and the material deprivation rates remained stable. These countries are characterised by a high level of development and a rather moderate growth over the period. On the contrary, in the 10 New Member States from Central and Eastern Europe, relative poverty remained stable while material deprivation rates were significantly reduced. This partly reflects the rapid growth that was observed in many of these countries over the period. These are very preliminary trends but they are consistent with the analysis of the anchored poverty rate presented earlier. Figure 10b - 3 year evolution of the at-risk of poverty and material deprivation rates, in the EU, EU-15 (old Member States) and NMS-10 (New Member States from Central and Eastern Europe). 2005-2007
0
5
10
15
20
25
30
35
40
45
50
2005 2006 2007 2005 2006 2007
Risk of poverty Material Deprivation
% o
f to
tal
po
pu
lati
on
EU-25 EU-15 NMS-10
Source: Eurostat — EU-SILC (2006); income year 2005; except for UK (income year 2006) and for IE (moving income reference period 2006-07), Bulgaria and Romania not included
14
3 years is the longest series available for most countries.
18
ASSESSING THE INCOME INDICATORS IN THE OMC
Main achievements The first and most important point is to acknowledge what an achievement it is to have a set of income based poverty indicators for all 27 EU Member States that can be used in the Open Method of Coordination. The indicators are based on a data set that allows comparison across Member States and data is also available for Iceland, Switzerland, Norway and Turkey. The range of indicators gives a rounded assessment of the situation of people on low incomes in each Member States. The regular reporting cycle of the Open Method of Coordination has given all member States an opportunity for mutual understanding and learning from the experience of others. Set in the context of a full analysis of the determinants of differences in poverty rates, a powerfully strong evidence based policy tool is available to Member States in monitoring and evaluating their special concerns with the fight against poverty. An excellent example of how this can work is the report on Child Poverty15 that shows how the indicators can be used fully in an analytical examination of child poverty across the EU. A brief summary of this report and a reflection on its impact on policy making at EU and national level is presented in Annex. Some lessons can be drawn from this exercise on child poverty. At EU level, the use of an agreed analytical framework relying on common indicators increased the transparency and legitimacy of the diagnosis on the determinants of child poverty. This framework allowed to highlight not just the relative outcomes of each country, but also to identify the main causes of child poverty in each country. It helped identifying in which areas action was most needed and defining the policy priorities. In the 2008 Joint Report on Social Protection and Social Inclusion16, the analysis was complemented by an assessment of the policies in place in Member States and resulted in the issuing of key policy messages by all EU ministers. The diagnosis was also part of the tools that were available to the Member States in the preparation of the 2008-2010 National Action Plans for social inclusion and it was used as a reference by the European Commission in the assessment17 of the plans. A number of countries have taken new measures to fight child poverty that were consistent with the diagnosis. At national level, a common analytical framework can help policy makers because it allows benchmarking the performance of each country against that of countries sharing the same challenges. It also allows a better appreciation of the 15
European Commission (2008a) 16
European Commission (2008b) 17
European Commission (2009) pages 38 to 44

19
true magnitude of those challenges and in some instances to pinpoint emerging trends. Mutual learning – one of the key features of the open method of coordination - becomes easier when countries are able to compare their respective strengths and weaknesses on the basis of a common framework. Issues for consideration Some issues need consideration. The first is transparency. The original plan involved a commitment to use the 60% median income poverty rate only in the context of all the other related indicators. This commitment to perfection has not in practice been adhered to. The result too often is the at risk poverty rate is used on its own and this can leave the press and the general public confused and misled. The timeliness of the data has already been mentioned. In the Autumn of 2009 one year after the financial crisis the latest data will refer to incomes from 2006. There is probably little scope for improvement in timeliness given the data has to come from 27 EU Member States. Household income has to be equivalised and the EU has adopted the OECD equivalence scales. Where the pattern of households remains constant or changes slowly over time, the scale does not affect the monitoring of changes in household income based indicators over time. But the choice of scale will affect cross section comparisons whether they are across countries or across different sections of the population within a country. A particular problem can arise with social security transfers that vary with household type. These benefits have an implied equivalence scale that is not necessarily the same as the OECD scale. For example in the UK the income related benefit, Pension Credit, given to pensioners who do not have a second pension or only a very small one lifts single households above the poverty threshold but leaves couple households just below. Some sensitivity testing may be sensible A key test is whether the income indicators are aligned with the overarching objectives. These are
• The first main objective to which Member States are committed under the social inclusion and social protection strategy is the promotion of social inclusion and social protection is the promotion of social cohesion, equality between men and women and equal opportunities for all through adequate, accessible, financially sustainable, adaptable and efficient social protection systems and social inclusion systems
• The second overarching objective is to promote effective, mutual interaction between the Lisbon objectives of greater economic growth, more and better jobs and greater social cohesion and the EU’s sustainable Development Strategy

20
The first objective is the most relevant to the role of the income indicators in the open method of coordination. Any EU government’s first and main weapon against poverty is the tax and benefit system. Although all governments make transfers in kind the main engine of redistribution is through the tax and benefit system. There is little direct reference to the social protection system in the battery of income indicators. Total social expenditure net and gross as a percentage of GDP is used as a measure of the resources transferred by governments. We have also started developing, with the OECD, a measure that compares social assistance benefits as a percent of the relevant poverty threshold. The table below shows the preliminary results for those countries where it has been possible to calculate the ratio (countries where non categorical social assistance schemes are in place). Figure 11 Net income of social assistance recipients — 2006 As a % of the at-risk-of-poverty threshold for 3 jobless family types, incl. housing benefits.
0%
20%
40%
60%
80%
100%
120%
140%
LT SK PT MT EE HU ES LV CZ BE PL LU CY FR SI AT DE FI SE DK UK IE NL
single lone parent, 2 children couple with two children
Only countries where non-categorical social assistance benefits are in place are considered.
Source: Joint EC-OECD project using OECD tax-benefit models, and Eurostat. Further work is needed on these results. A key problem is the estimates made for special benefits related to social assistance, such as housing benefits. The OECD have used 20% of average earnings as a proxy measure for housing benefits that cover all the rent paid by households receiving social assistance. In the UK this is too high and gives the wrong impression that most household types on social assistance are on incomes above the poverty threshold. More work is needed as it is important to have a measure of whether safety net benefits are lifting households above the poverty threshold. .
21
The other area where benefit expenditure is used is the calculation of the at risk of poverty rate before and after social transfers (see Figure 8). This indicator on its own can only measure the effectiveness of social transfers in combating poverty if household structure is exogenous to the structure and administration of social transfers. It is unlikely that this assumption holds in practice. Extensive benefit data exist in many EU countries. Social assistance levels are in some sense the democratically determined poverty level; they are meant to be a safety net below which no one falls. The data can be timely and duration is easily and accurately calculated: so can repeat spells of dependency on social protection benefits. In addition, with modern computing power 100% counts are possible and this brings the possibility of having social protection data down to very small areas. Household survey data always exclude those not in households: but people not in households can receive social security benefits. Measuring the number of people dependent on benefits and whether that is growing is easily understood by the general public who often struggle with at risk poverty rates. There have always been objections. First the introduction of a new benefit or a change in eligibility can result in a surge in numbers dependent on the new benefit. Second, decisions to raise the generosity of social assistance can lead to an automatic growth in the number falling below this social assistance determined poverty rate. But this should not be a problem. If society decides the national poverty level or safety net should be higher then initially the numbers falling below it may be higher where the take up of the benefit is not close to 100%. The financial crisis may accelerate the use of benefit data across the EU. The ISG is currently contributing to the Social Protection Committee’s monitoring of the social impact of the crisis. We have realized that data on social security benefits are going to be more timely even if there may not be comparable availability across all Member States and we are going to use what data exists to give a more up to date picture of the social consequences of the recession across the EU.
LESSONS FOR OTHER OECD COUNTRIES
We have argued these indicators have been useful within the EU in understanding the way that social policy operates across Member States. This raises the question whether the method could be relevant outside the EU in the rest of the OECD. The OECD’s recent publication “Growing Unequal? Income Distribution and Poverty in OECD countries”18 shows clearly that the EU’s approach is part of a well established analytical tradition for analysing inequality.
18
OECD (2008)

22
The OECD’s work will have been harder because outside the EU there is no common data base The more difficult question is whether the EU’s experience has special lessons for countries with a strong federal structure to their government. In the EU, social policy is the responsibility of Member States although there are common objectives aimed at encouraging coordination. Where a country has a federal structure with social policy delegated to the federal level then the EU’s experience as described in this paper is relevant. The framework allows comparisons and analyses of poverty across units of Government and uses poverty thresholds that are specific to each unit.
CONCLUSIONS
The adoption and use of income indicators together with the successful launch of a comparable data base across the EU 27 and beyond to Turkey Iceland Switzerland and Norway is a major achievement. While a newly adopted indicator of material deprivation reflects better the geography of poverty across Europe, the at-risk of poverty rate relating to the national median income remains the most pertinent indicator to monitor the overall impact of social policies that are conducted at national level, such as redistribution and employment policies. Investing further in the development of sound analytical frameworks such as the one used in the child poverty benchmarking exercise is crucial to ensure that the EU indicators are used in policy making, both at EU and national levels. However, there is a need for information to monitor the main policy instrument in combating poverty – the social protection system operating in each Member Sate. Benefit data will be easily understood by the public; it will be more timely; it allows accurate measures of duration on minimum incomes. The need to monitor the impact of the financial crisis will probably accelerate the adoption of this source of information. Isabelle Maquet David Stanton September 2009

23
THE CHILD POVERTY BENCHMARKING EXERCISE: AN EXAMPLE OF IN-DEPTH ANALYSIS
OF POVERTY ON THE BASIS OF THE EU INDICATORS
In the March 2006 Presidency conclusions, EU Heads of States committed “to take necessary measures to rapidly and significantly reduce child poverty, giving all children equal opportunities, regardless of their social background”. As a follow-up, Member States chose tackling poverty and social exclusion of children as a key focus theme for the year 2007. The Social Protection Committee adopted the final report on “Child Poverty and Well Being in the EU – current status and way forward” in January 200819. In this report, Member States signed off a diagnosis of the main causes of child poverty in each Member State drawn from a thorough EU benchmarking exercise based on the EU agreed indicators and related statistics. Most EU Member States recognise the need to significantly reduce child poverty and social exclusion. Most of them are launching or have policies in place to address child poverty and social exclusion. However, these policies are still at very different stages of implementation and considerable differences in outcomes remain. The aim of the report was to understand better what can explain such differences. The first part of the report focuses on relative income poverty since it remains a key aspect of children's living conditions. Experiencing income poverty is one of those life circumstances most likely to have a direct or indirect negative impact on the well-being of children (educational outcome, health, housing conditions, quality of environment, etc.) and on children’s future life opportunities. The focus on relative income poverty is also politically relevant to support Member States in their use of the main policy instruments they have at their disposal to support families: labour market policies that support parental employment and tax-benefit systems that support children and families both financially and through the provision of key services (e.g. childcare). Using the EU agreed indicators and detailed related statistics, the report reviews extensively the main determinants of child poverty: household characteristics, labour market situation of parents and the effectiveness of government intervention through income support and provision of key services (e.g. childcare). In conclusion of this review it combines a selected number of indicators to draw a raw diagnosis of the main determinants of child poverty in each country. The EU benchmarking exercise Table 1 summarises this benchmarking exercise. In the first column, countries are assessed according to their relative performance in child poverty outcomes,
19
European Commission (2008a)

24
into 6 levels from +++ (countries with the lowest poverty rates and poverty gaps) to --- (countries with the highest poverty rates and poverty gaps). The level of performance here is defined relatively to the poverty rates of all other EU countries. In the next three columns, countries are assessed according to their relative performance (also using a 6 levels scale) with regard to the three main factors influencing child poverty risk, namely: children living in jobless households, children living in households at risk of "in-work poverty" and the low impact of social transfers on the risk of child poverty. Countries are then grouped according to the main challenge they face (where they have most “–“ scores).
Table 1: Relative outcomes of countries related to child poverty risk and main determinants of child poverty risk
Child poverty risk
outcomes
Joblessness: children
living in jobless
households
In-work poverty:
children living in
households
confronted with
in-work poverty
Impact of social
transfers (cash
benefits excl.
pensions) on child
poverty
AT + + ++ ++
CY +++ + +++ +
DK +++ + +++ ++
FI +++ ++ +++ +++
NL + + + +
SE + (++) ++ ++
GR
OU
P A
SI ++ +++ +++ ++
BE + -- +++ +
CZ - -- + +
DE ++ -- +++ +++
EE -- -- + -
FR ++ - ++ ++
IE - --- + +
GR
OU
P B
SK - --- + +
HU --- --- - +
MT - -- -- -
GR
OU
P C
UK -- --- -- +
EL -- +++ -- ---
ES --- + --- ---
IT --- ++ --- --
LT --- + -- --
LU* -- +++ -- +
LV --- - -- --
PL --- - -- --
GR
OU
P D
PT -- + -- --
Source: SPC report on Child Poverty and Well-Being – data updated to 2006 – LU excluded from analysis

25
The detailed analysis of Table 1 confirms that child poverty outcomes result from complex interactions between joblessness, in-work poverty and the impact of transfers. The countries achieving the best outcomes are also those performing well on all fronts, notably by combining income support with measures to facilitate access to employment and to enabling services (e.g. childcare). Once reliable trend data become available from EU-SILC, a dynamic dimension will have to be added to the proposed diagnosis. This will allow taking account of the increase in child poverty observed in a number of countries, and notably in SE and FI that are identified here as best performers in relation to other EU countries.
• Group A gathers the three Nordic countries (DK, FI, SE) as well as AT, CY, NL, and SI. These countries reach relatively good child poverty outcomes by performing well on all 3 fronts. They combine relatively good labour market performance of parents (low levels of joblessness and of in-work poverty among households with children) with relatively high and effective social transfers. Nordic countries achieve these goals despite high shares of children living in lone parent households. They seem to succeed in so doing notably by supporting adequate labour market participation of parents in these families through childcare provision and a wide range of measures of reconciliation of work and family life. While the impact of social transfers on child poverty is relatively low in CY, children in this country have so far been protected against the risk of poverty by strong family structures dominated by 2-adults families and complex households in which most working age adults are at work. In the NL, while children in part benefit from the low levels of inequality in the country and from a relatively good integration of parents on the labour market, child poverty outcomes may be further improved by addressing the intensity of poverty and improving the impact of social transfers (which is lower than for other countries in this group).
• Group B gathers BE, CZ, DE, EE, FR, IE, and SK which achieve relatively good to below average poverty outcomes. The main matter of concern in these countries is the high numbers of children living in jobless households. While 8% of children or more live in jobless families, families at work experience lower levels of poverty than in other EU countries. In most of these countries, around half of the children in jobless households live with a lone parent. In FR the high numbers of children living with jobless couples is also a matter of concern. Among these countries, DE and FR seem to be more successful at limiting the risks of poverty for children than the others through relatively high and effective social transfers. The interaction between the design of these benefits, the availability and affordability of child care and the labour market participation of parents would deserve further analysis. Policies aimed at enhancing access to quality jobs for the parents furthest

26
away from the labour market may contribute to reducing child poverty in these countries.
• Group C gathers HU, MT, and the UK who record average or just below average child poverty outcomes, despite a combination of high levels of joblessness and in-work poverty among parents. In the UK, joblessness mainly concerns lone parents, while in HU and MT it concerns mainly couples with children. The main factors of in work-poverty are low work intensity in MT (very few 2-earners families) and the UK (incidence of part-time work) and low pay or low in-work income in HU where the poverty rates of 2 earners families are among the highest in the EU. In this group of countries, the UK and HU partly alleviate very high risks of pre-transfers poverty among children through relatively effective social benefits. In MT, despite the relatively poor integration of their parents on the labour market, children benefit from low pre-transfers risk of poverty, probably as a result of family structures that so-far remain protective. In these 4 countries, different policy mixes may be needed to give access to quality jobs to parents living in jobless households, to enhance the labour market participation of second earners and to adequately support the incomes of parents at work.
• Group D gathers EL, ES, IT, LT, LV, PL, and PT. These countries record relatively high levels of child poverty. While they have low shares of children living in jobless households, they experience very high levels of in-work poverty among families. The main factors of in-work poverty in these countries are the low work intensity (the number of 2-earners families are among the lowest in ES, EL, IT, LU, PL) combined (or not) with low in-work incomes (the poverty rates of 2 bread winners households are among the highest in ES, EL, LT, PT and PL). In these countries (apart from LU), the level and efficiency of social spending are among the lowest in the EU. The analysis indicates that in these countries family structures and intergenerational solidarity continue to play a role in alleviating the risk of poverty for the most vulnerable children. Living in multi-generational households and/or relying on inter-households transfers whether in cash or in kind may partly compensate the lack of governmental support for the parents in the most vulnerable situations. These countries may need to adopt comprehensive strategies aimed at better supporting families' income, both in and out of work, and at facilitating access to quality jobs, especially for second earners.
Can this benchmarking exercise be used in policy making ? At EU level, an agreed analytical framework relying on common indicators increases the transparency and legitimacy of a diagnosis at EU level. This framework allows to highlight not just the relative outcomes of each country, but also to identify the main causes of child poverty in each country. Knowledge of the main determinants of child poverty allows to deduct in which areas action is needed and to define the policy priorities. An example of the application of the

27
framework can be found in the 2008 Joint Report on Social Protection and Social Inclusion. The analysis was complemented by a jointly agreed assessment of the policies in place in Member States and resulted in the issuing of key policy messages by all EU ministers. The diagnosis was part of the tools that were available to the Member States in the preparation of the 2008-2010 National Action Plans for social inclusion and it was used as a reference by the European Commission in their assessment20. A number of countries had taken new measures to fight child poverty that were consistent with the diagnosis. At national level, a common analytical framework can help policy makers at national level because it allows benchmarking the performance of each country against that of countries sharing the same challenges. It also allows a better appreciation of the true magnitude of those challenges and in some instances to pinpoint emerging trends. Mutual learning – one of the key features of the open method of coordination - becomes easier when countries are able to compare their respective strengths and weaknesses on the basis of a common framework.
20
European Commission (2009) pages 38 to 44

28
List of references Atkinson A.B., Cantillon B., Marlier E., Nolan B. (2001). Social Indicators: the EU and Social Inclusion. Oxford University Press Atkinson A.B., Cantillon B., Marlier E., Nolan B. (2007). The EU and social inclusion: facing the challenges. The policy press Dahrendorf, Ralf (1990) Reflections on the Revolution in Europe: In a letter intended to have been sent to a gentleman in Warsaw. New York: Random House Engbersen G. (1991) Moderne armoede: feit en fictie. De Sociologische Gids, 38, I, 7-23 European Commission (2005) Working together, working better: A new framework for the open coordination of social protection and inclusion policies in the European Union. COM(2005) 706 final European Commission (2008a). Child poverty and well-being in the EU: current status and way forward. Luxembourg: Office for Official publications of the European Communities European Commission (2008b). Joint Report on Social Protection and Social Inclusion 2008. Luxembourg: Office for Official publications of the European Communities European Commission (2008c). Social Protection and Social Inclusion 2008: EU indicators. Luxembourg: Office for Official publications of the European Communities European Commission (2009a). Joint Report on Social Protection and Social Inclusion 2009. Luxembourg: Office for Official publications of the European Communities European Commission (2009b). Portfolio of indicators for the monitoring of the European Strategy for Social Protection and Social Inclusion – 2009 update OECD (2008), Growing unequal? Income Distribution and Poverty in OECD countries. October 2008. Paris: OECD publications United Nations (1995) The Copenhagen declaration and Programme of action. World Summit for social development. New York: UN department of publications United Nations (2001) Expert Group on Household Income Statistics - the Canberra group Final Report and Recommendations. Ottawa 2001
Related Documents


