www.peer-review-social-inclusion.eu On behalf of the European Commission DG Employment, Social Affairs and Equal Opportunities United Kingdom In-work poverty and labour market segmentation A Study of National Policies Jonathan Bradshaw, Fran Bennett and Emese Mayhew Disclaimer: This report reflects the views of its May 2010 author(s) and these are not necessarily those of either the European Commission or the Member States. The original language of the report is English.

Welcome message from author
This document is posted to help you gain knowledge. Please leave a comment to let me know what you think about it! Share it to your friends and learn new things together.
Transcript
www.peer-review-social-inclusion.eu
On behalf of the European Commission DG Employment, Social Affairs and Equal Opportunities
United Kingdom
In-work poverty and labour market segmentation A Study of National Policies Jonathan Bradshaw, Fran Bennett and Emese Mayhew Disclaimer: This report reflects the views of its May 2010 author(s) and these are not necessarily those of either the European Commission or the Member States. The original language of the report is English.
UNITED KINGDOM
3
Content Summary ......................................................................................................................................... 4 1. The current situation – statistical overview ...................................................................... 5
1.1 EU indicators .............................................................................................................. 5 1.2 National indicators to monitor in-work poverty............................................................ 5 1.3 National indicators to monitor labour market segmentation (including ‘low wage
employment’).............................................................................................................. 7 2. Main causes of in-work poverty and labour market segmentation: literature review 10
2.1 Main causes of in-work poverty ................................................................................ 10 2.2 Main causes of labour market segmentation ............................................................ 12 2.3 Political debate at national level on in-work poverty and labour market
segmentation............................................................................................................ 13 3. Presentation and analysis of policies in the UK............................................................. 14
3.1 In-work poverty: low net wage .................................................................................. 14 3.2 In-work poverty: low work intensity........................................................................... 18 3.3 Labour market segmentation.................................................................................... 23
4. Conclusion .......................................................................................................................... 31 Appendix: Tables and Figures.................................................................................................... 33
UNITED KINGDOM
4
Summary
The UK in-work at risk of poverty rates are close to the EU average; the gender pay gap is higher; there are higher rates of part-time employment but lower rates of temporary employment; children have a bigger impact on mothers’ employment than the EU average.
39% of persons in poverty had someone in employment (mainly self-employed or part-time). Over half of poor children have someone in employment and this proportion has been increasing in recent years.
The risk of in work-poverty is higher if there is a child, if there are more children, and for some ethnic groups.
5.9% of employees were in temporary and 30.3% in part-time employment in the last quarter but only a third of temporary and 14% of part-time employment was involuntary.
0.9% of jobs paid less than the National Minimum Wage (NMW) in 2009. Minimum wage workers tend to be female, part-time, ethnic, young and less educated.
In-work poverty is associated with having children; being a low-paid and part-time employed lone parent; being a couple with children with only one person employed on low pay. It is also associated with not taking up in-work benefits.
Labour market segmentation is associated with exploitation; lack of enforcement of rights; low skills; discrimination (ethnic, gender, disability); and the prevalence of subcontracting.
Political debate about in-work poverty has concentrated more on ‘making work pay’ (via wages and in-work benefits) and getting second earners into work than on the quality and conditions of employment. There has also been lively campaigning for a ‘living wage‘.
Low net wages are a function of part-time employment, the level of wages, the direct tax system and the level of in-work benefits. - The NMW has been increased faster than rises in average earnings since it was
introduced in 1999. - Tax thresholds have fallen and earners pay 20 per cent income tax and 11 per cent NI
contributions even when working less than full-time on the NMW. - All in-work benefits have lost ground in comparison with the poverty threshold because
they have not been uprated in line with earnings. Non take-up of in-work benefits remains a cause of in-work poverty.
It is debatable whether part-time work is genuinely involuntary for women with caring responsibilities. It is also often mothers in the UK who have intermittent careers.
The Government has increasingly focused on second earners and some welfare to work services have been extended to partners of people in work, though it is difficult to gain access to potential second earners.
Childcare has been developing from a low base but issues of affordability, quality and sustainability persist. Transport to work and childcare locations are also important.
Rights to ask for flexible working have been extended.
UNITED KINGDOM
5
Earnings inequalities are very large in the UK though they have stabilised since 1997.
There is an increased focus on sustainability and progression in work, including the introduction of transition to work benefits and extended payments of out of work benefits. The welfare to work targets for job sustainability have been extended to 26 weeks.
According to a recent Commission, the UK labour market is the second least protected in the developed world, and many workers are vulnerable – self employed, casual, migrants.
In the UK the role of social partners is not as institutionalised as in some EU countries. Unions have also found it difficult to organise the lowest paid and most marginal workers.
Until the outcome of the general election on May 6, it is hard to predict in which direction policies on in-work poverty and labour market segmentation will develop.
1. The current situation – statistical overview
1.1 EU indicators
As requested in the guidelines, Table 1.1 (see Appendix) presents the statistical overview using the agreed indicators used to monitor the Social OMC and the European Employment Strategy. In each case, the UK position is compared with the EU25/27 averages. It can be seen that: 1. The UK in-work at risk of poverty rates is close to the EU average. 2. The UK marginal tax rates on low wages are similar to the EU average for single
persons without children, but for families with children they are much higher. 3. The gender pay gap is higher in the UK than the EU average. 4. Gender segregation is similar to, but slightly lower than, the EU average. 5. The inactivity rates due to care are slightly higher than the EU average. 6. and 7. It is not clear whether transitions are different in the UK from the EU average. 8. There are similar rates of non-standard employment to the EU average, but higher
rates of part-time employment and lower rates of fixed-term employment. 9. There is no information on undeclared work. 10. There are lower rates of overtime in the UK, but higher average hours per week. 11. Access to flexitime working is slightly higher in the UK than the EU average. And one additional indicator: the impact of children on mothers’ working is much higher than the EU average in the UK.
1.2 National indicators to monitor in-work poverty
The main source of data on in-work poverty in the UK is the annual Households Below Average Income (HBAI) series. In Table 1.2 (see Appendix), of all the individuals in poverty in 2007/8 39 per cent had someone in the household in employment. Among these, the largest groups were the self employed and people in households with someone working only part time – defined as less than 31 hours per week. However, 15 per cent had someone in full-time work. The risk of poverty was of course much higher in workless households. Nevertheless the risk of poverty was higher than average in self-employed households and in those with a part–time worker only.
UNITED KINGDOM
6
The prevalence of poor children in in-work households is greater than for poor individuals. Table 1.3 (see Appendix) shows that over half of poor children have someone in employment in the household. The risk of poverty is very low (only 2 per cent) if both parents are employed full time and only 4 per cent if one parent is employed full time and the other part time, but increases to 18 per cent of children in couple families with only one parent employed and 54 per cent in couple families with only part-time employment. It can be seen in Figure 1.1 (see Appendix) that there has been an increase in the proportion of children in poverty with a parent in employment since 1994/95. In Table 1.4 (see Appendix) we have re-classified households into four employment groups and then estimated the bivariate odds of an individual being poor by the characteristics of the household. It can be seen that the odds of being poor are
higher when there is a child in the household; and
higher the more children there are - and the coefficients are higher for in work poverty than out of work poverty;
lower if there is a disabled person in the household if there is someone employed full time but higher if it is a workless household with a disabled person in it;
higher for all non-white ethnic groups except Black Caribbean and Black other with two earners. The coefficients are notably higher for working than non-working Indian families and very high for Pakistani and Bangladeshi families doing only part-time work;
there are some interesting country differences. Overall the poverty risk is higher in Wales and Northern Ireland than in England and Scotland. However, if there is somene employed it is lower in Wales than in England, and if there are two workers it is lower in Northern Ireland than in England;
all tenants have higher odds of being poor than owners, except those with two workers and a mortgage who are not employed.
Of course there is a good deal of overlap between these characteristics; so Table 1.5 (see Appendix) repeats the analysis, but this time shows the multivariate odds of an individual being poor – having controlled for other characteristics. It shows that the results of the bivariate analysis are sustained when other factors are held constant though there are some changes to the coeeficients. The presence of children is clearly a risk factor for in work poverty. How does the UK compare with other EU countries in relation to child poverty and employment? The TARKI/Applica report1 found that
the UK had an above average proportion of children living in households with work intensity=0 (ie in workless households) and with work intensity 0.51-0.99 (Table 1.7);
1 TARKI/Applica (2010) Child Poverty and Child Well-being in the European Union, Report prepared for the DG
Employment, Social Affairs and Equal Opportunities (Unit E2) of the European Commission. Budapest: http://www.tarki.hu/en/research/childpoverty/index.html
UNITED KINGDOM
7
the at risk of child poverty rate was higher than average for work intensity rates between 0 and 1 (ie all households working less than full time) (Table 1.7);
the UK has a higher proportion of children living in lone-parent families working part time (7 per cent) than the EU average (3 per cent) and a higher proportion of couples with children with one adult employed full time and one part time (30 per cent, compared to 22 per cent in the EU) (Table 1.9);
it also has a lower proportion of children living in households with two full-time employed adults (21 per cent compared to 28 per cent for the EU) (Table 1.9);
for children with lone parents employed part time and full time, the risk of poverty rates in the UK are the same as the EU average. The same is true for couples with 2 breadwinners and 1.5 breadwinners. However, when there is only one breadwinner the child poverty rate is higher (27 per cent compared to 24 per cent for the EU) and much higher for part time work only (62 per cent compared to 36 per cent for the EU) (Table 1.9);
so leaving aside poor children living in workless households (44 per cent in the UK compared with 31 per cent in the EU), a higher proportion of all children in poverty in the UK have a lone parent in part-time employment (Table 1.9).
1.3 National indicators to monitor labour market segmentation (including ‘low wage employment’)
The Office for National Statistics as part of its regular Labour Market Statistics2 publishes data on temporary and part-time working broken down by reason and gender. The latest release up to December 2009 to February 2010 shows that 5.9 per cent of employees (5.6 per cent of men and 6.2 per cent of women) were in temporary employment. This was an increase for men (but not for women) from 5.1 per cent in December 2007 to February 2008. In December 2009 to February 2010, 30.3 per cent of employees were in part-time work with a big difference between men (14.4 per cent) and women (47.7 per cent). Since December 2007 to February 2008, part-time work had increased by 1.5 per cent (1.2 per cent for men and 1.6 per cent for women). Table 1.6 (see Appendix) shows that not all the temporary and part-time work is involuntary. Only 34.7 per cent of those in temporary work could not find a permanent job (39.1 per cent of men) and only 13.9 per cent of those in part-time work could not find a full-time job (25.4 per cent for men). There is no official government measure or definition of low pay. The measure of low pay used by the Low Pay Commission (LPC) is jobs which pay at the NMW level or no more than 10 per cent above.3 The Trades Union Congress has used a definition of under two-thirds of median earnings. Previous debates have suggested not including part-time rates or women’s earnings, particularly if a figure is being used as a target rather than just a measuring tool, because of the under-valuation of certain kinds of work. So a common measure in the past has been two-thirds of male median earnings (sometimes just full time). Estimates from the Annual Survey of Hours and Earnings4 show that the number of jobs paid below the National Minimum Wage (NMW) in the UK was 242,000 in April 2009, amounting to 0.9 2 http://www.statistics.gov.uk/pdfdir/lmsuk0410.pdf 3 Low Pay Commission (2010), National Minimum Wage: Low Pay Commission Report 2010, Cm 7823, London:
The Stationery Office. 4 http://www.statistics.gov.uk/cci/nugget.asp?id=591
UNITED KINGDOM
8
per cent of all jobs in the labour market. The number of jobs paid below the NMW broken down by age was:
14,000 jobs (4.1 per cent) held by those aged 16 to 17;
44,000 jobs (2.6 per cent) held by those aged 18 to 21; and
184,000 jobs (0.8 per cent) held by those aged 22 and over. People in part-time work were more than twice as likely as those in full-time work to be paid less than the NMW, with 1.5 per cent of part-time jobs and 0.7 per cent of full-time jobs falling below this level. Jobs held by women were more likely to fall below the minimum wage than jobs held by men (1.1 per cent compared with 0.8 per cent). This was due to the greater number of women in part-time jobs. It is important to note that these estimates do not measure non-compliance with the national minimum wage legislation. This is because the survey data used to provide the estimates do not indicate whether an individual is eligible for the minimum wage. For example, some people, such as apprentices or new trainees, are exempt from the minimum wage, or are only entitled to lower rates. If employees receive free accommodation, employers are entitled to offset this against hourly rates. A research report for the LPC confirmed that minimum wage workers tended to be female, aged under 25, less educated, disabled, from a minority ethnic background (especially Bangladeshi or Pakistani), living in social housing, and in the north of England, Wales, or Northern Ireland. They tended to work in part-time jobs and were concentrated in specific sectors, such as hospitality or retail. Families with minimum wage workers were unlikely to be at the very bottom of the working age income distribution; but those with the minimum wage as their main source of earned income were near the bottom.5 The report of the National Equality Panel (NEP) showed how unequal the UK is in terms of earnings and income compared with both other industrialized countries and the UK itself 30 years ago – though most of the increase occurred during the 1980s, whereas over the most recent decade, on at least some measures, earnings inequality has narrowed a little and income inequality stabilised.6 The 90:10 ratio in terms of hourly wages is 3.9,7 with the median gross hourly wage at £9.90, and one in ten having wages below £5.50 and another one in ten above £21.30 per hour; the top 1 per cent has wages above £43 per hour. Median gross weekly earnings for full-time workers are £448, with the 90:10 ratio only slightly lower, at 3.7. Over the last decade, despite most policies affecting distributional outcomes being UK-wide, inequalities in earnings and income have fallen a little in Scotland (but increased faster in London).8 The Low Pay Commission reports research showing a recent decline in inequality at the bottom of the labour market.9
5 Brewer, M., May, R. and Phillipos, D. (2009), Taxes, Benefits and the National Minimum Wage, Research
Report for Low Pay Commission, London: Institute for Fiscal Studies. 6 Looking at measures across the whole distribution, however, income inequality has widened. 7 This is from the recent National Equality Panel report (see footnote below) and is generally based on data from
2006-2008. 8 National Equality Panel (2010), An Anatomy of Economic Inequality in the UK, London: Government Equalities
Office. 9 Low Pay Commission (2010), National Minimum Wage: Low Pay Commission Report 2010, C, 7823, London:
The Stationery Office.
UNITED KINGDOM
9
‘Vulnerable’ work is the term used by government and others which perhaps comes closest to describing labour market segmentation and its results. The Trades Union Congress (TUC) set up a Commission on Vulnerable Employment (CoVE),10 which defined vulnerable work as ‘precarious work that places people at risk of continuing poverty and injustice resulting from an imbalance of power in the employer-worker relationship’ (TUC CoVE, 2008, p. 3). The Government’s own definition of a vulnerable worker is ‘someone working in an environment where the risk of being denied employment rights is high and who does not have the capacity or means to protect themselves from that abuse. Both factors need to be present’ (i.e. including employer exploitation of vulnerability) (BERR, 2008, p. 4).11 The CoVE said vulnerable work was impossible to measure but judged some 2 million workers to be at high risk, many of them women. There is a large gender pay gap in the UK (the fourth largest hourly pay gap out of the 27 EU member states in 2006, one-third higher than the EU average),12 albeit with some progress since 1997; women are paid 21 per cent less than men in median hourly pay for all employees (13 per cent less for those working full time). Only women with high qualifications working in the public sector see career progression in wages – though there is almost as much inequality between well-paid and low-paid women as between the well-paid and low-paid overall. A crucial factor in this (and the earnings of disabled people and those from some minority ethnic groups) is the low level of part-time pay.13 But a recent paper, after allowing for positive selection into full-time employment by British women, found that the corrected gender wage gap is close to twice the raw gap across most of the earnings distribution.14 Many women are working below their potential. The UK has one of the highest rates of part-time working in the EU, with more dispersed weekly hours (i.e. more long and more short hours).15 Part-time work is found most in the service sector. Job quality tends to be lower, and those who increase their hours to full time usually do so by changing jobs. When employed, disabled people have median hourly earnings 20 per cent lower for men and 12 per cent lower for women, with the disability employment penalty growing over the last 25 years, in particular for those with low or no qualifications.16 In general, tthe number of people with low levels of skills has been in decline, but their labour market position has deteriorated.17 10 TUC Commission on Vulnerable Employment (2008), Hard Work, Hidden Lives: The full report of the
Commission on Vulnerable Employment, London: Trades Union Congress. 11 Department of Business, Enterprise and Regulatory Reform (2008), Vulnerable Worker Enforcement Forum –
Final report and government conclusions, London: BERR. 12 Commission of the European Communities (2008), Equality Between Women and Men, Brussels: Commission
of the European Communities. 13 National Equality Panel (2010), An Anatomy of Economic Inequality in the UK, London: Government Equalities
Office. 14 Chzhen, Y. and Mumford, K. (2010), ‘Gender gaps across the earnings distribution for full-time employees in
Britain: allowing for sample selection’, Discussion Paper, York: University of York and Institute for the Study of Labour.
15 This paragraph is based on Millar, J., Ridge, T. and Bennett, F. (2006), Part-time Work and Social Security: Increasing the options? Department for Work and Pensions Research Report 351, Leeds: Corporate Document Services.
16 National Equality Panel (2010), An Anatomy of Economic Inequality in the UK, London: Government Equalities Office.
17 Leitch, S. (2006), Prosperity for All in the Global Economy: World class skills, London: HM Treasury.
UNITED KINGDOM
10
2. Main causes of in-work poverty and labour market
segmentation: literature review
2.1 Main causes18 of in-work poverty
Lisa Harker, in her independent report on child poverty for the Department for Work and Pensions, argued: “starting a job is not a safe route out of poverty: in one in three cases moving into employment from out of work poverty simply shifts a family into in-work poverty”.19 She identified three main causes of in-work poverty amongst families with children: low pay, families relying on one earner and single/dual earners not working enough hours. Leaving aside the issue of housing costs,20 there are three key factors that are associated with in-work poverty. 1. Having children:21 It can be seen in Table 2.1 (see Appendix) that it is very unusual for single people and childless couples of working age who have someone working full time to be poor. Only 3 per cent of single people without children in full-time employment (defined as more than 31 hours per week) and 3.2 per cent of people in couple families were in the at risk of poverty group. This is partly because the 60 per cent of median poverty threshold is so low for such households (£158 per week for singles and £236 for couples in 2007/08). As we shall see in Section 3, it is also a function of the National Minimum Wage. 2. Being a low-paid lone parent: A lone parent in employment (ignoring the problems of childcare and housing costs) is likely to be in in-work poverty if
she cannot work full time; and/or
she does not claim the in-work benefits to which she is entitled; and/or
she is working for lower pay than the statutory National Minimum Wage. In other circumstances, a combination of earnings and in-work benefits should ensure that a lone parent in employment earning the National Minimum Wage (NMW) is above the poverty threshold. This is illustrated in Figure 2.1 (see Appendix). This shows the composition of net disposable income for a lone parent employed for the NMW (currently £5.80 per hour) employed between 16 and 45 hours per week. The red line on the chart is our estimate of the <60 per cent
18 We are not happy about this word in the framework we were given and in the text refer to associations. 19 Harker, L. (2006), Delivering on Child Poverty: What would it take? Independent report for the Department for
Work and Pensions, London: The Stationery Office, Cm 6951, p.38. See also Office for National Statistics (2009), First Release: Labour Market Statistics, February, 11 February 2009.
20 The EU is wedded to a before housing costs poverty threshold but some of the in-work poverty is the results of housing costs. So, for example, the child poverty rates for households with all adults in work were 4 per cent before housing costs and 13 per cent after housing costs in 2007/8.
21 Tripney, J. et al. (2009). In-work Poverty: A systematic review, Department for Work and Pensions Research Report 549, Leeds: Corporate Document Services.
UNITED KINGDOM
11
of median poverty threshold in 2009/10. (This estimate does not take into account the Housing Benefit disregard.) 3. Being a couple with children with only one earner: In contrast to a lone-parent family, a couple with children with a parent in employment is likely to be in poverty if
there is only one person in employment; and
they cannot earn more than the NMW. Figure 2.2 (see Appendix) shows that a couple with two children and one earner working full time for the NMW and claiming all the in-work benefits they are entitled to does not have a net income higher than the 60 per cent of median poverty threshold even if they are working more than full-time hours, if it is assumed that the partner out of work has no income of their own. In order to be lifted out of poverty, they would need to have a higher pay rate, work longer hours and/or have the other partner in work to reach the threshold. Alternatively, if the other partner had their own source of income – for example, via generous levels of non-means-tested benefits – this would also make a difference. (Note that this Figure does take into account the Housing Benefit disregard.) As this shows, however, the relationship between low hourly gross pay for individuals and low disposable income for individuals/families/households (in-work poverty) is not straightforward.22 There is some overlap between low pay and household poverty, and the overlap seems to have grown significantly between the 1970s/80s and 2000/01, from 3-4 to 14 per cent of employees.23 But the authors of a more recent study argue24 that this had decreased again by 2004/05, to an estimated 7.2 per cent; they used a different data source, but also suggest that this may be due to changes in policy since 2000/01. (Both studies use the household rather than the benefit unit.) Most analysis of in-work poverty assumes that resources are shared equally within the benefit unit or household – though the likelihood that resources are shared within wider households is (even) lower. It has been argued by some (for example, the Conservatives) that one reason for the greater difficulty in raising couple families with an earner above the poverty threshold is that they have the same basic credit in the Working Tax Credit as lone parents, whereas their equivalised poverty line is higher. The Conservatives are committed to abolishing what they call the ‘couple penalty’ when they have raised enough resources (through their welfare reforms). However, others have pointed out that childless couples have higher WTC rates than single people; it is only families with children who receive the same amount whether they have one or two parents, and this has been the case since the introduction of in-work supplementation in 1971. Moreover, this used to be mirrored in the income tax system, when the married couple’s allowance (for all married couples) was matched by the additional personal allowance of the same amount (for lone parents). 22 This subsection is based on Bennett, F. and Lister, R. (2010), The ‘Living Wage’: The right answer to low pay?,
Freethinking, London: Fabian Society. (web publication only: http://fabians.org.uk/images/stories/pdfs/Living_Wage_Briefing.pdf).
23 Millar, J. and Gardiner, K. (2004), Low Pay, Household Resources and Poverty, York: York Publishing Services Ltd, for Joseph Rowntree Foundation. Note that this is before housing costs and does not include the self-employed.
24 Cooke, G. and Lawton, K. (2008), Working out of Poverty: A study of the low paid and ‘working poor’, London: Institute for Public Policy Research. This is also before housing costs.
UNITED KINGDOM
12
2.2 Main causes of labour market segmentation
The TUC’s Commission on Vulnerable Employment (CoVE) argued that the immediate reasons for ‘vulnerable’ work included the law not being strong enough to prevent exploitation; the ability of employers to break the law because of workers’ weak position; and the lack of resources for enforcement agencies. But there are clearly more fundamental reasons for the prevalence of such work, general and specific to the UK. CoVE argued that vulnerable work was not inevitable, but resulted from political and economic choices; and that for many people it was not a stepping stone but a long-term trap. Even if low pay does not lead to in-work poverty for the family or household of the low earner, it is still problematic; it is often linked to other labour market disadvantages and it may result in low income or poverty later in the lifecycle, because of inadequate contributions to social security and/or savings. Low pay is more prevalent in the UK than in many other EU countries. A recent study of Germany and the UK links income inequality to deregulated labour markets, such as the UK’s.25 Growing inequality between broad occupational classes was an important contributor to the growth in earnings inequality over the 1980s.26 The National Equality Panel (NEP) argued that some, though by no means all, earnings and income inequalities in the UK have their origins in variations in skill levels and qualifications, with a ‘long tail’ of low achievement amongst 16-year-olds and a comparative shortfall in upper level secondary qualifications in the working age population. Low income acts as a barrier to post-compulsory education.27 Discrimination has often been linked to labour market segmentation. When employed, nearly all other groups have hourly pay less than white British men – though some groups have similar hourly wages after controlling for differences in age, occupation and qualifications.28 Women, disabled people and members of ethnic minorities are likely to be lower paid and in lower status jobs even with equivalent qualifications; and experimental studies (e.g. mock job applications with minority ethnic names or listing disabilities)29 – have shown a causal link with discrimination. Moreover, ‘... improving or high qualifications for people from several minority ethnic groups do not
appear to be translating into the labour market position one would expect’. (National Equality Panel (2010), An Anatomy of Economic Inequality in the UK, London: Government Equalities Office, Summary, p. 19) The evidence on why employers designate some jobs as part time and others as full time is limited. ’Task-based’ (rather than ‘demand-based’) part-time jobs are often dominated by women and of poorer quality.
25 Dustmann, C., Machin, S. and Soskice, D. (2010), Inequality, Education and Comparative Political Economy,
Anglo-German Foundation for the Study of Industrial Society. 26 National Equality Panel (2010), An Anatomy of Economic Inequality in the UK, London: Government Equalities
Office, p. 21 (Summary). 27 National Equality Panel (2010), An Anatomy of Economic Inequality in the UK, London: Government Equalities
Office. 28 National Equality Panel (2010), An Anatomy of Economic Inequality in the UK, London: Government Equalities
Office. 29 National Equality Panel (2010), An Anatomy of Economic Inequality in the UK, London: Government Equalities
Office.

UNITED KINGDOM
13
The main causes of women’s labour market disadvantage include the under-valuation of ‘women’s work’, occupational segregation, part-time working and the constraints of caring responsibilities.30 A recent study,31 after allowing for positive selection into full-time employment by women, suggests the gender earnings gap would all but disappear if women working full time got the same return to their characteristics as men. The TUC’s Commission on Vulnerable Employment reported that over 80 per cent of employers now subcontract parts of their business.32 Insecure, low-paid work and the use of temporary contracts have been linked to the increased prevalence of subcontracting by private and public sector organisations.
2.3 Political debate at national level on in-work poverty and labour market segmentation
In the UK, ‘in-work poverty’ and ‘labour market segmentation’ are usually considered separately. Most debate on ‘in-work poverty’ focuses on wage levels and/or tax credits/in-work benefits, and recently also on getting more ‘second earners’ into work, rather than on the quality and conditions of employment. NGO/think-tank activity on low pay and in-work poverty has increased recently, though the two are not always sufficiently distinguished.33 Analysis of policy measures often focuses on a snapshot of households /families, instead of the implications for individuals over the lifetime. Political rhetoric such as ‘hard-working families’ is not always useful in developing targeted policy, as it fails to differentiate between lone parents and couples and obscures the different positions of women and men in the labour market.34 One research/policy organisation was set up to study the 13.4 million adults in ‘low earner’ households in income deciles 3, 4 and 5, who are ‘too rich’ to qualify for substantial state support yet often ‘too poor’ to access the full range of benefits from private markets.35 (However, this does include retired households, and excludes individual low earners in high earner households, so ‘low earner’ is somewhat inaccurate.) The Low Pay Commission (LPC) advises government,36 with recommendations about increases in the NMW and other reforms (such as recently an apprentice rate, or the exclusion of tips). Debates centre on the NMW level which is feasible without causing unemployment. Although until recently sidelined from the mainstream, a lively debate focuses on demands for a ‘living wage’,37 especially from London Citizens, persuading both Labour and Conservative mayors to support it.
30 McKnight, A. (2009), ‘More equal working lives? An assessment of New Labour policies’, in J. Hills, T. Sefton
and K. Stewart (eds.), Towards a More Equal Society? Poverty, inequality and policy since 1997, Bristol: The Policy Press, pp. 91-114.
31 Chzhen, Y. and Mumford, K. (2010), ‘Gender gaps across the earnings distribution for full-time employees in Britain: allowing for sample selection’, Discussion Paper, York: University of York and Institute of Labour.
32 Commission on Vulnerable Employment (2008), Hard Work Hidden Lives, London: Trades Union Congress. 33 An exception is the Institute for Public Policy Research (see, for example, Lawton, K. (2009), Nice Work if You
Can Get It: Achieving a sustainable solution to low pay and in-work poverty, London: IPPR. 34 Bennett, F. (2010), Gender and Social Inclusion, GenderWorks policy paper, Oxford: Oxfam GB. 35 Resolution Foundation (2009), Squeezed: The low earners audit London: Resolution Foundation. 36 Low Pay Commission (2010), National Minimum Wage: Low Pay Commission Report 2010, Cm 7823. London:
The Stationery Office. 37 See Bennett, F. and Lister, R. (2010), The ‘Living Wage’: The right answer to low pay?, Freethinking, London:
Fabian Society (web publication only: http://fabians.org.uk/images/stories/pdfs/Living_Wage_Briefing.pdf).
UNITED KINGDOM
14
Groups of low-paid workers in the private sector in particular have benefited from various City firms etc. agreeing to pay a ‘living wage’. The ‘living wage’ demand asks that no one should work for an income below a certain level. However, it is hard to work this out - unless the traditional ‘family wage’ approach is taken, i.e. a full-time wage for a married man should support a dependent wife and several children. This is the default option for some campaigners, although some formulae are more complex, Now the Joseph Rowntree Foundation, which calculates a ‘minimum living standard’,38 has said an hourly ‘living wage’ of £7.14 would take a high percentage of individuals/families up to that level. However, hourly individual gross pay can still only be translated into individual/family weekly disposable income by making heroic assumptions, with different figures needed for each area due to varying housing costs etc. And it is not clear how this relates to differentials in a wage bargaining structure – or what happens if egg income tax becomes more generous. One gap in the debates is the situation of the self employed. Self-employment (see above) is often associated with in-work poverty. In addition, although their income levels in national surveys are thought to be often inaccurate, self-employed people are found at the extreme ends of the labour market, with many in precarious and marginal work, living on very low incomes; so self-employment is also very relevant to labour market segmentation. 21 per cent of Pakistani men are self-employed.39 (Some self-employment is also clearly bogus, and in reality employee status – see below.) It is probably easier to help low-income self-employed people with in-work poverty than with labour market issues (though verifying the number of hours worked and amount of income earned by self-employed people is often a challenge). Debates about labour market segmentation focus largely on the degree of regulation of the labour market, but also on the effectiveness of enforcement mechanisms. The Labour Government developed an argument about ‘intelligent’ regulation, trying to avoid arguments solely about volume. The Commission on Vulnerable Employment argued that successful economies were often more regulated than the UK’s. Two topical developments have sharpened these arguments: growing migrant labour (argued by some to lead to lower wages and worse conditions, and by others to be in part the result of these) and the current recession (making any real or perceived trade-off between employment levels and pay/working conditions more stark).
3. Presentation and analysis of policies in the UK 3.1 In-work poverty: low net wage
Table 3.1 (see Appendix) shows how the tax/benefit system operates for selected households with one earner on the National Minimum Wage and compares their net incomes with an estimate of the poverty threshold.40 It is clear that the net income exceeds the poverty threshold for single people and lone parents. There are 4 major elements (amongst others) that determine the net income of people in employment:
38 http://www.minimumincomestandard.org/ 39 National Equality Panel (2010), An Anatomy of Economic Inequality in the UK, London: Government Equalities
Office. 40 This is estimated as the 60% median threshold for 2007/08 plus 10%.
UNITED KINGDOM
15
1. the hours they can work (dealt with under ‘low work intensity’ below); 2. the level of the National Minimum Wage (and other remuneration); 3. the tax/National Insurance threshold and the tax (and National Insurance contributions) rate; 4. the level of in-work benefits. Some policies described below are part of recent governments’ attempts to ‘make work pay’,41 whilst others have been introduced as elements of the strategy to combat child poverty. There is clearly some overlap in these aims. The National Minimum Wage (NMW) The NMW is the lowest amount it is legal for an employer to pay an employee. There are three levels of NMW, and the rates from October 2009 were:
£5.80 per hour for workers aged 22 years and older;
a development rate of £4.83 per hour for workers aged 18-21 inclusive; and
£3.57 per hour for all workers under the age of 18, who are no longer of compulsory school age.
In April 2008, the majority (58.4 per cent) of NMW jobs were part time and just under two-thirds (64.3 per cent) were held by women. These figures are similar to those in previous years.42 The approximately 750,000 adults paid at the NMW rate in April 2009 (3.2 per cent of all jobs) was the highest number ever; the bite of the NMW (its value relative to the median) remained at 51 per cent.43 Table 3.2 (see Appendix) shows the evolution of the NMW since its introduction in April 1999, to October 2009. It has increased faster than increases in prices and average earnings (in October 2009, it had risen by over 61 per cent since 1999).44 The Government has also increased the penalties for non-compliance. An article examining employees in jobs paying below the NMW showed it was not possible to accurately estimate from the Labour Force Survey how many might be so through non-compliance.45 The Low Pay Commission (LPC) recommended an hourly apprentice NMW rate of £2.50; it proposed that the adult rate should start at age 21, but it is not clear what will happen to this now. Resources for ensuring compliance with the NMW have been increased; but the LPC is still concerned about its effectiveness.
41 See, for example, Bennett, F. and Millar, J. (2005), ‘Making work pay?’, Benefits 42, 13 (1), 28-33. 42 Low Pay Commission (2009), National Minimum Wage: Low Pay Commission Report 2009. Cm 7611, London:
The Stationery Office, p. 15. 43 Low Pay Commission (2010), National Minimum Wage: Low Pay Commission Report 2010, Cm 7823, London:
The Stationery Office, p. xii. 44 Low Pay Commission (2010), National Minimum Wage: Low Pay Commission Report, Cm 7823, London: The
Stationery Office, para. 2.47. 45 Conn, S., Hicks, S. and Johnson, J. (2009), 'Characteristics of those paid below the National Minimum Wage',
Economic & Labour Market Review, January 2009, Office for National Statistics, London: Palgrave Macmillan.
UNITED KINGDOM
16
A recent report for the Low Pay Commission investigated the relationship between the NMW and in-work benefits and tax credits.46 It found that significant numbers of minimum wage earners might benefit little from minimum wage increases because they were subject to high marginal effective tax rates; but the very poorest and second earners in couples kept more of any gains. Families with minimum wage earners also gained more from reforms to the tax/benefits system between 1999 and 2007 than other families.
Income tax and National Insurance (NI) contributions It can be seen in Table 3.1 (see Appendix) that even those full-time workers earning the NMW have to pay income tax and National Insurance contributions. The threshold for income tax at 20 per cent was £124.18 per week in 2009/10, meaning someone earning the NMW starts to pay after working 36 hours per week. For National Insurance (NI) contributions, the threshold is lower, at £110 per week, when you pay 11 per cent on earnings above this. One way in which net incomes of people in work could be increased is by lifting these thresholds. In 1973, the single person’s tax allowance was worth 45 per cent of GDP per capita, but by 2007/8 it had declined to 25 per cent. The Labour Government has introduced some reforms which targeted individual low-paid workers, rather than just household in-work poverty.47 In addition to the National Minimum Wage, a lower (10 per cent) income tax rate, replacing the 20 per cent band, was introduced in 1999, and increased in 2001, but abolished more recently (see our latest report on National Reform Programme). Also in 1999 the National Insurance ‘entry fee’ was abolished for employees, meaning that once they had reached the threshold they paid NI contributions on only earnings above that, rather than their whole wage. In 2001, a ‘primary threshold’ (at income tax threshold level) was introduced for employee NI contributions above the lower earnings limit. Earnings disregards have also been increased for various groups, so that those on various benefits – but not the unemployed – can earn more on top of their benefit income. In-work benefits Offsetting the impact of income tax and NI contributions is a set of in work-benefits, including tax credits. Below we briefly review the impact of these on in-work incomes and in-work poverty. Child Benefit This is not a solely in-work benefit, as it is paid to all children with parents in or out of work at the rate of £20.30 per week for the first/eldest eligible child and £13.40 for the second and subsequent child(ren). In recent years it has been increased annually in line with prices, which means it has lost ground in comparison with earnings (and the poverty threshold). When it was fully introduced in 1979, it was worth 9 per cent of average earnings for a two-child family; by April 2008, its value had fallen to 4.4 per cent. Housing Benefit Housing Benefit (HB) is paid to low-income people who rent, to help them with their housing costs (people who own their home cannot get help with mortgage costs if they are in work, despite 46 Brewer, M., May, R. and Phillips, D. (2009), Taxes, Benefits and the National Minimum Wage, Research Report
for Low Pay Commission, London: Institute for Fiscal Studies. 47 Bennett, F. and Millar, J. (2005), ‘Making work pay?’, Benefits 42, 13:1, pp. 28-33.

UNITED KINGDOM
17
people in work being able to get HB towards their rent). The maximum amount of HB a claimant is entitled to (the most they could receive prior to means testing) will depend on various factors including the claimant’s age, the size of their family, where they live - and the amount of rent they actually pay, since HB will not be paid at a rate higher than the actual cost of your accommodation (or not more than £15 per week more than the cost of your accommodation if the new local housing allowance rules apply). People with larger families, in areas of the country with higher rental prices, will typically be eligible for a higher allowance to help with housing costs than smaller families in areas of the country with lower housing costs. In these cases, for income above low earnings limits, HB tapers away at a rate of 65 per cent gross. Council Tax Benefit Council Tax Benefit (CTB) is paid to low-income people liable for Council Tax (local taxation), to help them with this. CTB is means-tested. For income above low earnings limits, it tapers away at 20 per cent gross. Neither HB nor CTB was of much use to low-paid workers, especially those on tax credits (see below), because they both tended to be tapered away. However, from November 2009 Child Benefit is disregarded and this will increases the proportion of low-waged families who can get help with their housing costs. Tax Credits ‘Tax Credits’ comprise two elements: Child Tax Credit (CTC) and Working Tax Credit (WTC). CTC is payable to households responsible for a child or qualifying young person, whether or not anyone in the household is in paid work. WTC is payable to households with somebody in work of 16+ or 30+ hours per week (depending on circumstances); if they are able-bodied and not responsible for a child, they must be 25 or over. WTC also contains a childcare element, providing help with up to 80 per cent of childcare costs for up to £175 per week for one child or £300 for two or more children. Both CTC and WTC are means-tested benefits. If you are eligible for both, the income threshold is currently £6420 per year. Tax Credits are tapered at a rate of 39 per cent for earnings above this income threshold. However, for just the ‘family element’ of CTC (£545 per year, or £1,090 per year if the household has a baby), a considerably higher threshold (£50,000 per year) also applies, meaning that families entitled to CTC can earn up to about £50,000 per year and still receive their maximum CTC family element. Tax Credits have become a less successful vehicle for reducing in-work poverty over time, as they have been losing value in comparison with the poverty threshold. While the child element in CTC is increased in line with earnings, WTC is increased with prices and the family element has not been increased at all. Non Take-up One problem with these in-work benefits, and an important contributor to in-work poverty, is that apart from Child Benefit (which has almost, but not quite, complete take-up) they are not claimed by all those eligible. An official report on take-up is produced annually by the Department for Work and Pensions. It is based on a combination of survey analysis and administrative statistics. The latest report is for

UNITED KINGDOM
18
2007/8,48 and Table 3.3 (see Appendix) provides a summary. Take-up estimates are subject to confidence limits, so are expressed in ranges. There are two measures: caseload take-up – the proportion of people eligible receiving; and expenditure take-up – the proportion of money available to be taken up which is claimed. Expenditure take-up is higher than caseload take-up because those eligible for higher amounts are more likely to claim. Take-up rates vary with the benefit in question. HM Revenue and Customs also undertakes an analysis of tax credit take-up,49 estimating that £1.9 billion in CTC and £2.3 billion in WTC was unclaimed in 2005/6. CTC take-up is higher for those on out-of-work benefits (91-93 per cent) or receiving WTC (90-93 per cent) than for those just entitled to CTC (71-85 per cent) or just the family element (68-75 per cent). Lone parents are more likely to take up Tax Credits than couples with children. Take-up increases with number of children, but not with the age of the youngest child. London has a much lower take-up rate. WTC take-up by childless single people (25 per cent) and couples (15 per cent) is very low. How low-paid workers avoid household poverty As noted above (p. 8), Millar and Gardiner50 analyse how employees with low hourly pay avoid household (not family) poverty. They examine different sources of income in turn, from someone’s own earnings via the earnings of others in the household to non-means-tested and finally means-tested income. Their study was updated by Cooke and Lawton,51 who found that only 19 per cent of low-paid adults earned enough to lift their households out of poverty through their own wages; a further 74 per cent managed to do so due to the wages of others and (to a far lesser extent) benefits/tax credits. This varied considerably by family type, and by working pattern. This analysis provides useful pointers to policy areas relevant to the avoidance of in-work poverty. Clearly if (for example) more non-earning adults within households were entitled to their own incomes – such as through non-means-tested benefits – this could be another policy instrument with which to tackle poverty, although it is not often seen in this way in the current debates.
3.2 In-work poverty: low work intensity
At individual level: precarious employment, including involuntary part-time work and intermittent careers The systematic review of evaluations of in-work poverty measures conducted for the Government suggested that these interventions were aimed at affecting wages/income, employment participation and/or working hours.52 There is therefore an inevitable overlap between the above subsection and this, as policies to improve low net wages are likely also to aim at increasing work intensity.
48 Department for Work and Pensions (2009), Income Related Benefits: Estimates of take-up 2007-08, London:
DWP. 49 HMRC (2008), Child Tax Credit and Working Tax Credit Take-up Rates 2005/06, London: HMRC. 50 Millar, J. and Gardiner, K. (2004), Low Pay, Household Resources and Poverty, York: York Publishing Services
for Joseph Rowntree Foundation. 51 Cooke, G. and Lawton, K. (2008), Working Out of Poverty: A study of the low paid and ‘working poor’, London:
Institute for Public Policy Research. 52 Tripney, J. et al. (2009), In-Work Poverty: A systematic review, Department for Work and Pensions Research
Report 549, Leeds: Corporate Document Services.
UNITED KINGDOM
19
Precarious employment This is not a term used frequently in UK policy debates. It is perhaps closest to ‘vulnerable employment’, which is linked to lack of awareness of employment rights, loopholes in the law and/or inadequate enforcement of rights. Tomlinson and Walker (2010)53 examined recurrent poverty in a longitudinal survey for the Joseph Rowntree Foundation to determine the factors affecting it, and found that being in the core or intermediate labour market decreased the chances of recurrent poverty significantly, whereas this was not as true of being in the peripheral labour market. There is therefore both a direct and an indirect relationship between precarious employment and poverty. (Considered further in Working Conditions below.) Involuntary part-time work ‘Involuntary’ part-time work is often applied to (largely) men otherwise unemployed; other than this, men working part time often do so voluntarily, when young and studying or preparing to retire.54 Many women who do part-time work whilst their children are young may be trapped in these jobs afterwards, however; it is debateable whether this is ‘voluntary’ (especially given the current gendered division of labour55 and limited childcare options56). Fewer than ten per cent of women workers are in part-time work in the years before chilbirth, but over 60 per cent are so throughout the ten years following the birth of their first child.57 (Policies to prevent involuntary part-time work are considered in Working Conditions below.) The recent introduction and extension of the right to request flexible working was partly intended to open up more ‘quality’ part-time jobs.58 But the Low Pay Commission (para. 2.17)59 reported a large increase in the number of temporary workers who could not find permanent positions and the number of involuntary part-time workers. Working Tax Credit has softened the blow for some of having to reduce their working hours. In the UK, various policy devices are meant to dissuade people from working part time; in particular, the option of subsisting on benefits and working part time is discouraged, especially for the unemployed, who have minimal earnings disregards,60 although other disregards (for example, for carers and disabled people) have been increased. Working Tax Credit is not available to people working less than 30 hours per week unless they have child(ren) or a disability, when they need only work 16 hours. The Government has recognised that part-time work by parents is a factor in child poverty (see above), and suggests that increasing main earners’ hours in couples could reduce child poverty; in-work support has also been extended to lone parents increasing from part time to full time. But there is great wariness about reducing incentives to take full-time jobs. Top-ups to two-parent families for work of only 16 hours per week
53 Tomlinson, M. and Walker, R. (2010), Recurrent Poverty: The impact of family and labour market changes,
York: Joseph Rowntree Foundation 54 Millar, J., Ridge, T. and Bennett, F. (2006), Part-time Work and Social Security: Increasing the options?,
Department for Work and Pensions Research Report 351, Leeds: Corporate Document Services. 55 See, for example, Himmelweit, S. and Land, H. (2007), Supporting Parents and Carers, Manchester: Equal
Opportunities Commission. 56 National Equality Panel (2010), An Anatomy of Economic Inequality in the UK, London: Government Equalities
Office. 57 Brewer, M. and Paull, G. (2006), Newborns and New Schools: Critical times in women’s employment, London:
Institute for Fiscal Studies. 58 Lyonette, C., Baldauf, B. and Behle, H. (2010), ’Quality’ Part-Time Work: A review of the evidence, London:
Government Equalities Office. 59 Low Pay Commission (2010), National Minimum Wage: Low Pay Commission Report 2010, Cm 7823, London:
The Stationery Office. 60 Millar, J., Ridge, T. and Bennett, F. (2006), Part-time Work and Social Security: Increasing the options?,
Department for Work and Pensions Research Report 351, Leeds: Corporate Document Services.
UNITED KINGDOM
20
are already generous – though there is a bonus for employment of 30 hours per week or more (by 1 or 2 parents); restriction of childcare help for couples under the Working Tax Credit to second earners working 16 hours per week or more means they may have to start working and using childcare at the same time. Intermittent careers If this refers to the tendency of mothers to leave their jobs following childbirth, it is a key issue in the UK. The Equality and Human Rights Commission (EHRC) advocates individual (not shared) rights to shorter and better paid maternity/paternity/parental leave, as this is less likely to lead to maternal labour market exit. Brewer and Paull (2006) pinpoint both childbirth and when a child starts school as crucial periods in mothers’ employment trajectories.61 If the term has more general application, however, it could also apply to temporary/contract work. Research for the Joseph Rowntree Foundation concluded that employers in the organisations studied operated three different approaches affecting job security: a ‘permanent’ strategy, a ‘core-periphery’ strategy and a ‘temp to perm’ strategy; crucially, however, the researchers concluded that ‘employers would not go out of business if they shifted to other models which afforded more employment security for low-paid workers’.62 Ideas included making temporary work more costly and/or less acceptable, or increasing the relative power of employees, and using the state’s role as a purchaser more proactively.63 These issues are dealt with below. At household level Second earners Women tend to be more responsive to (dis)incentives in the tax and benefits system affecting employment and hours of work;64 in most couples women are likely to be the prospective/actual ‘second earners’ (usually meaning partners whose earnings are secondary). Some studies have found a negative impact on the employment participation of women with employed partners of the UK’s tax credits;65 but most of these studies were conducted before it was possible to assess the impact of the latest system (from 2003). The Government has increasingly focused on policies to encourage second earners, primarily to tackle child poverty. Minority ethnic groups are less likely to be in employment (egg 44 per cent of Pakistani and 49 per cent of Bangladeshi women are economically inactive because of looking after the family/home, compared with 20 per cent or less of other groups).66 The Partners Outreach for Ethnic Minorities (POEM) initiative provided tailored support in a voluntary
61 Brewer, M. and Paull, G. (2006), Newborns and New Schools: Critical times in women’s employment,
Department for Work and Pensions Research Report 308, Leeds: Corporate Document Services. 62 Metcalf, H. and Dhudwar, A. (2010), Employers’ Role in the Low-pay/No-pay cycle, York: Joseph Rowntree
Foundation. 63 Goulden, C. (2010), ‘Cycles of poverty, unemployment and low pay’, York: Joseph Rowntree Foundation. 64 Meghir, C. and Phillips, D. (2008), ‘Labour supply and taxes’, Working Paper 08/04, London: Institute for Fiscal
Studies. 65 Reported in Tripney, J. et al. (2009), In-work Poverty: A systematic review, Department for Work and Pensions
Research Report 549, Leeds: Corporate Document Services, p. 56. Studies found differing results in terms of the participation of fathers with employed partners.
66 National Equality Panel (2010), An Anatomy of Economic Inequality in the UK, London: Government Equalities Office.
UNITED KINGDOM
21
programme to those at a distance from the labour market.67 Other policies to encourage second earners are covered in other sections below (e.g. childcare provision). Extending some welfare to work services to partners of people in work was also intended to do this. In the 2010 Budget, the Government said it would consider more such measures. If low-income partnered mothers increased their employment rate to that of other mothers, a new strategy document argues that child poverty could be reduced by 250,000.68 Parents’ employment decisions are influenced by the type of employment available, the financial benefits of moving into work, the costs and nature of childcare available, and perceptions about all these; and they need quality part-time and flexible work. (Different factors may be relevant for mothers compared with fathers, and their constraints may also differ. For example, long hours work by (usually) fathers, particularly prevalent in the UK, makes it hard for them to share family care, and this affects mothers’ ‘choices’ with regard to the kind of work they can do.) Working Tax Credit has provided a cushion in the recession for two-earner families dropping to one earner. However, if their partner is already in employment it is difficult to gain access to potential second earners. They may be on WTC, but this does not usually involve face-to-face encounters – unlike the jobseeker’s agreements, or even work focused interviews, necessary when couples are claiming benefits. It is not clear how it is possible to persuade (or coerce) these potential ‘second earners’ into jobs, therefore. A systematic review of interventions on in-work poverty (looking at largely UK studies) found they did not seem on average to have resulted in increasing either second earners or hours of work by parents in couple families. The authors suggest the studies did not provide a conclusive answer to questions about effective solutions to in-work poverty (for families with children), and that more research is needed into policies for working two-parent families, interactions between means-tested benefits and behavioural responses.69 Tania Burchardt has also proposed that ‘better off in work’ calculations should also consider ‘time poverty’.70 Care services Childcare in the UK has been developed from a low base, with the childcare element of the WTC, free nursery early years provision for 3- and 4-year-olds and a doubling of formal childcare places from 1997-006.71 Use of childcare is increasing, especially because of additional out-of-school provision. There is no longer a recommendation to the UK on childcare for its National Reform Programme, in recognition of improvements made; but issues of affordability, quality and sustainability persist. The English regional average cost of full-time registered day nursery childcare for children aged 2 is £156 per week (£152 for a childminder).72 In 2009, the cost of childcare (in England for a nursery place for a child over 2) rose by twice the rate of inflation.73 67 Discussed in Bennett, F. (2010), Gender and Social Inclusion, GenderWorks Policy Paper, Oxford: Oxfam GB;
see also Aston, J. et al. (2009), Evaluation of Partners Outreach for Ethnic Minorities (POEM): Interim report, Department for Work and Pensions Research Report 561, Leeds@ Corporate Document Services..
68 HM Treasury, Department for Children., Schools and Families and Department for Work and Pensions (2010), Ending Child Poverty: Mapping the route to 2020, London: HMT.
69 Tripney, J. et al. (2009), In-work Poverty: A systematic review, Department for Work and Pensions Research Report 549, Leeds: Corporate Document Services.
70 Burchardt, T. (2008), Time and Income Poverty, CASEreport 57, London: Centre for Analysis of Social Exclusion, London School of Economics.
71 Stewart, K. (2009), ‘”A scar on the soul of Britain”: child poverty and disadvantage under New Labour’, in J. Hills, T. Sefton and K. Stewart (eds.), Towards a More Equal Society? Poverty, inequality and policy since 1997, Bristol: The Policy Press, pp. 47-69.
72 Daycare Trust (2009), Childcare Costs Survey 2009. 73 Daycare Trust (2010), Childcare Costs Survey 2010.
UNITED KINGDOM
22
Research for the Joseph Rowntree Foundation found that childcare was a particular problem for parents with more than two children, children with health problems, or those under 5 or over 12; there are also problems in finding childcare outside ordinary working hours, and financial support is complex.74 The use of a mixed market economy as the main way to deliver childcare has been criticised.75 Multiply disadvantaged families are more likely not to use childcare, and to hold negative views about it.76 But the Working for Families Fund in Scotland, designed to improve the employability of disadvantaged parents who had barriers to work including childcare, was found to be effective in moving a substantial number into/towards work, education or training.77 The Government has been trying to increase take-up of formal childcare by lower-income families,78 and has had affordability pilots in London.79 A £75 million scheme will offer childcare support to 50,000 eligible low-income parents in England (in couples with one parent in work) while training or learning to help them into work.80 But the proposal that those giving up work to look after their grandchildren should get credits for their pension is perhaps a recognition that many low-income families prefer to use informal, especially family childcare. The Government said that the childcare element of the WTC would be made simpler and more responsive; and the free provision for 3- and 4-year-olds more flexible.81 (It will also cover some 2-year-olds in deprived areas.) The qualification level of childcare staff will be increased.82 But the Daycare Trust says a high quality childcare model would involve increasing spending from £4.4-£9.4 billion (1% of national income).83
Affordable transport This is key for potential second earners. The complexities for couples with children of reaching work and childcare venues mean that reducing time costs is crucial.84 Research suggested that poor women need sustained, integrated support services at neighbourhood level; transport and
74 Crisp, R., Batty, E., Cole, I. and Robinson, D. (2009) Work and Worklessness in Deprived Neighbourhoods:
Policy assumptions and personal experiences, York: Joseph Rowntree Foundation. 75 Lloyd, E. (2008), ‘The interface between childcare, family support and child poverty strategies under New
Labour: tensions and contradictions’, Social Policy and Society 7:4. 76 Speight, S., Smith, R. and Lloyd, E. with Coshall, C. (2010), Families Experiencing Multiple Disadvantage: Their
use of and views on childcare provision, Research Report RR191, London: Department for Children, Schools and Families.
77 McQuaid, R. et al. (2009), Evaluation of the Working for Families Fund (2004-2008), Edinburgh: Scottish Government.
78 Gregory, I. (2009), Childcare Take Up and National Indicator 118: A summary of learning funded by Government Regional Offices 08/09 across England, London: Daycare Trust and Government Office for London.
79 SQW Consulting (2009), Childcare Affordability Programme 2005: Pilot review, Research Report 174, London: Department for Children, Schools and Families.
80 Learning and Skills Council, press release 12 May 2009. 81 Department of Health, Department for Children, Schools and Families and Prime Minister’s Strategy Unit (2010),
Maternity and Early Years Services: Making a good start to family life, London. 82 Department for Children, Schools and Families and other departments (2009), Next Steps for Early Learning
and Childcare: Building on the 10-year Strategy, London. 83 Goddard, K. and Knights, E. (2009), Quality Costs: Paying for high quality early childhood education and care,
London: Daycare Trust. For a review of the Government’s childcare policies, see La Valle, I. (2009), ‘Good quality childcare for all? Progress towards universal provision’, National Institute Economic Review 207:1, National Institute for Economic and Social Research.
84 Skinner, C. (2005), ‘Coordination points: a hidden factor in reconciling work and family life’, Journal of Social Policy 34:1, 99-119.
UNITED KINGDOM
23
the location of childcare facilities are crucial issues for employment sustainability,85 and structure ‘geographies of choice’ for many women in particular. Travel to work times has increased, and children are now escorted to/from school more often.86 Yet planning and other policies do not necessarily take these issues fully into account.87 Flexible working In the UK this means the right to request flexible working (and not have it unreasonably refused), developed recently for many parents and carers. It may include flexitime, annualised hours, term-time working, job sharing and working at home, as well as part-time working. (Many employers include in ‘flexible working‘ part-time work, which may be suiting employer not employee needs.) One aim of this policy was to open up more ‘quality’ jobs to parents (largely mothers) wanting part-time work. Research on awareness and experience among parents found one-third concerned that asking to work flexibly could have negative consequences for them.88 The Government responded to a taskforce’s recommendations89 by asking employers to do more and undertaking to advertise all public sector jobs as available for flexible/part-time work unless there is a good business case against.90 However, job applicants do not have the right to request flexible working; and work/family balance is still often seen as only a women’s issue.91
3.3 Labour market segmentation
The Government inherited a labour market in which changes had led to fairly dramatic increases in earnings inequality by 1997, though this has stabilised since. It has not set out to reduce inequality in the labour market as a main policy aim (though unequal distribution of work has been tackled, through action to meet employment targets). Much ‘making work pay’ policy addresses inequality in income not pay.92 Job retention and advancement Job retention A report for the Joseph Rowntree Foundation on factors associated with recurrent poverty concluded that employment conditions had by far the strongest impact on this risk; and that therefore ‘... policies that encourage people to find work that pays little attention to the kinds of jobs that are available are unlikely to secure a significant 85 Escott, K. (2007), From Getting By to Getting On: Women’s employment and local regeneration programmes,
Liverpool: RENEW Northwest. 86 Land, H. (forthcoming), chapter in Social Policy Review, Bristol: The Policy Press in association with Social
Policy Association, on welfare reforms. 87 Bennett, F. (2010), Gender and Social Inclusion, Genderworks Policy Paper, Oxford: Oxfam GB. 88 Bowden, P. (2010), Flexible Working: Perceptions of working parents – Survey wave 2, London: Government
Equalities Office. 89 Family Friendly Working Hours Taskforce (2010), Flexible Working: Working for families, working for business,
London: Department for Work and Pensions. 90 Department for Work and Pensions (2010), Flexibility for the Future: The Government’s response to the
recommendations of the Family Friendly Working Hours Taskforce, London: DWP. 91 Himmelweit, S. and Land, H. (2008), ’Reducing gender inequalities to create a sustainable care system’, York:
Joseph Rowntree Foundation. 92 McKnight, A. (2009), ‘More equal working lives? An assessment of New Labour policies’, in J. Hills, T. Sefton
and K. Stewart (eds.), Towards a More Equal Society? Poverty, inequality and policy since 1997, Bristol: The Policy Press, pp. 91-114.
UNITED KINGDOM
24
reduction in recurrent poverty or a sustained fall in the poverty rate’.93 The Strategy Unit’s overview of job sustainability and progression issues94 showed this is a growing policy focus, with increasing recognition of the problems caused by cycles of poverty.95. Help is available with the transition to work from benefits, such as job grants and other discretionary assistance, as well as extended payments of Housing and Council Tax Benefit. An Employment Retention and Advancement demonstration project also provides post-employment support, emergency fund and in-work credits for some people. There had been concern over the (lack of) sustainability of jobs entered by workless people, with one report noting that two out of five claimants were back on benefits within six months.96 The Government lengthened the definition of ‘sustainable’ employment for welfare to work targets from 13 to 26 weeks; and a new scheme, announced early last year, will only pay a subsidy to employers if they recruit someone on jobseeker’s allowance for six months if the job (of 16 hours per week or more) is expected to last at least 26 weeks. (Self-employed people receive a credit worth £50 per week instead, but only for the first 16 weeks.) The same 26-week guarantee applies to the Future Jobs Fund, introduced to address the effects of the recession. However, the Government has not adopted a suggestion by business to introduce an ‘alternative to redundancy’ scheme under which staff would not work but would get twice the jobseeker’s allowance rate, co-funded by government and employers.97 And a proposal from trades unions and small businesses for a fund for companies moving to short-time wages and temporary layoffs was not pursued.98 A White Paper outlined the Government’s aim to not only get people into jobs and move towards an 80 per cent employment rate, but also help them stay in work and progress.99 The Labour manifesto promises that everyone will be at least £40 per week better off in work. More effort is being put into trying to stop people having to leave work for good when they have health problems; the Green Paper on welfare reform proposed doubling the money for adaptations in work to help disabled people (Access to Work). The UK Government agreed to implement the European directive on temporary agency work (though not until late 2011). This gives agency workers equal treatment in terms of basic working and employment conditions, including pay and holidays, after 12 weeks as if they had been recruited by the hirer.100
93 Tomlinson, M. and Walker, R. (2010), Recurrent Poverty: The impact of family and labour market changes,
York: Joseph Rowntree Foundation. 94 Strategy Unit (2008), Life Chances: Supporting people to get on in the labour market, London: Cabinet Office. 95 Cabinet Office (2009), New Opportunities: Fair chances for the future, London: The Stationery Office, and
Department for Work and Pensions (2009), Building Britain’s Recovery: Achieving full employment, London: The Stationery Office, both cited in Goulden (2010).
96 Public Accounts Select Committee (2008)., Sustainable Employment: Supporting people to stay in work and advance, HC 131, Thirteenth Report (Session 2007-08), London: The Stationery Office.
97 Confederation of British Industry (2009), Jobs for the Future: The business vision for sustainable employment in the UK.
98 Trades Union Congress and Federation of Small Businesses (2009), TUC and FSB Proposal for a Short-term Working Subsidy.
99 Department for Work and Pensions (2009), Building Britain’s Recovery: Achieving full employment, White Paper, Cm 7751, London: The Stationery Office,
100 Department for Business, Innovation and Skills (2010), press release, 21 January. See also Advisory, Conciliation and Arbitration Service (2009), The Agency Workers Directive: A permanent solution to temporary work?, London: ACAS.
UNITED KINGDOM
25
Job advancement Recommendations to the UK about its National Reform Programme (NRP) have in the past included improvements in skills levels, and employment and skills integration, to improve productivity and increase opportunities for the disadvantaged. Several documents on skills have now been published, and the employment chapter of the latest NRP focuses on policies for progression. Welfare reform has shifted away from ‘work first’ towards a ‘human capital’ model101 and there is a goal to increase the proportion of socially excluded adults in training. The Government’s Employment Retention and Advancement project (see above),faced implementation problems initially. But after Jobcentre staff had adjusted to providing support to people in work as well as those out of work, it resulted in lone parents earning substantially more, largely by encouraging them to work full time. However, though they took more steps to advance in work, there was little impact of movement into ‘better’ jobs during this time.102 The financial elements of the ERA included an employment retention bonus for staying in full-time work, training tuition assistance and access to emergency payments. The new Adult Advancement and Careers Service are due to become operational in England, along with personal skills accounts, later in 2010. This is intended to help everyone make more effective choices about skills, work and life, and help people overcome the barriers they face in moving forward.103 Other more specific policies and initiatives on job advancement are dealt with under lifelong learning below. Working conditions Research for the Joseph Rowntree Foundation (JRF) identified the factors affecting job insecurity and low pay in companies:
Labour supply (pay and quality; employee characteristics; unionisation; employee turnover; and employee flexibility);
Production factors (size, indivisibilities of labour and flexibility; location, management structure and progression; product quality and productivity);
Employment legislation;
Cost pressures (customers, power, competitiveness, sub-contracting and major buyers);
Demand fluctuations (daily, weekly and seasonal; losing/winning contracts; short-notice contracts; and purchaser decisions); and
Ethos, organisation aims and ownership.104
101 McKnight, A. (2009), ‘More equal working lives? An assessment of New Labour policies’, in J. Hills, T. Sefton
and K. Stewart (eds.), Towards a More Equal Society? Poverty, inequality and policy since 1997, Bristol: The Policy Press, pp. 91-114.
102 Riccio, J. et al. (2008), Implementation and Second-Year Impacts for Lone Parents in the UK Employment Retention and Advancement Demonstration, Department for Work and Pensions Research Report 489, Leeds: Corporate Document Services. (The ERA project involved random assignment.)
103 Department for Business, Innovation and Skills (2010, Fuelling Potential: A blueprint for skills accounts and the adult advancement and careers service.
104 Metcalf, H. and Dhudwar, A. (2010), Employers’ Role in the Low-pay/No-pay Cycle, York: Joseph Rowntree Foundation.
UNITED KINGDOM
26
Employment rights have come under scrutiny in the past few years. The TUC’s Commission on Vulnerable Employment argued that there was a two-tier labour market in the UK, the second least protected in the developed world. One important issue is employment status, as there are fewer employment rights for ‘workers’ (as opposed to employees) and self-employed people. The classification of many people (e.g. in construction) as self-employed is bogus, to get round employment laws. Casual workers can have their employment terminated at a day’s notice, and home workers may not be eligible for maternity pay. Some workers do not have sufficient protection because of their immigration status and/or the informal nature of their employment. Such working conditions can also make it more difficult for people to progress.105 The Vulnerable Worker Enforcement Forum was set up by the Government, involving the social partners and others. The Government responded to its recommendations by undertaking to take action on increasing awareness by vulnerable workers of their rights (including the creation of a combined helpline) and on more effective enforcement of those rights, including measures to ensure employment tribunal awards are paid. The government has not extended the Gangmaster Licensing Authority regime to employment agencies in areas other than agriculture and food processing; and it has not set up a Fair Employment Commission to provide leadership on rights enforcement and advise on policy, as recommended by CoVE. But employment rights were also extended, in particular through:
A government commitment to implement the Agency Workers Directive (see above); and
Stronger powers of investigation and access to stronger penalties for the Employment Agency Standards Inspectorate.
The Employment Bill 2008 had already introduced new penalties for agencies exploiting their workers. The Fair Work Coalition, a campaign to ensure fairness at work for those in low-paid and precarious jobs, was set up by trade unions and others.106 Trade unions have argued that employment protection measures introduced since 1997 have raised incomes for the low paid, helped women to take up paid work and encouraged people to build their skills in work; the economic crisis will not be solved by deregulation.107
Life-long learning Those in temporary posts are less likely to get training,108 and those in less well-paid jobs get fewer opportunities to acquire more skills. Other groups outside the labour market who suffer inequality in skills training provision include minority ethnic learners, offenders and disabled people.109 Being disabled in work decreases the probability of being trained;110 and a ‘gender
105 Dunstan, R. (2009), ‘Working for workers’, Evidence, winter 2009, Citizens Advice, pp. 6-7. 106 Fair Work Coalition (2010), Fair Work: Fighting poverty through decent jobs. 107 Trades Union Congress (2010), The Red Tape Revolution: Why deregulation won’t solve the jobs crisis,
London: TUC. 108 Booth, A., Francesconi, M. and Frank, J. (2002), ‘Temporary jobs: stepping stones or dead ends?’, The
Economic Journal: 112 (480), F189-F213(25). 109 National Skills Forum (2010), Doing Things Differently: Step changes in skills and inclusion. 110 Fumagalli, L. (2009), Disability, Health and Access to Training, Employment Relations Occasional Paper,
London: Department for Business, Innovation and Skills.
UNITED KINGDOM
27
skills gap’ has been identified as contributing to £15-23 billion per year in lost national income.111 Although the emphasis on progression suggests moving from one job to another, it is also important to provide training ‘on the job’, perhaps especially for those with less confidence and a need for financial security; a report for the Joseph Rowntree Foundation found that workplaces that provided chances for structured training and promotion helped people feel supported as they tried to advance; moving to a new job instead was potentially risky without appropriate support.112
Skills and training are reserved to Westminster. The Government commissioned the Leitch Review (2006) to examine skills/training needs, and has emphasised skills increasingly.113 Leitch proposed an integrated employment and skills service and a programme to improve jobseekers’ basic skills. The Government introduced a New Deal for Skills, and has tried to manage the tension between investment in encouraging skills for high value production and emphasising basic skills (such as literacy and numeracy) as part of its strategy to tackle social inclusion. Employers, for example, tend to call for ‘non-essential’ training courses to be cut back, and funds to be redirected from basic skills training to higher-level skills.114 The number of people without basic skills has halved since 1997.115 But a report by an advisory body said the target to train at least 90 per cent of the workforce to level 2 by 2020 was likely to be missed without radical action;116 and in Scotland too many young people failed to gain essential and lower-level skills needed to progress in work.117 The Scottish Government suggests integrating support for those in training and looking for a job.118 ‘Train to Gain’ was introduced in England to make training more responsive to employers’ needs. It delivers vocational training to employees, primarily those without level 2 qualifications or with literacy or numeracy needs. The Government spent about £5 billion on basic skills courses from 2001-07, but does not hold up-to-date information about skills nationally or by region.119 Train to Gain has supported over a million learners and created a skills brokerage service.120 The inspectorate suggested priorities included the availability of ‘Skills for Life’ training (to improve literacy as well as company productivity), expanding the numbers who complete their qualifications within the duration of the programme, and opportunities to progress to higher-level training, especially towards qualifications at level 3.121 This may be particularly important for women who have missed out on education because of early parenthood or gender stereotyped
111 National Skills Forum (2009), Closing the Gender Skills Gap: A National Skills Forum report on women, skills
and productivity. 112 Ray, K., Hoggart, L., Vegeris, S. and Taylor, R. (2010), Better off Working? Work, poverty and benefit cycling,
York: Joseph Rowntree Foundation; McQuaid, R., Fuertes, V. and Richard, A. (2010), How can Parents Escape from Recurrent Poverty?, York: Joseph Rowntree Foundation.
113 See, for example, Department for Work and Pensions (2008), Ready to Work, Skilled for Work: Unlocking Britain’s talent, Cm 7316, London: The Stationery Office.
114 Confederation of British Industry (2009), Reforming Skills Funding: Delivering productive results. 115 McKnight, A. (2009), ‘More equal working lives? An assessment of New Labour policies’, in J. Hills, T. Sefton
and K. Stewart (eds.), Towards a More Equal Society? Poverty, inequality and policy since 1997, Bristol: The Policy Press, pp. 91-114.
116 UK Commission for Employment and Skills (2009), Ambition 2020: World class skills and jobs for the UK. 117 UK Commission on Employment and Skills (2010), Towards Ambition 2020: Skills, jobs, growth for Scotland. 118 Scottish Government (2009), Employability and Skills: Taking forward our national conversation, Edinburgh:
Scottish Government. 119 House of Commons Public Accounts Select Committee (2009), Skills for Life: Progress in improving adult
literacy and numeracy, Third Report (Session 2008-09), HC 154, London: The Stationery Office. 120 National Audit Office (2009), Train to Gain: Developing the skills of the workforce, HC 879 (Session 2008-09),
London: The Stationery Office. 121 Office for Standards in Education, Children’s Services and Skills (2009), The Impact of Train to Gain on Skills in
Employment: A review to follow up the 2007/08 survey.
UNITED KINGDOM
28
patterns; and the Government has promised to introduce a £500 training voucher for carers returning to work.122 But researchers found Skills for Life courses were not long enough; and it was hard to accommodate formal learning at work. No permanent legacy of workplace learning was left, as employers did not continue after funding ended. The nature of people’s jobs seemed more important for literacy than the training. But the courses did boost confidence and further learning efforts.123 A Select Committee found Train to Gain had expanded training that was flexible and met employers’ needs, but it was not well managed and about half of employers who benefited said they would have done the same without public subsidy.124
The complexity of skills/training provision has resulted recently in efforts to simplify the skills system in England.125 An updated strategy for skills focused on making Skills for Life more flexible and embedding it in vocational training.126 The Government has now announced a new skills strategy for England;127 following suggestions by an official advisory body,128 some 30 public bodies will be abolished, with two new bodies having responsibility for education and training for adults, and education for 16-19 year olds.129 The emphasis seems to have shifted towards higher level and technical skills, with 3 out of 4 expected to go to university or do an advanced apprenticeship by age 30. Every adult would have a skills account, giving the ability to ‘shop around’ for training. There is some criticism about the reduction of education to economically valuable skills in terms of its impact on higher education, and on the achievement of social justice aims.130 Views about the number of low-skilled jobs that will be needed in future vary. A think-tank report said there would still be 7.4 million low-skilled jobs unless employers invest more in upskilling; the drive to bolster workforce skills would do little to combat the problem of low pay unless businesses were pushed to invest more in higher value markets and reward skills.131 But it has been argued that any narrowing of the gap in training provision between low- and high-qualified employees has been achieved more by levelling down.132
122 Cabinet Office (2009), New Opportunities: Fair chances for the future, White Paper, Cm 7533, London: The
Stationery Office. 123 Wolf, A. et al. (2009), Enhancing ‘Skills for Life’: Adult basic skills and workplace learning, Swindon: Economic
and Social Research Council. 124 House of Commons Public Accounts Select Committee (2010), Train to Gain: Developing the skills of the
workforce, Sixth Report (Session 2009-10), HC 248, London: The Stationery Office. 125 UK Commission for Employment and Skills (2009), Hiding the Wiring: Final assessment of progress on
implementing the recommendations in Simplification of Skills in England. 126 Department for Innovation, Universities and Skills (2009), Skills for Life: Changing lives. 127 Department for Business, Innovation and Skills (2009), Skills for Growth: The national skills strategy, Cm 7641,
London: The Stationery Office. 128 UK Commission for Employment and Skills (2009), Towards Ambition 2020: Skills, jobs, growth. 129 Department for Children, Schools and Families (2009), Apprenticeship, Skills, Children and Learning Act 2009,
London: The Stationery Office. 130 Elliot, N.L. (2009), ‘New Labour’s skills policy at the intersection of business and politics’, Policy Futures in
Education, 7 (3). 131 Lawton, K. (2009), Nice Work if You Can Get It: Achieving a sustainable solution to low pay and in-work poverty,
London: Institute for Public Policy Research. 132 Mason, G. and Bishop, K. (2010), Adult Training, Skills Updating and Recession in the UK: The implications for
competitiveness and social inclusion, LLAKES Research Paper 10, Centre for Learning and Life Chances in Knowledge Economies and Societies, London: Institute of Education.
UNITED KINGDOM
29
Lifelong learning has a positive impact on men’s employment and wages, especially if they upgrade their educational status.133 The Government argues that improving skills is even more important in the current economic situation, and an official advisory body recommended focusing support on economically valuable skills in priority sectors for growth and future high-value job opportunities,134 whereas trades unions called for state-funded training for all workers facing redundancy.135
Non-discrimination policies and inclusive work environments A report examined research evidence on pay gaps from 2000 onwards and made suggestions about filling gaps in information.136 The Equality and Human Rights Commission published a framework to measure progress on equalities.137 The Equality Act 2010 brings together equalities legislation, and also introduces a new duty on central and some local public bodies to take account of socio-economic inequalities in strategic decisions. Carers will have more legal protection (for example, in recruitment processes). A Select Committee suggested that disability required a different approach from other equality strands.138 More effort is being put into strategies to try to stop people having to leave work for good when they have health problems; and a feature of the Green Paper on welfare reform which attracted praise was the proposed doubling of the money for adaptations in work to help disabled people (‘Access to Work’). The Labour manifesto proposes that these adaptations should be put in place before the disabled person enters work. Following research on cycles of poverty, low pay and unemployment, the Joseph Rowntree Foundation concluded that (amongst other measures) ensuring that equal pay legislation is fully complied with would help raise wages, especially in childcare and education where women predominate.139 The Equality Act lays down that companies with more than 250 employees will have to conduct a gender pay audit if they have not voluntarily done so by 2013. Public bodies with over 150 workers would also have to report on gender pay differentials, and provide other data, including information on minority ethnic employees. The impact of the recession by mid 2009 had led to higher falls in the employment rate over a year for young people, the lowest qualified and those living in deprived areas; men seem to have been more adversely affected than women.140
133 Dorsett, R., Lui, S. and Weale, M. (2010), Economic Benefits of Lifelong Learning, Discussion Paper 352,
London: National Institute for Economic and Social Research. 134 UK Commission for Employment and Skills (2010), Skills for Jobs: Today and tomorrow – The national strategic
skills audit for England 2010. 135 Trades Union Congress (2009), Skills in the Recession, London: TUC. 136 Metcalf, H. (2009), Pay Gaps Across the Equality Strands: A review, Research Report 14, London: Equality and
Human Rights Commission. 137 Equality and Human Rights Commission (2009), Equality Measurement Framework, London: EHRC. 138 House of Commons Work and Pensions Select Committee (2009), The Equality Bill: How disability equality fits
within a Single Equality Act, Third Report (Session 2008-09), HC 158, London: The Stationery Office. 139 Goulden, C. (2010), ‘Cycles of poverty, unemployment and low pay’, York: Joseph Rowntree Foundation. 140 Equality and Human Rights Commission, Monitoring the Impact of the Recession on Various Demographic
Groups, London: EHRC.
UNITED KINGDOM
30
The role of social partners Clearly in the UK the role of social partners is not as institutionalised as in some other EU countries, and this may facilitate decisive government action but not (e.g.) the long-term business commitment to make apprenticeships a success.141 A joint statement from the government, trade unions and employers was published in 2009 about the positive contribution ‘modern’ union representatives could make to workplaces.142 The role of union learning representatives in workplace learning is supported across the political spectrum. Legislation is planned to ban employers from blacklisting workers for trade union membership/activities.143 Almost 10 per cent of employees (one-third of public sector employees) were covered by labour-management partnership agreements in 2007,144 and a government-commissioned report praised employee engagement for its benefits for competitiveness.145 Although there are examples of good practice, unions have found it difficult to organise the lowest paid and most marginal employees. The Commission on Vulnerable Employment found that in many workplaces those employed in-house on better terms and conditions were union members, whilst those in contracted-out services would not be organised. The Commission made recommendations about how to improve union organisation of vulnerable workers. In London there has been a growth of ‘community organising’ recently, especially by London Citizens, which organises groups around work issues but outside the workplace. There is a debate about whether current labour market conditions, including the prevalence of migrant workers, suggest community-based organising of precarious workers can be better than traditional workplace-based organising and whether this is better done by community groups or unions (or both). Other forms of in-work support, including health and safety There are extensive health and safety laws in the UK, the current framework originating in the 1970s and expanded since.146 Recently the numbers killed, injured or suffering work-related ill-health have decreased significantly.147 But health and safety laws are still often flouted by some employers, including those in construction, and the health and safety inspectorate has reduced the number of prosecutions it brings.148 141 Dustmann, C., Machin, S. and Soskice, D. (2010), Inequality, Education and Comparative Political Economy,
Anglo-German Foundation for the Study of Industrial Society. 142 Department for Business, Enterprise and Regulatory Reform, Trades Union Congress and Confederation of
British Industry (2009), Reps in Action: How workplaces can gain from modern union representation. 143 Department for Business, Innovation and Skills (2009), The Blacklisting of Trade Unionists: Revised draft
regulations. 144 Bacon, N. and Samuel, P. (2009), ‘Partnership agreement adoption and survival in the British private and public
sectors’, Work, Employment and Society 23(2). 145 MacLeod, D. and Clarke, N. (2009), Engaging for Success: Enhancing performance through employee
engagement, London: Department for Business, Innovation and Skills. 146 See revised strategy of Health and Safety Executive (2009), The Health and Safety of Great Britain: Be part of
the solution, London: HSE Books. 147 Health and Safety Executive (2009), Health and Safety Statistics 2008-09, London: HSE Books. 148 House of Commons Work and Pensions Select Committee (2009), Workplace Health and Safety: Follow-up
report, Fourth Report (Session 2008-09), HC 635, London: The Stationery Office.
UNITED KINGDOM
31
Social security rights (e.g. sick/holiday leaves) The Commission on Vulnerable Employment found many workers in precarious employment and on the margins of the labour market either had fewer rights or found it difficult to enforce their rights for fear of losing their jobs. Even when workers take their employer to an employment tribunal and win, the award may not be enforced. Self-employed people often do not have labour rights as they are subject to civil/commercial law instead. Statutory social security schemes are less likely to include them; in the UK, for example, they can only get means-tested jobseeker’s allowance in the current recession.
4. Conclusion The Joseph Rowntree Foundation concluded that people’s personal characteristics had some impact on their risk of recurrent poverty, but that ‘structural labour market factors remain the strongest influence, implying that this is where the focus of efforts should lie’, with ‘key factors that need to be addressed’ if work is to be a sustainable route out of poverty. These include improving rights and conditions for agency workers; increasing pay levels; ensuring public procurement decisions work towards these goals; providing better careers advice; and making childcare more available and affordable for those on low incomes.149 This report does not easily lend itself to discussion of the self-employed. Yet – even leaving aside bogus self-employment – this group frequently earns less substantial and less regular incomes and lacks many employment and social security rights. An article about the ‘new self-employed’ (on the boundaries between self-employment and dependent employment) cites Supiot’s proposals that labour law could be expanded beyond the status of employee, or that employee status could be expanded to incorporate more workers; the UK has adopted the first, but this excludes those who run their own businesses from the category ‘worker’, and so only includes e.g. freelancers. The social partners have not represented the interests of self-employed people traditionally, though this is changing, especially for unions.150 Could self-employment be suggested as an area to investigate in terms of in-work poverty and labour market segmentation? The uncertainty about the outcome of the forthcoming general election in the UK (on May 6) means it is hard to know in which direction policies on in-work poverty and labour market segmentation will develop. For that reason, this report has largely analysed current not future policy measures. The Labour manifesto includes a ‘living wage’151 of £7.60 per hour for all public sector workers (though reports suggest this might only affect some 2,000). It promises to increase the National Minimum Wage in line with earnings. The Conservatives are no longer opposed to either the NMW or tax credits. The Liberal Democrats’ main tax proposal is to increase the personal tax threshold to £10,000 per year. But the possibility of a hung parliament makes it even more difficult to know which proposals will be agreed and prioritised.
149 Goulden, C. (2010), ‘Cycles of poverty, unemployment and low pay’, York: Joseph Rowntree Foundation. 150 Buschoff, K.S. and Schmidt, C. (2009), ’Adapting labour law and social security to the needs of the „new self-
employed“ – comparing the UK, Germany and the Netherlands’, Journal of European Social Policy 19(2), 147-159.
151 For information on campaigns on the ‘living wage’, see www.londoncitizens.org.uk and www.fairpaynetwork.org; for a discussion of the concept see Bennett, F. and Lister, R. (2010), The ‘Living Wage’: The right answer to low pay?, Freethinking briefing, Fabian Society: http://fabians.org.uk/publications/freethinking-papers/living-wage
UNITED KINGDOM
32
The recent report of the National Equality Panel demonstrated how government action can affect (and has recently affected) inequalities, and set out policy proposals to do so more successfully. In terms of labour market measures, the NEP suggested that policy challenges included:152
avoiding longer-term ‘scarring’ effects from early unemployment;
the processes that constrain the sectors and types of employment that people end up in or find difficult to access – including continuing discrimination in recruitment;
the particularly disadvantageous positions of the Bangladeshi and Pakistani populations;
the low level of hourly pay for part-time work;
improving the level of the National Minimum Wage as a potentially powerful weapon;
parental leave, flexible employment and childcare provision, affordability and cost are central;
the need for a stronger focus on policies affecting the employment of disabled people, especially those with mental health conditions;
lifelong learning and training going beyond the already well-qualified; and
reducing health inequalities throughout adulthood.153
152 National Equality Panel (2010), An Anatomy of Economic Inequality in the UK, London: Government Equalities
Office. 153 National Equality Panel (2010), An Anatomy of Economic Inequality in the UK, London: Government Equalities
Office.
UNITED KINGDOM
33
Appendix: Tables and Figures Table 1.1: Statistical overview EU indicators
UK EU25/27 1. In work at risk of poverty rate after social transfers 2007 All Men Women Full-time Part-time
8 8 8 6 13
8 9 7 7 12
2. Tax rates on low wages 2008 One earner couples with two children Single person with no children
84 52
65 50
3. Gender pay gap 2007 21 17 4. Gender segregation 2008 In occupations In sectors
24.8 18.2
26.0 19.4
5. Inactivity and part-time work due to lack of care services etc. 2008 All Men Women
4.8 0.8 9.2
4.6 0.3 8.9
6. Transitions by pay level decile 5 2006-2007 No employment to 1-3 Decile 4 Decile 5 Decile 6 Decile 7-10
12 17 42 18 11
15 15 37 18 15
7. Transitions by type of contract 2006-2007 Employee permanent Employee temporary Self-employed Unemployed Inactive
61 2 9 2 25
na
8. Diversity and reasons for contractual working arrangements 2008 All Total employees in part-time and/or fixed term contracts plus total self-employed as % persons in employment Part-time only Fixed term only Part-time and fixed term Could not find full-time and/or permanent job Total no standard employment Self-employed part-time All self-employed Men Total employees in part-time and/or fixed term contracts plus total self-employed as % persons in employment Part-time only Fixed term only Part-time and fixed term Could not find full-time and/or permanent job Total no standard employment Self-employed part-time All self-employed Women Total employees in part-time and/or fixed term contracts plus total self-
37.2 22.5 2.7 2.7 1.2 28.0 3.1 13.0 28.5 8.5 2.9 1.9 1.3 13.4 2.4 17.5
38.7 14.5 10.3 3.7 9.8 28.6 2.3 14.8 33.2 4.7 11.0 2.2 7.7 18.1 1.8 18.7
UNITED KINGDOM
34
employed as % persons in employment Part-time only Fixed term only Part-time and fixed term Could not find full-time and/or permanent job Total no standard employment Self-employed part-time All self-employed
47.4 37.2 2.5 3.5 1.2 43.3 3.9 7.7
45.5 25.5 9.5 5.4 12.1 40.6 2.9 10.0
9. Undeclared work na na 10. Overtime 2008 All Men Women Weekly hours 2008 Total Men Women
3.6 4.0 3.1 42.4 43.9 40.1
5.5* 6.6 4.4 40.5 41.3 39.3
11. Access to flexitime 2004 Total Men Women
33.5 36.3 30.6
31.3 33.0 29.4
Employment impact of parenthood for women 2007 21.5 12.6 *EU 15 Table 1.2: Individuals’ risk of poverty and composition of the poor by employment status (<60% median BHC 2007/8)
Risk of poverty Poverty composition One or more full-time self employment 19 10 Single/couple all in full-time work 2 3 Couple one full-time one part-time work 3 3 Couple one full-time one not working 15 9 No full time one or more part-time 26 14 Workless one or more 60 and over 27 25 Workless one or more unemployed 67 10 Workless other inactive 47 26 All 18 100
Source: DWP (2009)154 Tables 3.3 and 3.5
154 Department for Work and Pensions (2009) Households Below Average Income : An analysis of the income
distribution 1994/95-2007/08, London: DWP.
UNITED KINGDOM
35
Table 1.3: Children at risk of poverty and composition of the poor by employment status (<60 median BHC 2007/8) Risk of poverty Poverty composition Lone parent FT work 10 2 Lone parent PT work 22 6 Lone parent not working 55 30 Couple parent self employed 23 12 Both FTW 2 1 One FT one PT 4 4 One FT one not working 18 14 One or both PT 54 11 Both not working 68 19 All 23 100
Source: DWP (2009) HBAI Tables 4.3 and 4.5
Figure 1.1: Percentage of children in poverty with a parent in employment
Source DWP (2009) HBAI Table 4.5ts
UNITED KINGDOM
36
Table 1.4: Bivariate logistic odds of an individual being poor (under 60% equiv BHC income)*
One full-time worker
Two workers Only part-time workers
Not working All
Number of children in benefit unit:
0 1.0 1.0 1.0 1.0 1.0
1 1.6** 1.4 1.3* 1.1 1.2**
2 2.1*** 2.8*** 1.2 0.9 1.2**
3+ 3.0*** 3.6*** 2.6*** 1.6*** 2.2*** Disabled adult in benefit unit:
No 1.0 1.0 1.0 1.0 1.0
Yes 0.8 0.4** 1.1 3.4*** 2.5***
Ethnic group:
White 1.0 1.0 1.0 1.0 1.0
Mixed 1.5*** 1.2 1.0 1.6* 1.5*
Indian 3.2*** 2.3 1.4 1.0 1.4**
Pakistani/Bangladeshi/Other Asian
2.8 2.3 4.8*** 2.2*** 3.5***
Black Caribbean 1.7 - 0.8 1.7** 1.5**
Black Other 1.6 0.8 0.9 1.4* 1.4*
Chinese or Other 1.5 3.6*** 1.2 1.8*** 1.8***
Region:
England 1.0 1.0 1.0 1.0 1.0
Wales 0.8 0.2 1.2 1.6*** 1.4**
Scotland 0.7* 0.5** 0.9 1.2* 1.0
Northern Ireland 1.1 0.1* 1.0 1.5*** 1.4*** Tenure:
Owned outright 1.0 1.0 1.0 1.0 1.0
Owned with mortgage 0.9 1.3 0.4*** 0.3*** 0.4***
Council rented 1.9*** 0.7 1.4** 4.0*** 3.5***
Housing Association rented 1.2 0.6 1.2 3.3*** 2.7***
Private rented - unfurnished 1.5* 1.0 0.6** 1.3** 1.1 Private rented - furnished 0.9 0.2 0.8 1.4** 1.2
Sources: Own analysis of Family Resources Survey 2007/8 *Excluding pensioners and self employed Significance levels: p<0.5*; p<0.01**; p<0.001***
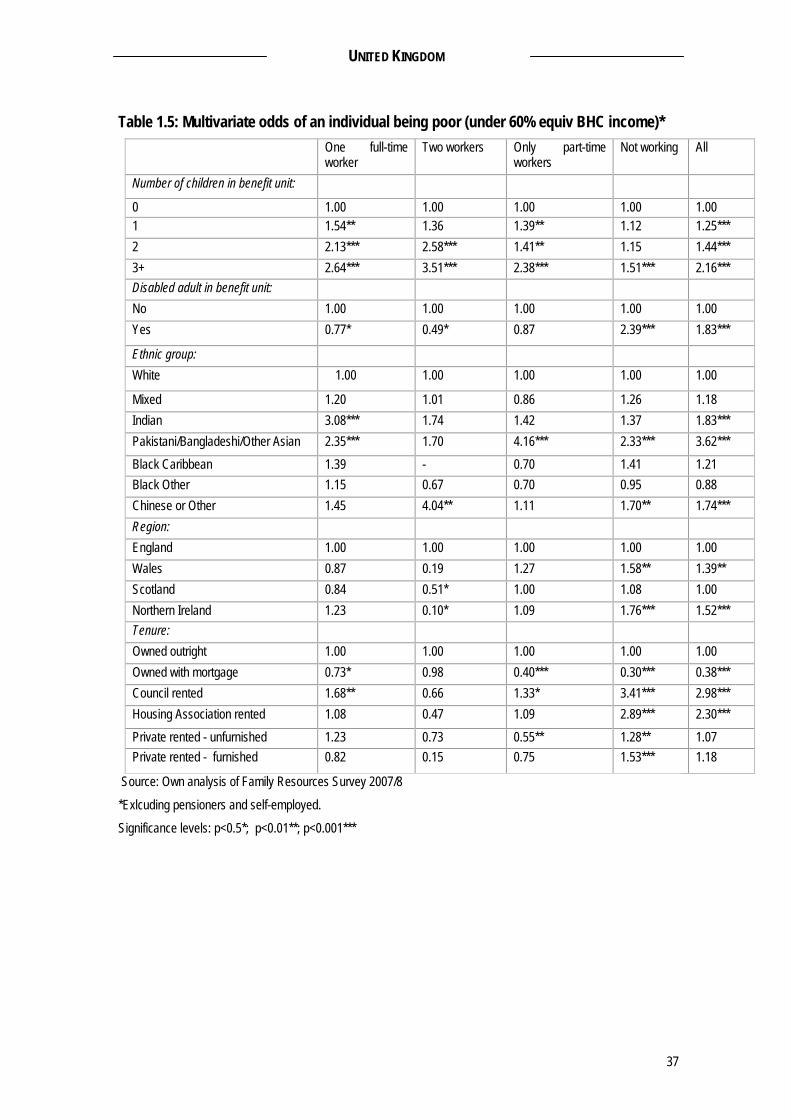
UNITED KINGDOM
37
Table 1.5: Multivariate odds of an individual being poor (under 60% equiv BHC income)* One full-time
worker Two workers Only part-time
workers Not working All
Number of children in benefit unit:
0 1.00 1.00 1.00 1.00 1.00 1 1.54** 1.36 1.39** 1.12 1.25*** 2 2.13*** 2.58*** 1.41** 1.15 1.44*** 3+ 2.64*** 3.51*** 2.38*** 1.51*** 2.16*** Disabled adult in benefit unit: No 1.00 1.00 1.00 1.00 1.00 Yes 0.77* 0.49* 0.87 2.39*** 1.83***
Ethnic group: White 1.00 1.00 1.00 1.00 1.00
Mixed 1.20 1.01 0.86 1.26 1.18 Indian 3.08*** 1.74 1.42 1.37 1.83*** Pakistani/Bangladeshi/Other Asian 2.35*** 1.70 4.16*** 2.33*** 3.62*** Black Caribbean 1.39 - 0.70 1.41 1.21 Black Other 1.15 0.67 0.70 0.95 0.88 Chinese or Other 1.45 4.04** 1.11 1.70** 1.74*** Region: England 1.00 1.00 1.00 1.00 1.00 Wales 0.87 0.19 1.27 1.58** 1.39** Scotland 0.84 0.51* 1.00 1.08 1.00 Northern Ireland 1.23 0.10* 1.09 1.76*** 1.52*** Tenure: Owned outright 1.00 1.00 1.00 1.00 1.00 Owned with mortgage 0.73* 0.98 0.40*** 0.30*** 0.38*** Council rented 1.68** 0.66 1.33* 3.41*** 2.98*** Housing Association rented 1.08 0.47 1.09 2.89*** 2.30*** Private rented - unfurnished 1.23 0.73 0.55** 1.28** 1.07 Private rented - furnished 0.82 0.15 0.75 1.53*** 1.18
Source: Own analysis of Family Resources Survey 2007/8
*Exlcuding pensioners and self-employed.
Significance levels: p<0.5*; p<0.01**; p<0.001***
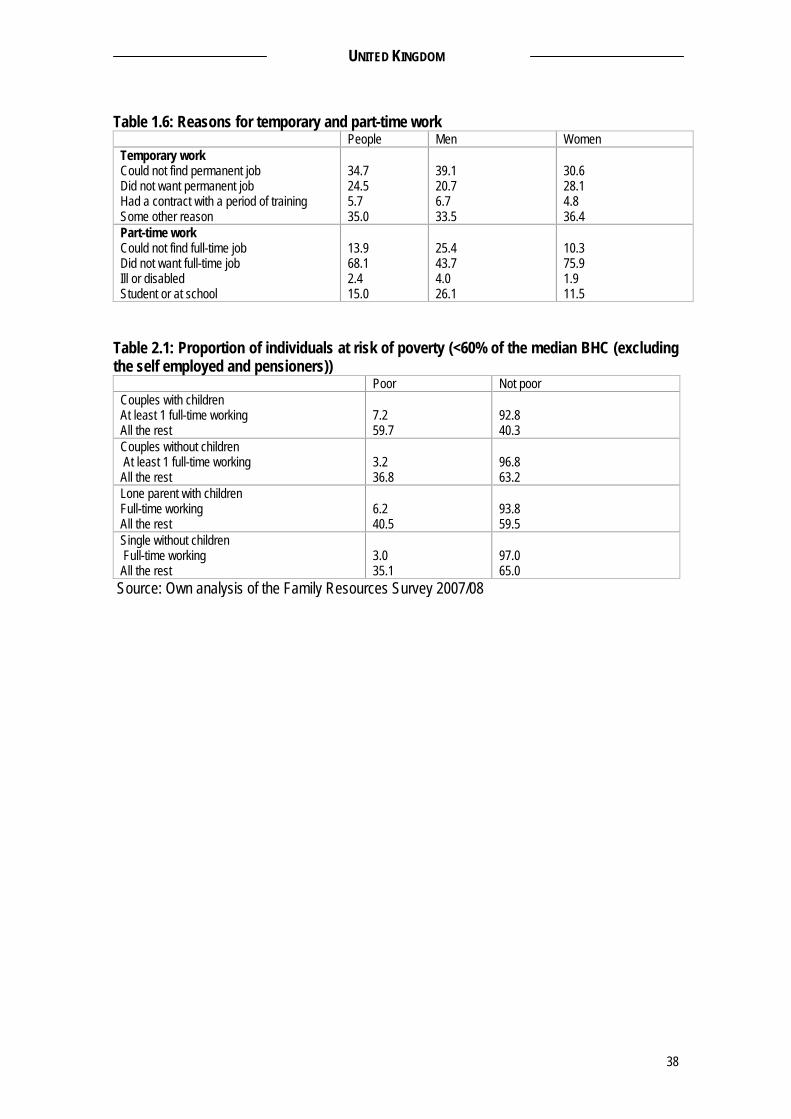
UNITED KINGDOM
38
Table 1.6: Reasons for temporary and part-time work People Men Women Temporary work Could not find permanent job Did not want permanent job Had a contract with a period of training Some other reason
34.7 24.5 5.7 35.0
39.1 20.7 6.7 33.5
30.6 28.1 4.8 36.4
Part-time work Could not find full-time job Did not want full-time job Ill or disabled Student or at school
13.9 68.1 2.4 15.0
25.4 43.7 4.0 26.1
10.3 75.9 1.9 11.5
Table 2.1: Proportion of individuals at risk of poverty (<60% of the median BHC (excluding the self employed and pensioners))
Poor Not poor Couples with children At least 1 full-time working All the rest
7.2 59.7
92.8 40.3
Couples without children At least 1 full-time working All the rest
3.2 36.8
96.8 63.2
Lone parent with children Full-time working All the rest
6.2 40.5
93.8 59.5
Single without children Full-time working All the rest
3.0 35.1
97.0 65.0
Source: Own analysis of the Family Resources Survey 2007/08
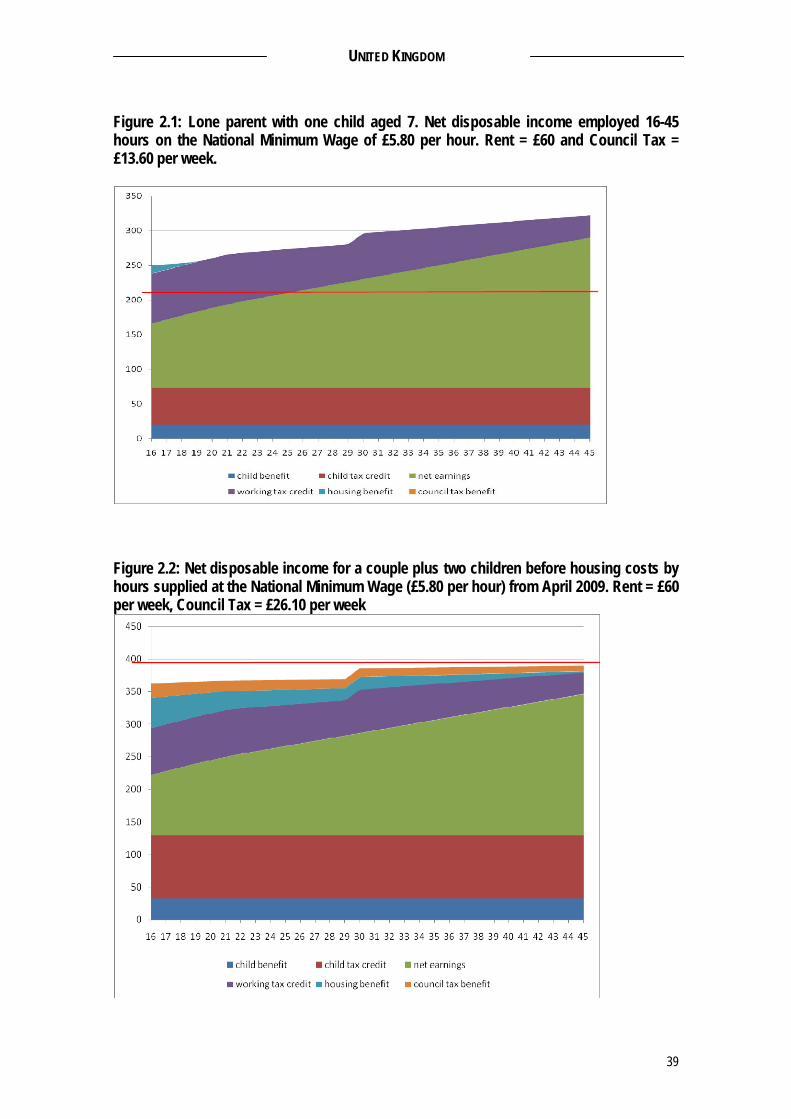
UNITED KINGDOM
39
Figure 2.1: Lone parent with one child aged 7. Net disposable income employed 16-45 hours on the National Minimum Wage of £5.80 per hour. Rent = £60 and Council Tax = £13.60 per week.
Figure 2.2: Net disposable income for a couple plus two children before housing costs by hours supplied at the National Minimum Wage (£5.80 per hour) from April 2009. Rent = £60 per week, Council Tax = £26.10 per week
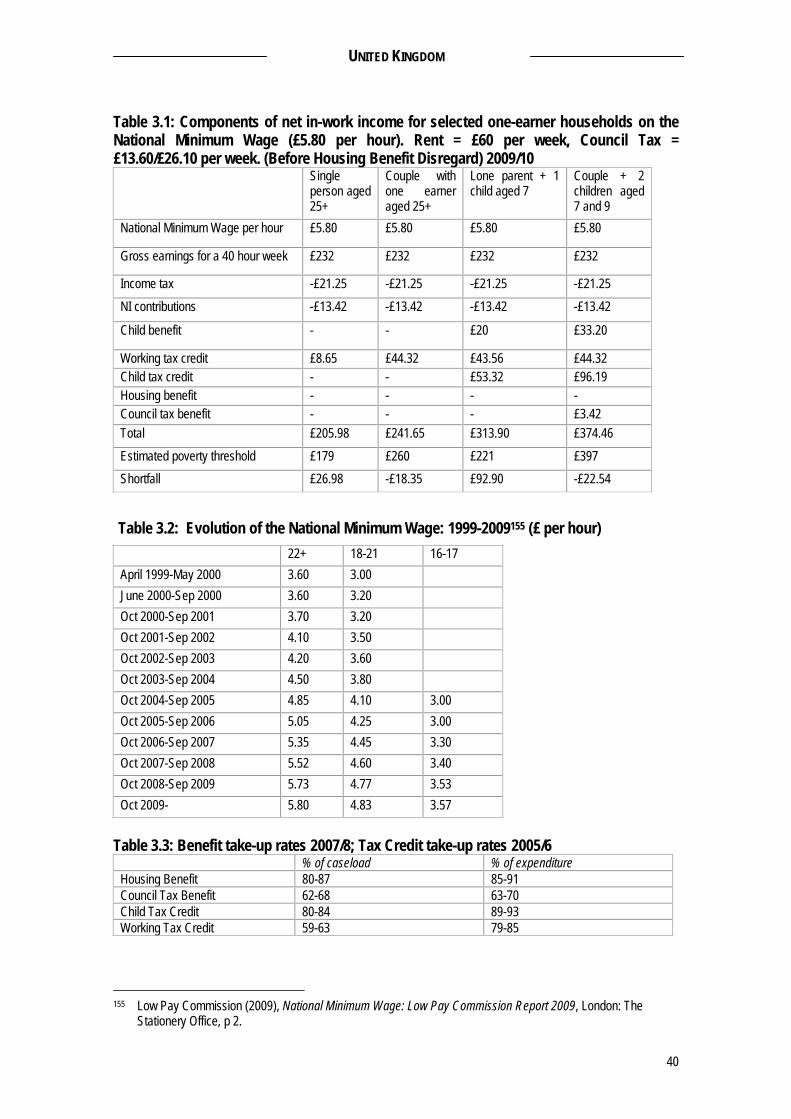
UNITED KINGDOM
40
Table 3.1: Components of net in-work income for selected one-earner households on the National Minimum Wage (£5.80 per hour). Rent = £60 per week, Council Tax = £13.60/£26.10 per week. (Before Housing Benefit Disregard) 2009/10
Single person aged 25+
Couple with one earner aged 25+
Lone parent + 1 child aged 7
Couple + 2 children aged 7 and 9
National Minimum Wage per hour £5.80 £5.80 £5.80 £5.80
Gross earnings for a 40 hour week £232 £232 £232 £232
Income tax -£21.25 -£21.25 -£21.25 -£21.25 NI contributions -£13.42 -£13.42 -£13.42 -£13.42
Child benefit - - £20 £33.20
Working tax credit £8.65 £44.32 £43.56 £44.32 Child tax credit - - £53.32 £96.19 Housing benefit - - - - Council tax benefit - - - £3.42 Total £205.98 £241.65 £313.90 £374.46 Estimated poverty threshold £179 £260 £221 £397 Shortfall £26.98 -£18.35 £92.90 -£22.54
Table 3.2: Evolution of the National Minimum Wage: 1999-2009155 (£ per hour) 22+ 18-21 16-17 April 1999-May 2000 3.60 3.00 June 2000-Sep 2000 3.60 3.20 Oct 2000-Sep 2001 3.70 3.20 Oct 2001-Sep 2002 4.10 3.50 Oct 2002-Sep 2003 4.20 3.60 Oct 2003-Sep 2004 4.50 3.80 Oct 2004-Sep 2005 4.85 4.10 3.00 Oct 2005-Sep 2006 5.05 4.25 3.00 Oct 2006-Sep 2007 5.35 4.45 3.30 Oct 2007-Sep 2008 5.52 4.60 3.40 Oct 2008-Sep 2009 5.73 4.77 3.53 Oct 2009- 5.80 4.83 3.57
Table 3.3: Benefit take-up rates 2007/8; Tax Credit take-up rates 2005/6
% of caseload % of expenditure Housing Benefit 80-87 85-91 Council Tax Benefit 62-68 63-70 Child Tax Credit 80-84 89-93 Working Tax Credit 59-63 79-85
155 Low Pay Commission (2009), National Minimum Wage: Low Pay Commission Report 2009, London: The
Stationery Office, p 2.
Related Documents