RESEARCH ARTICLE In Vivo Volatile Organic Compound Signatures of Mycobacterium avium subsp. paratuberculosis Andreas Bergmann 1 , Phillip Trefz 1 , Sina Fischer 2 , Klaus Klepik 1 , Gudrun Walter 2 , Markus Steffens 1 , Mario Ziller 3 , Jochen K. Schubert 1 , Petra Reinhold 2 , Heike Köhler 2 , Wolfram Miekisch 1 * 1 Department of Anaesthesia and Intensive Care, University Medicine Rostock, Rostock, Germany, 2 Institute of Molecular Pathogenesis, Friedrich-Loeffler-Institut (Federal Research Institute for Animal Health), Jena, Germany, 3 Friedrich-Loeffler-Institut (Federal Research Institute for Animal Health), Greifswald, Germany, and Biomathematics Working Group,Insel Riems, Germany * [email protected] Abstract Mycobacterium avium ssp. paratuberculosis (MAP) is the causative agent of a chronic en- teric disease of ruminants. Available diagnostic tests are complex and slow. In vitro, vola- tile organic compound (VOC) patterns emitted from MAP cultures mirrored bacterial growth and enabled distinction of different strains. This study was intended to determine VOCs in vivo in the controlled setting of an animal model. VOCs were pre-concentrated from breath and feces of 42 goats (16 controls and 26 MAP-inoculated animals) by means of needle trap microextraction (breath) and solid phase microextraction (feces) and ana- lyzed by gas chromatography/ mass spectrometry. Analyses were performed 18, 29, 33, 41 and 48 weeks after inoculation. MAP-specific antibodies and MAP-specific interferon- γ-response were determined from blood. Identities of all marker-VOCs were confirmed through analysis of pure reference substances. Based on detection limits in the high pptV and linear ranges of two orders of magnitude more than 100 VOCs could be detected in breath and in headspace over feces. Twenty eight substances differed between inoculat- ed and non-inoculated animals. Although patterns of most prominent substances such as furans, oxygenated substances and hydrocarbons changed in the course of infection, dif- ferences between inoculated and non-inoculated animals remained detectable at any time for 16 substances in feces and 3 VOCs in breath. Differences of VOC concentrations over feces reflected presence of MAP bacteria. Differences in VOC profiles from breath were linked to the host response in terms of interferon-γ-response. In a perspective in vivo analysis of VOCs may help to overcome limitations of established tests. PLOS ONE | DOI:10.1371/journal.pone.0123980 April 27, 2015 1 / 20 a11111 OPEN ACCESS Citation: Bergmann A, Trefz P, Fischer S, Klepik K, Walter G, Steffens M, et al. (2015) In Vivo Volatile Organic Compound Signatures of Mycobacterium avium subsp. paratuberculosis. PLoS ONE 10(4): e0123980. doi:10.1371/journal.pone.0123980 Received: October 29, 2014 Accepted: February 24, 2015 Published: April 27, 2015 Copyright: © 2015 Bergmann et al. This is an open access article distributed under the terms of the Creative Commons Attribution License, which permits unrestricted use, distribution, and reproduction in any medium, provided the original author and source are credited. Data Availability Statement: All relevant data are within the paper and its Supporting Information files. Funding: The authors are very grateful to the German Research Foundation (DFG, www.dfg.de, Grant number RE 1098/4-1, SCHU 1960/4-1) for their trust in work of the whole project. The funders had no role in study design, data collection and analysis, decision to publish, or preparation of the manuscript. Competing Interests: The authors have declared that no competing interests exist.

Welcome message from author
This document is posted to help you gain knowledge. Please leave a comment to let me know what you think about it! Share it to your friends and learn new things together.
Transcript

RESEARCH ARTICLE
In Vivo Volatile Organic CompoundSignatures ofMycobacterium avium subsp.paratuberculosisAndreas Bergmann1, Phillip Trefz1, Sina Fischer2, Klaus Klepik1, GudrunWalter2,Markus Steffens1, Mario Ziller3, Jochen K. Schubert1, Petra Reinhold2, Heike Köhler2,WolframMiekisch1*
1 Department of Anaesthesia and Intensive Care, University Medicine Rostock, Rostock, Germany,2 Institute of Molecular Pathogenesis, Friedrich-Loeffler-Institut (Federal Research Institute for AnimalHealth), Jena, Germany, 3 Friedrich-Loeffler-Institut (Federal Research Institute for Animal Health),Greifswald, Germany, and Biomathematics Working Group,Insel Riems, Germany
AbstractMycobacterium avium ssp. paratuberculosis (MAP) is the causative agent of a chronic en-
teric disease of ruminants. Available diagnostic tests are complex and slow. In vitro, vola-tile organic compound (VOC) patterns emitted from MAP cultures mirrored bacterial
growth and enabled distinction of different strains. This study was intended to determine
VOCs in vivo in the controlled setting of an animal model. VOCs were pre-concentrated
from breath and feces of 42 goats (16 controls and 26 MAP-inoculated animals) by means
of needle trap microextraction (breath) and solid phase microextraction (feces) and ana-
lyzed by gas chromatography/ mass spectrometry. Analyses were performed 18, 29, 33,
41 and 48 weeks after inoculation. MAP-specific antibodies and MAP-specific interferon-
γ-response were determined from blood. Identities of all marker-VOCs were confirmed
through analysis of pure reference substances. Based on detection limits in the high pptV
and linear ranges of two orders of magnitude more than 100 VOCs could be detected in
breath and in headspace over feces. Twenty eight substances differed between inoculat-
ed and non-inoculated animals. Although patterns of most prominent substances such as
furans, oxygenated substances and hydrocarbons changed in the course of infection, dif-
ferences between inoculated and non-inoculated animals remained detectable at any
time for 16 substances in feces and 3 VOCs in breath. Differences of VOC concentrations
over feces reflected presence of MAP bacteria. Differences in VOC profiles from breath
were linked to the host response in terms of interferon-γ-response. In a perspective in vivoanalysis of VOCs may help to overcome limitations of established tests.
PLOS ONE | DOI:10.1371/journal.pone.0123980 April 27, 2015 1 / 20
a11111
OPEN ACCESS
Citation: Bergmann A, Trefz P, Fischer S, Klepik K,Walter G, Steffens M, et al. (2015) In Vivo VolatileOrganic Compound Signatures of Mycobacteriumavium subsp. paratuberculosis. PLoS ONE 10(4):e0123980. doi:10.1371/journal.pone.0123980
Received: October 29, 2014
Accepted: February 24, 2015
Published: April 27, 2015
Copyright: © 2015 Bergmann et al. This is an openaccess article distributed under the terms of theCreative Commons Attribution License, which permitsunrestricted use, distribution, and reproduction in anymedium, provided the original author and source arecredited.
Data Availability Statement: All relevant data arewithin the paper and its Supporting Information files.
Funding: The authors are very grateful to theGerman Research Foundation (DFG, www.dfg.de,Grant number RE 1098/4-1, SCHU 1960/4-1) for theirtrust in work of the whole project. The funders had norole in study design, data collection and analysis,decision to publish, or preparation of the manuscript.
Competing Interests: The authors have declaredthat no competing interests exist.

IntroductionMycobacterium avium ssp. paratuberculosis (MAP) is the causative agent of paratuberculosis, achronic enteric disease of ruminants (also called Johne’s disease). In the US, Johne’s diseasecauses an estimated loss of more than two hundred million dollars per year due to reduced pro-ductivity of dairy cattle [1]. Being intestinal pathogens these bacteria are also suspected to con-tribute to the pathogenesis of Crohn’s disease, a chronic bowel disease in humans [2–5].
The currently established diagnostic methods for paratuberculosis have limitations. Despitestate-of-the-art technologies, in vivo diagnosis of paratuberculosis demands either fecal shed-ding of the organisms or sero-conversion, which both occur only irregularly during the clini-cally non-apparent phase of the disease [6–9]. Cultural detection of MAP in feces or in tissuesamples after necropsy is labor intensive and time consuming, while the sensitivity of PCRmethods can be affected by low and variable numbers of bacteria in feces and the co-purifica-tion of PCR inhibitors during DNA extraction [10]. Novel diagnostic methods, therefore,could gain considerable importance for animal and human health.
More than 300 different VOCs were found in headspace over bacterial cultures [9, 11], feces[12–15] or in breath. Fecal infections with pathogens like Clostridium difficile [12, 16, 17],Campylobacter jejuni [12, 17], rotavirus, enteric virus [17] and Vibrio cholera 01 [13] as well aschronic bowel diseases like Crohn’s disease, ulcerative colitis, irritable bowel syndrome [14, 15,18] were investigated in the past decade. A general problem in analyses performed with sam-ples from feces lies in the fact that the predominant part of gut microbiota are commensal bac-teria such as E. coli. As a considerable fraction of VOCs found in feces will, therefore, begenerated by these bacteria, a well matched control group has to be analyzed in order to identi-fy VOC patterns of pathogenic bacteria.
VOC patterns in breath have been proposed for identification of tuberculosis, the most im-portant mycobacterial infection in humans [19]. Seven substances were found in breath gasdiscriminating smear positive from smear negative patients in vivo. Two of these substanceswere also detected in headspace over sputum [20].
In animals, differential ion mobility spectroscopy (DMS) was applied in vivo for the identifi-cation of MAP infection. In this study, exhaled breath and headspace over feces of goats wereanalyzed. The composition of VOC patterns differed significantly between chronically infectedand non-infected animals [8]. Similar attempts were made with electronic-nose systems(e-nose) analyzing headspace over serum samples of cattle [21].
As unequivocal substance identification is not possible by means of unspecific techniquessuch as e-nose or DMS, the impact of different substances onto those “VOC features” is stillunclear. In addition, the role of potential contaminations from ambient air, previous exposureor medication has to be taken into account. To solve these problems, analytical methods beingsensitive and specific enough to quantify and to identify VOCs in trace levels have to be ap-plied. These requirements are optimally met by gas chromatography mass spectrometry(GC-MS) [6, 22, 23].
In recent studies we described VOC patterns consisting of 34 VOCs as potential marker setsfor detecting in vitro growth of MAP. VOCs were collected in headspace over cultures and ana-lyzed using solid phase microextraction (SPME) in combination with gas chromatographymass spectrometry (GC-MS) [9]. The VOC-patterns mirrored bacterial growth and also en-abled distinction of different strains. Transfer of results from in vitro tests to in vivomay causecrucial misinterpretations if interactions with the host organism or methodological influencessuch as effects of sample storage or conversion of substances during analysis, are not addressedproperly [24, 25]
In Vivo VOC Signatures in MAP Infected Goats
PLOS ONE | DOI:10.1371/journal.pone.0123980 April 27, 2015 2 / 20

Therefore, the present study was intended to apply VOC analyses in vivo in the controlledsetting of an animal model for MAP infection. The following issues were addressed in detail:
• Are there differences between inoculated and non-inoculated animals in terms of VOC pro-files in breath and feces?
• Do VOC patterns over feces and in breath correspond to each other?
• Do VOC signatures change during the course of infection?
• Can the previously described VOC markers emitted from MAP cultures be detected in the invivo setting?
Animals, Materials and Methods
AnimalsAll 42 goats belonged to the same domestic race (Thüringer Wald Ziege) and were purchasedfrom a local goat holding. Twenty six goats were inoculated withMycobacterium avium ssp.paratuberculosis (strain JII-1961) essentially as described elsewhere [7]. In brief, they receiveddoses of 10 mg bacterial wet mass of the MAP strain ten times every two to three days. Each in-dividual dose was suspended in 50 mL of pre-warmed milk replacer and was administered oral-ly prior to regular morning feeding. The overall bacterial inoculum amounted to 2.6 x 10⁸ cfuper animal. Additionally, 16 goats were not inoculated and were considered as healthy controls.Inoculated and non-inoculated goats were kept in separate stables. The 26 inoculated goatswere divided into two groups and kept in different stables. Animal husbandry, preparation ofinoculation batches as well as inoculation procedures were carried out as described recently[7]. Control animals were about four weeks younger than the inoculated group of animals.
Twelve, 24 and 36 weeks after the end of inoculation (wpi) seven and twice six inoculatedanimals and three controls each were dissected. The remaining inoculated (n = 7) and controlanimals (n = 7) were dissected at the end of the experiment at 52 wpi. Infection was confirmedin 25/26 of the MAP-inoculated goats by cultural isolation of MAP from tissue samples. MAPwas not recovered from any of the control animals [7].
Ethics statement. This study was carried out in strict accordance with European and Na-tional Law for the Care and Use of Animals. The protocol was approved by the Committee onEthics of Animal Experiments and Protection of Animals of the State of Thuringia, Germany(Permit Number: 04-001/11). All experiments were done in containment of biosafety level 2under supervision of the authorized institutional Agent for Animal Protection. During the en-tire study, every effort was made to minimize suffering of the animals.
MaterialsEquipment. In order to identify and quantify volatile organic compounds we adapted
microextraction techniques for pre-concentration and applied GC-MS for analysis. For VOCdetermination in the headspace above feces, solid phase microextraction (SPME) was applied.For the breath analyses, needle trap microextraction (NTME) was used.
SPME fiber assemblies (PDMS-Carboxen; 75μm) and SPME Injection sleeves (0.75mm ID,part. no.: 2–6375.05) were bought from Supelco (Bellefonte, USA). A SPME-auto-sampler(Combi-PAL, CTC-analytics, Zwingen, Switzerland) was used.
Needle trap devices (NTDs) packed with 2 cm of a copolymer of methacrylic acid and ethyl-ene glycol dimethacrylate were obtained from Shinwa Ltd., Japan (NeedleEx) [23]. A custom-made NTD-heating-station, NTD-auto-sampler, Teflon-caps and magnetic cap with a Teflon-
In Vivo VOC Signatures in MAP Infected Goats
PLOS ONE | DOI:10.1371/journal.pone.0123980 April 27, 2015 3 / 20

inlet for sealing of NTDs were bought from PAS Technology (Magdala, Germany). The20-mL-headspace-vials and Teflon-coated rubber septa in combination with magnetic crimpcaps were purchased from Gerstel GmbH & Co.KG (Muelheim/Ruhr, Germany).
Gas chromatographs (GC) (model-no.: 7890A) in combination with inert XL mass selectivedetectors (MS) (model-no.: 5975C), long life non-stick septa and non-stick Liner O-rings werebought from Agilent Technologies (Boeblingen, Germany).
A CP-Pora Bond Q Fused Silica Column (25 m, 0.32 mm, Varian) was applied for the analy-sis of the SPME samples. A RTX-624 (60 m; 0.32 mm; 1.8 μm film thickness) Restek, BadSoden, Germany) capillary column was used for NTME analysis.
Reference substances. Identities of all VOCs considered as potential marker substanceswere confirmed through analysis of pure reference substances.
Acetone, 2-butanone, hexanal, nonanal, isoprene and benzene were acquired from IonimedAnalytik GmbH (Innsbruck, Austria). Butane, pentane and hexane were bought from Supelco(Bellefonte, USA). Methyl-isobutyl-ketone, 1-propanol, styrene, 3-octanone, 2-heptanone,furan, heptane, methylacetate, 2-methylfuran, 2-ethylfuran, 2-pentylfuran, 2-pentanone,2-hexanone, 3-hexanone, 3-methyl-2-butanone, 3-methyl-2-pentanone, 2-propanethiol anddimethylsulfide were purchased from Fluka/Sigma-Aldrich (Steinheim, Germany). 2-Methyl-butanal and dimethyldisulfide were bought from Abbott GmbH & Co.KG (Wiesbaden, Ger-many). Ethylbenzene was acquired fromMerck (Darmstadt, Germany). 3-methylfuran and3-methylbutanal was purchased from TCI Europe N.V. (Zwijndrecht, Belgium).
MethodsSampling. Five measuring campaigns in the infected animals and the control group were
carried out during a period of 8 months. Table 1 shows a detailed overview of breath gas andfeces sampling. Sampling from inoculated goats and healthy animals was always done at thesame day, irrespective of the individual age of the goats.
Feces. Samples from headspace over feces were pre-concentrated by means of SPME andanalyzed by means of GC-MS. Feces were collected into 20 mL headspace vials and sealed withTeflon-coated rubber septa in combination with magnetic crimp caps. Carboxen/PDMS-con-taining SPME-fibers were used for all measurements. Before SPME-fibers were used for thefirst time, they were conditioned in a GC-injector at 300°C for 1h. Afterwards fibers were re-tracted and tips of the fibers were sealed until usage. Feces samples were conditioned at 42°Cfor 3 min. Fibers were pierced through the septum and exposed to the headspace of the fecesfor 7 min. The sample was agitated during equilibration with 500 rpm using the CTC-PAL sys-tem. Afterwards fibers were retracted and immediately injected into the hot injector for mea-surement. Before each reuse, SPME-fibers were reconditioned again at 290°C in the GCinjector for 30min.
Blank runs of the fibers were performed on every day before the measurements to ensurethat the SPME-coating was clean and that no uncontrolled bleeding of column, septa or fiber
Table 1. Overview of breath gas samples (b) and feces samples (f) taken from goats.
weeks after inoculation 18 29 33 41 48 Σsampled animals
inoculated animals b 11 6 13 7 6 43
f 19 13 13 7 5 57
non-inoculated animals b 13 8 10 7 7 45
f 16 10 10 7 7 50
doi:10.1371/journal.pone.0123980.t001
In Vivo VOC Signatures in MAP Infected Goats
PLOS ONE | DOI:10.1371/journal.pone.0123980 April 27, 2015 4 / 20
took place. In order to control the quality of SPME-fibers, a consistent concentration (ppb-range) of 2,3-dimethyl-1,3-butadiene in methanol was analyzed at the beginning and at theend of every GC-MS sampling queue.
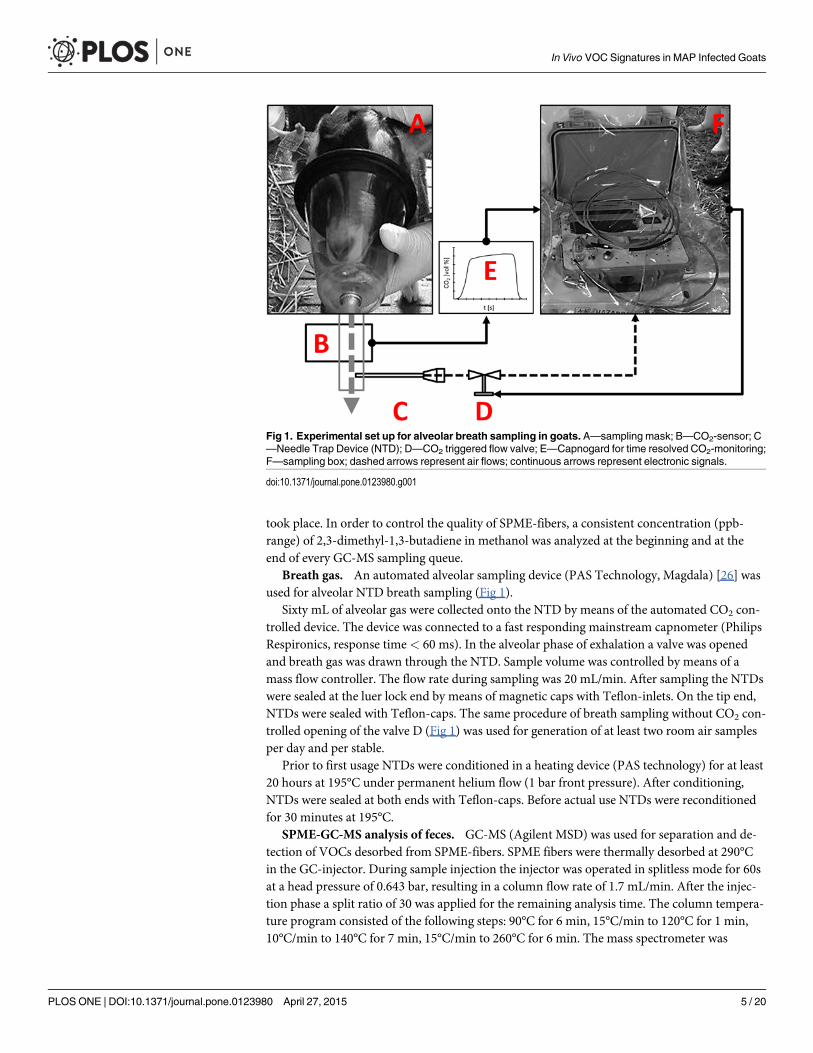
Breath gas. An automated alveolar sampling device (PAS Technology, Magdala) [26] wasused for alveolar NTD breath sampling (Fig 1).
Sixty mL of alveolar gas were collected onto the NTD by means of the automated CO2 con-trolled device. The device was connected to a fast responding mainstream capnometer (PhilipsRespironics, response time< 60 ms). In the alveolar phase of exhalation a valve was openedand breath gas was drawn through the NTD. Sample volume was controlled by means of amass flow controller. The flow rate during sampling was 20 mL/min. After sampling the NTDswere sealed at the luer lock end by means of magnetic caps with Teflon-inlets. On the tip end,NTDs were sealed with Teflon-caps. The same procedure of breath sampling without CO2 con-trolled opening of the valve D (Fig 1) was used for generation of at least two room air samplesper day and per stable.
Prior to first usage NTDs were conditioned in a heating device (PAS technology) for at least20 hours at 195°C under permanent helium flow (1 bar front pressure). After conditioning,NTDs were sealed at both ends with Teflon-caps. Before actual use NTDs were reconditionedfor 30 minutes at 195°C.
SPME-GC-MS analysis of feces. GC-MS (Agilent MSD) was used for separation and de-tection of VOCs desorbed from SPME-fibers. SPME fibers were thermally desorbed at 290°Cin the GC-injector. During sample injection the injector was operated in splitless mode for 60sat a head pressure of 0.643 bar, resulting in a column flow rate of 1.7 mL/min. After the injec-tion phase a split ratio of 30 was applied for the remaining analysis time. The column tempera-ture program consisted of the following steps: 90°C for 6 min, 15°C/min to 120°C for 1 min,10°C/min to 140°C for 7 min, 15°C/min to 260°C for 6 min. The mass spectrometer was
Fig 1. Experimental set up for alveolar breath sampling in goats. A—sampling mask; B—CO2-sensor; C—Needle Trap Device (NTD); D—CO2 triggered flow valve; E—Capnogard for time resolved CO2-monitoring;F—sampling box; dashed arrows represent air flows; continuous arrows represent electronic signals.
doi:10.1371/journal.pone.0123980.g001
In Vivo VOC Signatures in MAP Infected Goats
PLOS ONE | DOI:10.1371/journal.pone.0123980 April 27, 2015 5 / 20
operated in electron impact ionization (70 eV) mode and recording was done in full scanmode. The mass range was 35–300 amu and the scan rate was 2.73 scans per second. The tem-perature of the ion source was set to 230°C and the temperature of the transfer line was set to280°C. Extracted ion counts (EIC) were used to calculate peak areas for all compounds. Peakareas were calculated using Agilent MSD Chemstation (E.02.00.493) Software.
NTD-GC-MS analysis of breath gas. GC-MS (Agilent MSD) was used for separation anddetection of VOCs desorbed from the NTDs. Teflon-caps at the tip end were stripped off bythe NTD-auto-sampler (Concept, PAS Technology, Germany) prior to injection. Automaticdesorption of NTDs was realized by automated insertion of NTDs into the injection port [27].NTDs were thermally desorbed using the expansive flow technique in the injection port of theGC (splitless mode). The temperature of the injector was 200°C [28]. During desorption the in-jector was operated in splitless mode for 30s at a head pressure of 0.603 bar, resulting in a col-umn flow rate of 1.5 ml/min. After the injection phase a split ratio of 33 was applied for theremaining analysis time. The column temperature program consisted of the following steps:40°C for 5 min, 8°C/min to 120°C for 2 min, 10°C/min to 220°C, 20°C/min to 250°C for 4 min.The mass spectrometer was operated in electron impact ionization (70 eV) mode and recordingwas done in full scan mode. Mass range was 50–300 amu and scan rate was 2.73 scans per sec-ond. Temperature of the ion source was 250°C and temperature of the transfer line was 240°C.Extracted ion counts (EIC) were used to calculate peak areas for all compounds. Peak areaswere calculated using Agilent MSD Chemstation (E.02.00.493) Software.
Identification and quantification of marker substances by means of GC-MS. Tentativesubstance identification was done by means of mass spectral library (NIST 2005 Gatesburg,PA, USA) search. Compounds with concentration differences between inoculated and non-in-oculated animals were considered as potential marker substances.
GC retention times and mass spectra of all potential marker compounds were verifiedthrough analysis of pure reference substances. The substance lists are given in Table 2. Sub-stances marked with an asterisk (�) in Table 2b had been identified as potential biomarkers forMAP bacteria in a former in vitro study [9].
For quantification, gas standards were prepared in concentrations between 1 and 50 ppbV.For acetone, 3-octanone, 1-propanol, 2-butanone, 2-pentanone, 2-hexanone, 3-methyl-2-pen-tanone, methylacetate and dimethylsulfide higher concentrations were prepared additionallyfor calibration. At least five different concentration levels were prepared for calibration of eachsubstance. Calibration mixtures of pure reference materials not available as gaseous standardswere prepared by transferring liquid reference substances into an evacuated 100 mL gas bulbby means of a 10μL syringe. The gas bulb was then equilibrated with pure nitrogen. 50 μL ofthe gas mixture were transferred into a Tedlar-bag filled with 1 L of nitrogen. Different concen-tration levels were prepared by further dilution with nitrogen. For SPME calibration, 15 mL ofthese gas standards were transferred into evacuated 20 mL headspace vials and pressure wasequilibrated with nitrogen. All gas standards were pre-concentrated by means of SPME underthe same conditions as the headspace of the feces samples. For NTD calibration 50 mL of gasstandard was pre-concentrated on the NTD device similar to sampling of breath gas.
Limits of detection (LODs) and limits of quantitation (LOQs) for SPME-GC-MS andNTME-GC-MS methods were determined by means of the signal to noise ratio. Noise level wasdetermined experimentally from blank samples. LOD was defined as S/N of 3, LOQ as S/N of 10.
Blood samples. Blood samples were collected from inoculated and control animals in reg-ular intervals. 20 mL of heparinized blood were collected from each animal in intervals of fourweeks until the end of the experiment starting at 4 weeks after inoculation. The serum antibodyresponse was measured with the ID Screen Paratuberculosis Indirect ELISA (ID Vet, Montpel-lier, France) according to the instructions of the manufacturer. The antibody response was
In Vivo VOC Signatures in MAP Infected Goats
PLOS ONE | DOI:10.1371/journal.pone.0123980 April 27, 2015 6 / 20

demonstrated by the sample-to-positive ratio (S/P %). The interferon-γ response after 24 hstimulation of peripheral blood mononuclear cells (PBMC) with Johnin purified protein deriv-ative (JPPD, 4 μg/mL), was measured with an in-house ELISA based on monoclonal captureand detection antibodies against bovine IFN-γ (AbD Serotec, Kidlington, UK).
It was assumed that the non-inoculated control group represented a population whosephysiological responses were comparable to natural non-infected animals. Inoculated animals
Table 2. Retention times, regression coefficients, detection limits and concentration ranges of selected VOCmarker substances from breath (a)and feces (b).
substance VOC-concentration [ppbV]
retention time R2 LOD LOQ inoculated animals non-inoculated animals
43 measurements 45 measurements
a) breath [min] [/] [ppbV] 25% median 75% 25% median 75%
1-Propanol 9.96 0.976 1.41 3.48 184 258 445 69 214 528
2-Butanone 10.95 0.993 0.19 0.36 0.39 0.54 0.68 0.48 0.67 0.95
Acetone 7.53 0.854 0.25 0.45 22.2 30 38.7 26.7 32.7 38.3
Benzene 12.44 0.994 0.50 1.06 † 0.52 0.64 † 0.58 0.75
Butanal, 2-methyl- 12.99 0.977 0.08 0.11 † † 0.24 † 0.33 0.57
Ethylbenzene 19.04 0.984 0.11 0.24 † † 0.13 † † 0.17
Hexanal 17.5 0.995 0.11 0.28 0.45 0.62 0.91 0.49 0.62 0.81
Nonanal 25.32 0.954 0.40 0.91 1.44 2.02 3.09 1.51 2.27 3.12
Styrene 20.18 0.982 0.02 0.03 0.05 0.09 0.24 0.03 0.06 0.21
b) feces 57 measurements 50 measurements
Pentane* 13.22 0.999 2.41 11.1 13.5 18.1 23.1 11.8 16.6 21.1
Hexane* 20.58 0.999 4.41 16.3 1.9 10 12.4 † † 9.4
Heptane* 23.83 0.998 2.64 8.81 7.4 8.9 12.1 6 8.2 10
Acetone* 10.11 0.999 7.06 24.8 613 857 1180 273 379 476
2-Butanone 16.06 1.000 0.43 1.26 53 100 169 46 78 107
2-Pentanone 22.13 0.998 1.69 5.64 278 416 586 192 276 339
2-Hexanone 24.97 0.997 5.39 18.0 117 174 224 59 95 120
2-Heptanone* 26.46 0.999 2.98 9.94 27.4 36.9 46.3 21.5 26 34.2
3-Octanone* 28.36 0.999 22.6 75.5 41.1 58.3 90.6 25.3 51 86.1
2-Butanone, 3-methyl- 21.53 0.997 0.53 1.77 23.8 28.5 36.4 29.1 39.4 72.7
2-Pentatone, 3-methyl- 24.22 0.997 1.79 5.95 24.1 34.1 63.9 13.4 17.9 27.5
Methyl Isobutyl Ketone* 24.00 0.998 1.26 4.19 9.7 13.2 16.9 6 7.8 10.9
Isoprene* 12.63 1.000 1.22 4.65 20 27.2 35.1 4.2 12.5 22.1
Acetic acid, methyl ester* 11.57 0.999 0.29 0.97 42.5 49.6 61.4 45.6 57.1 72.3
Sulfide, dimethyl 10.91 0.997 0.99 3.29 473 869 1316 99 183 360
Disulfide, dimethyl* 22.61 0.993 0.08 0.26 0.5 2 6.5 † 0.4 1.1
Furan* 9.81 0.999 0.10 0.35 1.5 1.8 2.3 1.6 1.9 2.8
Furan, 2-ethyl-* 21.95 0.998 0.19 0.65 8.3 10.1 12.4 4.6 6.1 7.7
Furan, 2-methyl-* 15.82 0.993 9.6 31.8 16.4 20.3 27.6 11.9 14.9 17.2
Furan, 3-methyl-* 16.62 0.996 0.13 0.42 24.1 31.8 40.1 17.3 21 25.6
Furan, 2-pentyl-* 28.40 0.995 4.64 15.5 23.6 28.2 34.5 19.3 24.6 33.2
R2—coefficient of determination;LOD—limit of detection;LOQ—limit of quantification
* potential marker substances from a former in vitro study [9]† values lower than LOD
doi:10.1371/journal.pone.0123980.t002
In Vivo VOC Signatures in MAP Infected Goats
PLOS ONE | DOI:10.1371/journal.pone.0123980 April 27, 2015 7 / 20

were possibly representing progress of infection. Therefore, cut-off-values with high specificity(>99%), estimated via Receiver-operating-characteristics- (= ROC)-analysis, were chosen forboth MAP-specific features. These cut-off-values were used for labeling of results in PCA-scat-terplots of VOC-measurements which are given in Fig 2.
Statistical methods and visualizations. For all statistical methods and visualizations onlyquantified data were used. Visualization of VOC patterns in two-color heat maps was donewith substance concentrations normalized by means of the maximum in the data set.
Principle component analyses (PCA) were performed by means of The Unscrambler 9.7and 10.3 (Camo Software AS). For that purpose, data were normalized onto standard devia-tions and cross-validation was applied as validation method.
Mann-Whitney-U-tests, t-tests and ROC-analyses were realized by means of Sigmastat 3.5as well as SigmaPlot (Version 10.0.0.54; Systat, San Jose, USA). Significance levels were set to α= 0.05. Values of p� 0.05 meant that there were no significant differences between the twotested groups. No significance test was performed if percentiles of regarded groups were lowerthan LOD. Confidence level for ROC-analysis was set to 99%. In case of normal distribution, t-tests instead of U-tests were performed.
ResultsMore than 100 substances could be detected in breath and in feces of the animals by means ofGC-MS-analysis. Detection limits in the high pptV- or low ppbV- and linear ranges of two or-ders of magnitude could be achieved. Twenty eight substances could be identified having
Fig 2. PCA-scatterplots of VOC patterns in breath gas (a) and headspace over feces (b) in relation toMAP-specific antibody levels and to the interferon-γ response.Red dots represent S/P-ratios of theantibody-ELISA higher than 51 and stimulation-indices of the interferon-γ response higher than 1.157,respectively. The loading plot referring to the PCA results from breath gas is given in S1 Fig and the loadingplot referring to the PCA analysis of results from feces is given in S2 Fig, respectively. Blue dots represent S/P-ratios of the antibody-ELISA lower than 51 and stimulation-indices of the interferon-γ response lower than1.157, respectively.
doi:10.1371/journal.pone.0123980.g002
In Vivo VOC Signatures in MAP Infected Goats
PLOS ONE | DOI:10.1371/journal.pone.0123980 April 27, 2015 8 / 20
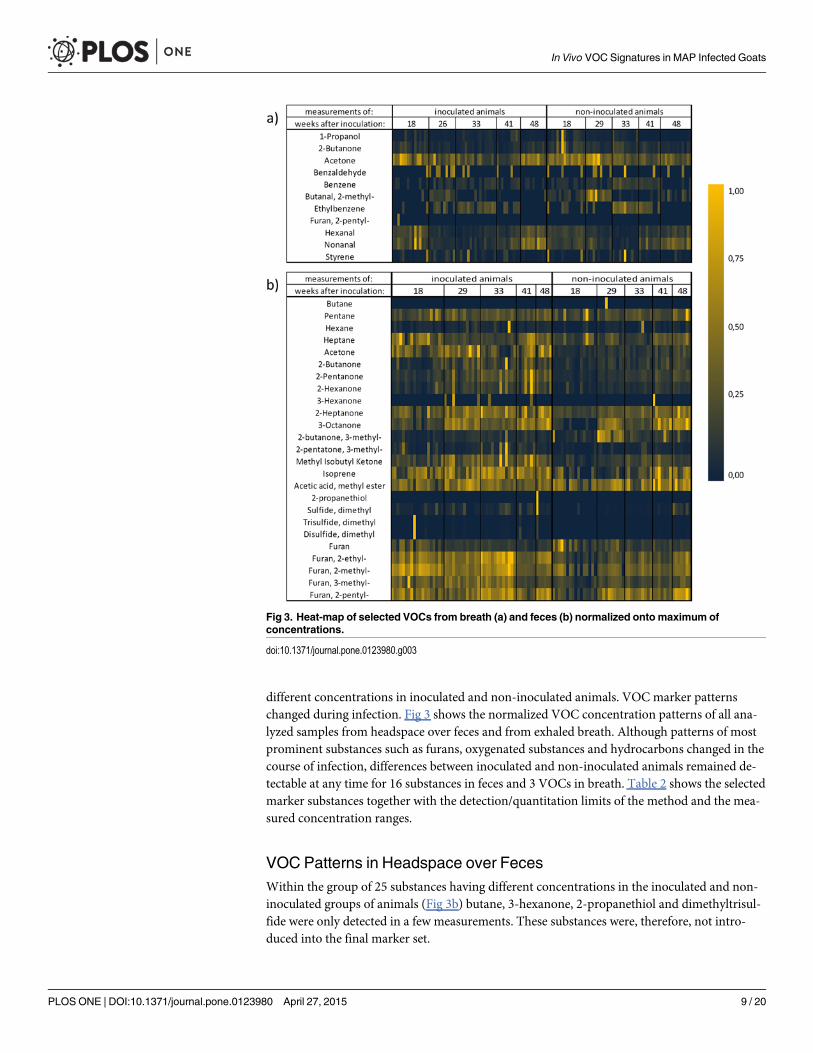
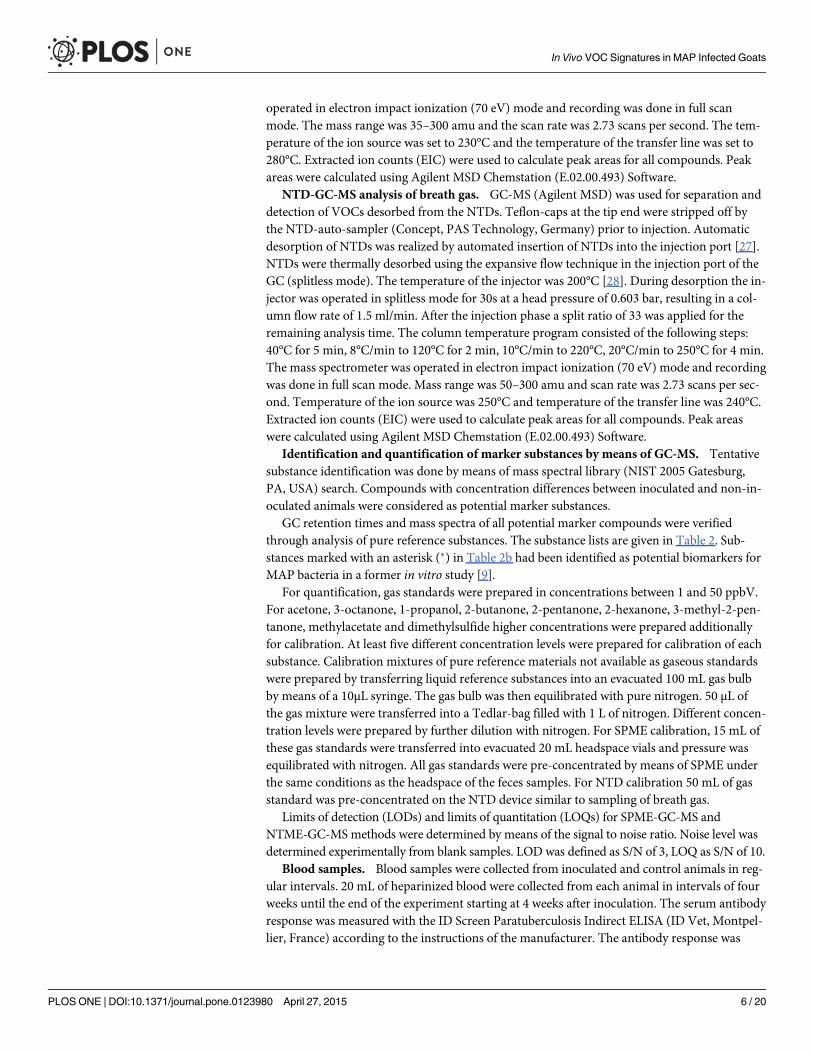
different concentrations in inoculated and non-inoculated animals. VOC marker patternschanged during infection. Fig 3 shows the normalized VOC concentration patterns of all ana-lyzed samples from headspace over feces and from exhaled breath. Although patterns of mostprominent substances such as furans, oxygenated substances and hydrocarbons changed in thecourse of infection, differences between inoculated and non-inoculated animals remained de-tectable at any time for 16 substances in feces and 3 VOCs in breath. Table 2 shows the selectedmarker substances together with the detection/quantitation limits of the method and the mea-sured concentration ranges.
VOC Patterns in Headspace over FecesWithin the group of 25 substances having different concentrations in the inoculated and non-inoculated groups of animals (Fig 3b) butane, 3-hexanone, 2-propanethiol and dimethyltrisul-fide were only detected in a few measurements. These substances were, therefore, not intro-duced into the final marker set.
Fig 3. Heat-map of selected VOCs from breath (a) and feces (b) normalized onto maximum ofconcentrations.
doi:10.1371/journal.pone.0123980.g003
In Vivo VOC Signatures in MAP Infected Goats
PLOS ONE | DOI:10.1371/journal.pone.0123980 April 27, 2015 9 / 20

Twenty one substances were identified as potential marker substances in headspace overfeces (see also Table 2b). Mann-Whitney-U-tests revealed significant differences in substanceconcentrations between the inoculated and non-inoculated groups of animals (Table 3).
Concentrations of hexane, heptane, acetone, 2-butanone, 2-pentanone, 2-hexanone, 2-hep-tanone, 3-methyl-2-pentanone, methyl isobutyl ketone, isoprene, dimethyl sulfide, dimethyldisulfide, 2-ethyl-furan, 2-methyl-furan and 3-methyl-furan were significantly higher in head-space over feces of the inoculated group. Significantly lower concentrations for 3-methyl-2butanone were found in headspace over feces of the inoculated group.
Fig 4 shows scatterplots of the first two principal components of a PCA analysis of themarker sets for inoculated and non-inoculated animals. As shown in Fig 4a discrimination be-tween inoculated and non-inoculated animals is mainly attributed to PC1. The time passedafter inoculation had an effect on VOC- patterns (Fig 4b) but did not interfere with the dis-crimination of inoculated and non-inoculated animals.
VOC Patterns in Breath GasWithin the group of eleven substances having different concentrations in the inoculated andnon-inoculated groups of animals (Fig 3a) benzaldehyde and 2-pentyl-furan were only de-tected in a few measurements. Those substances were, therefore, not introduced into the finalmarker set.
Nine substances were identified as potential marker substances through NTME-GC/MSanalysis of breath gas (see also Table 2a). Mann-Whitney-U-tests revealed significant concen-tration differences (p< 0.05) of three substances between the inoculated and non-inoculatedgroup of animals (Table 4). 2-butanone, benzene and 2-methyl-butanal were higher concen-trated in breath gas of the non-inoculated group than in exhaled breath of theinoculated group.
Fig 5 shows scatterplots of a PCA including all identified substances. No discrimination re-lated to PC 1 and PC 3 was found between inoculated and non-inoculated animals (Fig 5a). Asseen in Fig 5b the time after inoculation has more effect on PC1 and PC3 than the bacterial sta-tus of animals.
Additionally, room air of each stable was sampled for estimation of background contamina-tions. Fig 6 representatively shows concentrations of 1-propanol in the breath of animals andin the air of the corresponding stables.
Table 3. Mann-Whitney-U-tests for analyses from headspace over feces.
Substances: p-values Substances: p-values
Pentane 0.176 Methyl Isobutyl Ketone <0.001
Hexane 0.003 Isoprene <0.001*
Heptane 0.022 Acetic acid, methyl ester 0.898
Acetone <0.001 Sulfide, dimethyl <0.001
2-Butanone 0.016 Disulfide, dimethyl <0.001
2-pentanone <0.001 Furan 0.275
2-hexanone <0.001 Furan, 2-ethyl- <0.001
2-heptanone <0.001 Furan, 2-methyl- <0.001*
3-Octanone 0.161 Furan, 3-methyl- <0.001
2-Butanone, 3-methyl- <0.001 Furan, 2-pentyl- 0.057*
2-Pentatone, 3-methyl- <0.001
*—p-value from t-test
doi:10.1371/journal.pone.0123980.t003
In Vivo VOC Signatures in MAP Infected Goats
PLOS ONE | DOI:10.1371/journal.pone.0123980 April 27, 2015 10 / 20

Fig 4. PCA-scatterplots based on VOC-analysis of headspace over feces. PCA (a) was done forsubstances (Table 3) having significantly different (p < 0.05) concentrations in inoculated and non-inoculatedanimals. The 3D-scatterplot (b) is derived from the same PCA with respect to weeks after inoculation on thethird axis. The loading plot referring to this PCA analysis is given in S3 Fig. Blue dots represent the non-inoculated group. Red dots represent the inoculated group. PC-01 explains 31% and PC-02 explains 16%of variance.
doi:10.1371/journal.pone.0123980.g004
In Vivo VOC Signatures in MAP Infected Goats
PLOS ONE | DOI:10.1371/journal.pone.0123980 April 27, 2015 11 / 20

Correlation of VOC Patterns with Blood Based Immunological TestsFig 2a shows scatterplots of a PCA analysis of breath gas VOC profiles in relation to MAP-spe-cific antibodies and interferon-γ response. PC1 explained 31% and PC2 25% of the variancewithin the data set. According to the loading plot substances such as nonanal, 2-methyl-buta-nal, ethylbenzene and benzene had the highest impact on PC1. Styrene, benzaldehyde, 1-pro-panol and 2-butanone showed the highest loadings on PC2. S/P-ratios of antibody titer andstimulation index of interferon-γ response were positively correlated to PC 2. No correlationwas found to PC 1. Table 5 exhibits that concentrations of 2-butanone, acetone and benzenewere significantly higher in animals with lower antibody titers and interferon-γ response. Non-anal concentrations were also higher in animals with lower interferon-γ response.
PCA scatterplots in Fig 2b reflect the correlations of VOC profiles from feces and MAP-spe-cific antibodies and interferon-γ response. PC1 explained 25% and PC2 15% of the variancewithin the data set. Loadings of PCA showed that 2-pentanone, 2-hexanone, methyl-isobutyl-ke-tone, 2-heptanone, 2- butanone, 2-ethyl-furan, 3-methyl-furan had the highest impact on PC1.Dimethylsulfide, dimethyldisulfide, dimethyltrisulfide, 2-methyl-furan and 3-methyl-2-penta-none had the highest impact on PC2. S/P-ratios of antibody titer and stimulation index of inter-feron-γ response were positively correlated to PC 1. No correlation was found between theimmunological parameters and PC 2. As seen in Table 5 concentrations of acetone, 2-butanone,2-pentanone, 2-hexanone, 2-heptanone, 3-methyl-2-pentanone, methyl isobutyl ketone, iso-prene, dimethylsulfide, dimethyldisulfide, 2-ethylfuran, 2-methylfuran and 3-methylfuran werehigher in animals with higher antibody titer and stimulation index of interferon-γ response.
DiscussionVOCs from exhaled breath and headspace over feces were analyzed in an animal study in 42goats. Twenty six animals had been inoculated with MAP 3–4 months before the first measure-ment and 16 non-inoculated animals served as a control group.
Distinct VOC patterns in breath and feces of infected and healthy animals could be detectedby means of adapted microextraction pre-concentration techniques and GC-MS. Twenty eightVOCs were identified as potential volatile biomarkers for MAP infection in vivo. Differences ofVOC concentrations in the headspace over feces were pronounced and reflected presence ofMAP bacteria. Some of these indicative VOCs had also been found in the headspace over MAPcultures in a former in vitro study [9]. Differences in VOC profiles from breath were less pro-nounced as VOC profiles from feces and seemed to be linked to the host response in terms ofinterferon-γ concentrations. Although patterns of most prominent substances such as furans,oxygenated substances and hydrocarbons changed in the course of infection, differences
Table 4. Mann-Whitney-U-tests for breath gas-measurements.
Substances p-values
1-Propanol 0.458
2-Butanone 0.003
Acetone 0.064
Benzene 0.023
Butanal, 2-methyl- 0.002
Ethylbenzene 0.32
Hexanal 0.372
Nonanal 0.881
Styrene 0.649
doi:10.1371/journal.pone.0123980.t004
In Vivo VOC Signatures in MAP Infected Goats
PLOS ONE | DOI:10.1371/journal.pone.0123980 April 27, 2015 12 / 20

between inoculated and non-inoculated animals remained detectable for 16 substances in fecesbut only 3 VOCs in breath.
Unequivocal identification and reliable quantification is mandatory in order to decidewhich of these volatile emissions [11, 29] can reliably indicate bacterial presence or growth.Hence, in this study, substance identification was confirmed by analysis of pure reference sub-stances and did not solely rely on MS-database (e.g. NIST) search. Any quantification wasdone through calibration with reference materials.
Fig 5. PCA-scatterplots based on VOC-analysis of breath. PCA (a) was done for all substances (Table 2)having different concentrations in inoculated and non-inoculated animals. The 3D-scatterplot (b) is derivedfrom the same PCA with respect to weeks after inoculation on the third axes. The loading plot referring to thisPCA analysis is given in S4 Fig. Blue dots represent the non-inoculated group. Red dots represent theinoculated group. PC-01 explains 31% and PC-03 explains 15% of variance.
doi:10.1371/journal.pone.0123980.g005
In Vivo VOC Signatures in MAP Infected Goats
PLOS ONE | DOI:10.1371/journal.pone.0123980 April 27, 2015 13 / 20

A previous study based on differential ion-mobility spectrometry (DMS) [8] suggested dif-ferences between VOC ‘features’ in the breath and the headspace over feces from infected andnon-infected animals. Due to its principal mode of action DMS is not able to unequivocallyidentify any substances. As numerous contaminations in order of magnitudes higher concen-trations than actual marker substances such as 1-propanol may occur in the in vivo setting, re-sults from unspecific methods such as DMS may easily be biased.
In general, volatile metabolites having different concentrations in feces of inoculated andnot inoculated animals can be generated by bacteria or the host organism itself. Around 60% ofthe solid content of feces consists of bacteria [30]. Therefore, samples from feces reflect thecomposition and activity of the gut microbiota, which comprises the highest quantities of bac-teria in the whole body. Thus, analysis of headspace over feces has the potential to provide in-formation on characteristics of the gut microbiota. The presence and metabolism ofmycobacteria which do not belong to its physiological components are likely to alter the vola-tile signature. As a prerequisite for identifying changes in the VOC profile caused by the pres-ence of MAP bacteria, knowledge on commensal bacteria is necessary. In our study, we metthis point by measuring a control group of animals bred and living under identical conditionsas the inoculated group in a well-established animal model [7].
Concentrations of acetone, 2-butanone, 2-pentanone, 2-hexanone, 2-heptanone, 3-methyl-2-pentatone, methyl isobutyl ketone and isoprene in headspace over feces were constantlyhigher in the inoculated group. Potential sources of these compounds are MAP metabolismand/or host response to chronic inflammation. Aldehydes and ketones are known to be linkedto oxidative or inflammatory activity on the cellular level [6]. On the other hand, mycobacteriahave specific cell wall structures which account for many of the unique properties of this bacte-rial species. Clinically relevant characteristics include resistance to bactericidal effects or func-tions of the host immune system and low permeability to antibiotics. Mycolic acids representimportant components of the cell envelope of mycobacteria. Derivatives of mycolic acids occur
Fig 6. Concentration of 1-propanol in breath gas- and room air-samples.
doi:10.1371/journal.pone.0123980.g006
In Vivo VOC Signatures in MAP Infected Goats
PLOS ONE | DOI:10.1371/journal.pone.0123980 April 27, 2015 14 / 20

Table 5. VOC-concentration ranges and differences in relation to MAP-specific antibody levels and interferon-γ response after stimulation withJPPD.
a) breath antibody titer (S/P%) stimulation-index of theJPPD-specific interferon-γ-response
� 51.02 < 51.02 � 1.157 < 1.157
measurements 15 19 16 18
percentiles 25% median 75% 25% median 75% p 25% median 75% 25% median 75% p
1-Propanol 182.08 202.26 305.02 221.18 325.37 647.68 0.048 181.29 199.16 279.77 246.43 417.71 669.23 0.01
2-Butanone 0.34 0.40 0.53 0.61 0.75 1.08 <0.001 0.33 0.41 0.54 0.69 0.76 1.12 <0.001
Acetone 18.89 24.11 32.66 28.76 32.70 43.21 0.011 18.53 23.32 30.22 32.11 34.34 46.93 <0.001
Benzene † 0.55 0.61 0.59 0.70 0.82 0.012 † 0.55 0.64 0.59 0.71 0.93 0.009
Butanal. 2-methyl- † 0.32 0.45 † † 0.85 0.776 † 0.35 0.50 † † 0.68 0.83
Ethylbenzene † 0.12 0.15 † 0.14 0.19 0.211 † 0.11 0.15 † 0.16 0.20 0.084
Hexanal 0.35 0.41 0.51 0.43 0.50 0.74 0.055 0.36 0.45 0.51 0.37 0.50 0.77 0.128
Nonanal 1.32 1.46 1.71 1.26 2.05 2.50 0.053 1.30 1.45 1.82 1.29 2.07 2.59 0.047
Styrene 0.06 0.16 0.49 0.05 0.15 0.63 0.839 0.08 0.19 0.75 0.04 0.10 0.39 0.183
b) feces antibody titer (S/P%) stimulation-index of the JPPD-specificinterferon-γ-response
� 51.02 < 51.02 � 1.157 < 1.157
measurements 21 21 22 20
percentiles 25% median 75% 25% median 75% p 25% median 75% 25% median 75% p
Pentane* 11.45 15.11 20.27 11.43 15.79 20.70 0.839* 12.41 17.67 20.14 11.38 15.54 20.78 0.426*
Hexane* † 7.99 11.14 † † 9.25 0.221* † 8.12 11.10 † † 9.15 0.07
Heptane* 6.85 7.45 9.70 6.66 8.04 9.28 0.94 7.02 7.63 10.62 5.86 7.15 8.75 0.073*
Acetone* 799.26 1011.08 1305.37 291.71 383.92 501.73 <0.001 744.34 1007.45 1295.41 290.37 370.35 485.57 <0.001
2-Butanone 87.85 125.45 193.84 47.87 62.05 104.01 0.007 68.67 125.14 191.82 46.50 69.65 104.25 0.012
2-Pentanone 347.69 476.16 585.54 209.40 280.80 315.93 <0.001 331.36 479.08 573.15 200.64 281.89 315.15 <0.001
2-Hexanone 139.44 178.42 212.50 61.14 94.08 119.06 <0.001 141.33 178.82 221.09 65.81 91.67 116.33 <0.001
2-Heptanone* 33.08 38.79 45.64 22.55 26.04 34.42 0.005* 33.68 38.76 45.86 22.96 25.98 33.81 0.005*
3-Octanone* 47.89 56.37 85.87 36.40 56.19 82.12 0.718* 52.48 59.19 88.40 30.68 49.18 78.29 0.091*
2-Butanone, 3-methyl- 26.26 32.89 39.74 25.59 36.20 111.90 0.237 26.90 32.65 39.49 23.88 39.79 113.00 0.399
2-Pentatone, 3-methyl- 26.30 34.37 53.09 16.07 19.41 28.06 <0.001 28.42 35.71 62.36 15.97 18.91 25.10 <0.001
Methyl Isobutyl Ketone* 11.57 13.51 18.23 6.35 9.00 11.36 <0.001* 12.49 14.64 19.64 6.24 8.76 10.41 <0.001
Isoprene* 19.87 29.60 37.19 8.92 16.18 22.30 0.009* 24.37 33.72 37.96 6.85 13.58 20.17 <0.001
Acetic acid, methyl ester* 46.57 55.47 68.61 49.83 56.22 67.18 0.898* 44.16 53.06 67.61 51.26 57.65 67.51 0.494*
Sulfide, dimethyl 409.76 815.52 1099.63 127.23 184.20 258.03 <0.001 377.90 836.66 1158.19 123.61 182.72 241.42 <0.001
Disulfide, dimethyl* 0.37 1.12 6.44 † 0.23 0.68 0.005 0.41 1.21 5.72 † 0.22 0.74 0.005
Furan* 1.46 1.70 1.79 1.52 1.84 3.22 0.208 1.47 1.72 1.99 1.53 1.82 2.94 0.332
Furan, 2-ethyl-* 7.43 9.96 11.89 5.26 6.63 7.75 <0.001* 7.80 9.97 12.30 5.23 6.40 7.50 <0.001
Furan, 2-methyl-* 14.72 19.98 23.68 12.41 15.23 17.90 0.046* 15.36 19.78 24.46 12.74 15.15 17.93 0.007*
Furan, 3-methyl-* 23.41 32.32 41.93 19.33 21.37 25.66 <0.001 27.69 33.00 43.16 18.63 19.96 24.03 <0.001
Furan, 2-pentyl-* 21.99 29.25 33.91 23.11 26.73 30.05 0.454* 24.74 29.45 34.33 20.85 24.64 28.64 0.099*
p-values from Mann-Whitney-U-tests† value lower than limit of detection
* p-values from t-tests
doi:10.1371/journal.pone.0123980.t005
In Vivo VOC Signatures in MAP Infected Goats
PLOS ONE | DOI:10.1371/journal.pone.0123980 April 27, 2015 15 / 20
in significant amounts. Among these compounds are long chain fatty acids, alcohols and ke-tones [31]. In addition, aldehydes may play a role as intermediates in the biosynthesis of myco-bacterial lipid metabolites [32].
Furan derivatives have already been described as metabolites from various microorganisms[29, 33–37]. Mycobacterial surface glycolipids contain D-galactofuran [38] and arabinofurano-syl residues [39]. From these pentose compounds, furfural and furans can be derived. Furanscan also be synthesized from acetyl-CoA building blocks [29] or along oxidative degradation offatty acids. I.e. furans are likely to indicate (myco-)bacterial growth as they mirror cell wall turn-over. Since substituted furans can be derived from D-galactofuran or arabinofuranosyl residues,which represent mycobacterial surface structures, these compounds may even be assigned to thegrowth of distinct mycobacteria. In a recent in vitro study we detected concentrations as highas ppmV of 2-methylfuran, 2-ethylfuran and 2-pentylfuran in MAP cultures [9]. Elevated con-centrations of 2-ethylfuran, 2-methylfuran and 3-methylfuran in feces of the inoculated animalsmay thus be attributed to presence and growth of MAP in the gut of these animals.
3-methyl-2-butanone was the only substance having lower concentrations in the inoculatedgroup. This substance is generated during the biosynthesis of fatty acids [29] and, therefore,represents a general marker of (bacterial) growth rather than a bacteria specific substance.Lower quantities of this marker may indicate reduced replication or decreased amounts ofoverall bacteria (other than MAP) in the inoculated group.
The appearance of higher dimethylsulfide concentrations in MAP-infected animals couldbe the result of a reduced immune defense which may have affected the composition of the gutmicrobiota. Ubiquitously distributed Dinoflagellates are microorganisms often associated tohuman illnesses [40]. Their co-existence with bacteria enables the aerobic degradation of3-dimethylsulfoniopropionate (3DMSP) to dimethylsulfide [41–43]. 3DMSP is known to begenerated from L-methionine from higher plants which, being components of hay, belong tothe goat´s diet [44]. Direct catabolic degradation of L-methionine to dimethylsulfide by lacticacid bacteria is also probable [45–48].
When animals were grouped according to the immunological host response distinction be-tween groups became more pronounced. Distinction mainly relied on the same substanceswhich had been identified to differentiate between inoculated and non-inoculated animals.This could be due to a higher amount of MAP bacteria in those animals with higher inflamma-tory immune response. On the other hand, inflammatory response with generation of volatilealdehydes and ketones in the gut might as well have contributed to this effect.
In contrast to VOC patterns from feces, exhaled VOC patterns did not show pronounceddifferences between healthy and inoculated animals.
From the PCAs it is obvious that the actual immunological response and the age of the ani-mals had a more pronounced effect on exhaled VOC profiles than the inoculation with MAPbacteria. Surprisingly, concentrations of differentiating VOCs were consistently higher in thegroup of animals with lower antibody ratios and lower interferon-γ responses. This was truefor oxygenated substances related to lipid peroxidation or metabolic stress, such as aldehydesor ketones, as well as for substances typically related to environmental effects, such as benzene.
When compared to our recent in vitro results, 15 substances from the bacterial in vitro pat-tern could be found in the headspace of feces, but only 5 substances were detectable in thebreath of the animals [9]. VOCs produced by MAP in the gut are likely to be metabolized inthe liver when they enter systemic circulation via the portal vein. I.e. concentrations of reactivesubstances such as unsaturated hydrocarbons, aldehydes, ketones or furans potentially synthe-sized by MAP in the gut will be vanishingly low in breath. These results demonstrate that a di-rect transfer from in vitro biomarker to in vivo conditions [24, 25] is not possible and thatphysiology and metabolism must be taken into account.
In Vivo VOC Signatures in MAP Infected Goats
PLOS ONE | DOI:10.1371/journal.pone.0123980 April 27, 2015 16 / 20
Apart from bacterial presence and immunological response other factors including physiol-ogy, age and nutrition may influence VOC-patterns. The influence of nutrition was minimized,as the study started only after the transition from milk to plant feeding was completed and allanimals received identical diet. Nevertheless the age of the animals between 21 and 55 weeks oflife had a distinct effect on VOC-patterns. Although VOC profiles from feces changed marked-ly over time, distinction between inoculated and non-inoculated animals was still possible atevery time point.
ConclusionVOC concentrations in the headspace over feces showed differences between infected andhealthy animals. Discriminating VOCs could be linked to MAP membrane structures and me-tabolism. Differences in VOC profiles from breath were less pronounced and seemed to belinked to the host response. Transfer of results from in vitro VOC studies to in vivo conditionsneed careful consideration of related biochemistry, physiology and potential confounding pa-rameters. Concentrations patterns of volatile marker substances determined from feces andbreath changed in the course of infection. Nevertheless, differences between inoculated andnon-inoculated animals remained detectable at any time. In a perspective, VOC profiles fromfeces may be used to recognize mycobacterial presence in the gut of ruminants.
Supporting InformationS1 Fig. Loading-plot referring to PCA-analysis of breath gas samples in relation to bloodtests (Fig 2a).(TIF)
S2 Fig. Loading-plot referring to PCA-analysis of feces samples in relation to blood tests(Fig 2b).(TIF)
S3 Fig. Loading-plot referring to PCA-analysis of feces samples (Fig 4).(TIF)
S4 Fig. Loading-plot referring to PCA-analysis of breath gas samples (Fig 5).(TIF)
AcknowledgmentsCredit is due to assistances of laboratory and animals attendants from FLI Jena for continuoussupport and warm help. The authors are thankful to Mr. Dietmar Hein from PAS-technologiesfor continuous support, useful inventions and help in handling technological problems. Alsogreat thanks to all involved members from ROMBAT breath research team in Rostock.
Author ContributionsConceived and designed the experiments: PRWMHK JS. Performed the experiments: KK PTGWWMHK AB. Analyzed the data: PT AB GW SF HKWM PR KKMSMZ. Contributed re-agents/materials/analysis tools: PR JS HKWM. Wrote the paper: AB PT JS SF MS MZ HKWM PR.
References1. Ott SL, Wells SJ, Wagner BA. Herd-level economic losses associated with Johne's disease on US
dairy operations. Prev Vet Med. 1999; 40(3–4):179–92. PMID: 10423771
In Vivo VOC Signatures in MAP Infected Goats
PLOS ONE | DOI:10.1371/journal.pone.0123980 April 27, 2015 17 / 20

2. Grant IR. Zoonotic potential of Mycobacterium avium ssp. paratuberculosis: the current position. Jour-nal of applied microbiology. 2005; 98(6):1282–93. Epub 2005/05/27. PMID: 15916642
3. Mendoza JL, Lana R, Diaz-Rubio M. Mycobacterium avium subspecies paratuberculosis and its rela-tionship with Crohn's disease. World journal of gastroenterology: WJG. 2009; 15(4):417–22. Epub2009/01/20. PMID: 19152445
4. Scanu AM, Bull TJ, Cannas S, Sanderson JD, Sechi LA, Dettori G, et al. Mycobacterium avium subspe-cies paratuberculosis infection in cases of irritable bowel syndrome and comparison with Crohn's dis-ease and Johne's disease: common neural and immune pathogenicities. Journal of clinicalmicrobiology. 2007; 45(12):3883–90. Epub 2007/10/05. PMID: 17913930
5. Chiodini RJ, Chamberlin WM, Sarosiek J, McCallum RW. Crohn's disease and the mycobacterioses: aquarter century later. Causation or simple association? Critical reviews in microbiology. 2012; 38(1):52–93. Epub 2012/01/17. doi: 10.3109/1040841X.2011.638273 PMID: 22242906
6. MiekischW, Trefz P, Bergmann A, Schubert JK. Microextraction techniques in breath biomarker analy-sis. Bioanalysis. 2014; 6(9):1275–91. PMID: 25077354
7. Kruger C, Kohler H, Liebler-Tenorio EM. Sequential Development of Lesions 3, 6, 9, and 12 MonthsAfter Experimental Infection of Goat Kids With Mycobacterium avium subsp paratuberculosis. Veteri-nary Pathology Online. 2014:1–15.
8. Purkhart R, Kohler H, Liebler-Tenorio E, Meyer M, Becher G, Kikowatz A, et al. Chronic intestinal Myco-bacteria infection: discrimination via VOC analysis in exhaled breath and headspace of feces using dif-ferential ion mobility spectrometry. Journal of breath research. 2011; 5(2):027103. Epub 2011/04/23.doi: 10.1088/1752-7155/5/2/027103 PMID: 21512209
9. Trefz P, Koehler H, Klepik K, Moebius P, Reinhold P, Schubert JK, et al. Volatile emissions fromMyco-bacterium avium subsp. paratuberculosis mirror bacterial growth and enable distinction of differentstrains. PloS one. 2013; 8(10):e76868. doi: 10.1371/journal.pone.0076868 PMID: 24116177
10. Sevilla IA, Garrido JM, Molina E, Geijo MV, Elguezabal N, Vazquez P, et al. Development and Evalua-tion of a Novel Multicopy-Element-Targeting Triplex PCR for Detection of Mycobacterium avium subsp.paratuberculosis in Feces. Appl Environ Microbiol. 2014; 80(12):3757–68. doi: 10.1128/AEM.01026-14PMID: 24727272
11. Bos LD, Sterk PJ, Schultz MJ. Volatile metabolites of pathogens: a systematic review. PLoS patho-gens. 2013; 9(5):e1003311. Epub 2013/05/16. doi: 10.1371/journal.ppat.1003311 PMID: 23675295
12. Garner CE, Smith S, de Lacy Costello B, White P, Spencer R, Probert CS, et al. Volatile organic com-pounds from feces and their potential for diagnosis of gastrointestinal disease. FASEB journal: officialpublication of the Federation of American Societies for Experimental Biology. 2007; 21(8):1675–88.Epub 2007/02/23. PMID: 17314143
13. Garner CE, Smith S, Bardhan PK, Ratcliffe NM, Probert CS. A pilot study of faecal volatile organic com-pounds in faeces from cholera patients in Bangladesh to determine their utility in disease diagnosis.Transactions of the Royal Society of Tropical Medicine and Hygiene. 2009; 103(11):1171–3. Epub2009/03/10. doi: 10.1016/j.trstmh.2009.02.004 PMID: 19268999
14. Ahmed I, Greenwood R, Costello Bde L, Ratcliffe NM, Probert CS. An investigation of fecal volatile or-ganic metabolites in irritable bowel syndrome. PloS one. 2013; 8(3):e58204. Epub 2013/03/22. doi: 10.1371/journal.pone.0058204 PMID: 23516449
15. De Preter V, Van Staeyen G, Esser D, Rutgeerts P, Verbeke K. Development of a screening method todetermine the pattern of fermentation metabolites in faecal samples using on-line purge-and-trap gaschromatographic-mass spectrometric analysis. Journal of chromatography A. 2009; 1216(9):1476–83.Epub 2009/01/27. doi: 10.1016/j.chroma.2008.12.095 PMID: 19167006
16. Tait E, Hill KA, Perry JD, Stanforth SP, Dean JR. Development of a novel method for detection of Clos-tridium difficile using HS-SPME-GC-MS. Journal of applied microbiology. 2014; 116(4):1010–9. Epub2013/12/11. doi: 10.1111/jam.12418 PMID: 24320174
17. Probert CS, Jones PR, Ratcliffe NM. A novel method for rapidly diagnosing the causes of diarrhoea.Gut. 2004; 53(1):58–61. Epub 2003/12/20. PMID: 14684577
18. Walton C, Fowler DP, Turner C, Jia W,Whitehead RN, Griffiths L, et al. Analysis of volatile organic com-pounds of bacterial origin in chronic gastrointestinal diseases. Inflammatory bowel diseases. 2013; 19(10):2069–78. Epub 2013/07/23. doi: 10.1097/MIB.0b013e31829a91f6 PMID: 23867873
19. Syhre M, Manning L, Phuanukoonnon S, Harino P, Chambers ST. The scent of Mycobacterium tuber-culosis—Part II breath. Tuberculosis. 2009; 89(4):263–6. doi: 10.1016/j.tube.2009.04.003 PMID:19481976
20. Phillips M, Cataneo RN, Condos R, Ring Erickson GA, Greenberg J, La Bombardi V, et al. Volatile bio-markers of pulmonary tuberculosis in the breath. Tuberculosis (Edinb). 2007; 87(1):44–52. Epub 2006/04/26. PMID: 16635588
In Vivo VOC Signatures in MAP Infected Goats
PLOS ONE | DOI:10.1371/journal.pone.0123980 April 27, 2015 18 / 20

21. Knobloch HK, Commander N, Reinhold P, Turner C., Chambers M. Volatile Organic Compound (VOC)Analysis For Disease Detection: Proof Of Principle For Field Studies Detecting Paratuberculosis AndBrucellosis. Olfaction and Electronic Nose: Proceedings of the 13th International Symposium, editedby Pardo M and Sberveglieri G, American Institutes of Physics. 2009; CP1137:195–7.
22. Proudman CJ, Hunter JO, Darby AC, Escalona EE, Batty C, Turner C. Characterisation of the faecalmetabolome and microbiome of Thoroughbred racehorses. Equine veterinary journal. 2014.
23. Saito Y, Ueta I, Kotera K, Ogawa M, Wada H, Jinno K. In-needle extraction device designed for gaschromatographic analysis of volatile organic compounds. Journal of chromatography A. 2006; 1106(1–2):190–5. Epub 2006/01/31. PMID: 16443461
24. Pereira SP, Khin Maung U, Duncombe VM, Bolin TD, Linklater JM. Comparison of an in vitro faecal hy-drogen test with the lactulose breath test: assessment of in vivo hydrogen-producing capability in Bur-mese village children. Annals of tropical paediatrics. 1992; 12(2):177–83. PMID: 1381894
25. Zhu J, Bean HD, Wargo MJ, Leclair LW, Hill JE. Detecting bacterial lung infections: in vivo evaluation ofin vitro volatile fingerprints. Journal of breath research. 2013; 7(1):016003. doi: 10.1088/1752-7155/7/1/016003 PMID: 23307645
26. Trefz P, Rosner L, Hein D, Schubert JK, MiekischW. Evaluation of needle trap micro-extraction and au-tomatic alveolar sampling for point-of-care breath analysis. Anal Bioanal Chem. 2013; 405:3105–15.Epub 2013/02/08. doi: 10.1007/s00216-013-6781-9 PMID: 23388692
27. Mieth M, Schubert JK, Groger T, Sabel B, Kischkel S, Fuchs P, et al. Automated needle trap heart-cutGC/MS and needle trap comprehensive two-dimensional GC/TOF-MS for breath gas analysis in theclinical environment. Analytical chemistry. 2010; 82(6):2541–51. Epub 2010/02/23. doi: 10.1021/ac100061k PMID: 20170082
28. Mieth M, Kischkel S, Schubert JK, Hein D, MiekischW. Multibed needle trap devices for on site sam-pling and preconcentration of volatile breath biomarkers. Analytical chemistry. 2009; 81(14):5851–7.Epub 2009/06/25. doi: 10.1021/ac9009269 PMID: 19548667
29. Schulz S, Dickschat JS. Bacterial volatiles: the smell of small organisms. Nat Prod Rep. 2007; 24(4):814–42. PMID: 17653361
30. Guarner F, Malagelada JR. Gut flora in health and disease. Lancet. 2003; 361(9356):512–9. PMID:12583961
31. Rafidinarivo E, Laneelle MA, Montrozier H, Valero-Guillen P, Astola J, Luquin M, et al. Trafficking path-ways of mycolic acids: structures, origin, mechanism of formation, and storage form of mycobactericacids. J Lipid Res. 2009; 50(3):477–90. doi: 10.1194/jlr.M800384-JLR200 PMID: 18772482
32. Chhabra A, Haque AS, Pal RK, Goyal A, Rai R, Joshi S, et al. Nonprocessive [2+2]e(-) off-loading re-ductase domains frommycobacterial nonribosomal peptide synthetases. P Natl Acad Sci USA. 2012;109(15):5681–6. doi: 10.1073/pnas.1118680109 PMID: 22451903
33. Borjesson T, Stollman U, Schnurer J. Volatile metabolites produced by six fungal species comparedwith other indicators of fungal growth on cereal grains. Appl Environ Microbiol. 1992; 58(8):2599–605.Epub 1992/08/01. PMID: 1514807
34. Dickschat JS, Wenzel SC, Bode HB, Muller R, Schulz S. Biosynthesis of volatiles by the myxobacter-iumMyxococcus xanthus. Chembiochem. 2004; 5(6):778–87. Epub 2004/06/03. PMID: 15174160
35. Pollak FC, Berger RG. Geosmin and Related Volatiles in Bioreactor-Cultured Streptomyces citreusCBS 109.60. Appl Environ Microbiol. 1996; 62(4):1295–9. Epub 1996/04/01. PMID: 16535293
36. Scholler CE, Gurtler H, Pedersen R, Molin S, Wilkins K. Volatile metabolites from actinomycetes. JAgric Food Chem. 2002; 50(9):2615–21. Epub 2002/04/18. PMID: 11958631
37. Schulz S, Fuhlendorff J, Reichenbach H. Identification and synthesis of volatiles released by the myxo-bacterium Chondromyces crocatus. Tetrahedron. 2004; 60(17):3863–72.
38. Dhiman RK, Dinadayala P, Ryan GJ, Lenaerts AJ, Schenkel AR, Crick DC. Lipoarabinomannan locali-zation and abundance during growth of Mycobacterium smegmatis. Journal of bacteriology. 2011; 193(20):5802–9. Epub 2011/08/16. doi: 10.1128/JB.05299-11 PMID: 21840972
39. Appelmelk BJ, den Dunnen J, Driessen NN, Ummels R, Pak M, Nigou J, et al. The mannose cap of my-cobacterial lipoarabinomannan does not dominate the Mycobacterium-host interaction. Cellular micro-biology. 2008; 10(4):930–44. Epub 2007/12/12. PMID: 18070119
40. Miller TR, Belas R. Pfiesteria piscicida, P. shumwayae, and other Pfiesteria-like dinoflagellates. Re-search in microbiology. 2003; 154(2):85–90. PMID: 12648722
41. Kiene RP. Dimethyl sulfide production from dimethylsulfoniopropionate in coastal seawater samplesand bacterial cultures. Appl Environ Microbiol. 1990; 56(11):3292–7. PMID: 16348336
42. Kiene RP, Malloy KD, Taylor BF. Sulfur-containing amino acids as precursors of thiols in anoxic coastalsediments. Appl Environ Microbiol. 1990; 56(1):156–61. PMID: 16348088
In Vivo VOC Signatures in MAP Infected Goats
PLOS ONE | DOI:10.1371/journal.pone.0123980 April 27, 2015 19 / 20

43. Taylor BF, Gilchrist DC. New routes for aerobic biodegradation of dimethylsulfoniopropionate. Appl En-viron Microbiol. 1991; 57(12):3581–4. PMID: 16348607
44. Otte ML, Wilson G, Morris JT, Moran BM. Dimethylsulphoniopropionate (DMSP) and related com-pounds in higher plants. Journal of experimental botany. 2004; 55(404):1919–25. PMID: 15181109
45. Bonnarme P, Psoni L, Spinnler HE. Diversity of L-methionine catabolism pathways in cheese-ripeningbacteria. Appl Environ Microbiol. 2000; 66(12):5514–7. PMID: 11097940
46. Dias B, Weimer B. Purification and characterization of L-methionine gamma-lyase from brevibacteriumlinens BL2. Appl Environ Microbiol. 1998; 64(9):3327–31. PMID: 9726878
47. Dias B, Weimer B. Conversion of methionine to thiols by lactococci, lactobacilli, and brevibacteria. ApplEnviron Microbiol. 1998; 64(9):3320–6. PMID: 9726877
48. Hanniffy SB, Pelaez C, Martinez-Bartolome MA, Requena T, Martinez-Cuesta MC. Key enzymes in-volved in methionine catabolism by cheese lactic acid bacteria. International journal of food microbiolo-gy. 2009; 135(3):223–30. doi: 10.1016/j.ijfoodmicro.2009.08.009 PMID: 19733414
In Vivo VOC Signatures in MAP Infected Goats
PLOS ONE | DOI:10.1371/journal.pone.0123980 April 27, 2015 20 / 20
Related Documents