In their Eyes: An Average Child’s View of their World April 2, 2008 University of Delaware Center for Drug and Alcohol Studies Based on the 2007 Delaware School Surveys And the 2007 Delaware Youth Risk Behavior Survey © University of Delaware, 2008

In their Eyes: An Average Child’s View of their World April 2, 2008 University of Delaware Center for Drug and Alcohol Studies Based on the 2007 Delaware.
Dec 15, 2015
Welcome message from author
This document is posted to help you gain knowledge. Please leave a comment to let me know what you think about it! Share it to your friends and learn new things together.
Transcript
In their Eyes: An Average Child’s View of
their World
April 2, 2008University of Delaware Center for Drug and Alcohol Studies
Based on the 2007 Delaware School SurveysAnd the 2007 Delaware Youth Risk Behavior Survey
© University of Delaware, 2008
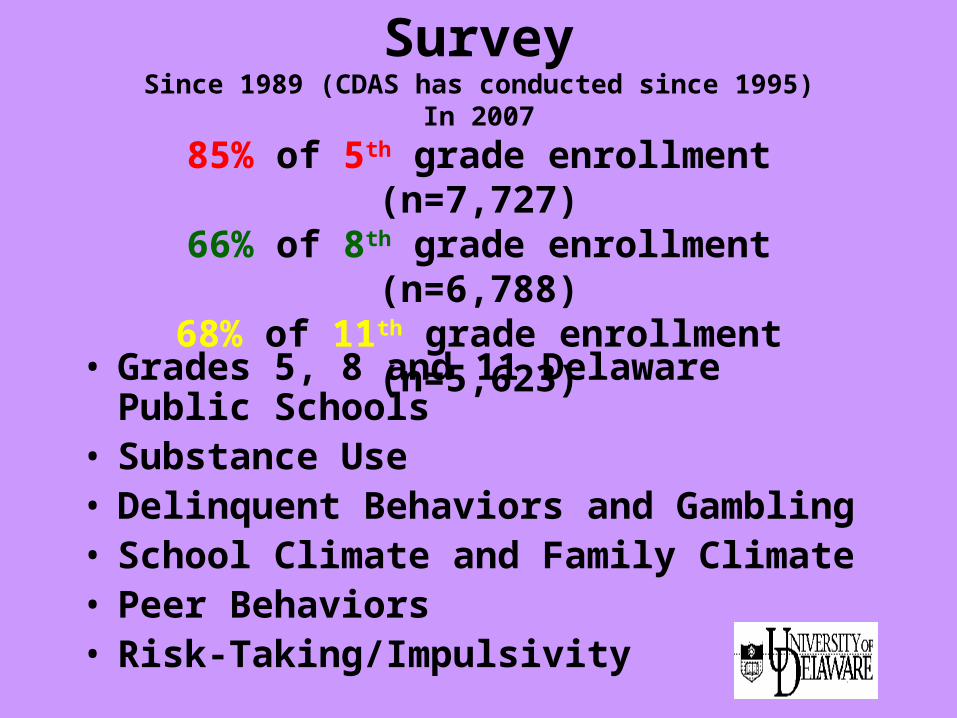
The Delaware School SurveySince 1989 (CDAS has conducted since 1995)
In 2007
85% of 5th grade enrollment (n=7,727)66% of 8th grade enrollment (n=6,788)
68% of 11th grade enrollment (n=5,623)
• Grades 5, 8 and 11 Delaware Public Schools
• Substance Use• Delinquent Behaviors and Gambling• School Climate and Family Climate• Peer Behaviors• Risk-Taking/Impulsivity

The Delaware High School Youth Risk Behavior Survey
Since 1993 (CDAS has conducted since 1999)In 2007:
2,655 Delaware Public High School Students (82% response rate)
• Grades 9-12
• Substance Use
• Personal Safety
• Depressive/Suicidal Behaviors
• Nutrition
• Exercise
• Sexual Behaviors

Let’s take a look at an average Delaware child . . .
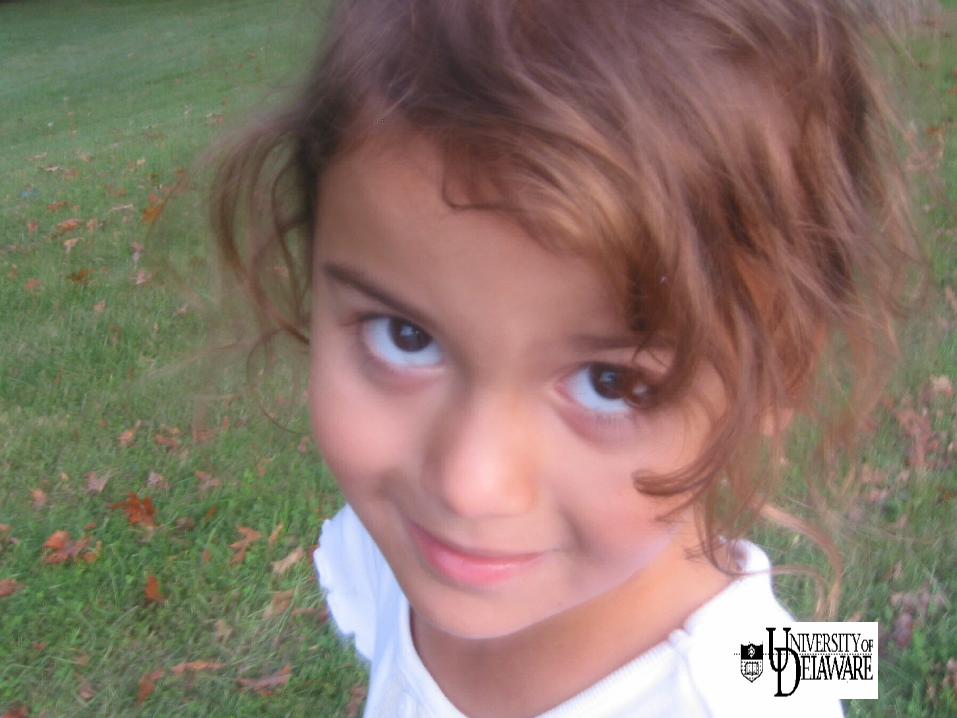

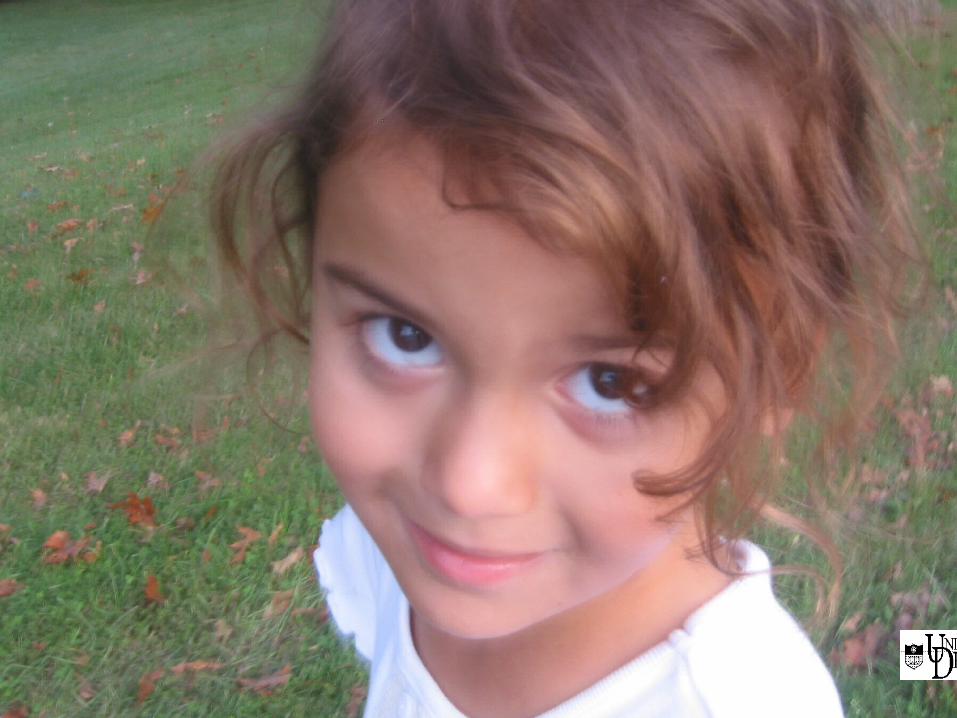
This is Sophia.
Sophia just started Kindergarten. She lives in our
most densely populated county, one of over 5,000 Delaware
girls her age, one of over 10,000 children her age.
Sophia, like half of all children born in Delaware, received
WIC. Her mom, a single parent, works and takes classes at Del
Tech so she can eventually better support her two girls.
Sophia has had health insurance through Medicaid and the Delaware Healthy Children Program, and attends day care
with Purchase of Care payments. The State of
Delaware has a BIG investment in her.
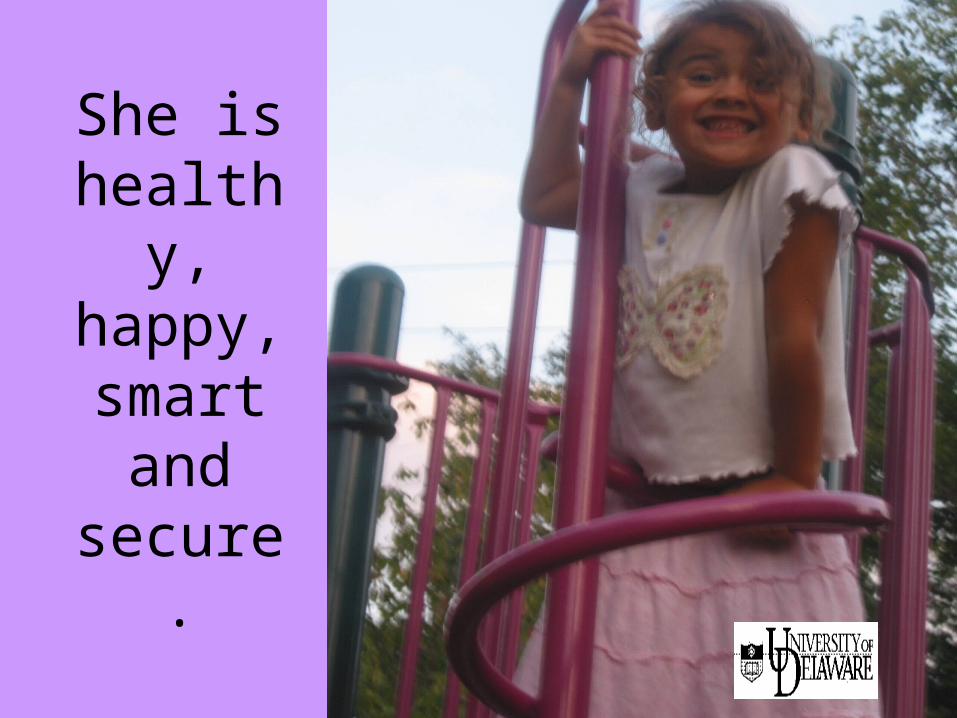
She is healthy, happy, smart and
secure.
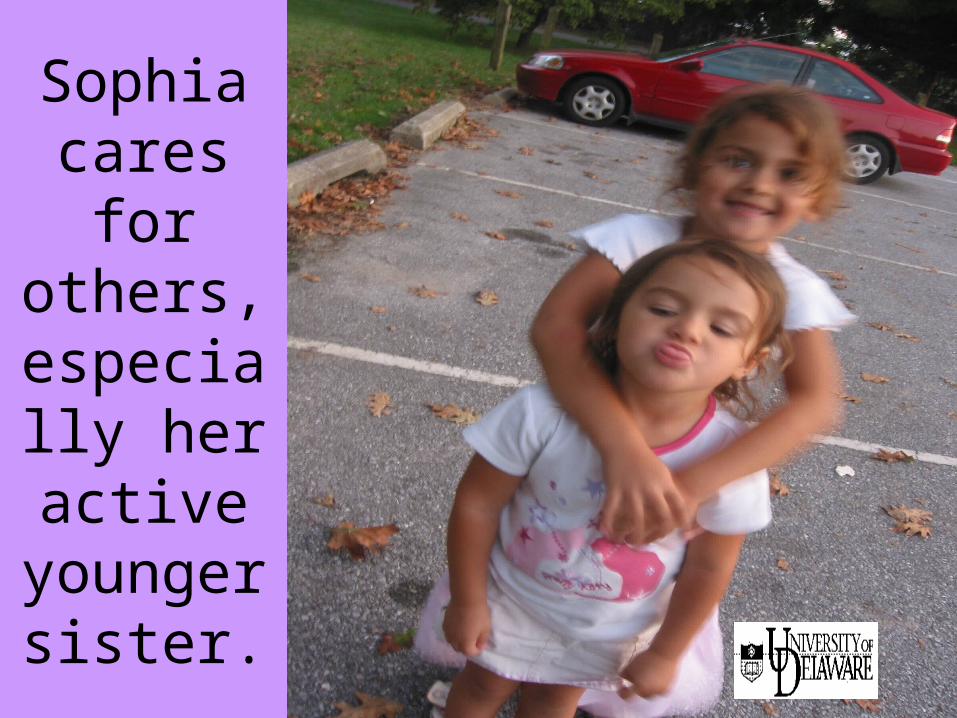
Sophia cares for others,
especially her active younger sister.

She is involved in the community,
and has dreams for the future.

Someday, Sophia will be part of an average classroom of 25 students.
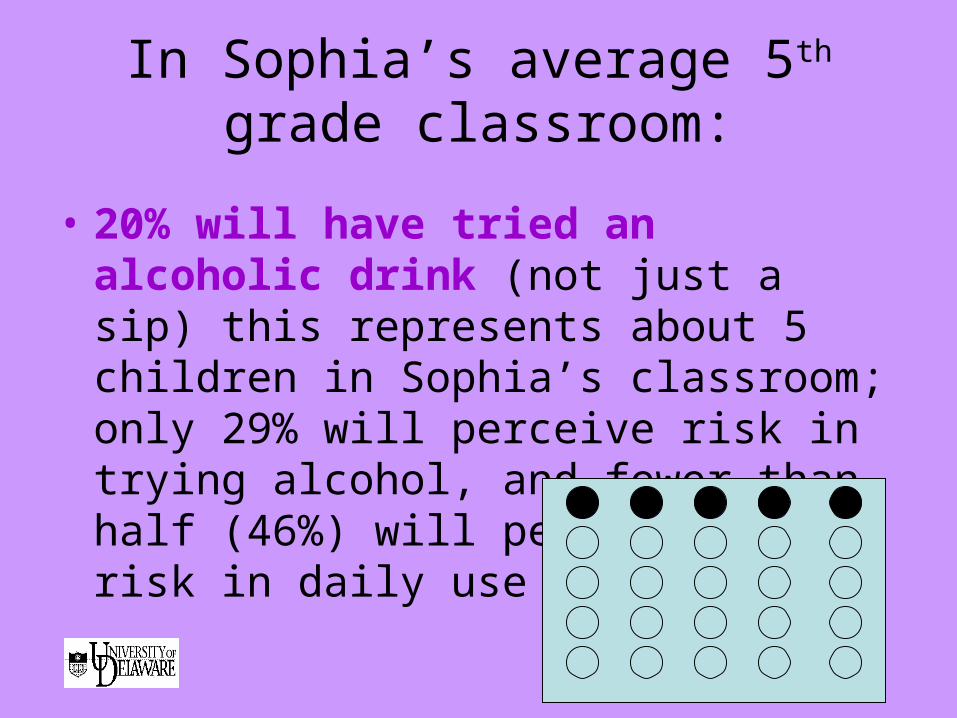
In Sophia’s average 5th grade classroom:
• 20% will have tried an alcoholic drink (not just a sip) this represents about 5 children in Sophia’s classroom; only 29% will perceive risk in trying alcohol, and fewer than half (46%) will perceive great risk in daily use

7% will have tried cigarettes (more than a few puffs); this represents at least 2 students in Sophia’s average 5th grade classroom of 25 students; 63% will perceive
great risk from smoking a pack or more per day.
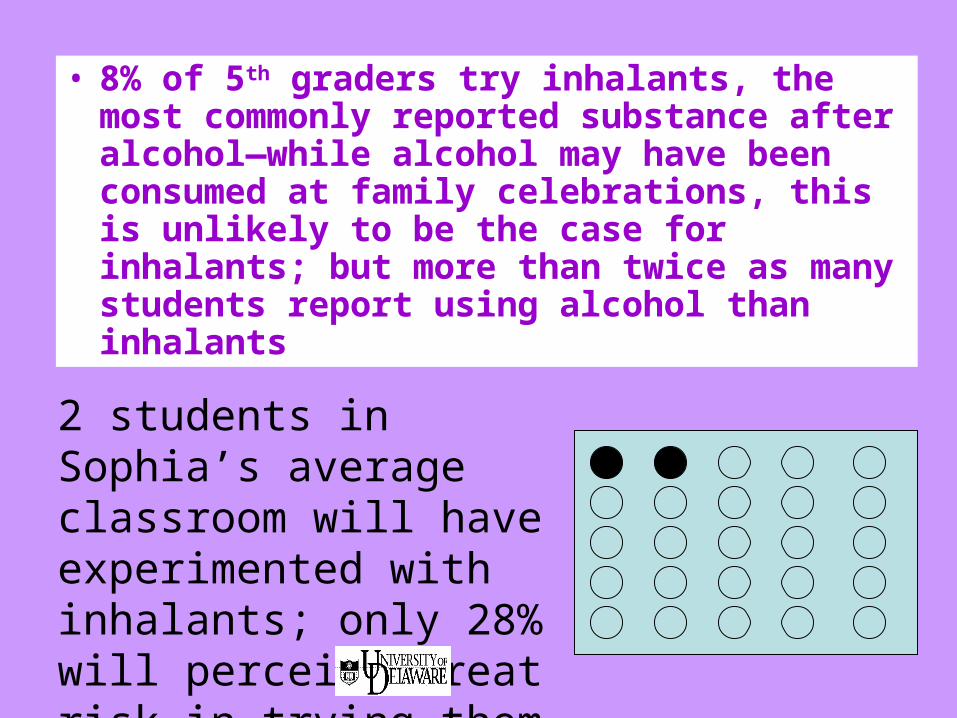
• 8% of 5th graders try inhalants, the most commonly reported substance after alcohol—while alcohol may have been consumed at family celebrations, this is unlikely to be the case for inhalants; but more than twice as many students report using alcohol than inhalants
2 students in Sophia’s average classroom will have experimented with inhalants; only 28% will perceive great risk in trying them
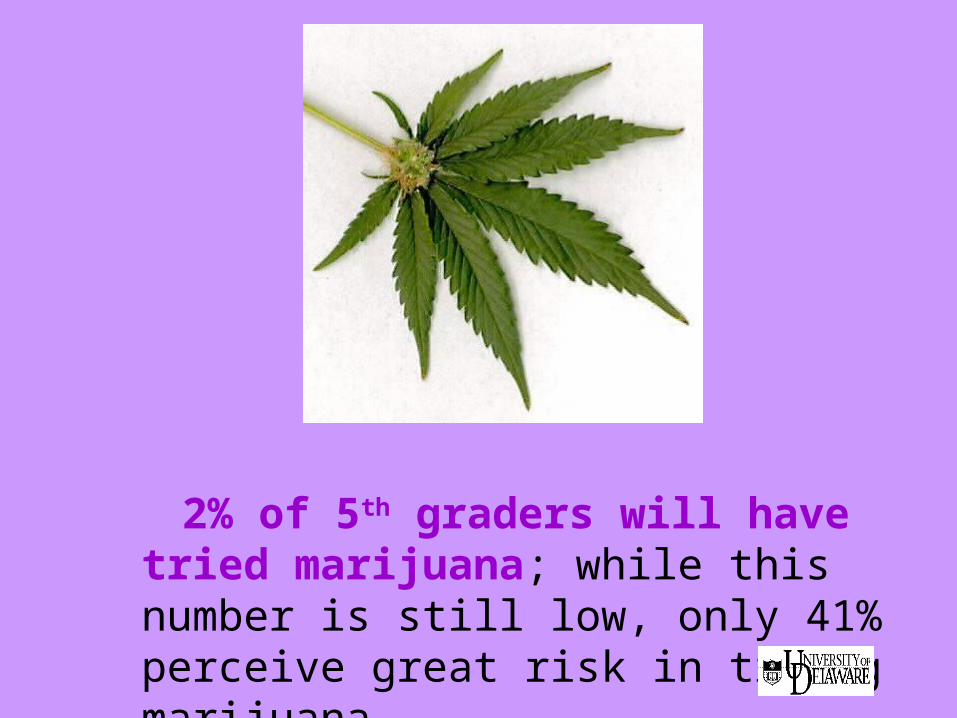
2% of 5th graders will have tried marijuana; while this number is still low, only 41% perceive great risk in trying marijuana
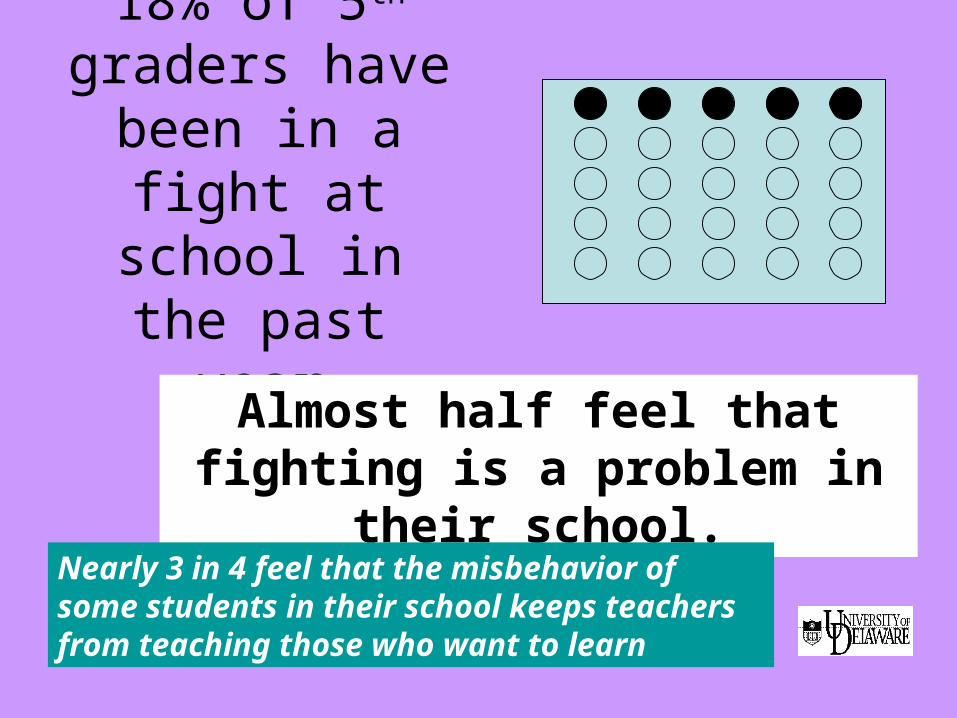
18% of 5th graders have
been in a fight at school in the
past year
Almost half feel that fighting is a problem in their school.
Nearly 3 in 4 feel that the misbehavior of some students in their school keeps teachers from teaching those who want to learn

55% of Sophia’s 5th grade classmates have bet money on lottery tickets, team sports, card games, Bingo, games of skill, or video games in the past year. Those are good odds.

By the time Sophia is in 8th grade:
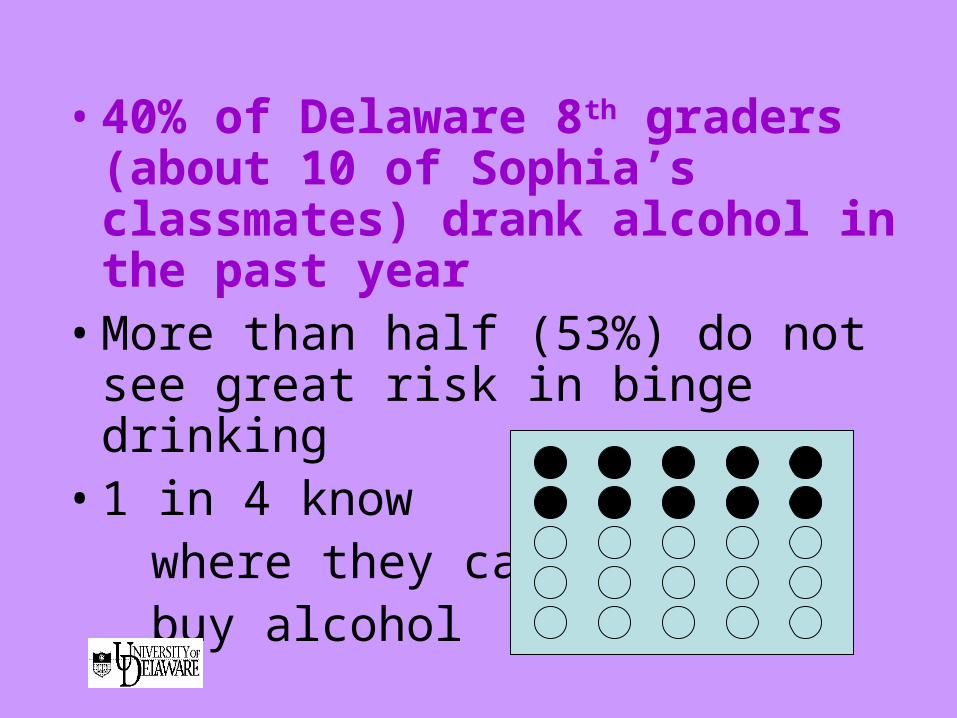
• 40% of Delaware 8th graders (about 10 of Sophia’s classmates) drank alcohol in the past year
• More than half (53%) do not see great risk in binge drinking
• 1 in 4 know where they can buy alcohol

Children who begin drinking before age 15
are four times more likely to develop alcohol dependence than those
who start drinking at age 21
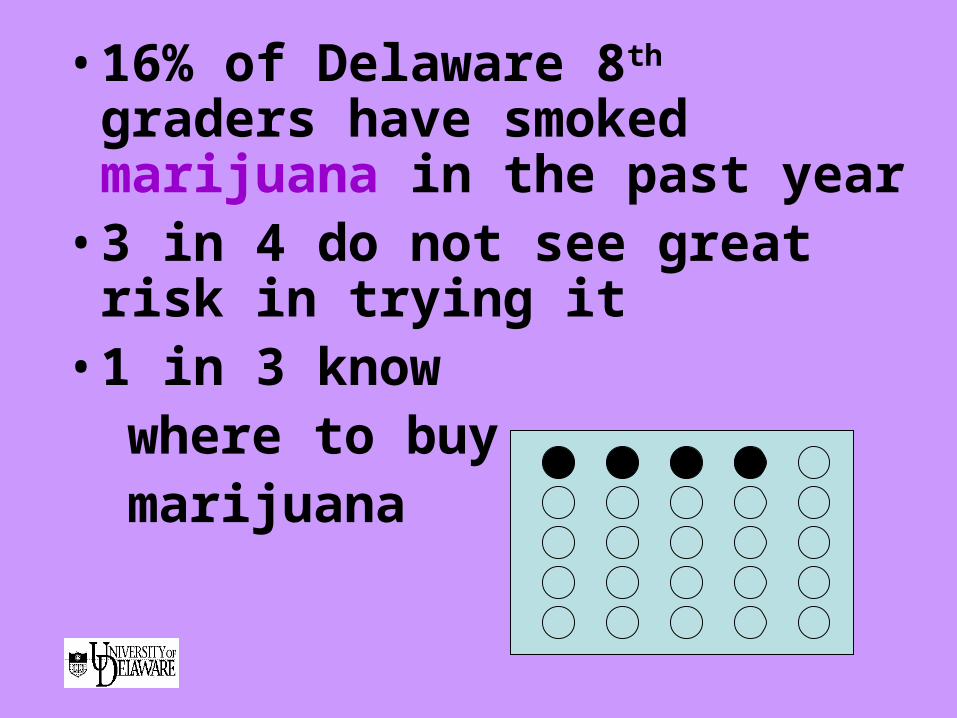
• 16% of Delaware 8th graders have smoked marijuana in the past year
• 3 in 4 do not see great risk in trying it
• 1 in 3 know where to buy marijuana
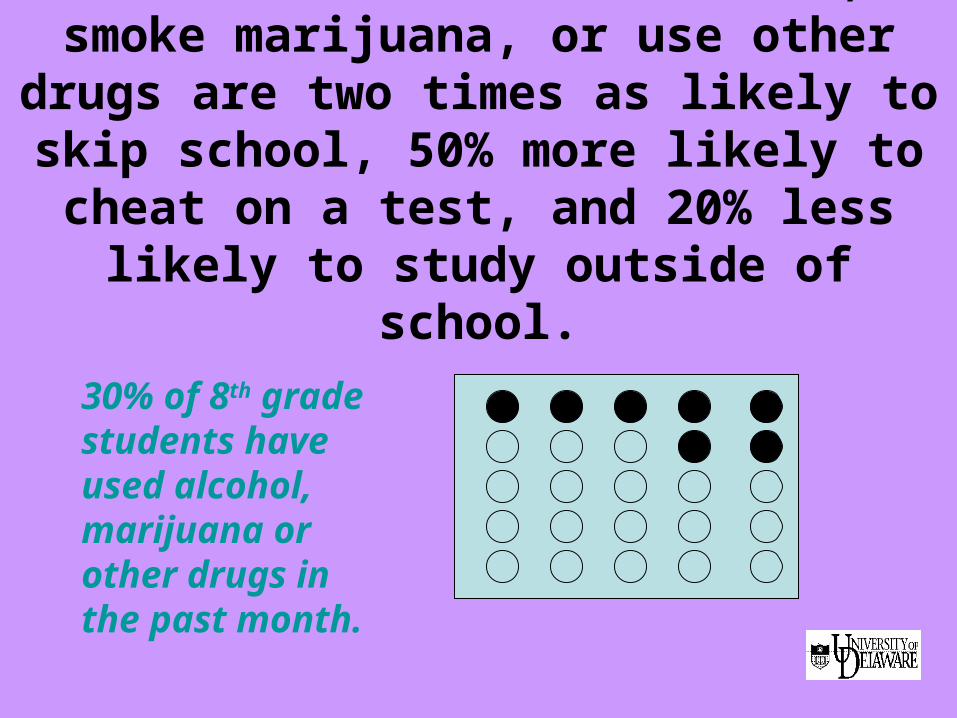
Students who drink alcohol, smoke marijuana, or use other drugs are two
times as likely to skip school, 50% more likely to cheat on a test, and 20% less
likely to study outside of school.
30% of 8th grade students have used alcohol, marijuana or other drugs in the past month.
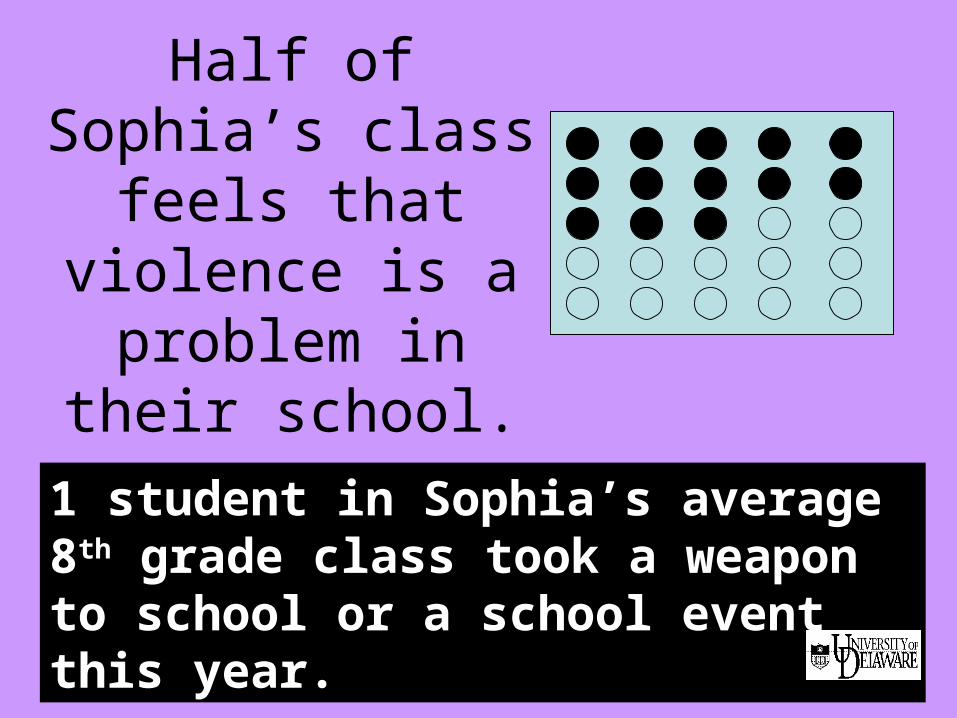
Half of Sophia’s class feels that
violence is a problem in their
school.
1 student in Sophia’s average 8th grade class took a weapon to school or a school event this year.

40% of Delaware 9th graders report having had sexual
intercourse before age 15;
8 of Sophia’s classmates are probably sexually active
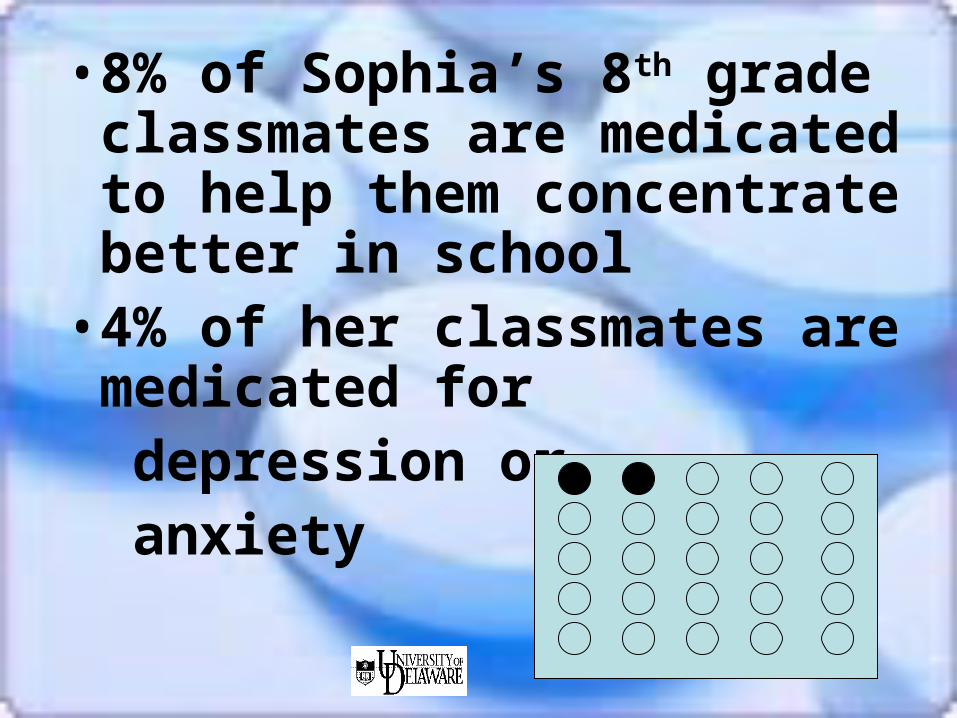
• 8% of Sophia’s 8th grade classmates are medicated to help them concentrate better in school
• 4% of her classmates are medicated for
depression or anxiety

These are the
“big kids”
Sophia now looks up to.

By the time Sophia reaches 11th grade, some of her former
classmates will have left school. Among those who remain :

In the past year, out of every 10 11th graders:
• 66% used Alcohol
• 35% used Marijuana
• 25% smoked Cigarettes
• 17% misused Rx
• 48% Gambled• 64% Sexually Active (3 months)
• 26% Binge Drank (2 weeks)
Alcohol is the most commonly reported drug used, and is
consistently associated with other high-risk behaviors.
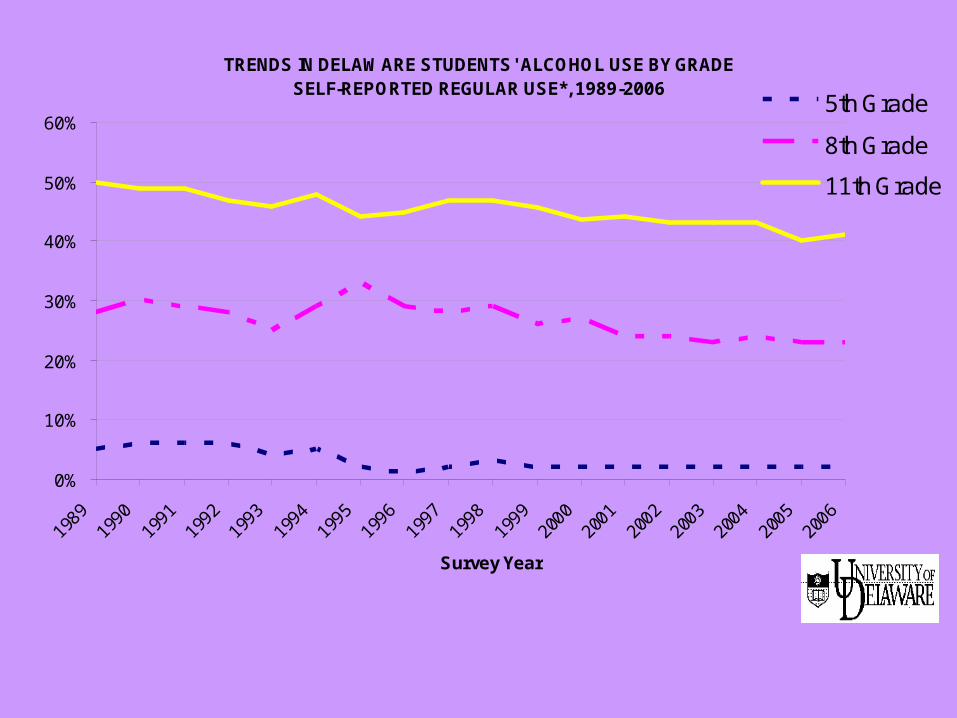
TRENDS IN DELAWARE STUDENTS' ALCOHOL USE BY GRADESELF-REPORTED REGULAR USE*, 1989-2006
0%
10%
20%
30%
40%
50%
60%
1989
1990
1991
1992
1993
1994
1995
1996
1997
1998
1999
2000
2001
2002
2003
2004
2005
2006
Survey Year
5th Grade
8th Grade
11th Grade
Note: *Regular use is defined as reports of about once a month or more often; see note, page 18aSource: Data Base/ DiagnosticsPlus (1989 - 1993); Department of Public Instruction, 1994; University of Delaw are Surveys, 1995-2006

Where do they get it?
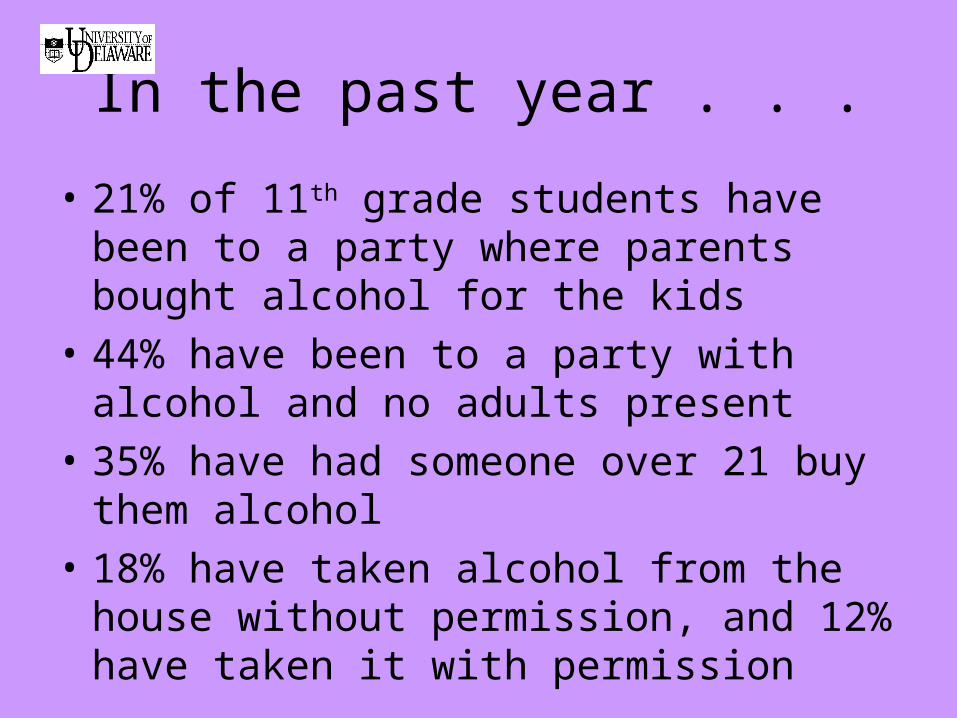
In the past year . . .
• 21% of 11th grade students have been to a party where parents bought alcohol for the kids
• 44% have been to a party with alcohol and no adults present
• 35% have had someone over 21 buy them alcohol
• 18% have taken alcohol from the house without permission, and 12% have taken it with permission

48% have used alcohol, marijuana, or other illegal drugs
in the past month.

28% of Delaware 11th Graders meet the criteria for alcohol dependence and or abuse:
21% abuse only1% dependence only
6% dependence and abuse

Delaware high school students tell us that on school property:
• 4% smoked cigarettes in the past 30 days
• 6% drank alcohol in the past 30 days
• 6% smoked marijuana in the past 30 days
• 22% were offered, sold or given illegal drugs in the past 12 months
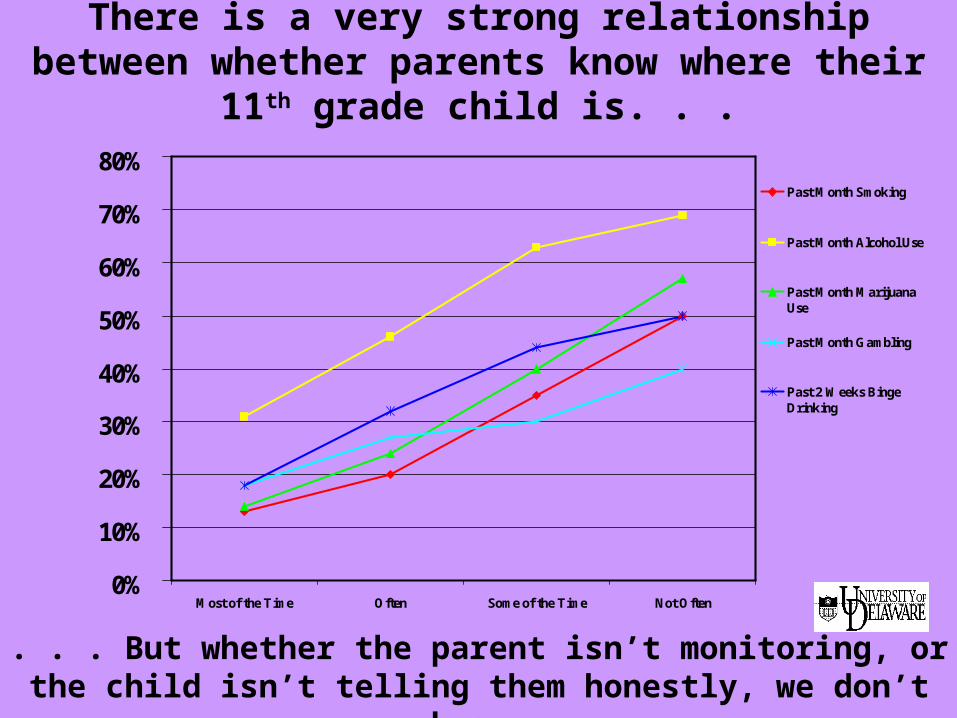
There is a very strong relationship between whether parents know where their 11th grade child is. . .
0%
10%
20%
30%
40%
50%
60%
70%
80%
Most of the Time Often Some of the Time Not Often
Past Month Smoking
Past Month Alcohol Use
Past Month MarijuanaUse
Past Month Gambling
Past 2 Weeks BingeDrinking
. . . But whether the parent isn’t monitoring, or the child isn’t telling them honestly, we don’t know.
90% of 11th grade students have driver’s licenses.
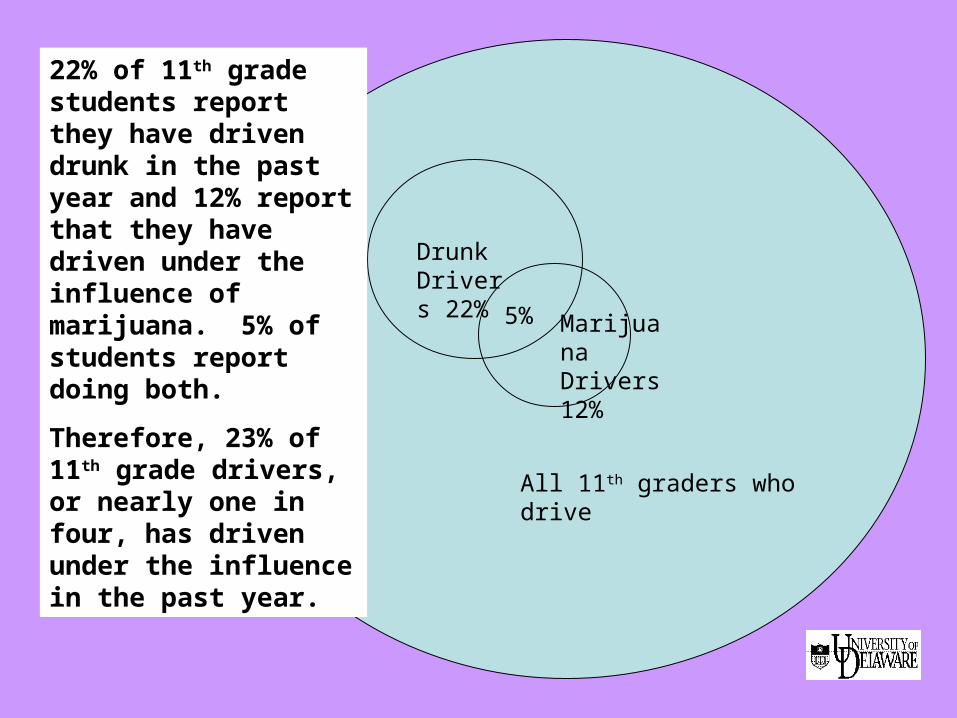
All 11th graders who drive
Drunk Drivers 22%
Marijuana Drivers 12%
5%
22% of 11th grade students report they have driven drunk in the past year and 12% report that they have driven under the influence of marijuana. 5% of students report doing both.
Therefore, 23% of 11th grade drivers, or nearly one in four, has driven under the influence in the past year.
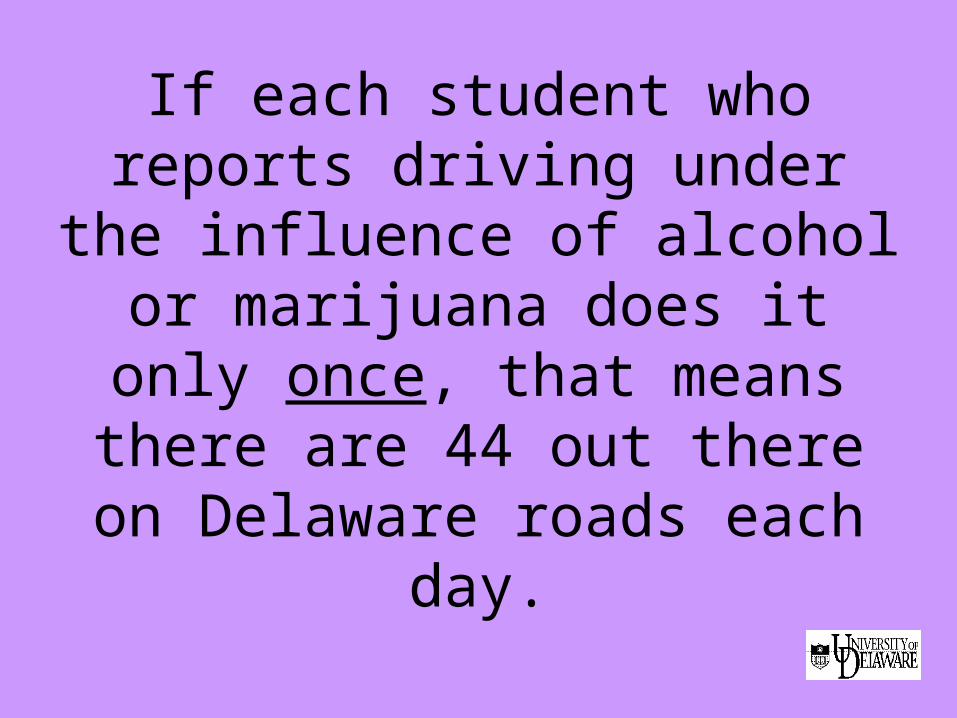
If each student who reports driving under the influence of
alcohol or marijuana does it only once, that means there are 44 out there on Delaware roads
each day.

And they probably don’t do it just once.
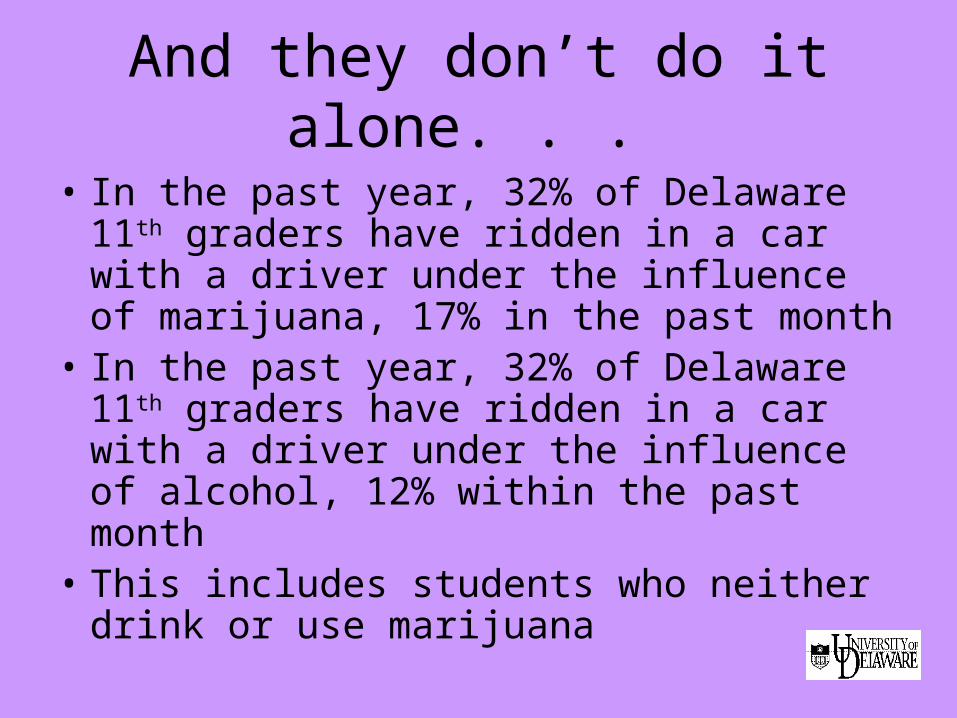
And they don’t do it alone. . .
• In the past year, 32% of Delaware 11th graders have ridden in a car with a driver under the influence of marijuana, 17% in the past month
• In the past year, 32% of Delaware 11th graders have ridden in a car with a driver under the influence of alcohol, 12% within the past month
• This includes students who neither drink or use marijuana
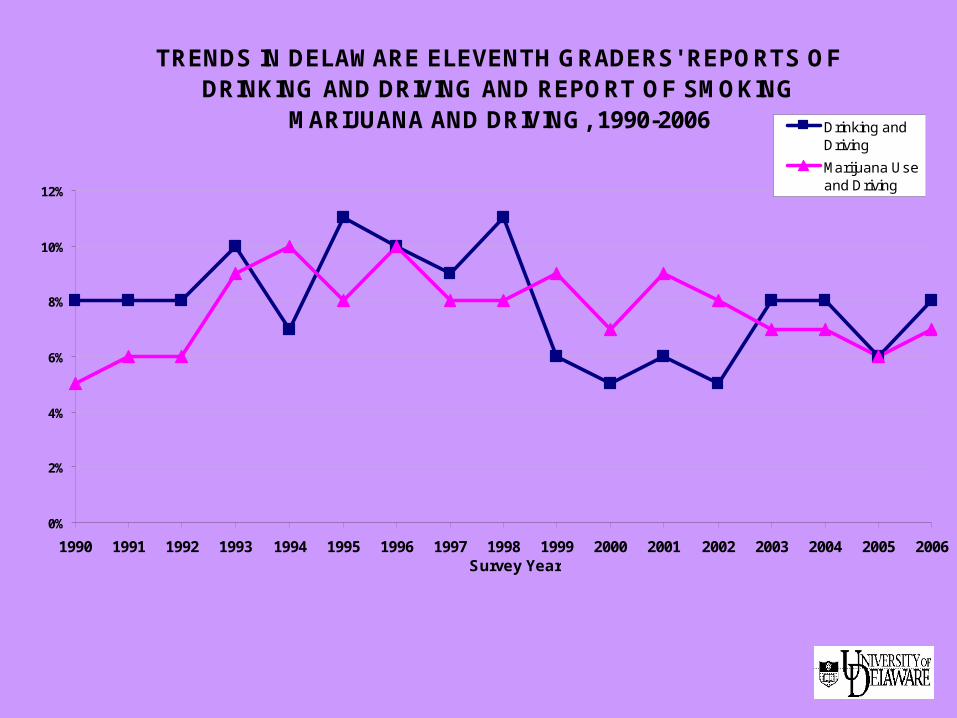
TRENDS IN DELAWARE ELEVENTH GRADERS' REPORTS OF DRINKING AND DRIVING AND REPORT OF SMOKING
MARIJUANA AND DRIVING, 1990-2006
0%
2%
4%
6%
8%
10%
12%
1990 1991 1992 1993 1994 1995 1996 1997 1998 1999 2000 2001 2002 2003 2004 2005 2006Survey Year
Drinking andDriving
Marijuana Useand Driving
Source: Data Base/ DiagnosticsPlus (1990-1993); Department of Public Instruction 1994; University of Delaw are Surveys 1995-2006
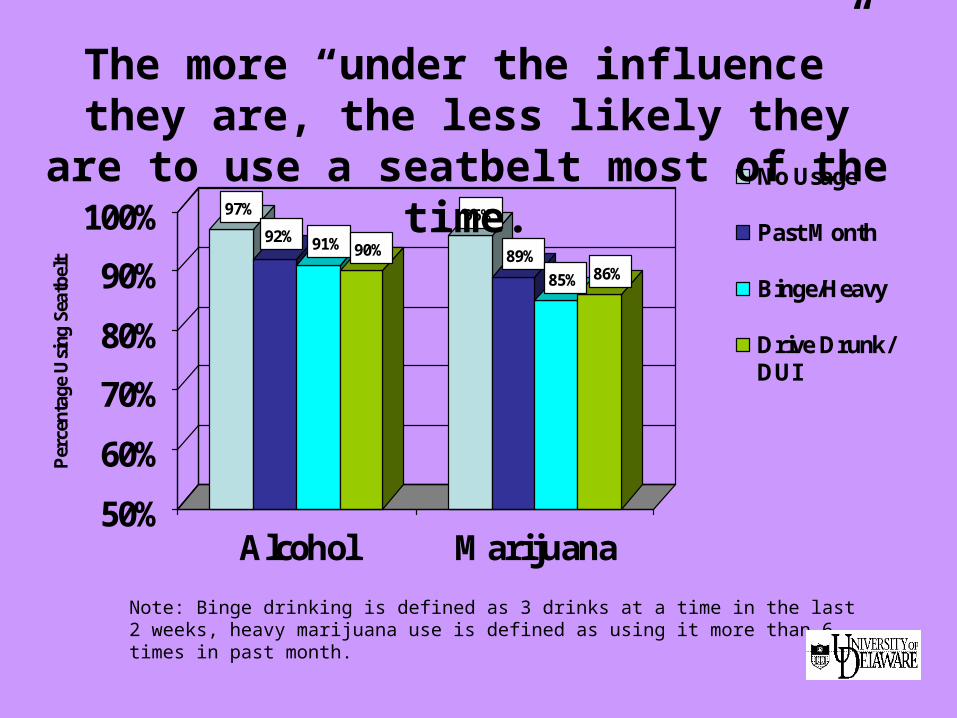
97%
92% 91% 90%
96%
89%
85% 86%
50%
60%
70%
80%
90%
100%
Per
cent
age
Usi
ng S
eatb
elt
Alcohol Marijuana
No Usage
Past Month
Binge/Heavy
Drive Drunk/DUI
The more “under the influence” they are, the less likely they are to use a seatbelt most of the
time.
Note: Binge drinking is defined as 3 drinks at a time in the last 2 weeks, heavy marijuana use is defined as using it more than 6 times in past month.
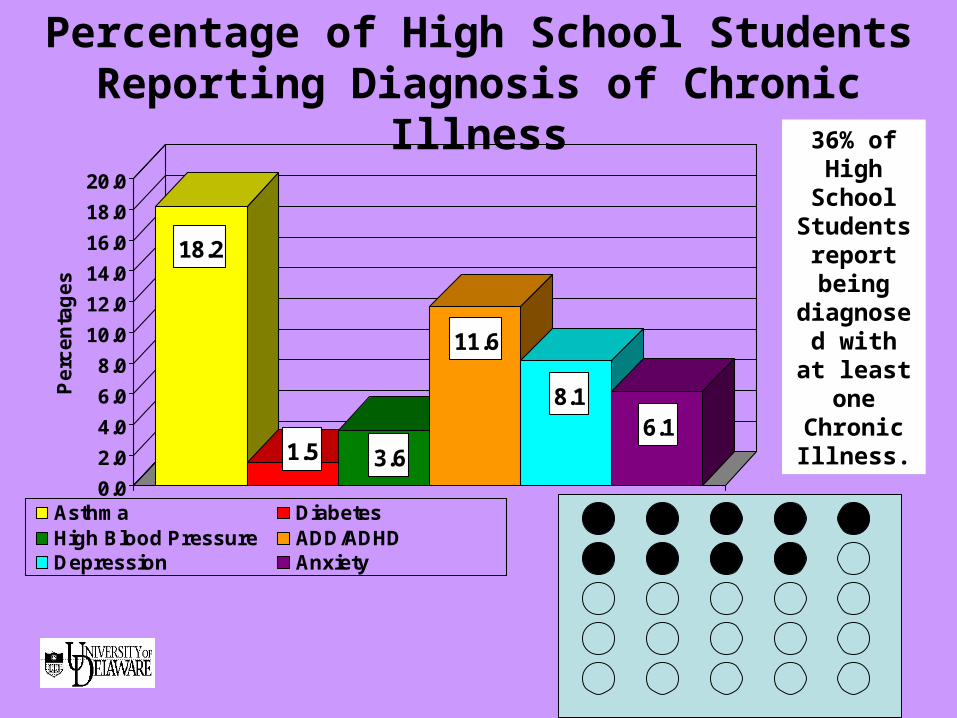
18.2
1.5 3.6
11.6
8.16.1
0.0
2.0
4.0
6.0
8.0
10.0
12.0
14.0
16.0
18.0
20.0
Pe
rce
nta
ge
s
Asthma DiabetesHigh Blood Pressure ADD/ADHDDepression Anxiety
Percentage of High School Students Reporting Diagnosis of Chronic Illness
36% of High
School Students
report being
diagnosed with at
least one Chronic Illness.
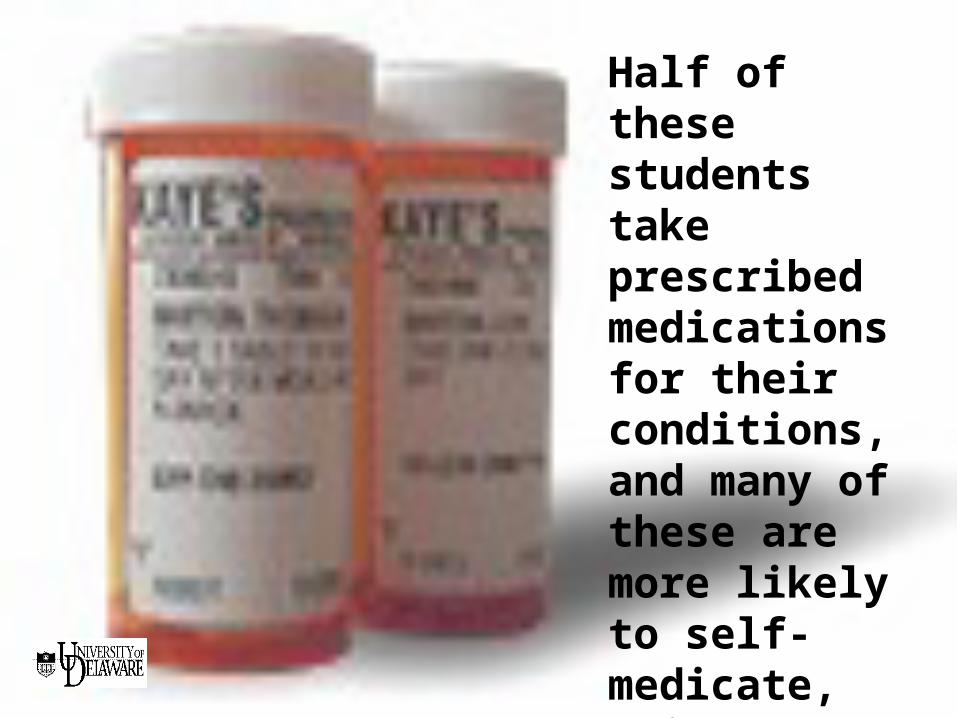
Half of these students take prescribed medications for their conditions, and many of these are more likely to self-medicate, using illegal drugs and alcohol.
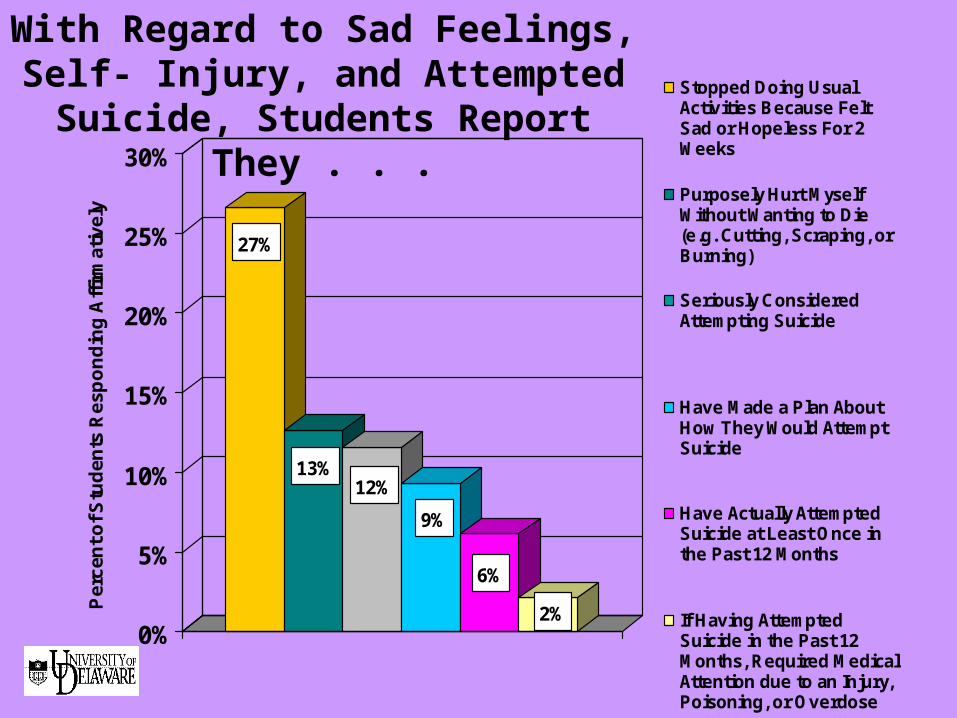
27%
13%12%
9%
6%
2%0%
5%
10%
15%
20%
25%
30%
Per
cen
t of S
tud
ents
Res
po
nd
ing
Aff
irm
ativ
ely
Stopped Doing UsualActivities Because FeltSad or Hopeless For 2Weeks
Purposely Hurt MyselfWithout Wanting to Die(e.g. Cutting, Scraping, orBurning)
Seriously ConsideredAttempting Suicide
Have Made a Plan AboutHow They Would AttemptSuicide
Have Actually AttemptedSuicide at Least Once inthe Past 12 Months
If Having AttemptedSuicide in the Past 12Months, Required MedicalAttention due to an Injury,Poisoning, or Overdose
With Regard to Sad Feelings, Self- Injury, and Attempted Suicide,
Students Report They . . .
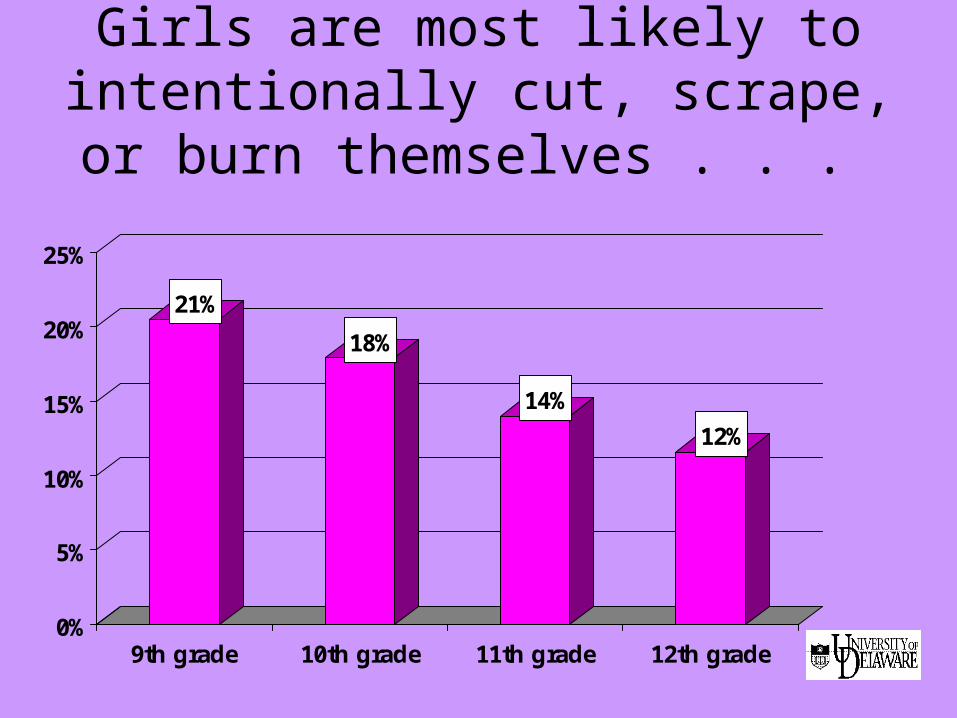
Girls are most likely to intentionally cut, scrape, or burn themselves . . .
21%
18%
14%
12%
0%
5%
10%
15%
20%
25%
9th grade 10th grade 11th grade 12th grade
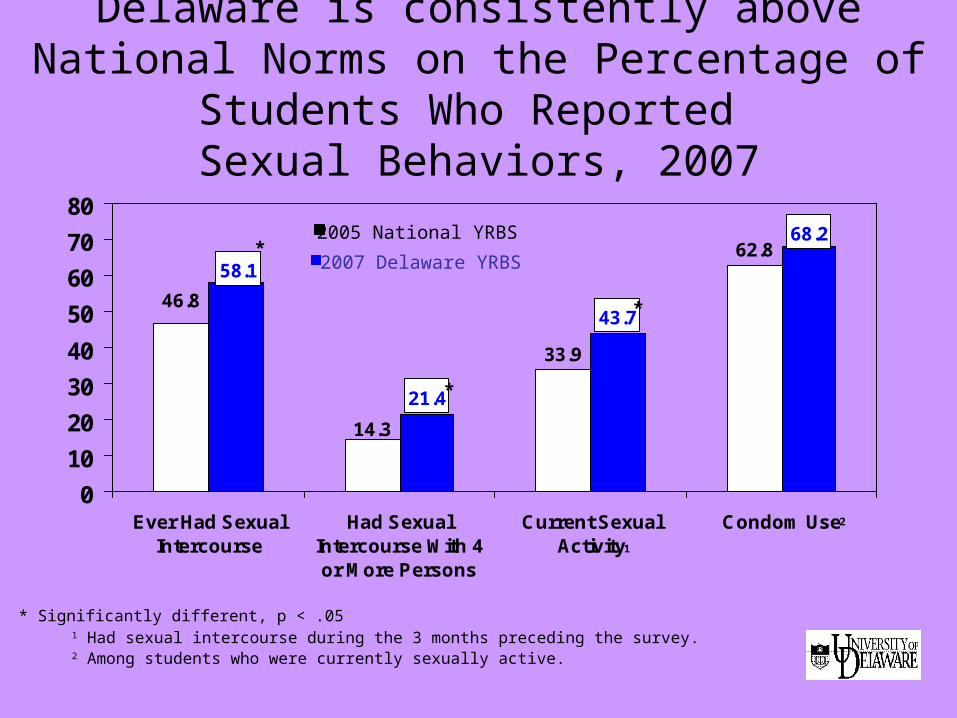
Delaware is consistently above National Norms on the Percentage of Students Who Reported
Sexual Behaviors, 2007
33.9
62.8
21.4
43.7
14.3
46.8
68.2
58.1
0
10
20
30
40
50
60
70
80
Ever Had SexualIntercourse
Had SexualIntercourse With 4or More Persons
Current SexualActivity
Condom Use
2005 National YRBS
2007 Delaware YRBS*
1
2
*
*
* Significantly different, p < .051 Had sexual intercourse during the 3 months preceding the survey.2 Among students who were currently sexually active.
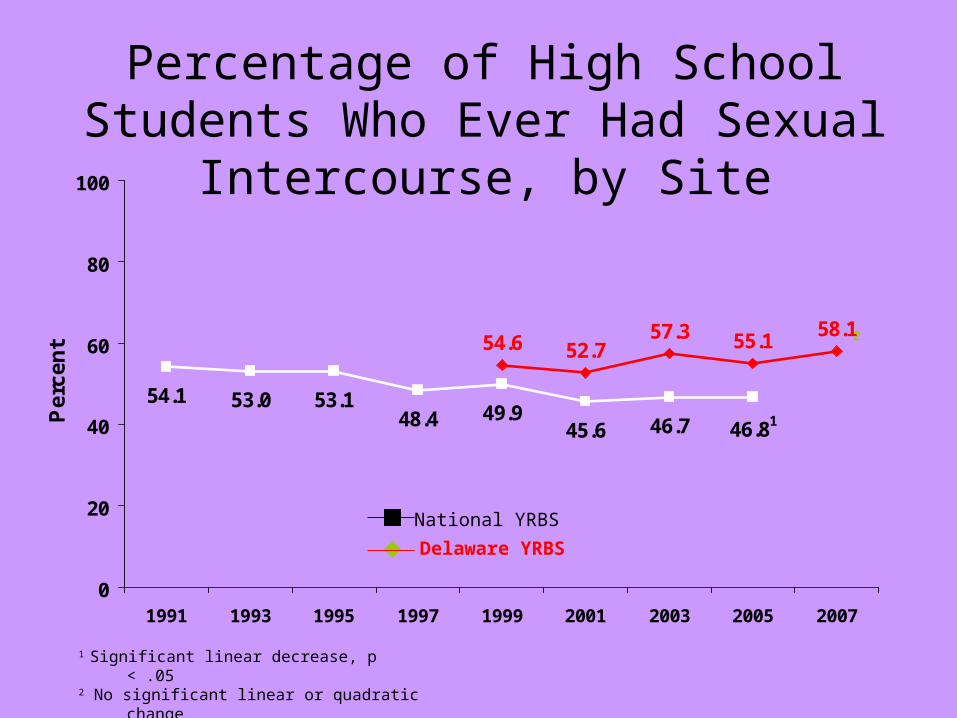
Percentage of High School Students Who Ever Had Sexual Intercourse, by
Site
1 Significant linear decrease, p < .052 No significant linear or quadratic change
54.1 53.0 53.148.4 49.9
54.6 52.757.3 55.1
58.1
46.8146.745.6
0
20
40
60
80
100
1991 1993 1995 1997 1999 2001 2003 2005 2007
Pe
rce
nt 2
National YRBS
Delaware YRBS
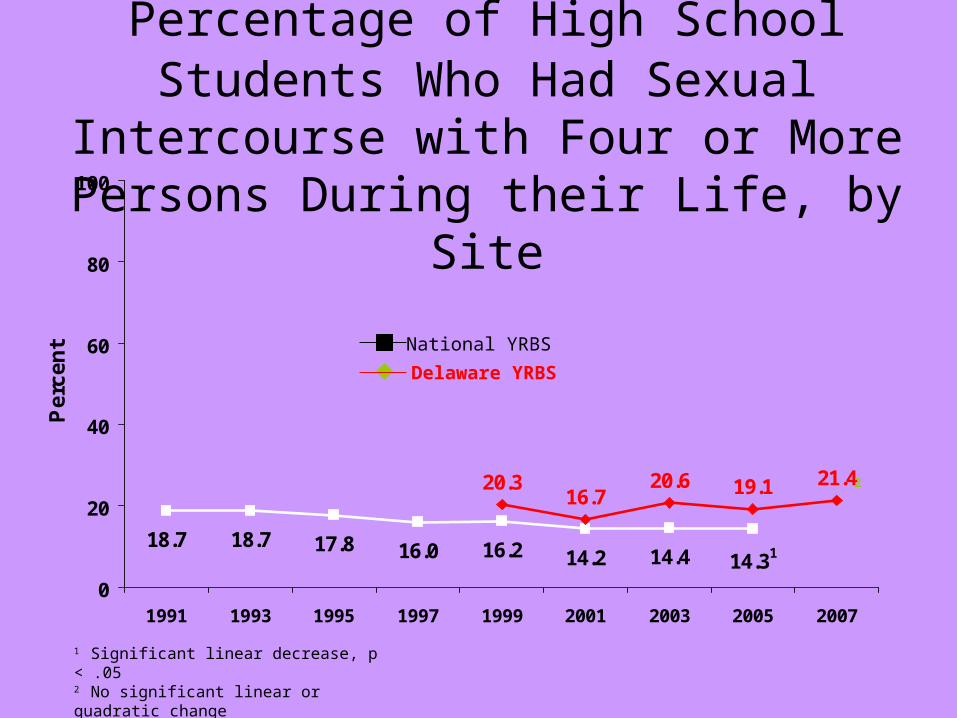
Percentage of High School Students Who Had Sexual Intercourse with Four or More Persons During their Life, by
Site
18.7 18.7 17.8 16.0 16.2
20.316.7
20.6 19.1 21.4
14.3114.414.2
0
20
40
60
80
100
1991 1993 1995 1997 1999 2001 2003 2005 2007
Pe
rce
nt
1 Significant linear decrease, p < .052 No significant linear or quadratic change
2
National YRBS
Delaware YRBS
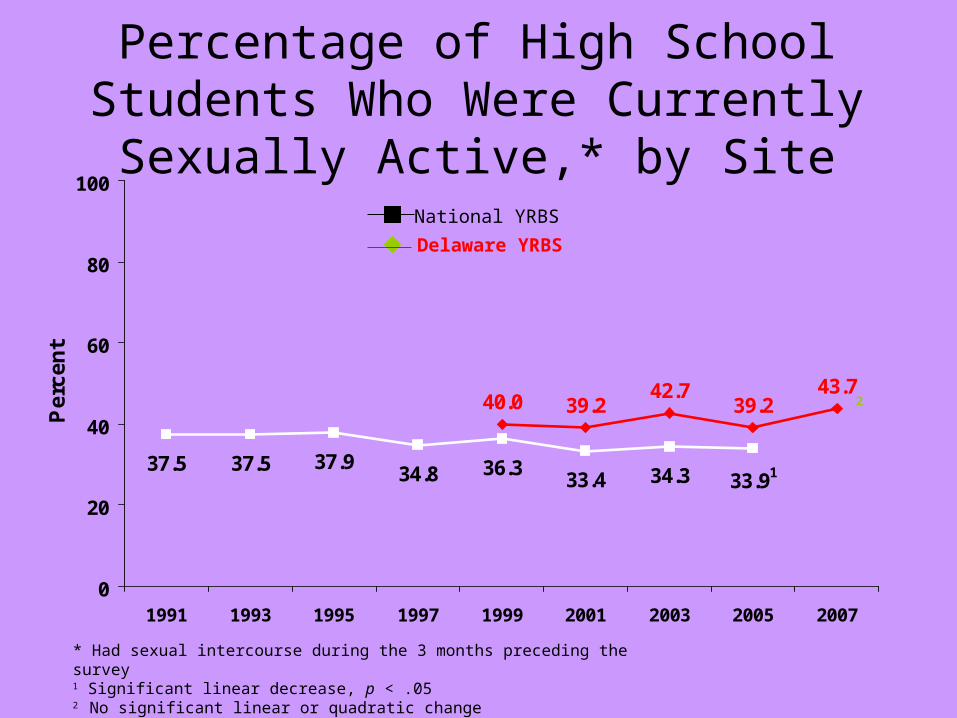
Percentage of High School Students Who Were Currently Sexually Active,* by Site
* Had sexual intercourse during the 3 months preceding the survey1 Significant linear decrease, p < .052 No significant linear or quadratic change
37.5 37.5 37.934.8 36.3
40.0 39.242.7
39.243.7
33.9134.333.4
0
20
40
60
80
100
1991 1993 1995 1997 1999 2001 2003 2005 2007
Pe
rce
nt
2
National YRBS
Delaware YRBS

Percentage of High School Students Who Used a Condom During Last Sexual
Intercourse,* by Site
* Among students who had sexual intercourse during the 3 months preceding the survey1 Significant linear increase, p < .052 No significant linear or quadratic change
46.252.8 54.4 56.8 58.0
62.0 62.2 62.5 63.768.2
62.8163.057.9
0
20
40
60
80
100
1991 1993 1995 1997 1999 2001 2003 2005 2007
Pe
rce
nt
National YRBSDelaware YRBS
2
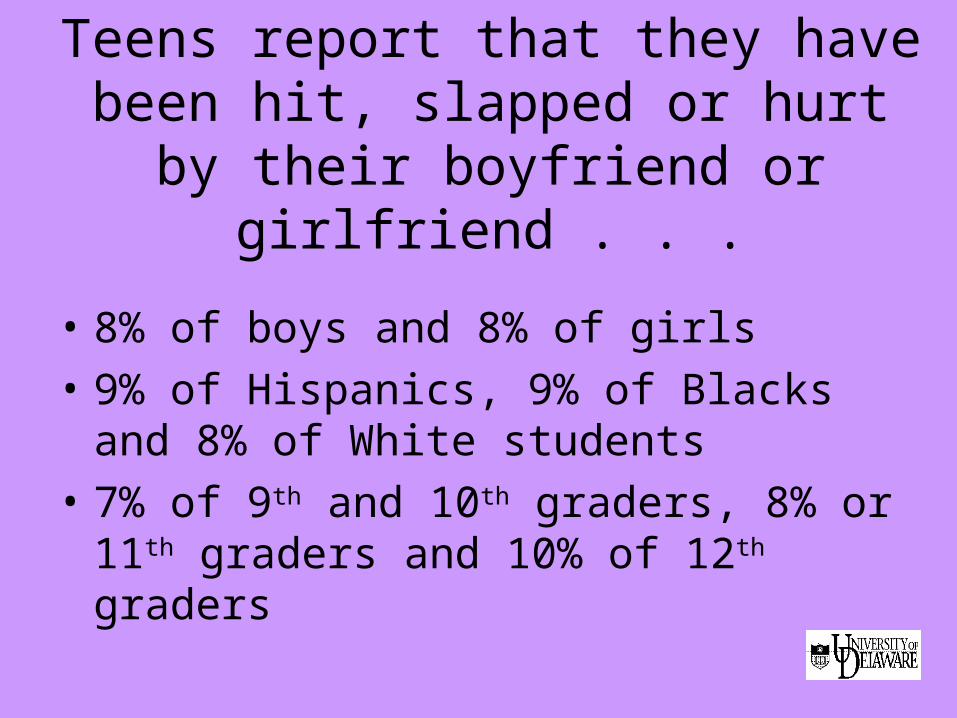
Teens report that they have been hit, slapped or hurt by their boyfriend or
girlfriend . . .
• 8% of boys and 8% of girls
• 9% of Hispanics, 9% of Blacks and 8% of White students
• 7% of 9th and 10th graders, 8% or 11th graders and 10% of 12th graders
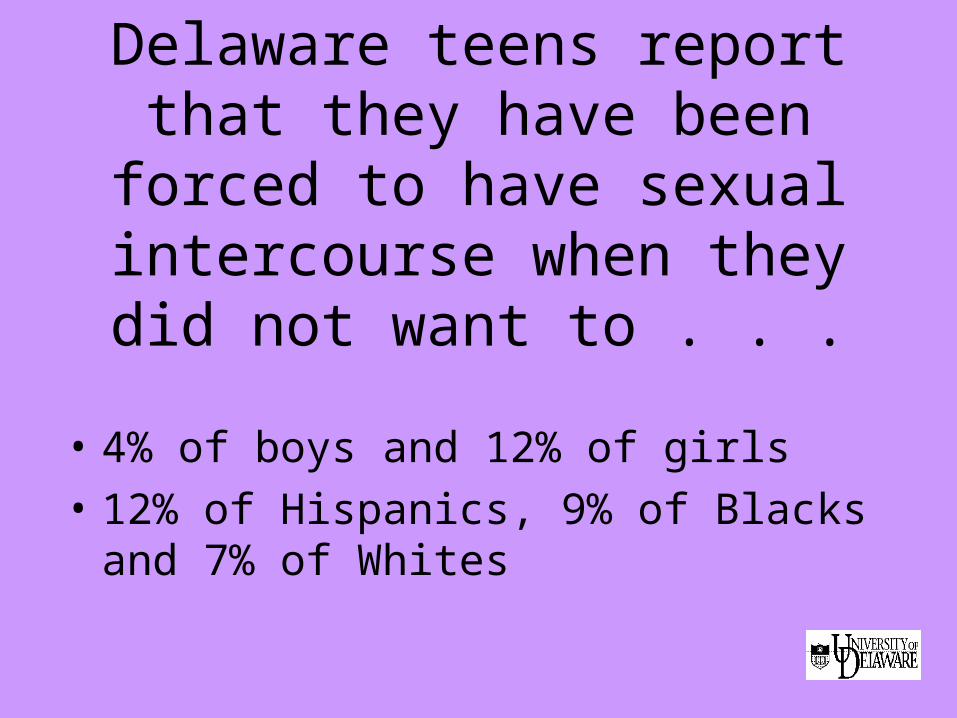
Delaware teens report that they have been forced to have
sexual intercourse when they did not want to . . .
• 4% of boys and 12% of girls
• 12% of Hispanics, 9% of Blacks and 7% of Whites
So what’s wrong with underage drinking?
Alcohol makes children less safe, less healthy, more violent, more likely to be sexually active, and more likely to be arrested.
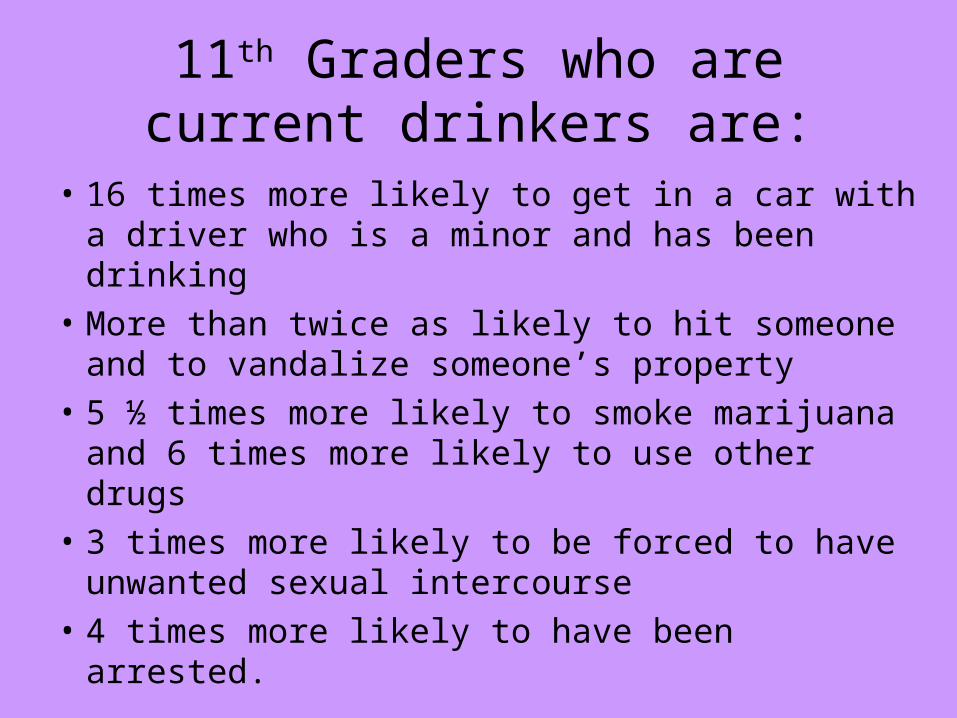
11th Graders who are current drinkers are:
• 16 times more likely to get in a car with a driver who is a minor and has been drinking
• More than twice as likely to hit someone and to vandalize someone’s property
• 5 ½ times more likely to smoke marijuana and 6 times more likely to use other drugs
• 3 times more likely to be forced to have unwanted sexual intercourse
• 4 times more likely to have been arrested.
And it has an impact on the rest of
us also
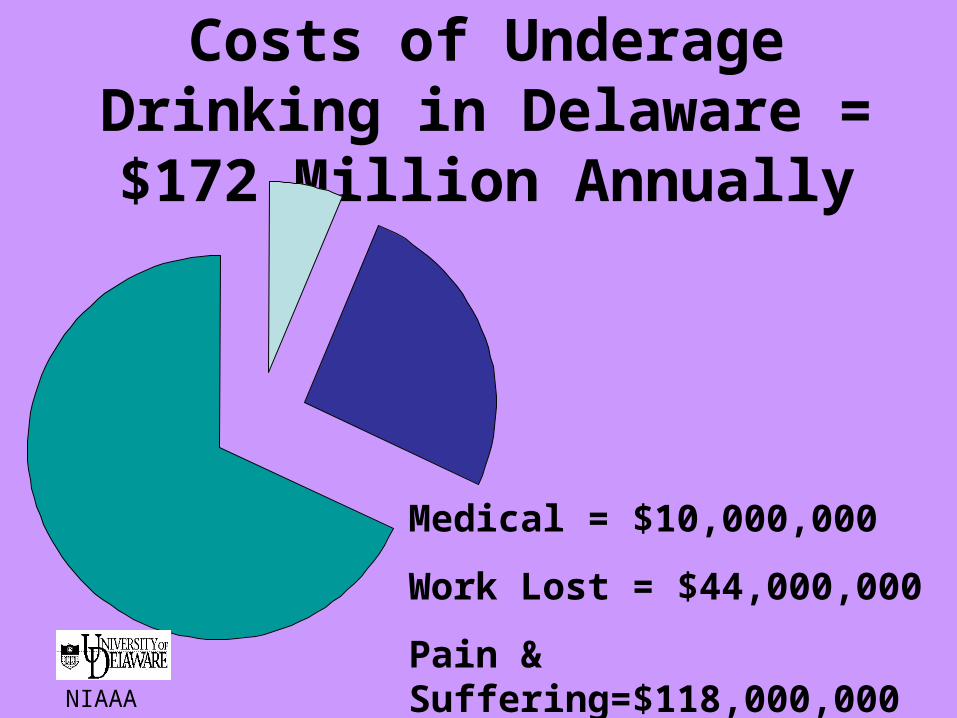
Costs of Underage Drinking in Delaware = $172 Million
Annually
Medical = $10,000,000
Work Lost = $44,000,000
Pain & Suffering=$118,000,000NIAAA 2005

Delaware’s Bottom Line:
• Costs of underage drinking = $172,000,000
• Industry profits on underage
(from total sales of $51,000,000)=25,000,000
• Funds for combatting = 11,000,000
______________________________________
Total Loss = $136,000,000
Who gets the profit?
Who pays the remainder?
Costs are shared in:
• Health Insurance
• Car Insurance
• Property Insurance
• State Taxes
• Municipal Taxes
Federal Taxes on Alcohol, when adjusted for inflation,
have declined 33% since 1992 (beer tax is 63% lower
than 1970 rates):• Federal beer and wine taxes are
currently 7-10 cents per drink
• Federal liquor tax is currently 20-25 cents per drink
What can Parents Do?• Messages
– Modeling appropriate behaviors– Make it clear you disapprove
• Monitoring– Know where they are– Know who they are with
• Management– Clear, Consistent Rules– Consistent, appropriate consequences
Related Documents


![Research Article ParentalInfluenceonYoungChildren…downloads.hindawi.com/journals/ijpedi/2010/468526.pdf · in their children [31–33], parents who perceive that their child’s](https://static.cupdf.com/doc/110x72/5ececfbf39b8fa3e79614300/research-article-parentaliniuenceonyo-in-their-children-31a33-parents-who.jpg)


