Chemical Geology (Isotope Geoscience Section), 101 ( 1992 ) 21-42 Elsevier Science Publishers B.V., Amsterdam 21 In situ oxygen isotope analysis of feldspar and quartz by Nd:YAG laser microprobe Don Elsenheimer and John W. Valley Department of Geologyand Geophysics, Universityof Wisconsin, Madison, W153706, USA (Received March 4, 199 !; revised and accepted September 24, 1991 ) ABSTRACT Elsenheimer, D. and Valley, J.W., 1992. In situ oxygen isotope analysis of feldspar and quartz by Nd:YAG laser micro- probe. In: R.S. Harmon and R.W. Hinton (Guest-Editors), Frontiers in Isotope Geosciences. Chem. Geol. (Isot. Geosci. Sect.), 10l: 21-42. In situ dtso analyses have been reproducibly obtained +0.5%0 (la) on 400-1200-pm diameter spots of plagioclase using a Nd:YAG laser microprobe system and BrFs. Over 100 analyses on plagioclase megacrysts from a single sample of Marcy Anorthosite were made to determine the optimum analytical conditions. The best results are obtained on 400-800- pro-thick wafers; less accurate and less precise results were obtained on centimeter-thick slabs. Analyses on some individ- ual wafers display very high precision (below + 0.2%0, lo) that are nearly as good as the precision of conventional anal- yses. However, such high precision cannot yet be systematically obtained in situ, and it is not certain whether it results from especially homogeneous domains within the sample or from differences in operating conditions. Oxygen-leaching and isotope fractionation along the edges of the laser-heated reaction pits may have a minor effect on precision. The combination of sub-millimeter spatial resolution and + 0.5% precision has not previously been obtained on feld- spar, and provides the means to investigate fluid-rock interactions in a variety of geologic environments. The plagioclase in this study is the first sample for which oxygen isotope homogeneity has been evaluated in situ. The absence of isotopic zonation restricts theories on the roles of fluids associated with the Marcy Anorthosite Massif, New York, U.S.A. In con- trast, replicate JIsO analyses in qua~z, K-feldspar and plagioclase grains in granite from the Siljan Ring astrobleme, Swe- den, vary by > 1%o, suggesting the existence of intragranular isotopic heterogeneity resulting from interaction with late meteoric fluids. 1. Introduction Recent advances in microbeam-based deter- minations of light stable isotope ratios permit in situ measurements of single mineral grains or parts of grains. In addition to permitting analysis of mineral zonation, these in situ sta- ble isotope analyses obviate many of the tedi- ous, lengthy, and sometimes difficult sample preparation procedures associated with the study of powdered mineral separates. The Correspondence to: D. Elsenheimer, University of Wis- consin, Department of Geology and Geophysics, Lewis G. Weeks Hall, 1215 Dayton Str., Madison, WI 53706, USA. newly developed ion microprobe and laser mi- croprobe techniques also allow a dramatic in- crease in spatial resolution and reduction in sample size, when compared to conventional methods of stable isotopic extraction. These advantages have been crucial in evaluating theoretically based predictions that intracrys- taUine isotopic heterogeneity will exist in cer- tain geologic settings (Lasaga, 1983; Cole and Ohmoto, 1986; Giletti, 1986; Valley, 1986). The latest generation of ion microprobes can provide stable isotope analyses with a spatial resolution as good as 2-10 #m (Valley and Graham, 1991 a, b). However, the precision of analyses on electrically conductive materials is 0168-9622/92/$05.00 © 1992 Elsevier Science Publishers B.V. All fights reserved.

Welcome message from author
This document is posted to help you gain knowledge. Please leave a comment to let me know what you think about it! Share it to your friends and learn new things together.
Transcript
Chemical Geology (Isotope Geoscience Section), 101 ( 1992 ) 21-42 Elsevier Science Publishers B.V., Amsterdam
21
In situ oxygen isotope analysis of feldspar and quartz by Nd:YAG laser microprobe
Don Elsenheimer and John W. Valley Department of Geology and Geophysics, University of Wisconsin, Madison, W15 3706, USA
(Received March 4, 199 !; revised and accepted September 24, 1991 )
ABSTRACT
Elsenheimer, D. and Valley, J.W., 1992. In situ oxygen isotope analysis of feldspar and quartz by Nd:YAG laser micro- probe. In: R.S. Harmon and R.W. Hinton (Guest-Editors), Frontiers in Isotope Geosciences. Chem. Geol. (Isot. Geosci. Sect.), 10l: 21-42.
In situ dtso analyses have been reproducibly obtained +0.5%0 ( la ) on 400-1200-pm diameter spots of plagioclase using a Nd:YAG laser microprobe system and BrFs. Over 100 analyses on plagioclase megacrysts from a single sample of Marcy Anorthosite were made to determine the optimum analytical conditions. The best results are obtained on 400-800- pro-thick wafers; less accurate and less precise results were obtained on centimeter-thick slabs. Analyses on some individ- ual wafers display very high precision (below + 0.2%0, lo) that are nearly as good as the precision of conventional anal- yses. However, such high precision cannot yet be systematically obtained in situ, and it is not certain whether it results from especially homogeneous domains within the sample or from differences in operating conditions. Oxygen-leaching and isotope fractionation along the edges of the laser-heated reaction pits may have a minor effect on precision.
The combination of sub-millimeter spatial resolution and + 0.5% precision has not previously been obtained on feld- spar, and provides the means to investigate fluid-rock interactions in a variety of geologic environments. The plagioclase in this study is the first sample for which oxygen isotope homogeneity has been evaluated in situ. The absence of isotopic zonation restricts theories on the roles of fluids associated with the Marcy Anorthosite Massif, New York, U.S.A. In con- trast, replicate JIsO analyses in qua~z, K-feldspar and plagioclase grains in granite from the Siljan Ring astrobleme, Swe- den, vary by > 1%o, suggesting the existence of intragranular isotopic heterogeneity resulting from interaction with late meteoric fluids.
1. Introduction
Recent advances in microbeam-based deter- minations of light stable isotope ratios permit in situ measurements of single mineral grains or parts of grains. In addition to permitting analysis of mineral zonation, these in situ sta- ble isotope analyses obviate many of the tedi- ous, lengthy, and sometimes difficult sample preparation procedures associated with the study of powdered mineral separates. The
Correspondence to: D. Elsenheimer, University of Wis- consin, Department of Geology and Geophysics, Lewis G. Weeks Hall, 1215 Dayton Str., Madison, WI 53706, USA.
newly developed ion microprobe and laser mi- croprobe techniques also allow a dramatic in- crease in spatial resolution and reduction in sample size, when compared to conventional methods of stable isotopic extraction. These advantages have been crucial in evaluating theoretically based predictions that intracrys- taUine isotopic heterogeneity will exist in cer- tain geologic settings (Lasaga, 1983; Cole and Ohmoto, 1986; Giletti, 1986; Valley, 1986).
The latest generation of ion microprobes can provide stable isotope analyses with a spatial resolution as good as 2-10 #m (Valley and Graham, 1991 a, b). However, the precision of analyses on electrically conductive materials is
0168-9622/92/$05.00 © 1992 Elsevier Science Publishers B.V. All fights reserved.
22 DON ELSENHEIMER AND J.W. VALLEY
5 to l0 times poorer than that of conventional stable isotope techniques; current best re- ported values are _.0.3 to ±0.5%0 ( la) for sulfur isotopes in pyrite and galena (Graham and Valley, 1992 in this issue) and +- l%o ( l ¢) for oxygen isotopes in magnetite and ilmenite (Valley and Graham 1991 a, b). Furthermore, this ± l%o-precision level has not been at- tained on insulating minerals, such as silicates, except through use of unusually long counting times (e.g., 8.5 hr per spot; Lorin et al., 1990), or small particles (McKeegan, 1987).
The laser microprobe technique has a spa- tial resolution that is larger than that of the ion microprobe's (> 50/tm, at present). It does not, however, require charge compensation and is equally suited to electrical insulators or con- ductors. The element of interest is released as a charge neutral gas; samples are analyzed with a gas-source mass spectrometer. Therefore, high-precision analyses can be obtained on a wide range of geologic materials; laser micro- probe studies have been conducted on sulfides (Crowe et al., 1990; Kelly and Fallick, 1990; Crowe and Valley, 1992 in this issue), carbon- ates (Smalley et al., 1989; Crowe, 1990; Dick- son et al., 1990), and silicates and oxides (Sharp, 1990, 1991 ). The laser microprobes in most of these studies employ either a Nd:YAG (Nd-doped yttrium-aluminum garnet) laser (2-- 1,064 nm, spot size >9/~m) or CO2 laser (2= 10,600 nm, spot size >i 100/~m) as a heat s o u r c e .
Sharp (1990) reported a laser microprobe technique for analysis of oxygen isotope ratios using a CO2 laser system with BrFs. The J~sO- values of powdered mineral separate and whole-rock samples as small as 0. l mg were ac- curately measured with precision comparable to conventional extraction methods ( +- 0.1%, I a). This represents a reduction in sample size of 100, when compared to conventional tech- niques. Analyses from refractory minerals (e.g., garnet, olivine and kyanite) that are not read- ily analyzable using conventional bulk extrac- tion methods were also obtained.
In addition to sample size reduction, in situ analyses of olivine, quartz and magnetite re- ported by Sharp (1990) have increased spatial resolution. While most of these in situ mea- surements are in general agreement with cor- relative conventional analyses, a few values have markedly higher J~SO-values. This re- sulted in poorer accuracy and precision, in comparison to values attained by conventional powder analyses: J~sO= +6.3+_ 1.2%0o (la) , n - 7 for olivine (conventional valve + 5.7%o), and J~80= +3.3+_2.2%o (ltr), n=5 for mag- netite (conventional value +2.0%o). Sharp suggests that these elevated ratios may be the result either of contamination by other phases or a sporadic fractionation at the contact be- tween the reaction pit rim and the unreacted adjacent matrix. A similar fractionation mech- anism for in situ analysis of sulfides was sug- gested by Crowe et al. (1990), who demon- strated depletion of elemental sulfur around reaction pits in chalcopyrite (Crowe et al., 1990, fig. 6). They also suggest that additional factors, such as laser beam diameter and reac- tion pit depths, affect the accuracy and preci- sion of in situ analyses in sulfides; these factors may also affect in situ jlSO analyses.
If the precision of in situ J~sO analyses on silicates and oxides is affected by specific events related to the laser microprobe tech- nique, then an understanding of the factors re- sponsible for this fractionation is necessary. If fractionation cannot be totally eliminated, then the identification of the distinguishing char- acteristics of fractionated and non-fraction- ated analyses could lead to the establishment of a set of criteria able to determine the relia- bility of any single analysis. Such criteria, es- tablished within a careful research protocol and applied independently of the stable isotopic values obtained, will best portray the accuracy and precision of the in situ laser microprobe technique.
Although Crowe et al. (1990) have pre- sented a detailed protocol for optimizing the accuracy and precision of in situ sulfur isotope
IN SITU O ISOTOPE ANALYSIS BY Nd:YAG LASER MICROPROBE 23
determinations, no study has done the same for oxygen isotopes in silicates and oxides. The primary objectives of this study were: ( l ) to demonstrate the feasibility of J l sO analyses on silicates with a Nd:YAG laser; (2) to develop laser microprobe techniques that optimize the accuracy and precision of in situ oxygen iso- tope determinations; and (3) to determine which variables associated with the in situ technique are critical for evaluating the relia- bility of any single analysis.
2. Standard selection
Obtaining homogeneous standards is a dif- ficult yet essential task in the development of any new microanalyticai technique. Without such standards, one faces a dilemma when t~lSO-values from replicate in situ analyses on a mineral are not consistent, since this may re- flect imprecision of techniqtle, oxygen isotope heterogeneity, or both. There is currently no analytical method capable of independently determining t~ lsO homogeneity below the 1%o level. When standards are chosen to determine the precision and accuracy of the laser micro- probe technique, it must be hoped that these standards are isotopically homogeneous. If this assumption is correct, then the precision and accuracy levels obtained from replicate in situ analyses may be used to evaluate the signifi- cance of t~ISO variations in other samples. However, the possibility always exists that standards are slightly heterogeneous, such that the potential precision of the technique is bet- ter than that which is measured.
Silicate and oxide minerals do not uni- formly react to laser radiation. How a specific mineral reacts to laser-heating will largely de- pend on the wavelength and power of the laser. For example, many optically clear minerals do not readily absorb Nd:YAG radiation (A= 1,064 nm, near-IR) but do absorb CO2 laser radiation (A= 10,600 nm, IR). The de- gree of partial reaction or fractionation during an in situ analysis may also depend on mineral
chemistry. Therefore, the precision and accu- racy levels obtained from in situ analyses on one mineral standard cannot be predicted to apply to other minerals.
The mineral we have selected for intensive study is plagioclase. Plagioclase is a common rock-forming mineral that is particularly sus- ceptible to subsolidus oxygen isotope ex- change, most notably with fluids. Therefore, there are many potential geologic situations in which feldspar ~80 heterogeneities will be preserved. The plagioclase we have analyzed also readily reacts with BrF~ during heating by Nd:YAG laser.
Our laboratory standard plagioclase is from the Marcy Anorthosite Massif, Adirondack Mountains, New York, U.S.A. A number of different lines cf evidence suggest that the pla- gioclase in the sample chosen for study (83SR4; Morrison and Valley, 1988b) is iso- topically homogeneous~ The An4s sample was regionally metamorphosed under granulite-fa- cies conditions (Bohlen et al., 1985), such that the temperatures of emplacement and subse- quent metamorphism are above the calculated feldspar closure temperatures for oxygen iso- tope diffusion (Elphick et al., 1988). There- fore, complete isotopic equilibration, even within the larger megacrysts, should have oc- curred. The sample (~I8OsMow= +9.40/00 by conventional analysis) is within a 300-km 2 area in which the 61SO_values of all analyzed plagio- clase megacrysts are + 9.3 _+ 0.2%0 due to mag- matic mixing and homogenization (Morrison and Valley, 1988b). Thin-section examination by transmitted light and cathodoluminescence reveals only minimal alteration, and no cal- cite, confirming its categorization by Morrison and Valley as one of the most pristine samples in their study. The dimensions of the total hand sample (roughly a cube with 15-cm-wide sides) were such that many megacrysts within it were available for study. The megacrysts themselves are large (up to 3 cm in length), which permits multiple analyses on individual megacrysts. They also contain a trace, submicroscopic dis-
24 DON ELSENHEIMER AND J.W. VALLEY
semination of spinel, which imparts a gray color and may enhance laser beam absorption at 1064 nm.
3. Instrumentation
The laser microprobe system used in this study has previously been described by Crowe et al. (1990). The system employs an 11-W Nd:YAG laser, a modified petrographic mi- croscope, and a Finnigan ® MAT 251 gas- source mass spectrometer. The system is mod- ular, and designed so that the silicate extrac- tion line can be readily interchanged with ex- traction lines for sulfides and carbonates. With a typical 30-min changeover time from one ex- traction line to another, multiple investigators can use the laser microprobe for different proj- ects. The modular nature of this laser micro- probe system also leaves room for future ex- pansion into other types of analysis, without requiring the abandonment of existing capabilities.
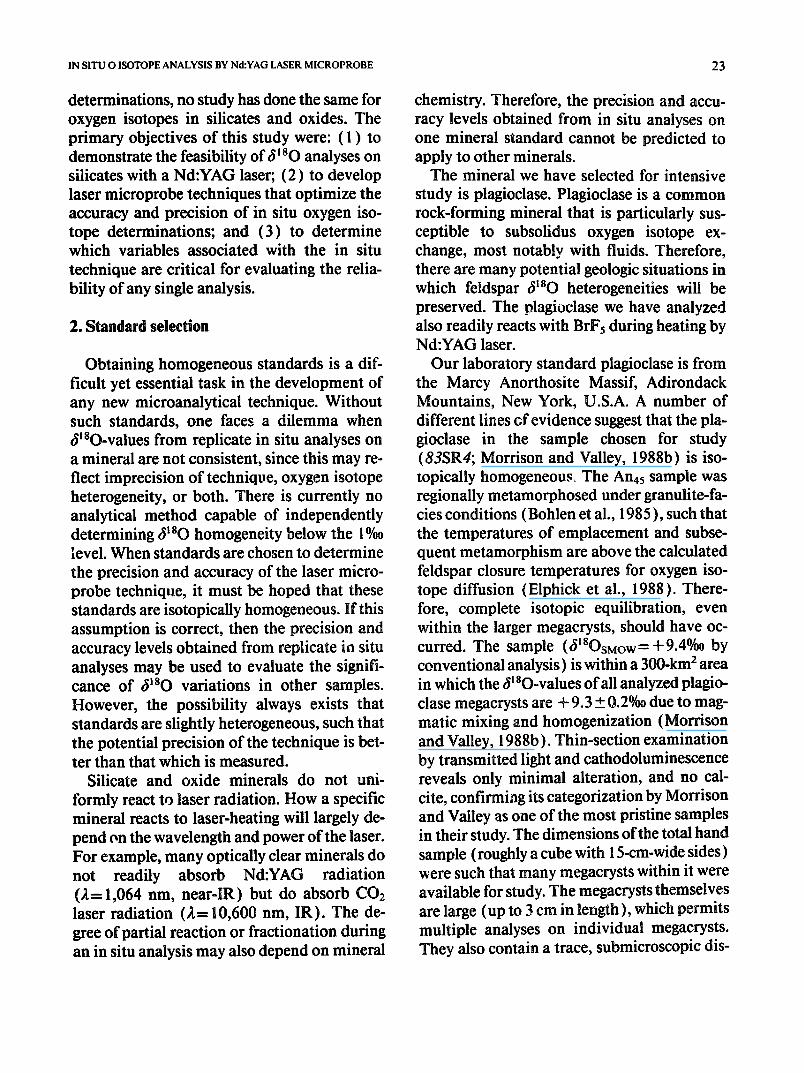
When configured with a silicate extraction line (Fig. 1 ), the laser microprobe is similar to the CO2-1aser-based design of Sharp (1990). A
stainless-steel (s.s.) sample chamber is fixed to a translatable microscope stage; s.s. tuE.ing (6 mm O.D.) connects an s.s. cold finger to the sample chamber. The cryogenic extraction line is connected to the cold finger through an s.s. flexible bellows, which permits movement of the sample chamber for focusing and aiming. The cryogenic extraction line, modelled after a conventional silicate extraction line (Clayton and Mayeda, 1963), consists of an s.s. cold trap, a Pyrex ® cold trap, a graphite O2-~CO2 converter, and an additional Pyrex ® cold trap of known volume. Sample sizes are measured in this known volume with a Baratron ® capac- itance manometer.
3.1. Comparison of the Nd:YAG and C02 laser microprobe systems
Although the Nd:YAG laser microprobe sys- tem used in this study is similar to the CO2- laser-based design of Sharp (1990), there are a number of important differences between the two systems. For example, while both systems pass laser beams through transparent windows fixed to the sample chamber with fluorine-re- sistant Kalrez ® O-rings, we use a sapphire win-
HR Mirror
Reflected Light ~
sample c h a m l ~
Translatable microscope stage
f _ _ - -
0Vi. Oamera il ~ Petrographic microscope J '~
.~ [r 6x Beam Expand_ er
"/ ~ Nd-YAG laser
10x Objective Lens (f=4Ornm)
saDohire window ~,qPI ;~Kalrez e O-ringa ~l," ........ ,.,'P
~ flexible ss " I ~ bellows
cold-finger "*high-vacuum valve
lJ Video T _~_ to vacuum Monitor pressure gauge flow-thru A _~ waste /
• ~ ~ wasteliquid|
' Kel-F'u'e ~ ! ) ~ tovacuum
Pyrex ~ U-trap O2-,CO2 converter JB metal trap v to mass spectrometer
Fig. 1. Schematic diagram of the University of Wisconsin laser microprobe system with a modular extraction line for in situ laser microprobe analysis of silicates and oxides.
IN SITU O ISOTOPE ANALYSIS BY Nd:YAG LASER MICROPROBE 25
dow, while Sharp uses a window made of BaF2. The relatively inexpensive sapphire window is very durable, is easily cleaned, and is greater than 98% transmittant to Nd:YAG radiation (2=1064 nm). With routine cleaning, our original sapphire window has maintained vac- uum for over two years during more than 250 sample analyses involving BrFs, without frost- ing or breaking. In contrast, the delicate BaF2 windows that are used in CO2 laser analysis (Sharp, 1990) absorb ~ 10-20% of the CO2 laser radiation, and display perfect cubic cleavage. Therefore, they are more prone to thermal stress and failure. While some labora- tories have used BaF2 windows without inci- dent (D. Crowe, pers. commun., 1991; Z. Sharp, pets. commun., 1991 ), other laborato- ries have had BaF2 windows fail during laser analysis (G. Erehart, pers. commun., 1990). As a result, CO2 laser microprobe systems re- quire caution when using dangerous reagents such as BrFs.
The minimum spot sizes of the Nd:YAG and CO2 lasers used also differ. The spot size of a focused laser beam is directly related to the wavelength of the laser radiation, and can be estimated by the useful Gaussian approximation:
w=2f /nr ( 1 )
where w-radius of the focused laser beam; 2=wavelength of the laser radiation; f = focal length of the focusing lens; and r= radius of the beam incident on the lens surface [Siegman, 1971; for an equivalent equation, see Fallick et al. (1992) in this issue]. In our system, a 0.5- mm radius Nd:YAG beam (2-1064 nm) ex- its the laser, is expanded to a 3-mm radius wit~ a 6× beam expander, and is focused by a piano-convex 10 × singlet lens (f= 40 ram). This results in a theoretical focused laser spot size radius of 4.5/tm (9-#m diameter). As eq. 1 indicates, a CO2 laser (2= 10,600 nm) within a similar system would have a theoretical spot size that is 10X larger. Sharp (1990) esti- mates the spot size of his laser to be ~ 100/~m
and the effective diffraction limit of a CO2 laser is ~ 50 gm. A frequency doubler or quadrupler can be added to a Nd:YAG laser system to re- duce the effective laser spot size to 1-2/zm; such systems are currently employed in laser microprobe mass analyzers (Heinen et al., 1983; Brenna and Creasy, 1988). Although these frequency shifters would significantly re- duce the power of the laser beam, the power density of the laser beam would be relatively unaffected. This is because the power density, or irradiance, at the sample surface is depen- dent not only on laser power, but on the cross- sectional surface area of the beam; it can be es- timated by the equation:
I=P/r tw 2 (2)
where I = irradiance; and P = total power of the delivered beam (Fallick et al., 1992 in this is- sue). Thus, a four-fold decrease in spot size (from w=4.5 #m to w= 1/tm) would theoret- ically compensate a 94% reduction in laser power.
The minimum spot size of a laser micro- probe system is an important parameter when high spatial resolution is desired. To utilize fully the small sample capabilities of contem- porary dynamic flow mass spectrometers (minimum sample sizes ~0.05 ~mol; see Wright and Pillinger, 1989) the oxygen from ~ 106 ~m 3 of quartz needs to be extracted (a 100-~m cube). The diameter of a pit on a sam- ple surface is always greater than the diameter of the laser beam that generated it because pit diameters are influenced not only by laser spot size, but by the time length of laser-beating, the amount of reagent used, and the absorbance and reactivity of the sample analyzed. There- fore, the laser microprobe system must have a focused spot size that is < 100 ~m (i.e. Nd:YAG, 9-~m spot size), to attain 100-#m spatial resolution. Nd:YAG generated pits smaller than 100 #m have been reported for sulfides (Crowe et al., 1990; Fallick et al., 1992 in this issue).
The superior spatial resolution of the
26 DON ELSENHEIMER AND J.W. VALLEY
Nd:YAG laser microprobe system may soon be complemented by the reduced sample-size re- quirements of a new generation of mass spec- trometers. While the ability to analyze samples as small as 0.05 gmol on dynamic mass spec- trometers has existed for some time (Mat- thews and Hayes, 1978; Wada et al., 1982; Halas and Krouse, 1983; Wright and Pillinger, 1989), recent advances in the use of static mass spectrometers (Carre t al., 1986) and inert carrier gases systems on dynamic mass spec- trometers (Douthitt, 1990) now permit anal- ysis of samples as small as 1 nmol (0.001 /~mol). To take full advantage of this new ca- pability, laser microprobe systems with spatial resolution in the 10-20-#m range will be required.
Another difference between our Nd:YAG system and the CO2 laser system of Sharp (1990) is in sample chamber design. Our sam- ple chamber is 3.5 cm high and has an inner diameter of 2.5 cm. The sample surface is 1.5 cm from the underside of the sapphire win- dow, minimizing the laser path-length through BrFs. This path-length, which optimizes the 40- mm focal length of the system's focusing ele- ment, is much shorter than the 12.5-cm laser path-length used by Sharp (1990). A possible advantage of the short laser path-length is that it minimizes the potential for interaction be- tween reagents such as BrFs and laser radia- tion. Sharp (1990) reports that his analyses generate F2 by laser-induced dissociation of BrFs, requiring an additional Hg diffusion pump to scrub excess F2 from 02 samples. This F2 is likely generated from BrF5 either by ab- sorbance of the CO2 laser radiation, or by the thermal dissociation of the reagent at the hot sample surface. A short path-length would minimize the amount of F2 generated if absor- bance is the dissociation mechanism. Deter- mining whether a Hg diffusion pump is neces- sary for high-precision Nd:YAG analyses on plagioclase was one of the goals of this study.
The short laser path-length of our Nd:YAG system places a relatively minor constraint on
the number of analyses that can be obtained on a sample or collection of sample powders. Al- teration products that are occasionally pro- duced during a laser-heated reaction can accu- mulate on the underside of the sapphire window, and this has in some instances lim- ited the number of analyses possible without venting the sample chamber (typically, to 15- 20). While a longer laser path-length would minimize this potential problem (Sharp, 1990), it does so at the expense of spatial res- olution; the necessary increase in the focal length of the lens results in a direct increase in beam spot size (see eq. 1 ). We consider any inconvenience caused by the accumulation of alteration products to be minor in comparison with the gain in spatial resolution that a smaller focal length provides.
Despite the advantages of the Nd:YAG laser microprobe system listed above, there are ad- vantages to the CO2 laser system that should also be considered. The most compelling rea- son to use CO2 laser radiation is the fact that it is more readily absorbed by optically clear minerals such as quartz. We obtained J~80 analyses on quartz with the Nd:YAG laser (presented below), but found it necessary to enhance absorption of the mineral grains by focusing on cracks, grain boundaries, or opaque inclusions. Use of frequency doublers or quad- ruplers, however, may enhance absorption of the Nd:YAG beam. CO2 lasers are also cheaper than Nd:YAG lasers.
4. Sample gas collection and analysis
4.1. Sample preparation
Samples are trimmed to either centimeter- thick rough-sawn slabs, or 250-800-#m thick wafers. The wafers are cut from thin-section plugs by a thin saw blade ( ~ 300/zm), and a standard thin section is prepared from the fac-
IN SITU O ISOTOPE ANALYSIS BY Nd:YAG LASER MICROPROBE 27
ing surface. Since this thin section is separated from the sample surface by the thickness of the thin blade, it displays nearly identical petro- graphic characteristics as the sample surface to be analyzed.
Before a sample is introduced into the sam- ple chamber, the chamber is cleared of any remnant reagent by pumping down to 10 -4 Torr. Removal of the sapphire window vents the sample chamber, and the previous sample and any alteration products are removed. Sample slabs are then placed directly on the sample chamber floor, while wafers are sup- ported along their edges by a vertical s.s. cylinder.
Before analys;o, samples must be pretreated to remove water and other material that might react with reagent at low temperature. 500-600 Torr of BrF5 is introduced at 20 ° C. The BrF5 reacts with any H20 in the sample or sample chamber. It also reacts to varying degrees with the sample. In a range of rock types, we have found reactions at 20°C to be a problem not only with clays and alteration minerals but with fresh, unaltered feldspars and carbonates as well. The ease with which feldspar reacts with BrF5 at relatively low temperatures has long been known; Clayton and Mayeda (1963) re- ported quantitative oxygen extraction from feldspar at 100°C using BrF5 and conven- tional extraction techniques.
It is necessary to ensure that all sample re- actions have ceased at 20°C before proceeding with laser microprobe analysis. The reaction of unaltered feldspar with BrFs at 20°C can last from a few hours to longer than a week. Typi- cally, fresh anorthosite samples require 8-24 hr of pretreatment; during this time, the steel- grey plagioclase megacrysts develop a powdery coating of fine-grained yellowish material. This coating, generated from only the outermost sample surface, acts as a barrier between re- agent and the underlying unaltered feldspar. During laser-heating, the gases produced within the reaction pit blow this coating away from
the adjacent sample surface and expose fresh, unreacted feldspar.
Quantitative determination of whether re- actions at 20°C have ceased, is made by mea- suring a "background" reading. During a background run, 100 Torr of BrF5 is put into the sample chamber at room temper/tture without laser-heating for 120 s; this is 2-4 × the length of time that the reagent is at 20°C during a typical analysis. The reagent is cry- ogenically removed, and the O2 is converted to CO2 and measured by capacitance manome- ter. Pretreatment is continued until a back- ground run yields < 1/zmol 02, which is < 5% of the amount of 02 generated during a typical analysis. This background level does not sig- nificantly affect the t~' 80 of subsequent plagio- clase analyses, because the t~lSO of this back- ground O2 is typically within 2%0 of the sample values. This is not surprising, since this plagio- clase sample comprises ~ 90% of the whole rock. Lower background levels may be neces- sary when the ~lSO.valu e of the background gas has a value that differs more radically from the ~ 8 0 of the mineral of interest.
4.2. Laser interaction with feldspar
After pretreatment, targeted areas are se- lected on the sample surface u~ing a co-focal He-Ne aiming laser. Opaque and translucent minerals absorb the Nd:YAG laser beam and react readily in 100-200 Torr of BrFs. Given the average quantity of extracted oxygen, this amount of reagent is ~ 500% in stoichiometric excess. No benefits were observed in using ad- ditional reagent, while the use of less reagent risks having an inadequate supply at the BrFs- sample interface. Analyses generated with lesser amounts of reagent display poorer pre- cision. Larger excesses of reagent might be nec- essary with larger sample chambers, to main- tain the same pressure of reagent.
Representative pits generated by in situ laser- heating of feldspar are shown in Figs. 2 and 3.
28 DON ELSENHEIMER AND J.W. VALLEY
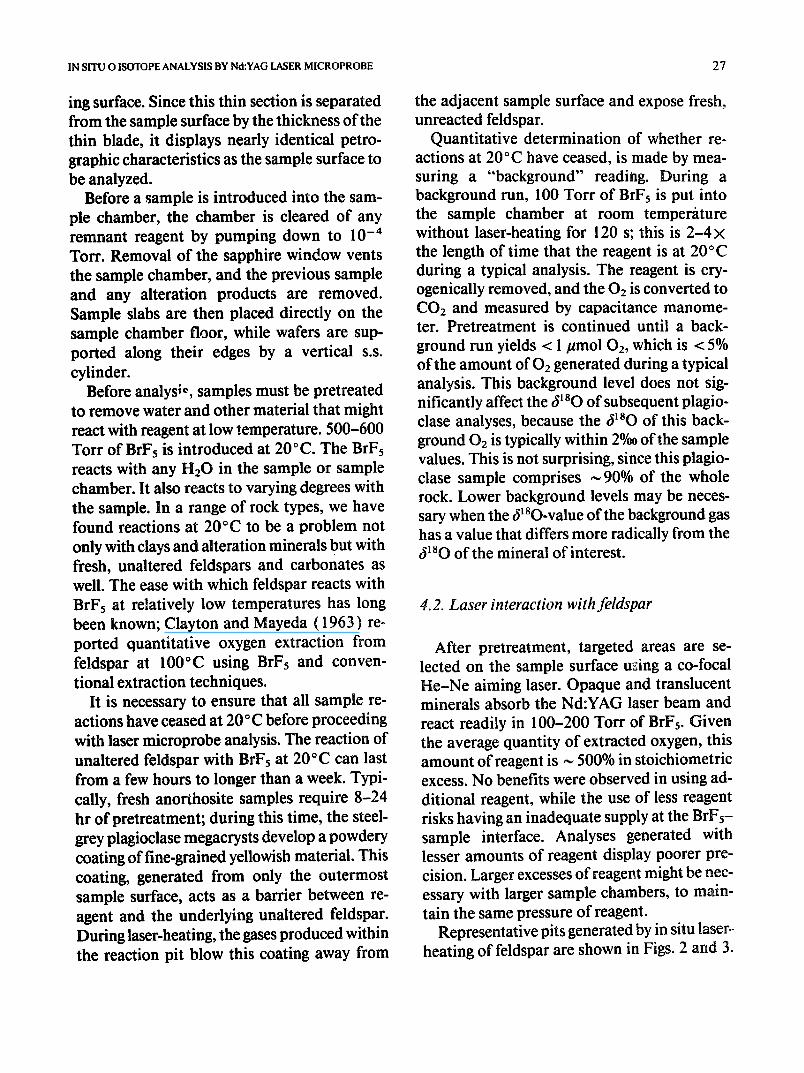
Fig. 2. Reflected light photomicrograph of laser-heated reaction pits in plagioclase (sample 83SR4, slab 3, see Table 1 ). Values are J~aOsMow, and compare well with a value of + 9.4%o obtained by conventional bulk extraction methods. The two pits without values (lower right) were generated under non-optimum conditions; the pit to the left incorporated an adjacent garnet grain, while the pit on the right was generated in the absence of BrFs. Each pit is ~ 500 #m in diameter, with a surface-halo of alteration material. Scale bar= 1 mm.
Reaction pits in centimeter-thick slabs are conical in shape, typically 400-1200 gm in di- ameter at the sample surface and 50-100 #m in diameter at the pit bottom. The pits gen- erated in wafered samples have similar diam- eters, but are more cylindrical in shape, with a near-symmetrical reaction cone formed on the underside of the targeted area. It should be noted that these 400-1200-/~m diameter pits are generated with a fixed 9-/~m diameter Nd:YAG laser beam; therefore, spatial resolu- tion depends on additional factors such as the time length of reaction or laser power. Pit di- ameters are also influenced by the sample ana- lyzed; under identical operating conditions, smaller-diameter pits are generated in refrac- tory minerals, such as garnet and magnetite.
Plagioclase reaction pits typically produce 5- 20/~mol CO2, with pit diameters and wafer thickness generally correlative to yields. For example, a 400-/~m-diameter pit within an 800-
/zm-thick wafer contains roughly 0.3 mg of feldspar, and yields ~ 5/~mol CO2. An 800-/zm- diameter pit within the same thickness of wafer has a theoretical yield of -,, 16/zmol CO2. Rep- licate analyses on the same wafer or slab typi- cally produce equal quantities of CO2.
When the laser beam first strikes the feld- spar sample surface, a bright flash is some- times produced; as the target zone is heated, an orange luminescent reaction zone spreads both laterally and downward through the sample. Targeted areas were initially heated for fixed periods of time, to see if sample yields were re- producible. However, we found that fixing the time of laser-heating does not result in repro- ducible yields of extracte~ oxygen. We attrib- ute this to the alteration products formed dur- ing a laser microprobe analysis, which accumulate and disperse the laser beam in a non-reproducible manner. To evaluate the re- lationship between the time of laser-heating
IN SITU O ISOTOPE ANALYSIS BY Nd:YAG LASER MICROPROBE 29
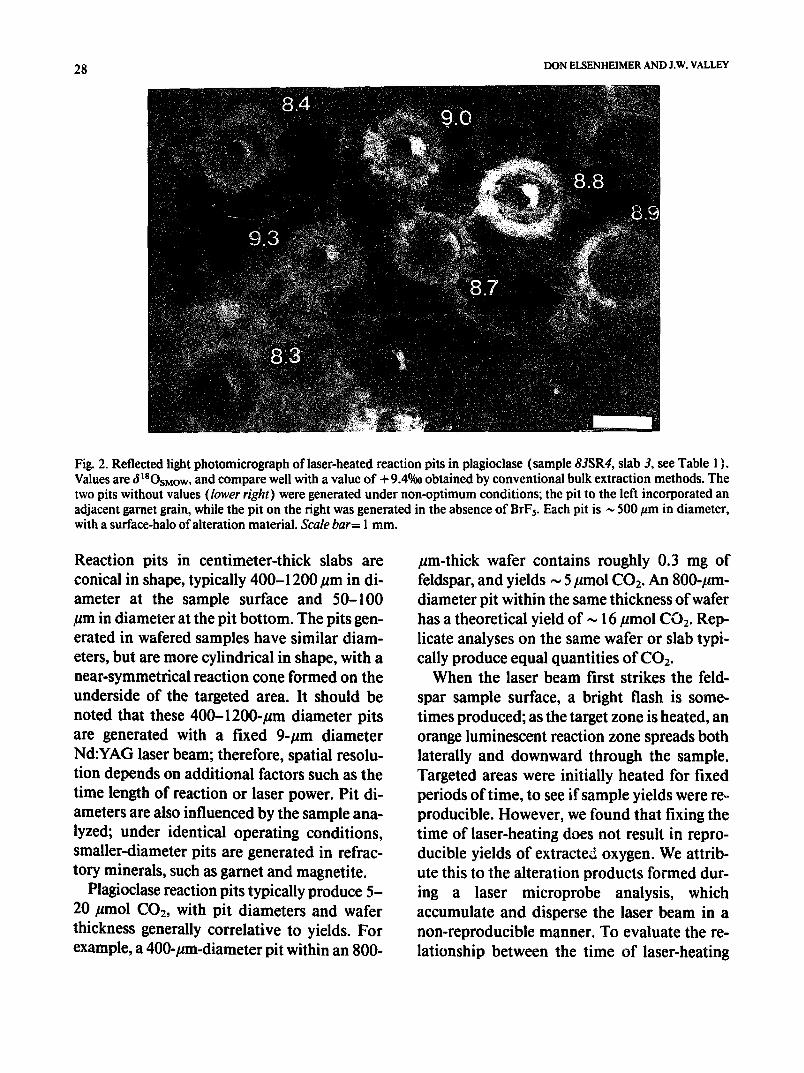
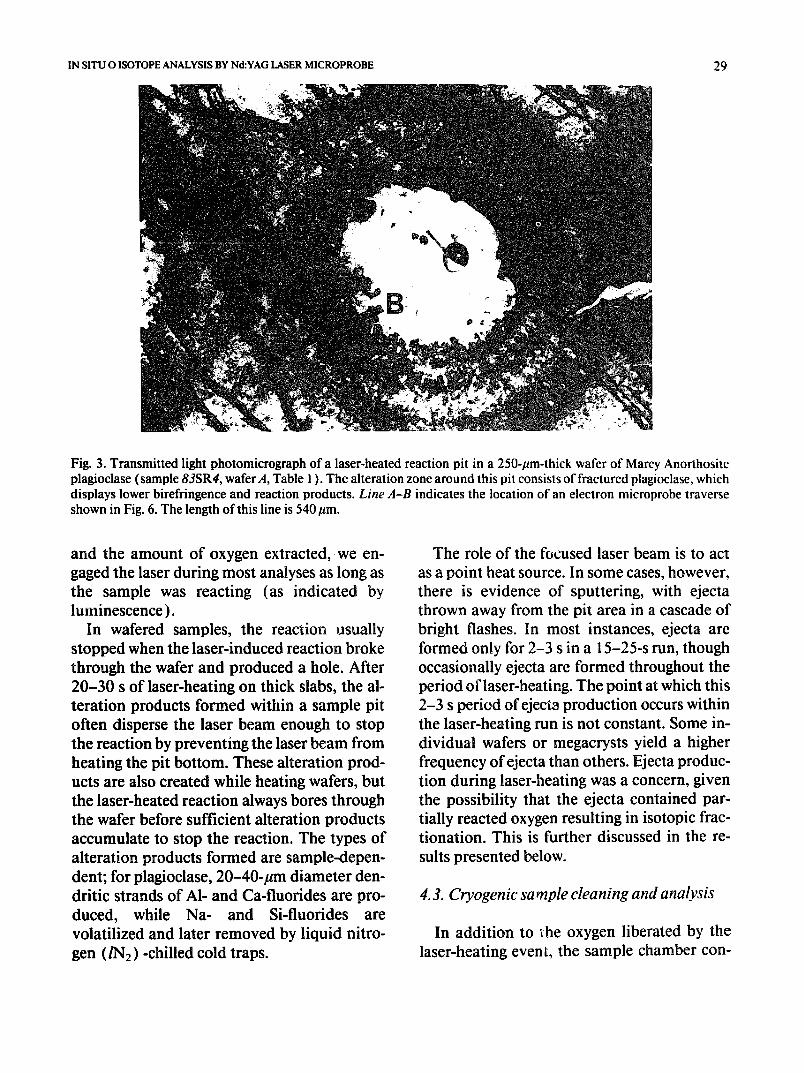
Fig. 3. Transmitted light photomicrograph of a laser-heated reaction pit in a 250-/zm-thick wafer of Marcy Anorthosite plagioclase (sample 83SR4, wafer A, Table l ). The alteration zone around this pit consists of fractured plagioclase, which displays lower birefringence and reaction products. Line A-B indicates the location of an electron microprobe traverse shown in Fig. 6. The length of this line is 540/zm.
and the amount of oxygen extracted, we en- gaged the laser during most analyses as long as the sample was reacting (as indicated by luminescence).
In wafered samples, the reaction usually stopped when the laser-induced reaction broke through the wafer and produced a hole. After 20-30 s of laser-heating on thick slabs, the al- teration products formed within a sample pit often disperse the laser beam enough to stop the reaction by preventing the laser beam from heating the pit bottom. These alteration prod- ucts are also created while heating wafers, but the laser-heated reaction always bores through the wafer before sufficient alteration products accumulate to stop the reaction. The types of alteration products formed are sample-depen- dent; for plagioclase, 20-40-#m diameter den- dritic strands of AI- and Ca-fluorides are pro- duced, while Na- and Si-fluorides are volatilized and later removed by liquid nitro- gen (/N2) -chilled cold traps.
The role of the focused laser beam is to act as a point heat source. In some cases, however, there is evidence of sputtering, with ejecta thrown away from the pit area in a cascade of bright flashes. In most instances, ejecta are formed only for 2-3 s in a 15-25-s run, though occasionally ejecta are formed throughout the period of laser-heating. The point at which this 2-3 s peried of ejecta production occurs within the laser-heating run is not constant. Some in- dividual wafers or megacrysts yield a higher frequency ofejecta than others. Ejecta produc- tion during laser-heating was a concern, given the possibility that the ejecta contained par- tially reacted oxygen resulting in isotopic frac- tionation. This is further discussed in the re- suits presented below.
4. 3. Cryogenic sample cleaning and analysis
In addition to vhe oxygen liberated by the laser-heating event, the sample chamber con-
30 DON ELSENHEIMER AND J.W, VALLEY
tains excess BrFs and other condensible gases such as BrF3 and Br2. We follow a miniaturi- zation of the method of Clayton and Mayeda (1963) for cryogenically cleaning the sample 02 and converting it to CO2 for mass spec- trometer analysis by reaction with graphite at 800°C (Fig. 1 ). Condensible gases are cry- ogenically removed with a/N2-chilled cold-fin- ger. The sample oxygen and any other non- condensibles are passed though an additional /N2-chilled metal trap into the glass portion of the silicate line, where a hot carbon rod re- duces the 02 to CO2o This CO2 is frozen into a /N2-chilled Pyrex ® trap as it is produced. Con- version is completed when the original vac- uum is restored. Occasional non-condensibles are observed (generally <0.1% of total gas) and these are pumped away. The sample gas is then transferred to a volumetrically calibrated portion of the line, and the yield measured by a Baratron ® capacitance manometer. The sample gas is then transferred directly into the mass-spectrometer inlet system, using a small volume inlet (0.15 ml) if necessary.
5. Results
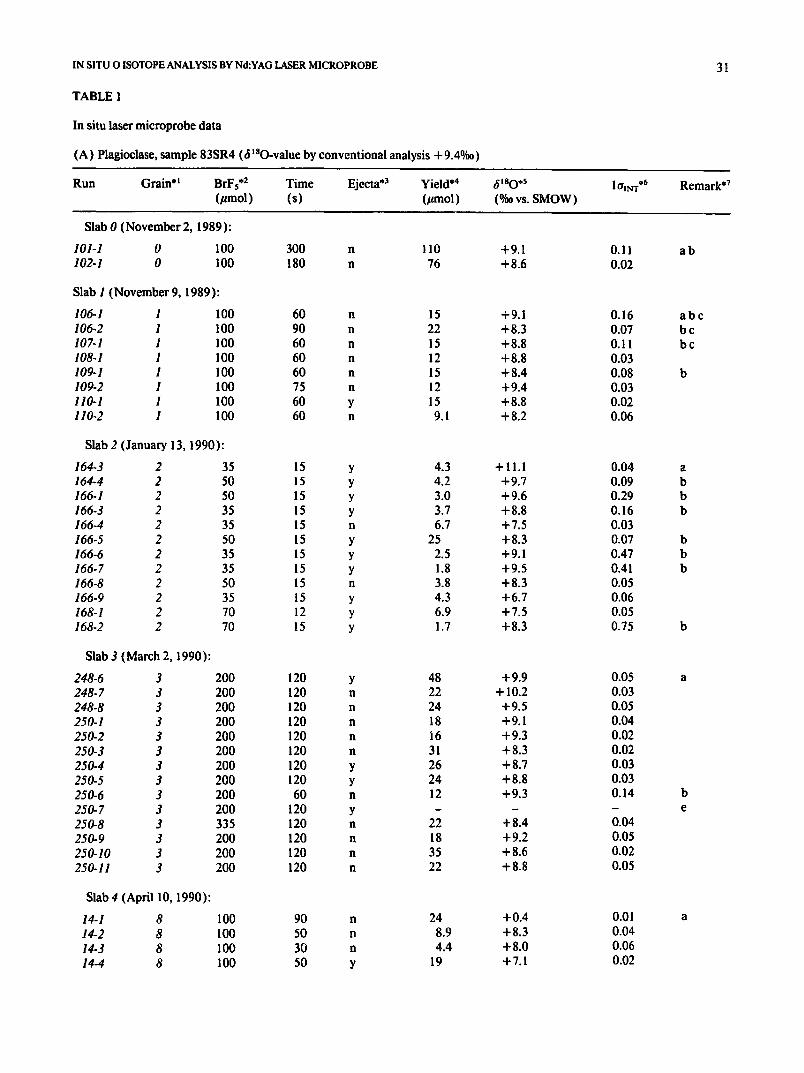
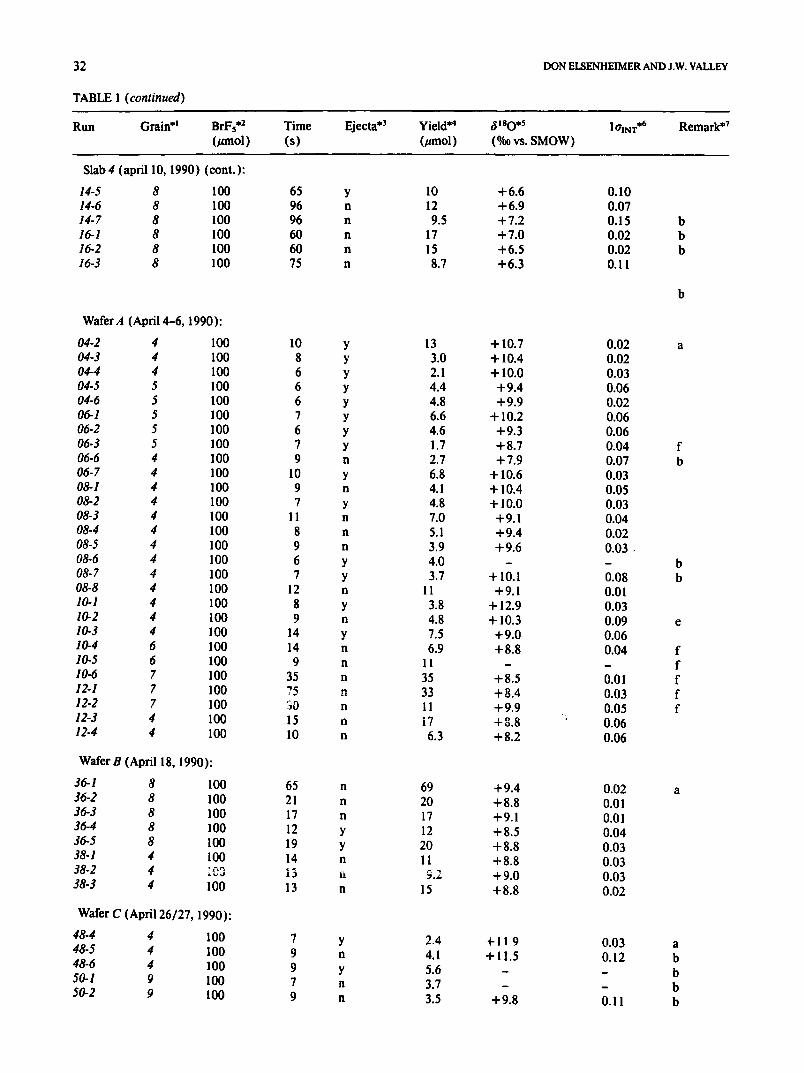
To evaluate the suitability of the laser mi- croprobe system for in situ measurements of feldspar, 117 spots were analyzed on a Marcy Anorthosite sample (83SR4) over a 9-month period. The analyses were made on five slabs (numbered 0-4) each ~ l-cm thick, and six 250-800-#m thick wafers (numbered A-F). Ten individual megacrysts (numbered grains 1-I0) within these slabs and wafers were ana- lyzed. Some individual megacrysts within sample 83SR4 were large enough to be in- cluded within multiple slabs or wafers. A re- cord of which grain was targeted, which pa- rameters were chosen, and what results were obtained for each analysis, is given in Table 1.
It must be emphasized that Table I is a com- plete data set, obtained during both the initial period of technique development, and the later period of replicate analyses under fixed con-
ditions. Every attempt to obtain a laser micro- probe analysis on this sample of plagioclase is included, excepting four that were compro- mised by operator error. We present these data to convey a realistic view of the capabilities of this new procedure, and to document our con- clusions about the effects that each parameter has on the accuracy and precision of the in situ laser microprobe technique. To report a smaller number of our "best" results would give the impression of much better precision and spa- tial resolution, but would not, in our opinion, be useful to others interested in this technique.
Of the 117 analyses of Marcy plagioclase presented in Table 1, 52 CO2 samples display evidence of contamination. We employ two acceptance criteria to determine whether an analysis should be included within an opti- mized dataset: (1) there should be no ob- served laser-heating of either a non-targeted phase or stainless steel; and (2) the I a internal precision of the mass spectrometer analysis should be better than + 0.06°/00. Initial anal- yses on each slab or wafer were considered compromised, most likely due to additional sample surface reactions. It should be noted that these criteria were created and applied early in the development of this technique; therefore, we were able to apply them to each analysis as it was generated, independently and before the J~SO-value was obtained.
65 of the 117 slab and wafer analyses met the acceptance criteria; the distribution of these analyses by individual slab or wafer is pre- sented in Fig. 4. While the J~ SO-value obtained by conventional extraction methods is + 9.4%0, the average j~sO of the 25 slab analyses is +8.4_+0.9%0 ( l a ) . These data are bimodal, with analyses from two of the four slabs being much more accurate and precise than analyses from the other two slabs. The slab analyses are more prone to contamination by mineral phases hidden beneath the sample surface~ and require longer periods of pretreatment. It was because of these factors that we changed our protocol to analyze wafers.
IN SITU O ISOTOPE ANALYSIS BY Nd:YAG LASER MICROPROBE 31
TABLE 1
In situ laser microprobe data
(A) Plagioclase, sample 83SR4 (d ~aO-value by conventional analysis + 9.4%o)
Run Grain *l BrFs .2 Time Ejecta .3 Yield .4 d~aO*S la~m .6 Remark*~ (#tool) (s) (/~mol) (%o vs. SMOW)
Slab 0 (November 2, 1989):
101-1 0 100 300 n 110 +9.1 0.11 102-1 0 100 180 n 76 + 8.6 0.02
a b
Slab I (November 9, 1989):
106.1 1 100 60 n 15 +9.1 0.16 106-2 1 100 90 n 22 +8.3 0.07 107-1 1 100 60 n 15 +8.8 0.11 108-1 1 100 60 n 12 + 8.8 0.03 109-1 1 100 60 n 15 + 8.4 0.08 109.2 1 100 75 n 12 + 9.4 0.03 110-1 1 100 60 y 15 + 8.8 0.02 110-2 1 100 60 n 9.1 + 8.2 0.06
a b c b c b c
Slab 2 (January 13, 1990):
164-3 2 35 15 y 4.3 + 11.1 0.04 164.4 2 50 15 y 4.2 + 9.7 0.09 166.1 2 50 15 y 3.0 + 9.6 0.29 166-3 2 35 15 y 3.7 +8.8 0.16 166-4 2 35 15 n 6.7 + 7.5 0.03 166-5 2 50 15 y 25 +8.3 0.07 166-6 2 35 15 y 2.5 + 9. ! 0.47 166.7 2 35 15 y 1.8 +9.5 0.41 166-8 2 50 15 n 3.8 + 8.3 0.05 166-9 2 35 15 y 4.3 + 6.7 0.06 168-1 2 70 12 y 6.9 + 7.5 0.05 168.2 2 70 15 y 1.7 +8.3 0.75
Slab 3 (March 2, 1990):
248-6 3 200 120 y 48 +9.9 0.05 248- 7 3 200 120 n 22 + 10.2 0.03 248-8 3 200 120 n 24 + 9.5 0.05 250-1 3 200 120 n 18 + 9.1 0.04 250-2 3 200 120 n i 6 + 9.3 0.02 250-3 3 200 120 n 31 + 8.3 0.02 250-4 3 200 120 y 26 + 8.7 0.03 250-5 3 200 120 y 24 + 8.8 0.03 250-6 3 200 60 n 12 +9.3 0.14 250-7 3 200 120 y - - - 250-8 3 335 120 n 22 + 8.4 0.04 250-9 3 200 ! 20 n 18 + 9.2 0.05 250-10 3 200 120 n 35 + 8.6 0.02 250-11 3 200 120 n 22 + 8.8 0.05
a
b e
Slab 4 (April 10, 1990):
14-1 8 100 90 n 24 +0.4 0.01 14-2 8 100 50 n 8.9 +8.3 0.04 14-3 8 100 30 n 4.4 + 8.0 0.06 14-4 8 100 50 y 19 + 7.1 0.02
a
32
TABLE 1 (continued)
DON ELSENHEIMER AND J.W. VALLEY
Run Grain*S BrFs.2 Time Ejecta .3 Yield .4 ~ 180.5 IO'INT .6 Remark .7 (gmol) (s) (/~mol) (%0 vs. SMOW)
Slab4 (april 10, 1990) (cont.):
14-5 8 100 65 y 10 +6.6 0.10 14-6 8 100 96 n 12 + 6.9 0.07 14-7 8 100 96 n 9.5 +7.2 0.15 16-1 8 100 60 n 17 +7 .0 0.02 16-2 8 100 60 n 15 + 6.5 0.02 16.3 8 100 75 n 8.7 +6.3 0.11
Wafer d (April 4-6, 1990):
b b b
Wafer C (April 26/27, 1990):
48.4 4 100 7 y 2.4 ~- I 1 9 0.03 48-5 4 100 9 n 4.1 + l 1.5 0.12 48-6 4 100 9 y 5.6 - _ 50-1 9 100 7 n 3.7 - _ 50-2 9 100 9 n 3.5 +9.8 0.11
Wafer B (April 18, 1990):
36-1 8 100 65 n 69 + 9.4 0.02 36-2 8 100 21 n 20 +8.8 0.01 36-3 8 100 17 n 17 +9.1 0.01 36.4 8 100 12 y 12 + 8.5 0.04 36-5 8 100 19 y 20 + 8.8 0.03 38-1 4 100 14 n 11 + 8.8 0.03 38-2 4 ~ C3 13 l~ 9.2 + 9.0 0.03 38-3 4 100 13 n 15 + 8.8 0.02
04-2 4 100 10 y 13 + 10.7 0.02 a 04-3 4 100 8 y 3.0 + 10.4 0.02 04-4 4 100 6 y 2.1 + 10.0 0.03 04-5 5 100 6 y 4.4 + 9.4 0.06 04-6 5 100 6 y 4.8 + 9.9 0.02 06-1 5 100 7 y 6.6 + 10.2 0.06 06-2 5 100 6 y 4.6 + 9.3 0.06 06.3 5 100 7 y 1.7 + 8.7 0.04 f 06.6 4 100 9 n 2.7 + 7.9 0.07 b 06-7 4 100 10 y 6.8 + 10.6 0.03 08-1 4 100 9 n 4.1 + 10.4 0.05 08-2 4 100 7 y 4.8 + 10.0 0.03 08-3 4 100 I 1 n 7.0 + 9. l 0.04 08-4 4 100 8 n 5.1 + 9.4 0.02 08-5 4 100 9 n 3.9 + 9.6 0 .03 , 08-6 4 100 6 y 4.0 - - b 08-7 4 100 7 y 3.7 + 10.1 0.08 b 08-8 4 100 12 n ! 1 +9.1 0.01 10-1 4 100 8 y 3.8 + 12.9 0.03 10-2 4 100 9 n 4.8 + 10.3 0.09 e 10-3 4 100 14 y 7.5 + 9.0 0.06 10-4 6 100 14 n 6.9 + 8.8 0.04 f 10-5 6 100 9 n 11 - - f 10-6 7 100 35 n 35 + 8.5 0.01 f 12-1 7 100 ?5 n 33 + 8.4 0.03 f 12-2 7 100 30 n 11 +9.9 0.05 f 12-3 4 100 15 n I7 +8.8 ~ 0.06 12-4 4 100 10 n 6.3 +8.2 0.06
IN SITU O ISOTOPE ANALYSIS BY Nd:YAG LASER MICROPROBE 3 3
TABLE 1 (continued)
Run Grain *t BrFs .2 Time Ejecta .3 Yield .4 dasO*S IOU~T*6 (/tmol) (S) (/tmol) ( % vs. SMOW)
Wafer C (April 26/27, 1990) (cont.):
50-3 9 100 44 n 24 + 9.1 0.02 50-4 9 100 24 n 11 + 9.1 0.02 50-5 9 100 24 n 18 + 9. ! 0.01 50-6 9 100 20 y 24 + 8.4 0.02 50-7 9 100 18 n 14 +9.8 0.02 50-8 9 100 24 y 18 +8.6 0.04
Wafer D (June 25, 1990):
86-1 9 100 25 n 7. l + 7.2 0.06 86-2 9 100 23 n 4.5 + 9. l 0.06 86-3 9 100 53 y 28 + 7.8 0.02 86-4 9 100 75 y 17 + 7.8 0.05 86-5 9 100 25 n 5. l + 10.2 0.07 86-6 9 100 25 n 5.4 + 14.3 0.08 86-7 9 100 34 n 5.3 + 10.9 0.09
Wafer E (June 26, 1990):
88-1 10 100 27 n 12 +6.5 0.03 88-2 10 100 9 y 3.0 - - 88-4 I0 100 31 n 35 +~.1 0.06 88-5 10 100 41 n 28 + 8.5 0.03 88-6 10 100 30 n 16 + 8.8 0.02 88- 7 10 100 22 n 8.4 + 8.6 0.06 90-1 10 100 32 n 21 + 7.7 0.05 90-2 10 100 19 n 8.9 +8.9 0.17 90-3 10 100 38 n 18 + 8. ! 0.05
Wafer F (July 13, 1990):
96-1 9 100 22 n 21 + 12.0 0.05 96-2 9 100 26 n 20 +9.7 0.03 96-3 9 100 28 n 36 +9.6 0.03 96-4 9 100 180 n 68 + 10.4 0.02 96-5 9 100 50 n 24 +9.6 0.02 98-1 9 100 30 n 27 + 8.8 0.01 98-2 9 100 44 n 44 + 9.2 0.02 98-3 9 100 29 n 21 + 8.6 0.03
Remark .7
(B) Siljan granite, sample GRI 1-15
Run *s BrFs .2 Time Ejecta .3 Yield .4 ~ 80*s 1 ~qrcr .6 Remark .7 (s) (/tmol) (%0 vs. SMOW)
Potassium feldspar (6 'SO-value by conventional analysis = + 9.2%o):
254-4 200 45 n 17 + 9.9 0.05 254-5 200 45 n 12 + 8.9 0.02 254-6 200 45 y I0 + 8.3 0.02 254.7 200 '~5 n 18 +8.8 0.06 256-1 200 45 n 15 +9.2 0.08 256-2 200 45 n 20 + 8.2 0.03 256-3 200 45 y 28 + 7.6 0.02 266.3 200 45 n I l + l 1.1 0.12 266-4 200 45 n 14 + 10.5 0.15 268-1 200 45 n 24 + 8.5 0.05
b
b b
34
TABLE 1 (continued)
DON ELSENHEIMER AND J.W. VALLEY
Run *s BrF5 .2 Time Ejecta .3 Yield .4 a sO*S 1 ~Tlwr .6 Remark *~ (s) (/~mol) (%0 vs. SMOW)
Potassium feldspar (~tSO-value by conventional analysis= +9.2%0) (col:t.):
272-3 65 60 n 13 + 20.1 0.15 a b 272-4 65 60 n 17 + 14.9 0.07 b 272-5 100 60 n 37 + 12.3 0.03
I n 272-6 65 35 n lo +9.2 0.05 272- 7 200 30 y 20 + 8.7 0.08 b 272-8 200 30 y 17 +8.1 0.11 b 272-9 200 30 y 23 + 8.2 O. 18 b 272-10 200 30 y 15 +7.3 0.08 b 274-1 200 60 n 64 + 14.6 0.09 b 274-2 200 45 n 26 + 11.0 0.01 274-3 200 45 n 25 + 11.1 0.04 274-4 200 45 n 18 + 10.7 0.06 274-5 200 90 y 32 - - e 274-6 200 45 n 24 + 9.6 0.03 274. 7 200 45 n 26 + 9.4 0.04 274-8 200 60 n 41 + 8.7 0.05 274-9 200 45 y 24 + 10.7 0.13 b 274-10 200 45 y 11 + 9.9 0.06 274-11 200 45 y 22 + 11.8 0.58 b 102-1 100 60 n 55 + 18.1 0.02 a 102-2 100 60 n 53 + 11.3 0.02 102-3 100 60 n 54 + 10.7 0.02 102-4 100 60 y 49 + 9.0 0.03 102-5 100 60 n 47 + 10.5 0.02 102-6 100 60 y 53 + 8.8 0.04 102- 7 100 60 n 54 + 9.0 0.05 102-8 100 60 n 42 + 8.4 0.03 104-1 100 60 n 51 + 8.8 0.06 104-2 ! 00 60 n 54 + 8.4 0.01
Plagioclase feldspar (6 tSO.valu e by conventional analysis = + 9.2%o):
256.6 200 60 y 28 + 6.3 0.02 256-8 200 60 y 27 + 5.9 0.02 256-9 200 60 y 23 +6.7 0.04 256-10 200 60 y 22 + 7.69 0.04 256-11 200 60 y 27 + 6.9 0.04 256-12 200 60 n 17 + 6.7 0.03 266-1 200 60 n 17 + 12.2 0.09 266-2 200 60 y 8.6 + 8.6 0.27 272-7 200 60 y 20 +8.7 0.08 272-8 200 60 y 17 + 8.1 0.1 l 272-9 200 60 y 23 +8.2 0.18 272-10 200 60 y 15 + 7.2 0.08
Quartz (6 'SO-value by cor~ventional analysis = + 8.6e0):
254-3 200 300 n 142 + 7.5 0.02 256-5 200 360 n 98 + 8,0 0.02 256-13 200 150 n 150 + 7.4 0.03 258-1 200 113 n 40 + 9,1 0.02 258-2 200 75 n 21 + 8.5 0.04 258-3 200 63 y 31 + 8,1 0.02 268-2 200 113 n 113 + 8,8 0.02 268-3 200 30 n 30 + 10,2 0.05 268-4 200 120 n 120 + 7.5 0.01 268-5 200 45 n 45 + 7,5 0.10
a b b b b b b
a
b
IN SITU O ISOTOPE ANALYSIS BY Nd:YAG LASER MICROPROBE 35
TABLE 1 (continued)
Run *s BrFs .2 Time Ejecta *a Yield .4 ~sO*S I~XNT .6 (S) (/~mol) (%00 vs. SMOW)
Remark .7
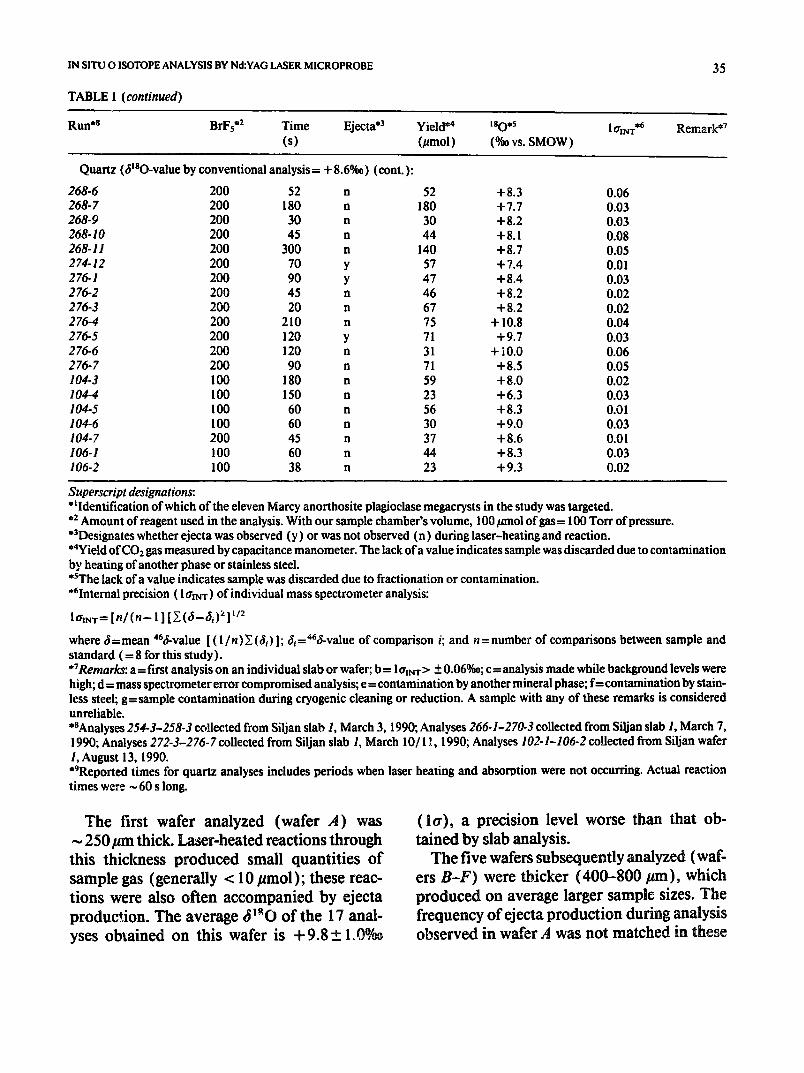
Quartz (J~SO-value by conventional analysis= + 8.6°A~) (cont.):
268-6 200 52 n 52 + 8.3 0.06 268- 7 200 180 n 180 + 7.7 0.03 268-9 200 30 n 30 + 8.2 0.03 268-10 200 45 n 44 + 8.1 0.08 268-11 200 300 n 140 +8.7 0.05 274-12 200 70 y 57 +7.4 0.01 276-1 200 90 y 47 + 8.4 0.03 276-2 200 45 n 46 + 8.2 0.02 276-3 200 20 n 67 + 8.2 0.02 276-4 200 210 n 75 + !0.8 0.04 276-5 200 120 y 71 +9.7 0.03 276-6 200 120 n 31 + lO.O 0.06 276-7 200 90 n 71 +8.5 0.05 104-3 1 O0 180 n 59 + 8.0 0.02 104-4 100 150 n 23 +6.3 0.03 104-5 100 60 n 56 +8.3 0.01 104-6 100 60 n 30 +9.0 0.03 104-7 200 45 n 37 +8.6 0.01 106-1 100 60 n 44 +8.3 0.03 106-2 100 38 n 23 +9.3 0.02
Superscript designations: *~Identification of which of the eleven Marcy anorthosite plagioclase megacrysts in the study was targeted. .2 Amount of reagent used in the analysis. With our sample chamber's volume, 100/zmol of gas= 100 Ton" of pressure. *~Designates whether ejecta was observed (y) or was not observed (n) during laser-heating and reaction. *4Yield of CO2 gas measured by capacitance manometer. The lack of a value indicates sample was discarded due to contamination by heating of another phase or stainless steel. *SThe lack of a value indicates sample was discarded due to fractionation or contamination. *6Internal precision ( 1 treNT) o f individual mass spectrometer analysis:
1 fliNt---- [n / (n - - 1 ] [ Y. (¢~--6i) :~ ] i/2
where d = mean 46J-value [ ( ! / n) Y_ (J,) ]; J, = 4~J-value of comparison i; and n = number of comparisons between sample and standard ( = 8 for this study). *TRemarks: a=first analysis on an individual slab or wafer; b = hr~m> +_0.06%0; c = analysis made while background levels were high; d = mass spectrometer error compromised analysis; e = contamination by another mineral phase; f = contamination by stain- less steel; g=sample contamination during cryogenic cleaning or reduction. A sample with any of these remarks is considered unreliable. *SAnalyses 254-3-258-3 collected from Siljan slab 1, March 3, 1990; Analyses 266.1-270-3 collected from Siljan slab 1, March 7, 1990; Analyses 272-3-2 76- 7 collected from Siljan slab L March 10/11, 1990; Analyses 102-1-106-2 collected from Siljan wafer 1, August 13, 1990. *9Reported times for quartz analyses includes periods when laser heating and absorvtion were not occurring. Actual reaction times were ~ 60 s long.
The first wafer analyzed (wafer A) was ~ 250/~m thick. Laser-heated reactions through this thickness produced small quantities of sample gas (generally < 10/tmol); these reac- tions were also often accompanied by ejecta production. The average JL~O of the 17 anal- yses obtained on this wafer is +9.8+_lo0q/~o
(l~r), a precision level worse than that ob- tained by slab analysis.
The five wafers subsequently analyzed (waf- ers B-F) were thicker (400-800 9m), which produced on average larger sample sizes. The frequency of ejecta production during analysis observed in wafer A was not matched in these
36
12.0 -
1e 10,0
~ 0 8 . ° "
6.0 0.0
Slab O, 1 Nevamberg, 1989 I 8 . 7 + 0 . 4 o f 5
20.0 40.0 60.0 sample size (pmol)
Slab 2, Janl 12.0 L
le 10.0
~ 0 6 . o " x X " X
6.0 0.0
t 13, 1990 7 . 5 + 0 . 7 n=4
20.0 40.0 60.0 sample size (pmol)
80.0
12.0 -
18 10.0
606. °
6.0 0.0
12.0 -
ls 10.0
606. 0
6.0
80.0 0.0
DON ELSENHEIMER AND J.W. VALLEY
Wafer B, April 18, 1990 8 . 8 + 0 . 1 9 n=7
20.0 40.0 60.0 sample size (pmel)
80.0
Wafer C, April26, 1990 8 . 9 + 0 . 2 8 n : 3
X > X
20.0 40.0 60.0 sample size (l~mol)
80.0
12.0 -
le 10.0
608 .0
6.0
0.0
S~b3
~xX
1990 12.0 - 9 .0+0 .5 , n=11
m 10.0 6 0 8 . 0 x
6.0
80.0 0.0 20.0 40.0 60.0 sample size (l~mel)
Wafer D, June 25, 1990 I 9.1 n=l
20.0 40.0 60.0 sample size (p.mol)
80.0
Slab 4, April 10, 1990 12.0 - 7 . 2 + 0 . 6 n=4 12.0 -
ls 10.0 18 10.0
8 0 6 . 0 " × 608 .o
6.0 XW 6.0
Wafer E, June 26, 1990 8 . 5 + 0 . 2 9 nffi4
x ~ x
0.0 20.0 40.0 60.0 60.0 0.0 20.0 40.0 60.0 80.0 sample size (pmel) sample size (pmol)
14.0 - : X
le 12.0 -."
6 0 1 0 0 - "~ (X
e.o.- Y x
Wafer A, April4, 1990 Wafer F, Jui 13, 1990 9 . 8 + 1 . 0 n=17 9 . 4 + 0 . 6 n=7
X ) ;X X X
<X
12.0 -~
le 10.0 -~
808o-
6.0 -"
0.0 0.0 20.0 40.0 60.0 80.0 20.0 40.0 60.0 80.0 sample size (I-mel) sample size (pmel)
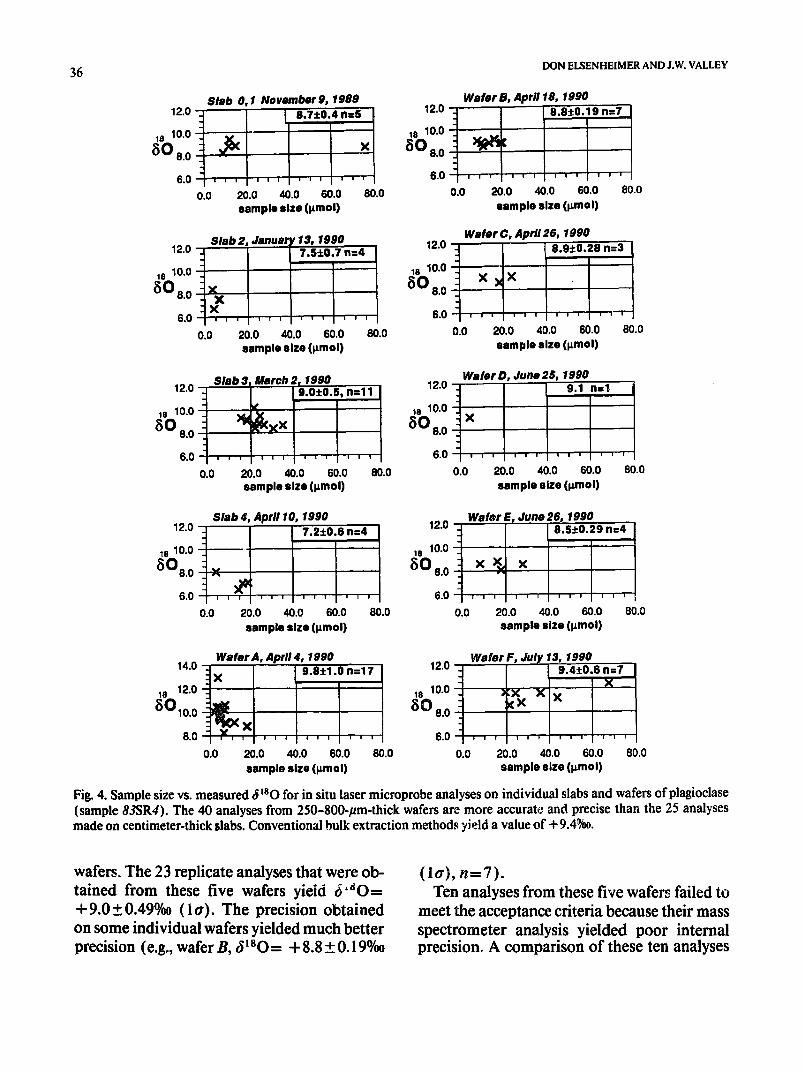
Fig. 4. Sample size vs. measured J~sO for in situ laser microprobe analyses on individual slabs and wafers of plagioclase (sample 83SR4). The 40 analyses from 250-800-pm-thick wafers are more accurate and precise than the 25 analyses made on centimeter-thick slabs. Conventional bulk extraction methods yield a value of + 9.4%0.
wafers. The 23 replicate analyses that were ob- tained from these five wafers yield J'sO= + 9.0_+ 0.49%0 ( 1 e). The precision obtained on some individual wafers yielded much better precision (e.g., wafer B, JtsO= +8.8 +_0.19%o
( la) , n=7) . Ten analyses from these five wafers failed to
meet the acceptance criteria because their mass spectrometer analysis yielded poor internal precision. A comparison of these ten analyses
IN SITU O ISOTOPE ANALYSIS BY Nd:YAG LASER MICROPROBE 37
with the twenty-three that did meet the criteria indicates that the failed analyses were gener- ated by shorter average times of laser-heating ( 15 s of laser-heating vs. 27 s), and produced smaller average quantities of sample gas (5 vs. 22 /tmol). A difference in the frequency of ejecta production was not apparent; while 3 of the 10 failed analyses produced ejecta, 3 of the 23 accepted analyses did the same.
The data in Fig. 4 highlight specific differ- ences in the quality of slab and wafer analyses. The four analyses of grain 8 obtained from wafer B (j~sO==8.8__0.24°/oo) are much more optimal than the four analyses of grain 8 from slab 4 (J ~ s O = + 7.2 +_ 0.6°/0o). Only anal- yses from slab 3 have accuracy and precision levels that are comparable to wafer analyses. Slab 3 was gold-coated to reduce surface reac- tion, and it may be that this coating prevented the generation of fractionated or contami- nated oxygen from outside the target area. A disadvantage to gold-coating is that it reduces the visibility of the targeted area. This test will be repeated in the future.
6. Discussion
6.1. Precision and accuracy of in situ plagioclase analyses
Fig. 4 shows that the precision of the seven analyses obtained on wafer B (obtained on April 18, 1990) is + 0.19%o ( 1 tr). This preci- sion level is nearly as good as the precision of bulk powder analysis by conventional tech- niques. However, we cannot identify specific factors that may have caused better than nor- mal results on that day, and we cannot prove that this result is not fortuitous. Sixteen repli- cate analyses obtained on successive days did not match this precision level. Therefore, we consider the _+ 0.49°/00 (ltr) precision level (23 optimized analyses, wafers B-F) to be the best estimate of the precision of the in situ tech- nique for this plagioelase sample at this time.
It is not certain whether the high precision obtained from wafer B represents an especially homogeneous domain within the sample or differences in operating conditions. If the pla- gioclase we have studied is isotopically heter- ogeneous, then the reported _+ 10.5°/oo preci- sion will improve once a more homogeneous sample is examined. Given the observed vari- ations in day-to-day precision levels, we sug- gest caution in interpreting the accuracy and precision for in situ analyses of other minerals or other laser microprobe systems unless a complete dataset is shown obtained on multi- ple samples and on multiple days.
It is not known what precision will be ob- tained on plagioclase using a CO2 laser, since J~SO-values from in situ or powdered plagio- clase samples obtained by a COs laser micro- probe have not yet been reported. It is possible that, although in situ laser microprobe anal- yses of other minerals yield high-precision, mineral chemistry may limit the precision of in situ plagioclase analyses to _+ 0.5000. We are constructing a dual-laser microprobe system that can selectively utilize either type of laser radiation, so that this hypothesis may be tested in the future.
The average J~SO-value obtained by laser microprobe on this plagioclase sample is ac- curate within the measured precision level: + 9 . 0 + 0 . 5 ~ ( l a ) by laser, compared to + 9.4__. 0.20o0 ( I a) by conventional analysis. Therefore, we propose that no correction fac- tor is justified for the in situ plagioclase anal- yses that we nave described. We also believe that the current level of precision provides ex- citing new possibilities for evaluating isotopic heterogeneity in plagioclase.
6.2. Contamination of sample gases
The _+ 0.5%0 precision level that we report is based on analyses that had mass spectrometer analyses with good internal precision; those analyses that failed to attain this precision were excluded. Poor internal precision may result
38 DON ELSENHEIMER AND J.W. VALLEY
from contamination of the sample CO2 gas by other gases. It is possible that 1:2 is generated from BrF5 during laser microprobe analysis either by BrF5 absorbance of laser radiation, or by the thermal dissociation of the reagent at the hot sample surface (Z.D. Sharp, pers. com- mun., 1991 ). A potentially similar situation exists for all conventional BrFs analyses of 6~80. At high temperatures of reaction, some reagent dissociates and there is a possibility that some F2 will remain unreacted upon cool- ing. Unlike conventional silicate extraction lines that employ F2 as the reagent, BrF5 lines do not normally have any facility to remove re- sidual F2. The success of the BrF5 technique, since the pioneering work of Clayton and May- eda (1963), shows that this normally is not a problem, although we found residual F2 to be intermittently problematic when using CIF3 from 1984 to 1985 (see also Borthwick and Harmon, 1982; Vennemann and Smith, 1990).
An important difference between conven- tional and laser microprobe BrF5 lines is sam- ple size. Conventional sample sizes are 10-20 mg yielding 200-300/~mol of CO2 gas, while the majority of our samples are 5-20/~mol of CO2 (Fig. 4). Thus, small amounts of contam- inant may have a proportionally larger effect on the analyses reported here.
The production of F2 during laser micro- probe analysis has been reported by Sharp (1990) with a CO2 laser, and he removes it by reaction with hot mercury. The Nd:YAG laser microprobe system used in this study does not have such an fluorine getter, so that any F2 re- maining after an analysis would react with the hot carbon rod in the converter to form con- taminant gases, including COF-, CF3- and CF4 (m/e= 47, 69 ~nd 88, respectively), or with the converter's hot Pyrex ® glass to form SiF3 + (m/effi 85). Our mass spectrometer does not routinely measure these masses. During separate sample gas mass scans, however, we did find traces of contaminant gases at m/ e=69 and re~e= 85. Typical peak iieights on these sample gas mass scans were < 0.25% of
the peak height of CO2 at m/e=46. The fact that we achieve + 0.49%0 precision on plagio- clase with this amount of contaminant gas shows that it has if any a minor effect on pre- cision of optimized analyses. We are currently evaluating whether the addition of either a hot mercury pump or KBr trap will improve pre- cision or reduce the number of non-optimized analyses.
6.3. Effect of oxygen-leaching on the precision of in situ analyses
It was initially hypothesized that the preci- sion of the laser microprobe analyses might be adversely affected by leaching and fractiona- tion of oxygen from material immediately ad- jacent to the pit. Crowe et al. (1990) used a combination of high-resolution back-scatter electron imaging and electron microprobe analysis to document leaching of elemental sulfur around reaction pits in chalcopyrite. A 75-/zm-wide zone around an ablation pit dis- played a 2.5-wt% depletion in elemental sul- fur, and it is hypothesized that this depletion was accompanied by a fractionation of 34S/32S.
To determine whether there is a similar ox- ygen depletion around feldspar reaction pits, wavelength-dispersive analysis was performed with a nine-spectrometer ARL ® SEMQ elec- tron microprobe. The analyzed sample was wafer A of Marcy plagioclase that, after laser microprobe analysis, was removed from the sample chamber, epoxied to a glass slide, and lightly polished. Electron microprobe analyses were obtained along a 540-/~m traverse in 10- /~m increments away from the rim of a plagio- clase laser-reaction pit (A to B in Fig. 3). This traverse reveals a sharp compositional bound- ary between a 70-/tm-wide alteration halo sur- rounding the pit and the adjacent fractured feldspar (Fig. 5). With the exception of 2-3 wt% F, elemental weight-percentages typical of An45 are found on the feldspar side of the boundary, while high Ca, AI and F weight-per- centages suggestive of fluorides are measured
IN SITU O ISOTOPE ANALYSIS BY Nd:YAG LASER MICROPROBE
B A 60
5O
IIIIIIIoR
m E
3O
,~. 2O
| 1o
Si
- T
1;0 2;0 300 400 500 distance from pit edge (iJm)
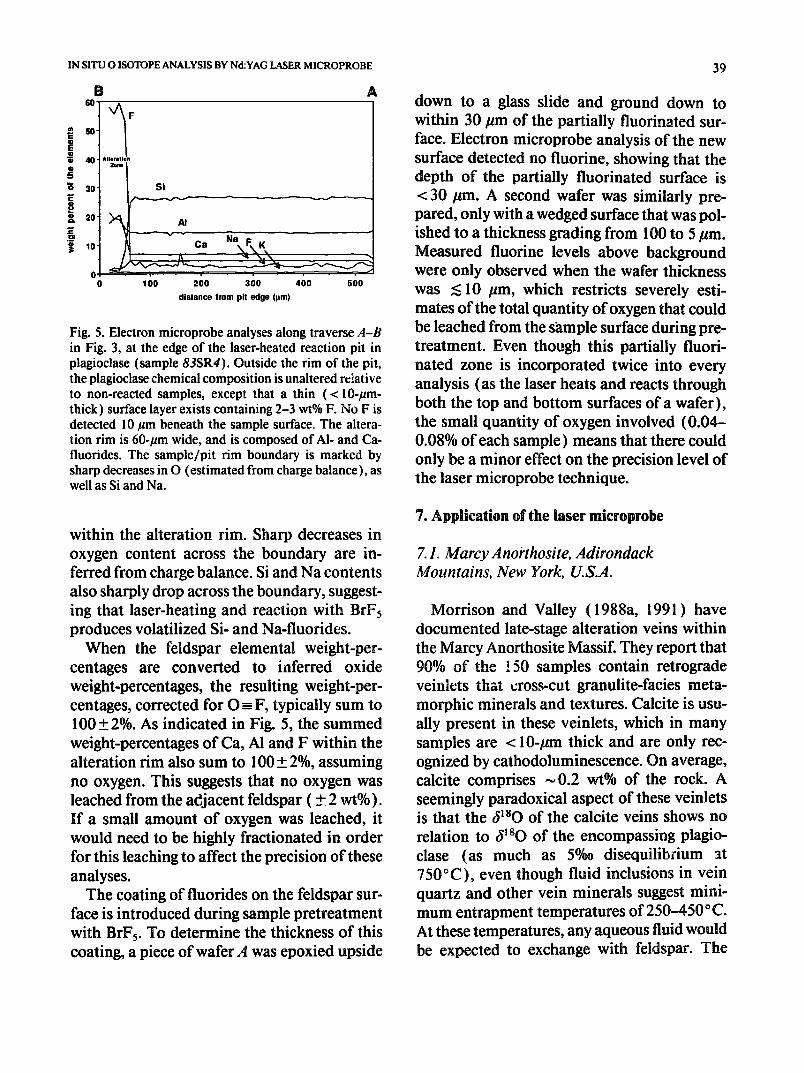
Fig. 5. Electron microprobe analyses along traverse A-B in Fig. 3, at the edge of the laser-heated reaction pit in plagioclase (sample 83SR4). Outside the rim of the pit, the plagioclase chemical composition is unaltered relative to non-reacted samples, except that a thin (< 10-/tm- thick) surface layer exists containing 2-3 wt% F. No F is detected 10/~m beneath the sample surface. The altera- tion rim is 60-/~m wide, and is composed of AI- and Ca- fluorides. The sample/pit rim boundary is marked by sharp decreases in O (estimated from charge balance), as well as Si and Na.
within the alteration rim. Sharp decreases in oxygen content across the boundary are in- ferred from charge balance. Si and Na contents also sharply drop across the boundary, suggest- ing that laser-heating and reaction with BrF5 produces volatilized Si- and Na-fluorides.
When the feldspar elemental weight-per- centages are converted to iaferred oxide weight-percentages, the resulting weight-per- centages, corrected for O--F, typically sum to 100___2%. As indicated in Fig. 5, the summed weight-percentages of Ca, A1 and F within the alteration rim also sum to 100 + 2%, assuming no oxygen. This suggests that no oxygen was leached from the adjacent feldspar ( + 2 wt%). If a small amount of oxygen was leached, it would need to be highly fractionated in order for this leaching to affect the precision of these analyses.
The coating of fluorides on the feldspar sur- face is introduced during sample pretreatment with BrFs. To determine the thickness of this coating, a piece of wafer A was epoxied upside
39
down to a glass slide and ground down to within 30/tm of the partially fluorinated sur- face. Electron microprobe analysis of the new surface detected no fluorine, showing that the depth of the partially fluorinated surface is < 30/tm. A second wafer was similarly pre- pared, only with a wedged surface that was pol- ished to a thickness grading from 100 to 5/tin. Measured fluorine levels above background were only observed when the wafer thickness was < 10 /~m, which restricts severely esti- mates of the total quantity of oxygen that could be leached from the sample surface during pre- treatment. Even though this partially fluori- nated zone is incorporated twice into every analysis (as the laser heats and reacts through both the top and bottom surfaces of a wafer), the small quantity of oxygen involved (0.04- 0.08% of each sample) means that there could only be a minor effect on the precision level of the laser microprobe technique.
7. Application of the laser microprobe
7.1. Marcy Anorthosite, Adirondack Mountains, New York, U.S.A.
Morrison and Valley ( 1988a, 1991 ) have documented late-stage alteration veins within the Marcy Anorthosite Massif. They report that 90% of the ! 50 samples contain retrograde veiniets that cross-cut granulite-facies meta- morphic minerals and textures. Calcite is usu- ally present in these veinlets, which in many samples are < 10-pm thick and are only rec- ognized by cathodoluminescence. On average, calcite comprises ~0.2 wt% of the rock. A seemingly paradoxical aspect of these veinlets is that the t$~sO of the calcite veins shows no relation to t~lSO of the encompassing plagio- clase (as much as 5%0 disequilibrium at 750°C), even though fluid inclusions in vein quartz and other vein minerals suggest mini- mum entrapment temperatures of 250-450 °C. At these temperatures, any aqueous fluid would be expected to exchange with feldspar. The
40 DON ELSENHEIMER AND J.W. VALLEY
paradox gains significance in part because the Marcy Anorthosite Massif has figured promi- nently in a number of recent debates about the role of fluids in granulite-facies terranes (e.g., Valley et al., 1990). While some researchers have proposed that large amounts of fluids have infiltrated these rocks, Morrison and Val- ley (1988a) propose that the veins formed at very low fluid/rock ratios and that they may be rimmed by such very thin gradients in ~ 8 0 that the whole-rock -~80 is not significantly af- fected. Were there a more pervasive effect, then the isotopic disequilibrium between calcite and plagioclase would have resulted in a heteroge- neous distribution of plagioclase ~80-values, with large gradients associated with the calcite veins.
Since we strove for a standard plagioclase that was homogeneous with respect to ~i80, the Marcy Anorthosite plagioclase that we inten- sively analyzed (sample 83SR4) contains no calcite veinlets. The distribution of plagioclase megacrysts analyzed roughly encompassed the entire sample. If the whole-rock c~]80 of sam- ple 83SR4 (+9.4%o) was affected by ex- change with fluids travelling along veins with a spacing of > 10 cm, then a gradient in ~ 8 0 would have likely formed at the scale of milli- meters to centimeters between the veins and the plagioclase. The laser microprobe analyses reported here show that such a gradient does not exist, supporting the interpretation that these late calcite veins formed in response to the infiltration of small amounts of fluid and that any isotopic gradients are very sharp.
7.2. Siljan Ring, Sweden
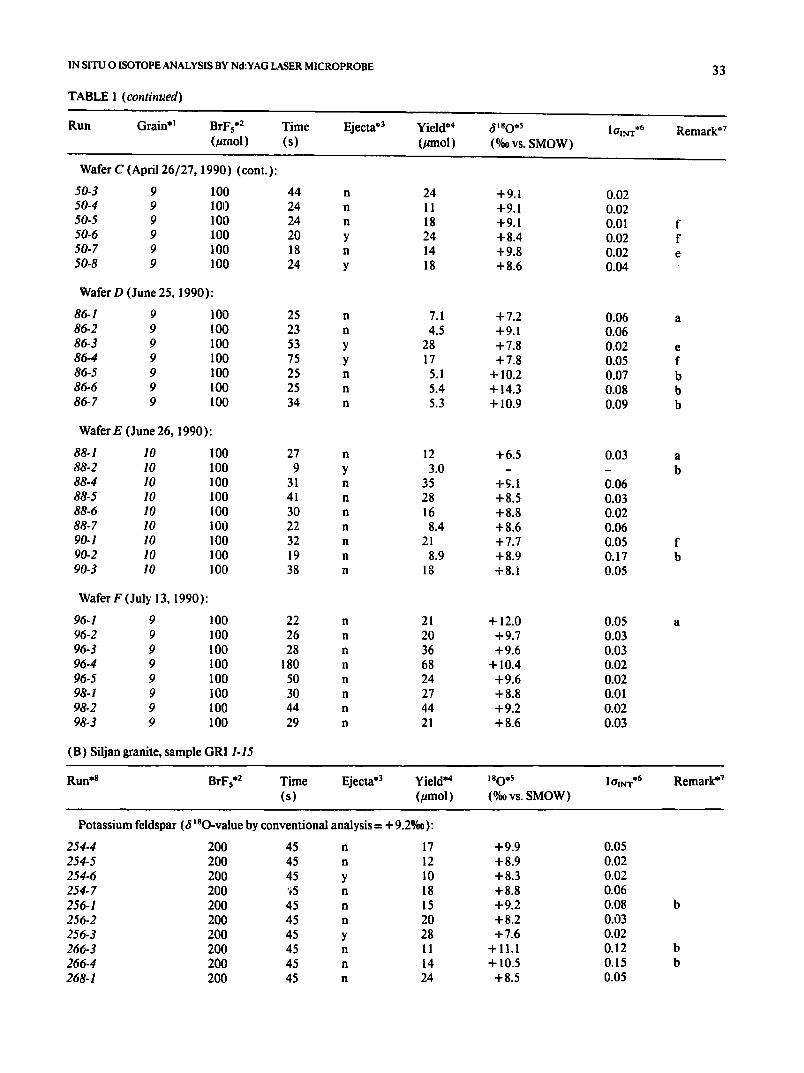
During this study, analyses were also ob- tained on a rock sample that was believed to be isotopically heterogeneous, to evaluate the ability of the in situ laser microprobe tech- nique to measure intracrystalline variations in oxygen isotope ratios. The sample selected was 1.7-Ga granite from a 50-km-diameter astro- bleme (362 Ma), the Siljan Ring, Sweden. This granite from Gravberg, near the northern mar-
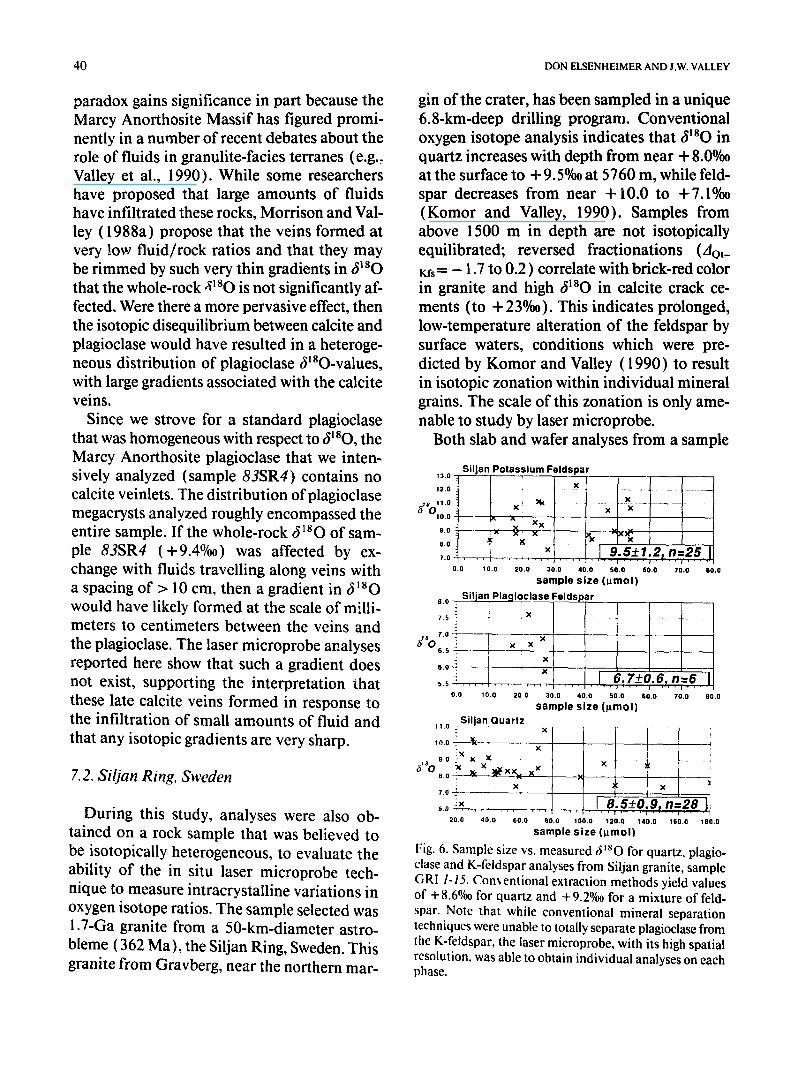
gin of the crater, has been sampled in a unique 6.8-km-deep drilling program. Conventional oxygen isotope analysis indicates that t~80 in quartz increases with depth from near + 8.0%o at the surface to + 9.50o at 5760 m, while feld- spar decreases from near +10.0 to +7.1%o (Komor and Valley, 1990). Samples from above 1500 m in depth are not isotopically equilibrated; reversed fractionations (dQt_ ~ = -- 1.7 to 0.2) correlate with brick-red color in granite and high ~ 8 0 in calcite crack ce- ments (to + 23%0). This indicates prolonged, low-temperature alteration of the feldspar by surface waters, conditions which were pre- dicted by Komor and Valley (1990) to result in isotopic zonation within individual mineral grains. The scale of this zonation is only ame- nable to study by laser microprobe.
Both slab and wafer analyses from a sample
Siljan Potassium Feldspar 13.0 ":
12.0 , X
SII~ 11,0 : X ! ~ X X X
0 1 0 0 : _ _ ~
7 . 0 - : . 1.9,'5.~172, n=25 0.0 10 .0 20 .0 30.0 40 .0 50 .0 60 .0 70.0
sample size ( I . tmo l )
s.o . Si l ja~ P l a g i o c l a s e Feld
7.5 : . X
5 1 8 0 7.0 ~ .= x x x 6 ,5 ]
:~ x
6.0 ~ - - x I 6 . 7 + _ 0 . 6 , n = 6 5.5 . . . .
0 .0 10 ,0 20.0 30.0 40 ,0 50 .0 1~0.0 70.0
sample size ( t a m o l )
I 80 .0
s a m p l e s i z e ( ~ t m o l )
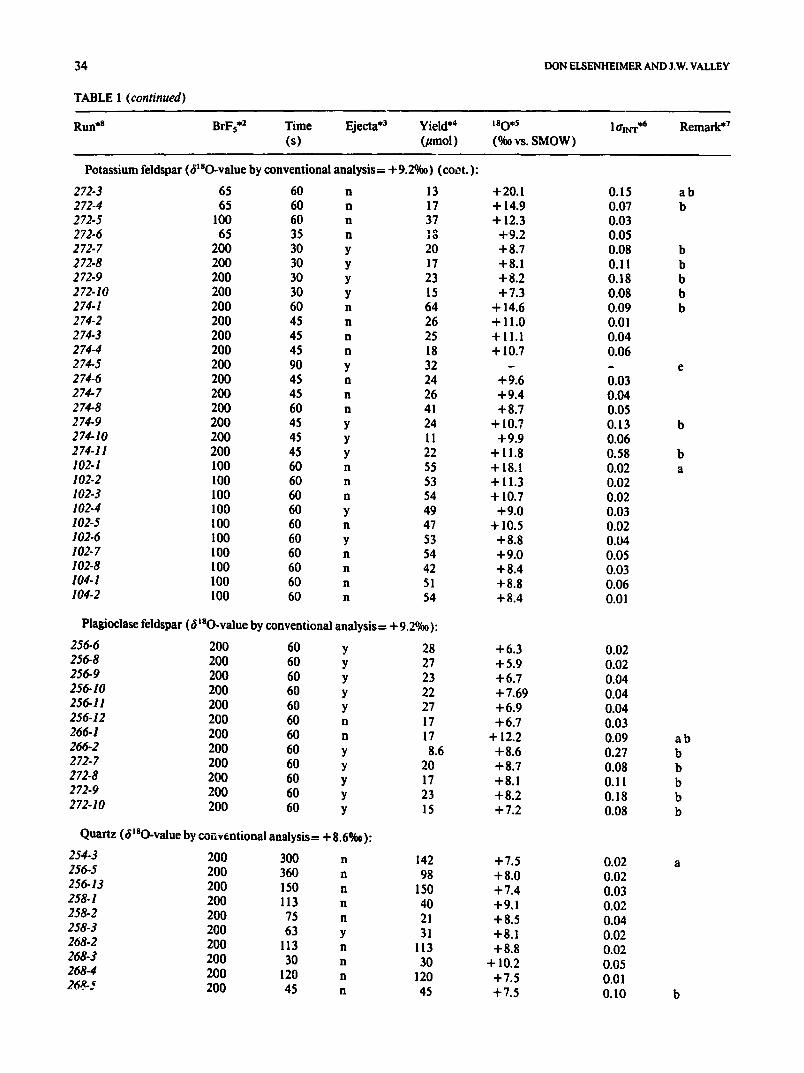
Fig. 6. Sample size vs. measured ~ 8 0 for quartz, plagio- clase and K-feldspar analyses from Siljan granite, sample GRI 1-15. Conventional extraction methods yield values of +8.6%o for quartz and +9.2%o for a mixture of feld- spar. Note that while conventional mineral separation techniques were unable to totally separate plagioclase from the K-feldspar, the laser microprobe, with its high spatial resolution, was able to obtain individual analyses on each phase.
11.o S i l j a n Q u a r t z : x , ;
lO.O ~ - - ~ ~x x l
9.0 X X . . ' 6'~0 x x I 0.o ; ~ x ~ < x x . . x x
X I 7.0 ~ X X I
ix I 8 . 5 + - 0 . 9 , n = 2 8 6.0 . . . . . . . . . . . . I ' " " ' 20.0 40 .0 60 ,0 •0,0 100.0 120.0 140.0 160.0 180.0
80 .0
IN SITU O ISOTOPE ANALYSIS BY Nd:YAG LASER MICROPROBE
of the red granite ( 1006-m depth) were tested for oxygen isotope zonation. Minerals ana- lyzed were quartz, K-feldspar and plagioclase. Quartz, which does not easily absorb Nd:YAG laser radiation, reacted when laser-heating was initiated either along grain boundaries or on trace magnetite inclusions within the quartz grains. The results are presented in Table I and Fig. 6. In situ laser microprobe averages agree well with conventional isotopic analysis of these minerals, although the total spread in values is higher than the precision of Marcy plagioclase (tT=_+0.6-1.2 vs. +_0.5). These data suggest that the range in t~80 for the Sil- jan granite represents real sample heterogene- ity, particularly in K-feldspar. However, the analyses from grain cores and rims cannot be divided into populations with distinct isotopic compositions, given the laser microprobe's op- tics and the current precision of the laser mi- croprobe technique. This type of petrographic correlation will be very important in evaluat- ing future laser microprobe data.
8. Conclusions
The in situ Nd:YAG laser microprobe tech- nique for measuring oxygen isotope ratios in plagioclase combines high spatial resolution with precision of +_ 0.5%0 ( 1 ~). The precision of some individual feldspar wafers is much better than +_ 0.5%0, suggesting that further ex- amination of the processes of laser-heating and fluorination may provide improvements on precision. While samples in this study were in- termediate in size (typically 0.5-2 mg feld- spar), improvement of our sampling tech- nique may enable us to obtain high-precision analyses from much smaller-sized samples.
Acknowledgements
We wish to recognize Doug Crowe and Kevin Baker for their important roles in the design and construction of the laser microprobe sys- tem, and for their advice and suggestions dur- ing the development of the in situ technique. We also thank Everett Glover for his help in
41
gold-coating samples and for obtaining the electron microprobe data. The Gas Research Institute supports current laser microprobe in- vestigations (5089-260-1810), as does the Na- tional Science Foundation (EAR89-05101). The text and figures in this paper were com- posed on computers provided by Phil Brown, the U.W. Department of Geology and Geo- physics and Apple®'s Higher Education Pur- chase Program J. Eiler, M. Gerdes, L. Baum- gartner, Z. Sharp and an anonymous reviewer are thanked for helpful reviews.
References
Bohlen, S.R., Valley, J.W. and Essene, E.J., 1985. Meta- morphism in the Adirondacks, I. Pressure and temper- ature. J. Petrol., 26: 971-992.
Borthwick, J. and Harmon, R.S., 1982. A note regarding CIF3 as an alternative to BrF5 for oxygen isotope anal- ysis. Geochim. Cosmochim. Acta, 46: 1665-1668.
Brenna, J.T. and Creasy, W.R., 1988. Laser microprobe Fourier transform ion cyclotron resonance mass spec- trometry. In: D.E. Newbury (Editor), Microbeam Analysis, 1988. San Francisco Press, San Francisco, Calif., pp. 377-378.
Carr, R.H., Wright, I.P., Joines, A.W. and Pillinger, C.T., 1986. Measurement of carbon stable isotopes at the nanomole level: A static mass spectrometer and sam- ple preparation technique. J. Phys. E, 19: 798-808.
Clayton, R.N. and Mayeda, T.K., 1963. The use of bro- mine pentafluoride in the extraction of oxygen from oxides and silicates for isotopic analysis. Geochim. Cosmochim. Acta, 27: 43-52.
Cole, D.R. and Ohmoto, H., 1986. Kinetics of isotopic exchange at elevated temperatures and pressures. In: J.W. Valley, H.P. Taylor and J.R. O'Neil (Editors), Stable Isotopes in High-Temperature Geological Pro- cesses. Mineral. Soc. Am., Rev. Mineral., 16: 41-90.
Crowe, D.E., 1990. Geochemistry of volcanogenic mas- sive sulfide and high-grade Au granite-hosted ore de- posits, southern Alaska, and development and appli- cation of laser microprobe techniques for analysis of sulfur, carbon, and oxygen isotope ratios. Ph.D. Dis- sertation, University of Wisconsin, Madison, Wis. (unpublished).
Crowe, D.E. and Valley, J.W., 1992. Laser microprobe study of sulfur isotope variation in a sea-floor hydro- thermal spire, Axial Seamount, Juan de Fuca Ridge, eastern Pacific. In: R.S. Harmon and R.W. Hinton (Guest-Editors), Frontiers in Isotope Geosciences. Chem. Geol. (Isot. Geosci. Sect.), 101:63-70 (this special issue).
Crowe, D.E., Valley, J.W. and Baker, K., 1990. Microan- alysis of sulfur-isotope ratios and zonation by laser mi- croprobe. Geochim. Cosmochim. Acta, 54: 2075-2092.
42 DON ELSENHEIMER AND J.W. VALLEY
Dickson, J.A.D., Smalley, P.C., R~heim, A. and Stijfhoorn, D.E., 1990. IntraerystaUine carbon and oxygen isotope variations in calcite revealed by laser microsampling. Geology, 18:809-811.
Douthitt, C.B., 1990. Isotope ratio monitoring mass spec- trometry: A possible approach to a stable isotope mi- croprobe. Geol. Soc. Aust., Abstr. ICOG 7 (7th Int. Conf. Geochronol. Cosmochronol. Isot. Geol. ), Can- berra, A.C.T., Sept. 24-29, 1990, 27: 28.
Elphick, S.C., Graham, C.M. and Dennis, P.F., 1988. An ion microprobe study of anhydrous oxygen diffusion in anorthite: A comparison with hydrothermal data and some geological implications. Contrib. Mineral. Pe- trol., 100: 490-495.
Fallick, A.E., McConville, P., Boyce, A.J., Burgess, R. and Kelley, S.P., 1992, Laser microprobe stable isotope measurements in geologic materials: Some experimen- tal considerations (with special reference to j34S in sulphides). In: R.S. Harmon and R.W. Hinton (Guest- Editors), Frontiers in Isotope Geosciences. Chem. Geol. (Isot. Geosci. Sect.), 101:53-61 (this special issue).
Giletti, B.J., 1986. Diffusion effects on oxygen isotope temperatures of slowly cooled igneous and metamor- phic rocks. Earth Planet. Sci. Lett., 77:218-228.
Graham, C.M. and Valley, J.W., 1992. Sulfur isotope analysis of pyrites. In: R.S. Harmon and R.W. Hinton (Guest-Editors), Frontiers in Isotope Geosciences. Chem. Geol. (lsot. Geosci. Sect.), 101:169-172 (this special issue).
Halas, S. and Krause, H.R., 1983. Isotopic analysis ofna- nomole gas samples by means of dynamic flow mass spectrometry. Rev. Sci. lnstrum., 54: 437-443.
Heinen, J.J., Meier, S., Vogt, H. and Wechsung, R., 1983. LAMMA 1000, a new laser microprobe mass analyzer for bulk samples. Int. J. Mass Spectrom. Ion Phys., 47: 19-22.
Kelley, S.A. and Fallick, A.E., 1990. High precision spa- tially resolved analysis of 634S in sulfides using a laser extraction technique. Geochim. Cosmochim. Acta, 54: 883-888.
Komor, S.C. and Valley, J.W., 1990. Deep drilling at the Siljan Ring impact structure: Oxygen-isotope geo- chemistry of granite. Contrib. Mineral. Petrol., 105: 516-532.
Lasaga, A.C., 1983. Geospeedometry: an extension of geothermometry. In: S.K. Saxena (Editor), Kinetics and Equilibrium in Mineral Reactions. Springer, Ber- lin, pp. 81-I 14.
Lorin, J.C., Slodzian, G., Dennebouy, R. and Chaintreau M., 1990. SIMS measurement of oxygen isotope-ratios in meteorites and primitive solar system matter. In: A. Benninghoven, C.A. Evans, K.D. McKeegan, H.A. Storms and H.W. Werner (Editors), Secondary Ion Mass Spectrometry SIMS VII. Wiley, Chichester, pp. 927-936.
Matthews, D.E. and Hayes, J.M., 1978. Isotope-ratio- monitoring gas chromatography-mass spectrometry. Anal. Chem., 50: 1465-1473.
McKeegan, K.D., 1987. Oxygen isotopes in refractory stratospheric dust particles: Proof of extraterrestrial origin. Science, 237: 1468-1471.
Morrison, J. and Valley, J.W., 1988a. Post-granulite fa- cies fluid infiltration in the Adirondack Mountains. Geology, 16: 513-516.
Morrison, J. and Valley, J.W., 1988b. Contamination of the Marcy Anorthosite Massif, Adirondack Moun- tains, N.Y.: Petrologic and isotopic evidence. Contrib. Mineral. Petrol., 98: 97-108.
Morrison, J. and Valley, J.W., 1991. Retrograde fluids in granulites: stable isotope evidence of fluid migration. J. Geol., 99: 559-570.
Sharp, Z.D., 1990. A laser-based microanalytical method for the in situ determination of oxygen isotope ratios of silicates and oxides. Geochim. Cosmochim. Acta, 54: 1353-1357.
Sharp, Z.D., 1991. Determination of oxygen diffusion rates in magnetite from natural isotopic variations. Geology, 19, 653-656.
Siegman, A.E., 1971. An Introduction to Lasers and Mas- ers. McGraw-Hill, New York, N.Y., 520 pp.
SmaUey, P.C., Stijfhoorn, D.E., R[theim, A., Johanson, H. and Dickson, J.A.D., 1989. The laser microprobe and its application to the study of C and O isotopes in cal- cite and aragonite. Sediment. Geol., 65:211-221.
Valley, J.W., 1986. Stable isotope geochemistry of meta- morphic rocks. In: J.W. Valley, H.P. Taylor and J.R. O'Neil (Editors), Stable Isotopes in High-tempera- ture Geological Processes. Mineral. Soc. Am., Rev. Mineral., 16: 445-489.
Valley, J.W. and Graham, C., 1991a. Ion microprobe analysis of oxygen isotopes in magnetite and ilmenite. Eos (Trans. Am. Geophys. Union), 72:292 (abstract).
Valley, J.W. and Graham, C., 1991b. Ion microprobe analysis of oxygen isotope ratios in metamorphic mag- netites: Diffusive exchange as a guide to cooling his- tory. Contrib. Mineral. Petrol., 109: 38-52.
Valley, J.W., Bohlen, S.R., Essene, E.J. and Lamb, W., 1990. Metamorphism in the Adirondacks, II. The role of fluids. J. Petrol., 31: 555-596.
Vennemann, T.W. and Smith, H.S., 1990. The rate and temperature of reaction of CIF3 with silicate minerals, and their relevance to oxygen isotope analysis. Chem. Ceol. (Isotope Geosci. Sect.), 86: 83-88.
Wada, H., Niitsuma, N. and Saito, T., 1982. Carbon and oxygen isotopic measurements of ultra-small samples. Shizuoka Univ., Geosci. Rep., 7: 35-50.
Wright, I.P. and Pillinger, C.T., 1989. Carbon isotopic analysis of small samples by use of stepped-heating ex- traction and static mas3 spectx:Jmetry. In: W.C. Shanks III and R.E. Cris~ (Editors), New Frontiers in Stable Isotopic Research: ~aser t~'robes, Ion Probes, and Small- Sample Analysis. ~I.S. Geol. Surv. Bull., 1890: 9-34.
Related Documents