University of Kentucky University of Kentucky UKnowledge UKnowledge Theses and Dissertations--Animal and Food Sciences Animal and Food Sciences 2019 IMPROVED IRON STATUS IN WEANLING PIGS LEADS TO IMPROVED IRON STATUS IN WEANLING PIGS LEADS TO IMPROVED GROWTH PERFORMANCE IN THE SUBSEQUENT IMPROVED GROWTH PERFORMANCE IN THE SUBSEQUENT NURSERY PERIOD NURSERY PERIOD Tyler Chevalier University of Kentucky, [email protected] Digital Object Identifier: https://doi.org/10.13023/etd.2019.442 Right click to open a feedback form in a new tab to let us know how this document benefits you. Right click to open a feedback form in a new tab to let us know how this document benefits you. Recommended Citation Recommended Citation Chevalier, Tyler, "IMPROVED IRON STATUS IN WEANLING PIGS LEADS TO IMPROVED GROWTH PERFORMANCE IN THE SUBSEQUENT NURSERY PERIOD" (2019). Theses and Dissertations--Animal and Food Sciences. 111. https://uknowledge.uky.edu/animalsci_etds/111 This Master's Thesis is brought to you for free and open access by the Animal and Food Sciences at UKnowledge. It has been accepted for inclusion in Theses and Dissertations--Animal and Food Sciences by an authorized administrator of UKnowledge. For more information, please contact [email protected].

Welcome message from author
This document is posted to help you gain knowledge. Please leave a comment to let me know what you think about it! Share it to your friends and learn new things together.
Transcript
University of Kentucky University of Kentucky
UKnowledge UKnowledge
Theses and Dissertations--Animal and Food Sciences Animal and Food Sciences
2019
IMPROVED IRON STATUS IN WEANLING PIGS LEADS TO IMPROVED IRON STATUS IN WEANLING PIGS LEADS TO
IMPROVED GROWTH PERFORMANCE IN THE SUBSEQUENT IMPROVED GROWTH PERFORMANCE IN THE SUBSEQUENT
NURSERY PERIOD NURSERY PERIOD
Tyler Chevalier University of Kentucky, [email protected] Digital Object Identifier: https://doi.org/10.13023/etd.2019.442
Right click to open a feedback form in a new tab to let us know how this document benefits you. Right click to open a feedback form in a new tab to let us know how this document benefits you.
Recommended Citation Recommended Citation Chevalier, Tyler, "IMPROVED IRON STATUS IN WEANLING PIGS LEADS TO IMPROVED GROWTH PERFORMANCE IN THE SUBSEQUENT NURSERY PERIOD" (2019). Theses and Dissertations--Animal and Food Sciences. 111. https://uknowledge.uky.edu/animalsci_etds/111
This Master's Thesis is brought to you for free and open access by the Animal and Food Sciences at UKnowledge. It has been accepted for inclusion in Theses and Dissertations--Animal and Food Sciences by an authorized administrator of UKnowledge. For more information, please contact [email protected].

STUDENT AGREEMENT: STUDENT AGREEMENT:
I represent that my thesis or dissertation and abstract are my original work. Proper attribution
has been given to all outside sources. I understand that I am solely responsible for obtaining
any needed copyright permissions. I have obtained needed written permission statement(s)
from the owner(s) of each third-party copyrighted matter to be included in my work, allowing
electronic distribution (if such use is not permitted by the fair use doctrine) which will be
submitted to UKnowledge as Additional File.
I hereby grant to The University of Kentucky and its agents the irrevocable, non-exclusive, and
royalty-free license to archive and make accessible my work in whole or in part in all forms of
media, now or hereafter known. I agree that the document mentioned above may be made
available immediately for worldwide access unless an embargo applies.
I retain all other ownership rights to the copyright of my work. I also retain the right to use in
future works (such as articles or books) all or part of my work. I understand that I am free to
register the copyright to my work.
REVIEW, APPROVAL AND ACCEPTANCE REVIEW, APPROVAL AND ACCEPTANCE
The document mentioned above has been reviewed and accepted by the student’s advisor, on
behalf of the advisory committee, and by the Director of Graduate Studies (DGS), on behalf of
the program; we verify that this is the final, approved version of the student’s thesis including all
changes required by the advisory committee. The undersigned agree to abide by the statements
above.
Tyler Chevalier, Student
Dr. Merlin D. Lindemann, Major Professor
Dr. David L. Harmon, Director of Graduate Studies
IMPROVED IRON STATUS IN WEANLING PIGS LEADS TO IMPROVED
GROWTH PERFORMANCE IN THE SUBSEQUENT NURSERY PERIOD
________________________________________
THESIS
________________________________________
A thesis submitted in partial fulfillment of the
requirements for the degree of Master of Science in the
College of Agriculture, Food and Environment
at the University of Kentucky
By
Tyler B. Chevalier
Lexington, Kentucky
Director: Dr. Merlin D. Lindemann, Professor of Animal and Food Sciences
Lexington, Kentucky
2019
Copyright © Tyler B. Chevalier 2019
ABSTRACT OF THESIS
IMPROVED IRON STATUS IN WEANLING PIGS LEADS TO IMPROVED
GROWTH PERFORMANCE IN THE SUBSEQUENT NURSERY PERIOD
The objectives of this thesis were: 1) to assess the iron status of piglets, 2) to
thoroughly evaluate the blood profile, growth performance, and tissue mineral
concentration of young pigs during the pre and postweaning periods after receiving various
dosages of iron (0, 50, 100, 200, and 300 mg iron) at birth, 3) as well as evaluate the effects
of an additional iron injection before weaning on hematological measures, growth
performance, and tissue mineral concentration postweaning. In the initial experiment, there
was a 60% incidence of iron deficiency at weaning after administration of a 150 mg iron
injection at birth. Also at weaning, hemoglobin concentration was negatively correlated
with BW and BW gain (r = -0.53, P <0.0001, and r = -0.60, P < 0.0001 respectively). In
the second experiment, pigs that were not injected with iron at birth had a major reduction
in hematological measures, growth performance, and tissue iron concentration until d 52
where iron status was recovered but growth was not. Overall, ADG was improved in a
linear and quadratic manner (P = 0.02 and P = 0.01 respectively) as the iron dosage
increased with the largest improvement from the 0 mg to 50 mg iron treatment. The
improvement observed in ADG let to similar increases (P = 0.02 and P = 0.01 respectively)
in final BW as iron dosage treatments increased. Hemoglobin (Hb) concentration improved
(P = 0.01) with increasing injectable iron as early as d 1 and continued to d 38, thereafter
(d 52) no differences in Hb concentration were observed. Iron concentration for all tissues
(liver, spleen, heart, and kidneys) at weaning was greater (P ≤ 0.01) as the iron dosage
increased. In the third experiment, pigs that were supplemented with an additional iron
injection 4 days before weaning had an increased ADG for the overall experimental period
(31 to 34 d). The improved ADG during the experiment led to a heavier (P < 0.001) final
BW (~1 kg) for pigs injected with an additional iron injection. At weaning, pigs injected
with a second iron injection had higher (P < 0.001) hemoglobin concentration and other
complete blood count measures. The improved Hb concentration observed at weaning
continued 14 days later (P 0.02). Additionally, liver iron concentration was greater (P =
0.02) at weaning for the pigs receiving an additional iron injection. In summary, the initial
iron injection administered at birth may not be adequate to satisfy all individual iron
requirements of piglets before weaning, however, hematological measurements and tissue
iron concentration do improve as the iron dosage increases at birth. Furthermore, injecting
an additional iron injection before weaning improves nursery growth performance.
KEYWORDS: Iron deficiency, piglets, weaning, iron injection, growth performance
Tyler B. Chevalier
12/09/2019
Date
IMPROVED IRON STATUS IN WEANLING PIGS LEADS TO IMPROVED
GROWTH PERFORMANCE IN THE SUBSEQUENT NURSERY PERIOD
By
Tyler B. Chevalier
Dr. Merlin D. Lindemann
Director of Thesis
Dr. David L. Harmon
Director of Graduate Studies
12/09/2019
Date

DEDICATION
To my beloved parents
Janet and Todd Chevalier For they are the ones who have raised me to be who I am today.
iii
ACKNOWLEDGMENTS
I would like to express my deepest appreciation to my major professor, Dr. Merlin
D. Lindemann, for his guidance, support, and patience throughout my undergraduate
graduate time here at the University of Kentucky. Also for he is the one who introduced
me to research and to further my education in graduate school and for these reasons words
will never adequately describe my appreciation to him. Grateful appreciation is offered
to Dr. Sunday A. Adedokun in his support and teachings, as well as developing my
interest in poultry related research. Extended appreciation is offered to Dr. James Pierce,
Dr. Sunday A. Adedokun, and Dr. Mieke Holder for serving on the advisory committee.
Appreciation is also extended to Dr. David L. Harmon, Director of Graduate Studies, and
to Dr. Richard D. Coffey, Chair of the Department of Animal and Food Sciences.
Appreciation is offered to Mr. Jim Monegue for his assistance and patience in the
management of the experiments in this thesis; and to the farm crew, Mr. Kip Sparrow,
Mr. William Graham, Mr. Robert Elliot for all their assistance in the feeding and daily
chores associated with swine research. Appreciation is also offered to Mr. Frank Berry in
mixing experimental diets, to Dr. Noel Inocencio and Mrs. Susan Hayes for their
technical help on sample analysis in the lab, and to Mrs. Velvet Barnett for technical
computer support.
Gratitude is extended to Dr. Young Dal Jang, Dr. Ning Lu, Dr. Ding Wang, Dr.
Lauren Nolan, Dr. Jung Wook Lee, and Ms. Sarah Elefson for their help and friendship.
Sincere gratitude is offered to Ms. Shannon Dierking and Ms. Opeyemi Olojede
in their help, constant support, and most importantly their friendship. Extended gratitude

iv
is offered to Mr. Henry Lanham and Mr. Henry Lanham Jr. for which their mentorship
introduced me to agriculture which established my love for pigs.
Sincere gratitude is extended to my grandmother, Mrs. Barbara Barnett, and my
brother, Mr. Jordan Chevalier for their love and support. Last but not least, with the
utmost gratitude for my parents, Mr. Todd Chevalier and Mrs. Janet Chevalier for their
continuous, unconditional love and selfless support.
v
TABLE OF CONTENTS
ACKNOWLEDGMENTS ................................................................................................. iii
LIST OF TABLES ............................................................................................................. ix
LIST OF FIGURES .......................................................................................................... xii
CHAPTER 1. Introduction.................................................................................................. 1
CHAPTER 2. Literature review .......................................................................................... 3
2.1 Changes and challenges of swine production ..................................................... 3
2.2 Iron deficiency anemia .......................................................................................... 4
2.2.1 Iron deficiency anemia in swine ................................................................ 5
2.2.2 Piglets iron requirement ............................................................................ 5
2.2.3 Assessing iron deficiency anemia in swine ............................................... 6
2.3 Maternal iron contribution to piglets .................................................................. 7
2.3.1 Fetal iron development .............................................................................. 7
2.3.2 Sow milk ................................................................................................... 9
2.4 Swine management practices ............................................................................ 10
2.4.1 Older weaning ages ................................................................................. 10
2.4.2 Increased sow productivity (genetics) ..................................................... 10
2.4.3 Iron supplementation in swine production .............................................. 11
2.5 Current issues in the swine industry ................................................................. 12
2.6 Addressing the iron issue .................................................................................. 14
2.6.1 Greater initial dose of iron ...................................................................... 14
2.6.2 Addition of a second iron injection ......................................................... 15
2.7 Postweaning iron supplementation ................................................................... 17
2.8 Nutritional iron.................................................................................................. 17
2.8.1 Iron storage .............................................................................................. 18
2.8.2 Iron transport ........................................................................................... 18
2.8.2.1 Transferrin and ferroportin ................................................................. 19
2.8.3 Role and function in living organisms .................................................... 19
2.8.3.1 Erythropoiesis ..................................................................................... 20
2.8.3.2 Hemoglobin and myoglobin ............................................................... 20
2.8.3.3 Energy metabolism ............................................................................. 21
2.8.4 Bioavailability ......................................................................................... 21
vi
2.8.4.1 Absorption and utilization ................................................................. 21
2.8.4.1.1 Dietary absorption ....................................................................... 22
2.8.4.1.2 Intramuscular injection absorption .............................................. 23
2.8.5 Regulation and homeostasis .................................................................... 23
2.8.5.1 Iron toxicity ........................................................................................ 24
2.8.5.2 Hepcidin ............................................................................................. 27
2.8.6 Immune function ..................................................................................... 27
2.9 Nutrient interactions .......................................................................................... 28
2.9.1 Non-competitive and competitive inhibition ........................................... 28
2.9.2 Facilitators of iron absorption ................................................................. 30
2.10 Conclusion .................................................................................................... 30
CHAPTER 3. Assessment of the iron status of young pigs in a confinement herd .......... 32
3.1 Abstract ............................................................................................................. 32
3.2 Introduction ....................................................................................................... 34
3.3 Experimental procedures .................................................................................. 35
3.3.1 Animals, housing, management, and experimental design ..................... 35
3.3.2 Experimental diets ................................................................................... 36
3.3.3 Data and sample collection ............................................................... 38
3.3.3.1 Growth performance response measures ............................................ 38
3.3.3.2 Blood collection ................................................................................. 38
3.3.4 Sample processing and laboratory analysis ............................................. 38
3.3.4.1 Blood analysis .................................................................................... 38
3.3.5 Statistical analysis ................................................................................... 39
3.4 Results ............................................................................................................... 39
3.5 Discussion ......................................................................................................... 48
3.6 Conclusion ........................................................................................................ 49
CHAPTER 4. Effects of increasing iron dosage to newborn piglets on growth
performance, hematological measures, and tissue mineral concentrations pre and
postweaning ...................................................................................................................... 51
4.1 Abstract ............................................................................................................. 51
4.2 Introduction ....................................................................................................... 53
4.3 Experimental procedures .................................................................................. 54
4.3.1 Animals, housing, management, and experimental design ............... 54
vii
4.3.2 Experimental diets ............................................................................. 55
4.3.3 Data and sample collection ............................................................... 58
4.3.3.1 Feed collection ................................................................................... 58
4.3.3.2 Growth performance and blood collection ......................................... 58
4.3.3.3 Tissue collection ................................................................................. 58
4.3.4 Sample processing and laboratory analysis ....................................... 59
4.3.4.1 Experimental diet measures ............................................................... 59
4.3.4.2 Blood and tissue measures ................................................................. 59
4.3.5 Statistical analysis ............................................................................. 60
4.4 Results ............................................................................................................... 62
4.4.1 Growth performance ......................................................................... 62
4.4.2 Hematological measures ................................................................... 67
4.4.3 Tissue measures ................................................................................. 83
4.5 Discussion ......................................................................................................... 89
4.5.1 Growth performance ......................................................................... 89
4.5.2 Hematological measures ................................................................... 90
4.5.3 Tissue measures ................................................................................. 92
4.6 Conclusion ........................................................................................................ 94
CHAPTER 5. Effects of an additional iron injection administered 4 days before weaning
on growth performance, hematological status, and tissue mineral concentrations of
nursery pigs ....................................................................................................................... 95
5.1 Abstract ............................................................................................................. 95
5.2 Introduction ....................................................................................................... 97
5.3 Experimental procedures .................................................................................. 98
5.3.1 Animals, housing, management, and experimental design ............... 98
5.3.2 Experimental diets ........................................................................... 100
5.3.3 Data and sample collection ............................................................. 102
5.3.3.1 Feed collection ................................................................................. 102
5.3.3.2 Growth performance and blood collection ....................................... 102
5.3.3.3 Tissue collection ............................................................................... 102
5.3.4 Sample processing and laboratory analysis ..................................... 103
5.3.4.1 Experimental diet measures ............................................................. 103
5.3.4.2 Blood and tissue measures ............................................................... 103
viii
5.3.5 Statistical analysis ........................................................................... 104
5.4 Results ............................................................................................................. 106
5.4.1 Growth performance ....................................................................... 106
5.4.2 Hematological measures ................................................................. 109
5.4.3 Tissue measures ............................................................................... 113
5.5 Discussion ....................................................................................................... 119
5.5.1 Growth performance ....................................................................... 119
5.5.2 Hematological and tissue measures ................................................. 120
5.6 Conclusion ...................................................................................................... 122
CHAPTER 6.General discussion .................................................................................... 123
APPENDICES ................................................................................................................ 128
Appendix 1. Effects of increasing iron injection dosage on the cumulative change of
individual CBC measures ............................................................................................... 128
Appendix 2. Effects of iron injection dosage on individual CBC measures during pre and
postweaning .................................................................................................................... 135
REFERENCES ............................................................................................................... 149
VITA ............................................................................................................................... 167
ix
LIST OF TABLES
Table 2.1 Composition of sow milk at different times of lactation ...................................10
Table 2.2 Sow productivity improvement in the United States over the years ................. 11
Table 3.1 Composition of nursery diets (as-fed basis) ..................................................... 37
Table 3.2 Ranges and means of body weights and CBC at different time points ............. 41
Table 3.3 Absolute and percentage (%) of pigs in hemoglobin categories at different time
points ................................................................................................................................. 42
Table 4.1. Composition of sow lactation and piglet nursery diets (as-fed basis) ............. 57
Table 4.2. Effects of iron injection dosage on individual BW (kg) .................................. 63
Table 4.3. Effects of iron injection dosage on individual daily weight gain (g) during
nursing and subsequent weaning period ........................................................................... 64
Table 4.4. Effects of iron injection dosage on individual pig average daily gain (ADG, g)
........................................................................................................................................... 65
Table 4.5. Effects of iron injection dosage on nursery pen growth performance ............. 66
Table 4.6. Effects of iron injection dosage on hemoglobin concentration (Hb, g/dL) ..... 69
Table 4.7. Effects of iron injection dosage on hematocrit percentage (HCT, %) ............. 70
Table 4.8. Effects of iron injection dosage on red blood cell count (RBC, 106/µL) ........ 71
Table 4.9. Effects of iron injection dosage on white blood cell count (WBC, 103/µL) .... 72
Table 4.10. Effects of iron injection dosage on mean corpuscular volume (MCV, fL) ... 73
Table 4.11. Effects of iron injection dosage on mean corpuscular hemoglobin (MCH, pg)
........................................................................................................................................... 74
Table 4.12. Effects of iron injection dosage on mean corpuscular hemoglobin
concentration (MCHC, g/dL) ............................................................................................ 75
Table 4.13. Effects of iron injection dosage on liver mineral content (mg/kg DM) ......... 85
Table 4.14. Effects of iron injection dosage on spleen mineral content (mg/kg DM) ...... 86
Table 4.15. Effects of iron injection dosage on heart mineral content (mg/kg DM) ........ 87
Table 4.16. Effects of iron injection dosage on kidney mineral content (mg/kg DM) ..... 88
Table 5.1. Composition of nursery diets (as-fed basis) .................................................. 101
Table 5.2. Effects of an additional iron injection on individual growth performance .... 107
x
Table 5.3. Effects of an additional iron injection on pen growth performance in the
nursery............................................................................................................................. 108
Table 5.4. Effects of an additional iron injection on hemoglobin concentration (Hb, g/dL)
......................................................................................................................................... 110
Table 5.5. Effects of an additional iron injection on hematocrit (HCT, %) ................... 110
Table 5.6. Effects of an additional iron injection on red blood cell count (RBC, 106/µL)
......................................................................................................................................... 110
Table 5.7. Effects of an additional iron injection on white blood cell count (WBC,
103/µL) ............................................................................................................................ 111
Table 5.8. Effects of an additional iron injection on mean corpuscular volume (MCV, fL)
......................................................................................................................................... 111
Table 5.9. Effects of an additional iron injection on mean corpuscular hemoglobin (MCH,
pg) ................................................................................................................................... 111
Table 5.10. Effects of an additional iron injection on mean corpuscular hemoglobin
concentration (MCHC, g/dL) .......................................................................................... 112
Table 5.11. Effects of an additional iron injection on liver mineral concentration (DM
basis, mg/kg) ................................................................................................................... 115
Table 5.12. Effects of an additional iron injection on spleen mineral concentration (DM
basis, mg/kg) ................................................................................................................... 116
Table 5.13. Effects of an additional iron injection on heart mineral concentration (DM
basis, mg/kg) ................................................................................................................... 117
Table 5.14. Effects of an additional iron injection on kidney mineral concentration (DM
basis, mg/kg) ................................................................................................................... 118
Table A.1. Effects of iron injection dosage on cumulative hemoglobin concentration (Hb,
g/dL) change ....................................................................................................................128
Table A.2. Effects of iron injection dosage on cumulative hematocrit (HCT, %) change
......................................................................................................................................... 129
Table A.3. Effects of iron injection dosage on cumulative red blood cell count (RBC,
106/µL) change ................................................................................................................ 130
Table A.4. Effects of iron injection dosage on cumulative white blood cell count (WBC,
103/µL) change ................................................................................................................ 131
xi
Table A.5. Effects of iron injection dosage on mean corpuscular volume (MCV, fL)
cumulative change .......................................................................................................... 132
Table A.6. Effects of iron injection dosage on cumulative mean corpuscular hemoglobin
(MCH, pg) change .......................................................................................................... 133
Table A.7. Effects of iron injection dosage on cumulative mean corpuscular hemoglobin
concentration (MCHC, g/dL) change ............................................................................. 134
xii
LIST OF FIGURES
Figure 3.1. Relationship of Hb concentration and BW at birth (n = 118). ....................... 43
Figure 3.2. Relationship of Hb concentration and BW at weaning (n = 120). ................. 44
Figure 3.3. Relationship of Hb concentration and BW gain at weaning (n = 120). ......... 45
Figure 3.4. Relationship of Hb concentration and BW at 21d-postweaning (PW) (n =
120). .................................................................................................................................. 46
Figure 3.5. Relationship of Hb concentration and BW at 35d-postweaning (PW) (n =
119). .................................................................................................................................. 47
Figure 4.1. Effects of iron injection dosage on hemoglobin (Hb) concentration.. ............76
Figure 4.2. Effects of iron injection dosage on hematocrit content (HCT).. .................... 77
Figure 4.3. Effects of iron injection dosage on red blood cell count (RBC).. .................. 78
Figure 4.4. Effects of iron injection dosage on white blood cell count (WBC).. ............. 79
Figure 4.5. Effects of iron injection dosage on mean corpuscular volume (MCV).. ........ 80
Figure 4.6. Effects of iron injection dosage on mean corpuscular hemoglobin (MCH). .. 81
Figure 4.7. Effects of iron injection dosage on mean corpuscular hemoglobin
concentration (MCHC).. ................................................................................................... 82
Figure A.1. Effects of iron injection dosage on hemoglobin concentration (Hb) during the
preweaning period. ...........................................................................................................135
Figure A.2. Effects of iron injection dosage on hemoglobin concentration (Hb) during the
postweaning period. ........................................................................................................ 136
Figure A.3. Effects of iron injection dosage on hematocrit content (HCT) during the
preweaning period. .......................................................................................................... 137
Figure A.4. Effects of iron injection dosage on hematocrit content (HCT) during the
postweaning period. ........................................................................................................ 138
Figure A.5. Effects of iron injection dosage on red blood cell count (RBC) during the
preweaning period ........................................................................................................... 139
Figure A.6. Effects of iron injection dosage on red blood cell count (RBC) during the
postweaning period. ........................................................................................................ 140
Figure A 7. Effects of iron injection dosage on white blood cell count (WBC) during the
preweaning period. .......................................................................................................... 141
xiii
Figure A.8. Effects of iron injection dosage on white blood cell count (WBC) during the
postweaning period. ........................................................................................................ 142
Figure A.9. Effects of iron injection dosage on mean corpuscular volume (MCV) during
the preweaning period. .................................................................................................... 143
Figure A.10. Effects of iron injection dosage on mean corpuscular volume (MCV) during
the postweaning period. .................................................................................................. 144
Figure A.11. Effects of iron injection dosage on mean corpuscular hemoglobin (MCH)
during the preweaning period.. ....................................................................................... 145
Figure A.12. Effects of iron injection dosage on mean corpuscular hemoglobin (MCH)
during the postweaning period.. ...................................................................................... 146
Figure A.13. Effects of iron injection dosage on mean corpuscular hemoglobin
concentration (MCHC) during the preweaning period. .................................................. 147
Figure A.14. Effects of iron injection dosage on mean corpuscular hemoglobin
concentration (MCHC) during the postweaning period. ................................................. 148
1
CHAPTER 1. Introduction
Piglets are born with a very limited iron reserve and obtain only negligible amounts
of iron through the sow milk. Traditionally they could obtain this iron requirement
through contact with the soil. However, over the past several decades the swine industry
has transitioned from more of an extensive production approach such as rearing pigs on
pasture to a more intensive production system of raising pigs in a confined, indoor
facility. The transition in production methods has led to one of the largest nutritional
issues of iron deficiency leading to anemia in modern swine production. Consequently,
iron deficiency and anemia have been extensively researched and believed to be
preventable through an administration of an exogenous supply of iron usually in the form
of an intramuscular injection of 100 to 200 mg iron dextran shortly after birth (NRC,
2012).
However, with modern genetics, increased productivity levels, and rapid growth
performances there have been concerns regarding the adequacy of the early-life iron
injection. Modern research suggests that hemoglobin is the gold standard indicator of iron
status and that optimal levels of hemoglobin concentration (> 11 g/dL) at weaning may
lead to improved growth performance in the subsequent nursery period (Gillespie, 2019).
Research from the United States, Denmark, and Canada all have shown that following an
initial iron injection at birth, there were pigs within a herd at weaning that had
hemoglobin concentrations below the optimal level and in some cases severely below (<
8 g/dL) indicating an anemic state (Bhattarai and Nielsen, 2015; Jolliff an Mahan, 2011;
Perri et al., 2016). This decreased iron status at weaning following an initial supplement
2
of iron at birth has been shown to be more applicable to the larger pigs at weaning
(Bhattarai and Nielsen, 2015; Jolliff and Mahan, 2011). Pigs with low hemoglobin
concentration (< 8 g/dL) at weaning had a reduced BW at 21d-postweaning, in addition,
there was a greater incidence of piglets with hemoglobin concentrations in the anemic
category 3 weeks postweaning compared to weaning (Perri et al., 2016). The low iron
status at weaning can be contributed by many factors such as low birth iron reserves, low
iron content in sow milk, rapid weight gain, increased blood volume, etc.; regardless it
must be corrected to optimize postweaning health status as well as overall growth
performance. Therefore the objective of the present research was to assess the iron status
of young pigs from the University of Kentucky swine herd (Chapter 3), evaluate the time
course of the blood profile during pre and postweaning periods (Chapter 4), and evaluate
the effects of an additional iron injection administered before weaning on postweaning
performance (Chapter 5).
3
CHAPTER 2. Literature review
2.1 Changes and challenges of swine production
The use of contemporary genetic analysis has led to hypotheses that the modern
domesticated pig originated from the Eurasian wild boar (Sus scrofa) around 500,000
years ago (Giuffra et al., 2000). Many years after, wild pigs began to become
domesticated for a reliable and efficient source of protein. It is thought that domestication
occurred around 9,000 years ago (Bökönyi, 1974; Larson et al., 2011). Ever since
domestication, pigs have continuously been raised as a source of protein and energy for
human consumption. Beginning in the 1920’s changes in swine management practices
resulted in the start of farrowing sows inside on concrete floors rather than on a pastured
or dirt lot. Previous production systems that utilized pastured lots allowed pigs to root
through the soil which can be a rich source of minerals, microbes, and other nutrients.
This more extensive production system demanded more labor. The change in
management systems was thought to be an attempt to increase the efficiency of labor,
animal management, animal comfort, and maximize production potential (Cunha, 1977).
Shortly after producers realized the benefits of rearing pigs indoors, it became the
standard method to produce pigs. Raising pigs in an indoor confinement setting also
allowed producers to raise more pigs, completing the transition to a more intensive
production approach. From 1977 to 2012, there were strong trends of increasing pig
density within herds, which is defined by the increase in average head per operation and
decrease in the total operations supporting the transition to a more intensive confinement
approach (USDA, 2012). However, the change has led to a large nutritional issue with
iron deficiency leading to anemia in modern swine production.
4
2.2 Iron deficiency anemia
Iron deficiency and anemia associated with iron deficiency are one of the most
common nutritional deficiencies found worldwide, and often seen in humans with an
inadequate nutrition regimen (Camaschella, 2017). Over the years, iron deficiency
anemia has been classified into three stages. First, iron reserves (ferritin) in the liver,
spleen, and bone marrow are depleted which leads to a decrease in the ferritin levels in
circulating plasma. The second stage, which is defined by a decrease in transferrin
(transport protein) saturation, and conversely increasing the expression of transferrin
receptors on cells. Finally, due to the lack of transport and supply of iron, the
hemoglobin concentration becomes inadequate for the red blood cells making them
microcytic and hypochromic (Dallman, 1986). This last stage of iron deficiency is where
anemic conditions become prevalent and by this time there is a multitude of problematic
issues (i.e. decreased metabolic capacity and immune function). In an anemic state,
hemoglobin, hematocrit, and mean corpuscular volume (MCV) are all affected because
normal red blood cells are replaced by microcytic and hypochromic red blood cells
(Naghii and Fouladi, 2006). Microcytic anemia is the presence of smaller sized red blood
cells (Massey, 1992). Hypochromic anemia is when the red blood cells appear less red
due to the reduced amount of hemoglobin in the blood cells which contributes to the red
color. These two anemia characteristics are often seen together due to the size reduction
of the blood cell decreasing the amount of hemoglobin it is capable of carrying (making it
paler). Due to the lack of iron carrying capacity of the red blood cells, blood flow is
redistributed to the heart and brain at the expense of the other tissues to maintain the
5
oxygen supply (Dallman, 1986). When anemia becomes more serious and left untreated,
other physiological changes develop including the indication of cardiac hypertrophy
(Dallman, 1986).
2.2.1 Iron deficiency anemia in swine
Pigs, being biologically similar to humans, also suffer from iron deficiency
anemia. Neonatal pigs are the most susceptible to iron deficiency and are the only
mammalian species in which neonatal iron deficiency commonly occurs (Szudzik et al.,
2018). Iron deficiency anemia in suckling piglets is commonly characterized as
hypochromic, microcytic anemia which is similar to human iron deficiency anemia
(Szudzik et al., 2018). Iron deficiency anemia in pigs was present in the early 1920s,
where early researchers noted the occurrence of anemia when sows were taken off of
pasture and placed in a concrete-floored house during farrowing (McGowan and
Crichton, 1924). However, earlier production systems that reared pigs outdoors could
meet the iron requirement from the pigs rooting the ground. The soil is a substantial
source of iron because of the interactions of crystalline iron interacting with plants,
microbes, and organic substances making it soluble (Colombo et al., 2014).
2.2.2 Piglets iron requirement
Like all living organisms, pigs need iron. Early work suggests that piglets need
around 7 mg of iron per day to refrain from becoming anemic (Venn et al., 1947). It is
well understood that piglets have a rapid growth rate, usually gaining several times their
birth BW during the first few weeks of life. As a result of this growth, the blood volume
of piglets is increased by 30% during the first week of life (Jain, 1986). It also has been
found that the heavier or faster-growing piglets had lower hemoglobin and hematocrit
6
than smaller sized pigs by 17 days of life (Jolliff and Mahan, 2011). The rapid growth
rate of young pigs puts a great demand on the erythropoietic system to maintain proper
function (Holter et al., 1991). Therefore, taking into account the growth of piglets, work
by Braude et al. (1962) estimated that for every kilogram of body weight increase, the
piglet must retain 21 mg of iron to maintain a healthy level of body iron. However, later
studies indicated that the piglet’s requirement for iron during the lactation period can be
up to 67 mg of iron for every kg of body weight gain (Kamphues et al., 1992).
Conversely, a later study found that piglets needed around 35 to 40 mg of iron for every
kg of weight gain in order to maintain normal hemoglobin concentrations (Egeli and
Framstad, 1998). While the iron requirement of piglets can vary depending on a
multitude of factors (i.e. birth stores, growth rate, etc.), it has been well noted that the
iron status of piglets can be associated with weaning weight and postweaning
performance. To maximize performance, a growing pig should have blood hemoglobin
concentrations over 11 g/dL (Gillespie, 2019).
2.2.3 Assessing iron deficiency anemia in swine
Critical values for assessing iron deficiency can be crucial to producers and
veterinarians by identifying early indicators of iron deficiency or disease. However, there
can be a great amount of variation and the reference values most likely are dependent on
the life stage of the pig often making them misleading. In piglets, iron deficiency anemia
is most commonly assessed using hemoglobin concentration. Clinical iron deficiency
anemia is defined as hemoglobin less than 9 g/dL, sub-clinical iron deficiency anemia if
hemoglobin concentration is between 9 to 11 g/dL, and normal if it is greater than 11
g/dL (Von der Recke and Heisel, 2014; Fredericks et al., 2018; Gillespie, 2019). Another
7
common method of evaluating iron status is through a complete blood count (CBC). A
complete blood count measures hemoglobin concentration (Hb), hematocrit (HCT), red
blood cell count (RBC), white blood cell count (WBC), mean corpuscular volume
(MCV), mean corpuscular hemoglobin (MCH), and mean corpuscular hemoglobin
concentration (MCHC). Hemoglobin concentration is the total amount of hemoglobin in
the blood while RBC and WBC are the number of red and white blood cells in a given
concentration of blood, respectively. Hematocrit is the fraction of blood that is made of
red blood cells. Mean corpuscular volume is a measure that indicates the size of the red
blood cell. Mean corpuscular hemoglobin is the amount of hemoglobin in red blood cells
compared to MCHC which is the amount of hemoglobin relative to the size of the red
blood cell (Sarma, 1990).
2.3 Maternal iron contribution to piglets
2.3.1 Fetal iron development
The fetus lives in the maternal uterus for around 114 days where it will undergo many
changes. During this time, the fetus is relying solely on the sow to provide it with many
nutrients, including iron that it requires following birth. Iron has to be transported across
the maternoplacental barrier via endometrial secretions of uteroferrin (Renegar et al.,
1982; Roberts and Bazer, 1988). Uteroferrin is a glycoprotein that contains and transports
iron from the uterus to the developing fetus (Bazer et al., 1975; Roberts and Bazer, 1980).
However, the transfer of large molecules like glycoproteins across the placenta is limited
in the pig (Hemmings and Brambell, 1961). Iron can also be transferred directly to the
fetus by blood through the epitheliochorial placenta, but the rate is also very limited
(Douglas et al., 1972). Iron accretion in the developing fetus has been observed to
8
increase with gestational age. Mahan et al. (2009), found that iron deposition had a
quadratic increase from 45d post-conception to birth and the largest increase occurred
during the last 15 d of gestation. Although the body composition of an individual piglet
will vary, the amount of iron that piglets are born with is estimated to be around 50 mg of
iron (Venn et al., 1947). In newborn pigs, the body iron reserves are largely dependent on
the litter size of the sow. An increase in litter size causes a reduction in body iron in
individual fetal pigs (Mahan et al., 2009). Physiologically, it is difficult for the sow to
adequately distribute iron to each individual fetus (Svoboda and Drabek, 2005).
There have been several attempts to increase fetal iron status through the nutrition of
the sow. However, manipulating the diet of the sow by supplementing organic or
inorganic iron or increasing dietary iron levels has been very inconclusive in terms of
altering fetal iron status. Piglets from sows fed an organic source of iron (chelated to
hydrolyzed soy protein, Bioplex TM premix) had significantly lower hemoglobin levels
at birth and 2 days following birth in comparison to sows fed an inorganic source of iron
(salt form as ferrous sulfate) (Peters and Mahan, 2008). In disagreement, more recent
work demonstrated that increasing the dietary level of iron using an organic source
(ferrous glycine chelate) was found to increase organ weights and hematological
parameters of neonatal piglets compared to an inorganic source of iron (ferrous sulfate)
(Li et al., 2018).
Affecting the iron reserves of fetal piglets could involve more than simply altering the
dietary level of iron for a sow. Although it is clear that many nutrients cross the
epitheliochorial placenta from the sow to the developing fetuses, the past research
9
suggests that there may be an insufficiency of the molecular mechanism for iron transport
(Szudzik et al., 2018).
2.3.2 Sow milk
Once born, sow colostrum and milk are the sole source of nutrients for piglets.
Depending on the litter size it is estimated that a nursing pig only receives around 1 mg
of iron per day from maternal milk (Venn et al., 1947). However, as litter size increases,
the amount of milk and iron per pig decreases. Compared to other nutrients in the milk,
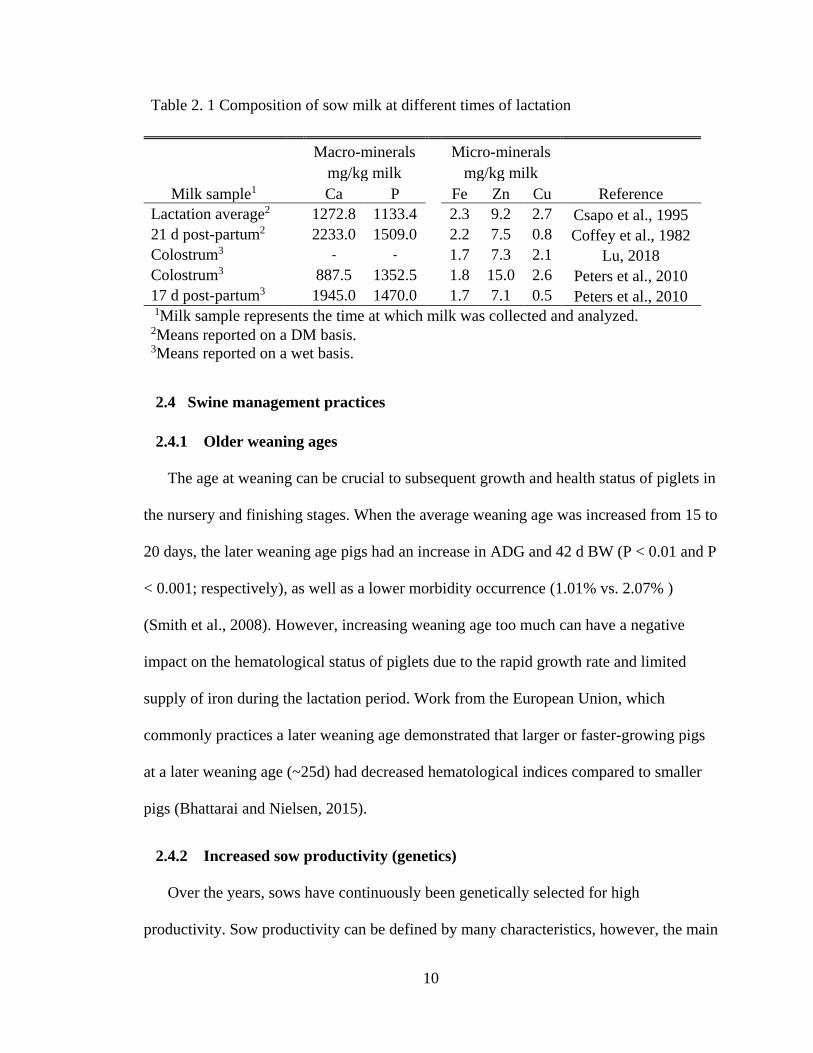
the concentration of iron is minimal. Table 2.1 represents some of the macro and micro
mineral contents of sow milk found throughout the literature. The mineral concentration
of the sow milk is typically known to increase gradually until week two post-partum,
where it then remains constant (Hurley, 2015). There have been numerous studies
investigating milk composition of sows fed supplemental dietary iron; however, the
effects of iron concentration were minuscule (Venn et al., 1947; Pond et al., 1965; Veum
et al., 1965). In one scenario, dietary supplementation of ferrous sulfate at an inclusion
rate higher than the NRC estimates (120 mg/kg Fe vs. 80 mg/kg Fe) led to a decline in
iron content of the milk during the lactation period compared to the NRC amount (Wei et
al., 2005). It has also been found that high lactating sows (that produce faster-growing
piglets) had a lower milk iron content compared to sows with lower milking production,
indicating that high milk production may dilute the iron concentration of the milk (Elliott
et al., 1971).
10
Table 2. 1 Composition of sow milk at different times of lactation
Milk sample1
Macro-minerals Micro-minerals
Reference mg/kg milk mg/kg milk
Ca P Fe Zn Cu
Lactation average2 1272.8 1133.4 2.3 9.2 2.7 Csapo et al., 1995
21 d post-partum2 2233.0 1509.0 2.2 7.5 0.8 Coffey et al., 1982
Colostrum3 - - 1.7 7.3 2.1 Lu, 2018
Colostrum3 887.5 1352.5 1.8 15.0 2.6 Peters et al., 2010
17 d post-partum3 1945.0 1470.0 1.7 7.1 0.5 Peters et al., 2010
1Milk sample represents the time at which milk was collected and analyzed. 2Means reported on a DM basis. 3Means reported on a wet basis.
2.4 Swine management practices
2.4.1 Older weaning ages
The age at weaning can be crucial to subsequent growth and health status of piglets in
the nursery and finishing stages. When the average weaning age was increased from 15 to
20 days, the later weaning age pigs had an increase in ADG and 42 d BW (P < 0.01 and P
< 0.001; respectively), as well as a lower morbidity occurrence (1.01% vs. 2.07% )
(Smith et al., 2008). However, increasing weaning age too much can have a negative
impact on the hematological status of piglets due to the rapid growth rate and limited
supply of iron during the lactation period. Work from the European Union, which
commonly practices a later weaning age demonstrated that larger or faster-growing pigs
at a later weaning age (~25d) had decreased hematological indices compared to smaller
pigs (Bhattarai and Nielsen, 2015).
2.4.2 Increased sow productivity (genetics)
Over the years, sows have continuously been genetically selected for high
productivity. Sow productivity can be defined by many characteristics, however, the main
11
assessment is the number of pigs weaned per litter, per year. The United States, behind
China, and the European Union is the third-highest pork producing region in the world
with around 11% of the total global production (FAS, 2019). Sow productivity in terms
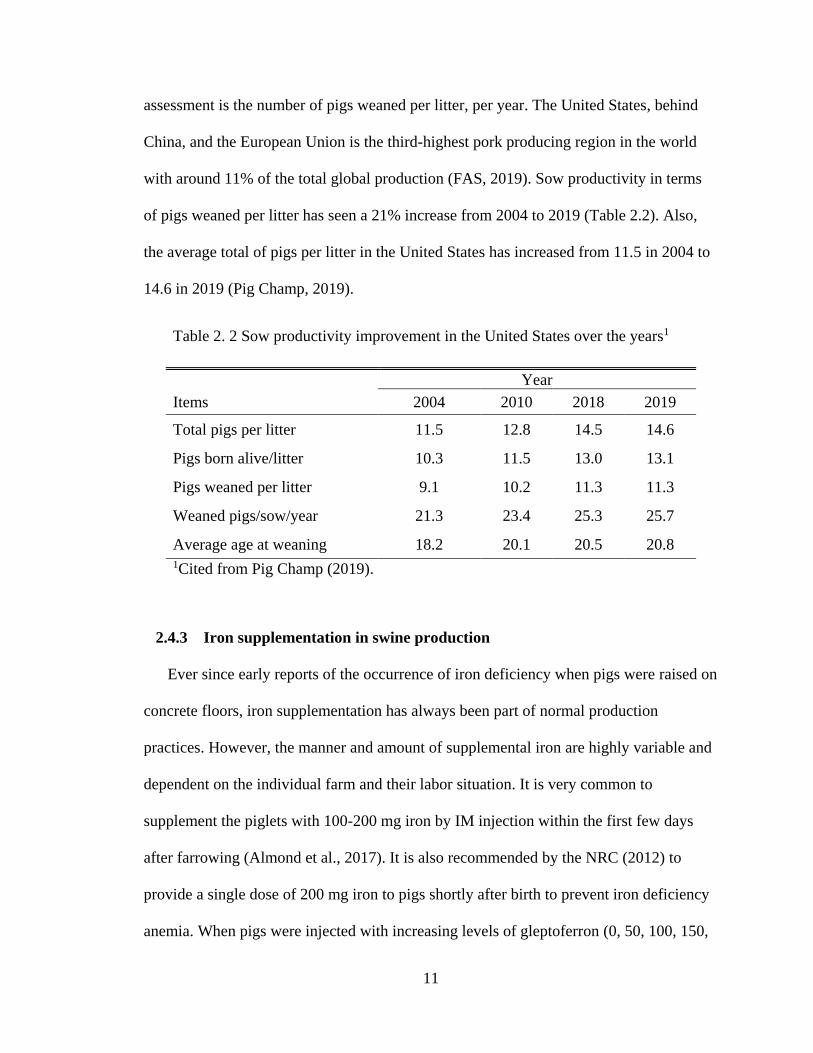
of pigs weaned per litter has seen a 21% increase from 2004 to 2019 (Table 2.2). Also,
the average total of pigs per litter in the United States has increased from 11.5 in 2004 to
14.6 in 2019 (Pig Champ, 2019).
Table 2. 2 Sow productivity improvement in the United States over the years1
Year
Items 2004 2010 2018 2019
Total pigs per litter 11.5 12.8 14.5 14.6
Pigs born alive/litter 10.3 11.5 13.0 13.1
Pigs weaned per litter 9.1 10.2 11.3 11.3
Weaned pigs/sow/year 21.3 23.4 25.3 25.7
Average age at weaning 18.2 20.1 20.5 20.8
1Cited from Pig Champ (2019).
2.4.3 Iron supplementation in swine production
Ever since early reports of the occurrence of iron deficiency when pigs were raised on
concrete floors, iron supplementation has always been part of normal production
practices. However, the manner and amount of supplemental iron are highly variable and
dependent on the individual farm and their labor situation. It is very common to
supplement the piglets with 100-200 mg iron by IM injection within the first few days
after farrowing (Almond et al., 2017). It is also recommended by the NRC (2012) to
provide a single dose of 200 mg iron to pigs shortly after birth to prevent iron deficiency
anemia. When pigs were injected with increasing levels of gleptoferron (0, 50, 100, 150,
12
and 200 mg Fe) at d 3 post-partum there was a linear increase in ADG for the 21 d
lactation period (Williams et al., 2018). Gleptoferron is similar to iron dextran as it is a
macro-molecule complex that contains iron.
2.5 Current issues in the swine industry
In today’s swine industry, pigs have been continuously selected for high performance
resulting in a rapid growth rate following birth. It is thought that pigs that undergo a more
rapid growth rate in the nursing phase are at a greater danger of becoming iron deficient
and even anemic (Svoboda and Drabek, 2005). Assessing the iron status of piglets at
weaning (17 days of age) showed that as body weight increased both hemoglobin and
hematocrit decreased (Jolliff and Mahan, 2011). Subsequently, a study involving pigs
from 11 different farms that administered 200 mg of iron to pigs found that 75% of the
pigs were either sub-clinically (Hb = 9-11 g/dL) or clinically iron-deficient anemic (Hb <
9 g/dL) around weaning (Von der Recke and Heisel, 2014). A report from 5 commercial
Danish farms showed that larger pigs had lower (P < 0.05) serum-Fe than smaller pigs
(Bhattarai and Nielsen, 2015). More recent work in Canada, also found that larger pigs at
weaning had lower hematological measures (Perri et al., 2016).
Iron deficiency at weaning can be exacerbated because of the weaning stress and
cause an “iron gap”. An iron gap occurs when faster-growing piglets reach low
hemoglobin concentrations before weaning and it gets lower with the weaning transition
stress (Gillespie, 2019). Weaning pigs with a low iron status can be costly in the
subsequent growing periods. Pigs that were classified anemic (Hb < 9 g/dL) at weaning
were 0.82 kg lighter at 21d-postweaning than non-iron deficient pigs (Perri et al., 2016).
Under Norwegian production conditions (later weaning age), piglets with access to a high
13
iron creep feed had relatively low hemoglobin concentrations around 21 and 35 days
(10.2 and 10.1 g/dL, respectively) after birth which was later confirmed by later studies
(Egeli and Framstad, 1998; Egeli et al., 1998). Mean corpuscular volume (MCV), mean
corpuscular hemoglobin (MCH), and mean corpuscular hemoglobin concentration
(MCHC) were all declining from 17 to 21 days after piglets received an initial iron
injection (180 mg Fe) after birth (Holter et al., 1991). Holter et al. (1991) also reported
that pigs administered the iron at birth had smaller erythrocytes on d 21, suggesting that
an iron injection given at birth may be insufficient to sustain normal production of
erythrocytes limiting hemoglobin synthesis after 21 days.
Although pigs were administered 200 mg iron shortly after birth in the forms of iron
dextran and gleptoferron, Morales et al. (2018) observed a decrease in both serum iron
and serum ferritin from days 14 to 17, subsequently, serum ferritin also decreased from
17 to 21 days of age. This data possibly suggests that an initial 200 mg iron injection
given at birth only supplies iron to the pig until 14 to 17 days of age. Van Gorp et al.
(2012) estimated that a single iron injection (200 mg iron) will only cover approximately
4 kg of growth for a suckling pig. Furthermore, they proposed a theoretical model that
estimated 390 mg iron would be needed to prevent a pig from becoming iron deficient
before weaning. Under these assumptions, it is hypothesized that piglets that grow faster
will fall into a period of iron deficiency, in which the total weight gain exceeds the
available iron reserves (Van Gorp et al., 2012). This period of iron deficiency often
comes around the weaning time which can escalate the problem because of the low feed
intake by the pig due to the stress associate with the first several days after weaning.
14
However, optimizing iron status can have beneficial effects. At weaning, pigs
classified in the optimal hemoglobin range (> 11 g/dL) had a higher (P < 0.05) body
weight at 8 weeks postweaning compared to pigs from the sub-clinical anemia (9-11
g/dL) and clinical anemia (<9 g/dL) status categories (Fredericks et al., 2018). Increasing
hemoglobin levels to reach an optimal range is thought to have positive effects on the
growth performance and overall well-being of piglets because of the potential to improve
oxygen transport, immune function, and metabolism support (Von der Recke and Heisel,
2014). Iron status can also have other added benefits other than its role in the
erythropoietic system. Pigs that had higher hemoglobin concentration at 4 weeks of age
had a higher energy intake as well as energy retention compared to pigs which had lower
levels of hemoglobin concentration (Gentry et al., 1997).
2.6 Addressing the iron issue
2.6.1 Greater initial dose of iron
Attempting to correct for low iron status in the pre-weaning period, it is logical to
increase the dosage of the iron injection at processing. Research implementing this
strategy demonstrated that increasing the initial iron injection from 200 mg to 300 mg of
iron resulted in no detrimental effects, numerical increases in hematological status, but no
effects on growth performance (Murphy, 1997). Similar work also showed that pigs
receiving 300 mg compared to 200 mg of iron shortly after birth only had minor
numerical increases in hematological indices but no response in growth performance
through 4 weeks of age (Gaddy et al., 2012).
15
2.6.2 Addition of a second iron injection
Another attempt to correct low iron status at weaning and maximize growth
performance in the subsequent growing period is to give an additional iron injection.
Early work showed that pigs that received an additional 200 mg iron injection at d 21 of
life had 4.3% higher weight gain than pigs not receiving the second injection. Once
weaned at 28 days, the pigs injected twice had an 8% higher weight gain than those with
only one injection during a 3 week nursery period (Kamphues et al., 1992). Later, it was
demonstrated that pigs weaned at 34 days of age that received an additional 200 mg iron
injection at d 20 of lactation led to higher hemoglobin levels and a 6% increase in ADG
for the first 15 days of the nursery (Haugegaard et al., 2008). Pigs receiving 200 mg of
iron at birth compared to pigs receiving 200 mg of iron at birth plus an additional 100 mg
of iron at 10 d of age had higher (P < 0.01) hemoglobin and hematocrit levels by 17 days
of age (Jolliff and Mahan, 2011). The addition of a second 100 mg iron injection before
weaning resulted in numerically higher feed intake and ADG during the first three weeks
of the nursery which led to a slightly heavier final BW of 0.7 kg heavier (Jolliff and
Mahan, 2011). Agreeing with the previous research, the addition of a second 200 mg iron
injection improved (P < 0.01) hemoglobin concentrations but there were no differences
(P > 0.05) observed between treatments on ADG (Perrin et al., 2016). Another study also
demonstrated an increase (P < 0.05) in hemoglobin concentration at 21 and 35 days of
age for pigs receiving an additional iron injection at d 11 compared to pigs only receiving
one iron injection on d 3 (Williams et al., 2018). On the other hand, administering a
second iron injection at weaning only improved the ADG of pigs that were classified as
larger (weaning BW > 6 kg), in comparison to the larger pigs that only received the initial
16
iron injection at processing (Urbaniak et al., 2017). Almond et al. (2017) reported in a
case study that a farm that used a two-injection approach had greater weight gains
through 30 days of the experiment compared to the farms that only used a single
injection. More recently, pigs that were supplied 200 mg iron at birth and another 200 mg
at processing (5-7d) had higher (P < 0.05) hemoglobin concentration at weaning
compared to pigs receiving only a single 200 mg or pigs receiving 100 mg at birth and
100 mg at processing (Fredericks et al., 2018). It is thought that using a second injection
optimizes hemoglobin and iron status of the pigs which could possibly promote peak
immunity or an increased health status (Perrin et al., 2016). This was supported in earlier
work, where pigs under positive disease conditions (postweaning multisystemic wasting
syndrome or PMWS), that were given a second iron injection five days before weaning
(~28d), had an ADG of 50 g/d more than the single injected piglets (Bach, 2006).
An explanation for the efficacy of a second iron injection can be explained with the
“iron gap” concept. The iron gap is when the iron stores from the initial injection at
processing and the iron that pigs are born with start to become depleted before they
receive and consume adequate amounts of a diet supplemented with iron after weaning
(Von der Recke and Heisel, 2014; Gillespie, 2019). This situation is exacerbated further
depending on the length of the nursing period and the weaning transition where feed
intake declines tremendously. Research that developed a model to estimate the economic
impact of administering a second iron injection to maximize the hemoglobin status of
weanling pigs to optimize health demonstrated an incredible potential to add value to the
current swine industry (Olsen, 2019). Olsen (2019) estimates that even with current
industry iron injection practices, the total economic impact of sub-clinical and full-scale
17
iron deficiency anemia in the United States swine herd ranges from 46.3 to 335.7 million
US dollars.
2.7 Postweaning iron supplementation
The latest edition of the NRC estimates that a growing pig (5 to 25 kg) requires 100
mg/kg Fe included in the diet (NRC, 2012). The previous version of the NRC only
estimated that growing pigs (10 to 20 kg) required 80 mg/kg in the diet (NRC, 1998). The
increased estimate from 1998 to 2012 may be explained by the increased incidence in
iron deficiency and research regarding dietary iron. Research by Rincker et al. (2004)
reported that feeding increased supplemental dietary iron (0, 25, 50, 100, and 150 mg/kg
iron) resulted in a tendency to improve ADG and ADFI (P = 0.08 and P = 0.09,
respectively) for the 35 d nursery trial. Additionally greater (P < 0.05) hemoglobin and
hematocrit values were observed on d 21 and 35 with increasing supplemental dietary
iron (Rincker et al., 2004). Another experiment that fed weaning pigs increasing levels of
dietary supplemental iron (0, 80, and 160) also showed improved (P < 0.05) ADG but no
effect on ADFI during a 35 d nursery study (Jolliff and Mahan, 2011). Although it is
recommended to supplement dietary iron in the diet of nursery pigs, there may already be
sufficient levels of iron within the ingredients used in the diet. Rincker et al. (2005)
analyzed individual dietary ingredients and found high levels of iron present in common
nursery diet ingredients like mono and dicalcium phosphate, limestone, and fishmeal
(8941, 7741, 425, and 705 mg/kg iron, respectively).
2.8 Nutritional iron
Nutritional iron and its relation to iron deficiency date back to the 1700s when it was
observed that people who were pale and listless would mix rust with a drink which would
18
restore their health (Carpenter, 1990). In 1830, Professor Pierre Blaud recommended
taking ferrous salts to aid in chlorosis (Carpenter, 1990). After many attempts to disprove
the efficacy of inorganic iron, work by Stockman (1893) proved that inorganic iron is
absorbed and seemed to be utilized more readily than organic iron. The importance of
iron was finally made clear through convincing evidence that supported inorganic iron
was needed for hemoglobin synthesis (Yip et al., 1996). Since that time iron has been
well accepted as a biologically essential element for every living organism (Aisen et al.,
2001; Lieu et al., 2001).
2.8.1 Iron storage
Iron is mainly stored in the body by storage proteins (ferritin and hemosiderin)
located in the liver, reticuloendothelial cells, spleen, and bone marrow (Dallman, 1986;
Massey, 1992). Ferritin is a storage protein that protects iron from the redox potential by
a chaperone protein, poly (rC)-binding protein (PCBP1) (Lieu et al., 2001; Camaschella
and Pagani, 2018). Ferritin consists of the ferric form of iron however, to be released for
bodily functions, ferric iron (Fe3+) is reduced to ferrous iron (Fe2+) (Casiday and Frey,
1998). Approximately 25% of iron in the body is accounted for in mobilizable iron stores
(Trumbo et al., 2001). Storage sites of iron can be almost completely depleted before
iron deficiency is noticed; in contrast, a 20-fold increase of iron stores may occur before
there is evidence of iron overload (Dallman, 1986).
2.8.2 Iron transport
In the body (plasma and tissues), virtually no iron is in the free ionic form (Strain and
Cashman, 2002). Free ionic iron acts like other free radicals which can cause oxidative
reactions resulting in damage to tissues. Due to the high occurrence of protein
19
sequestering of iron, the rate of oxidative damage to biomolecules is limited (McAnena,
2005). These proteins that bind to iron prevent oxidative damage but are also responsible
for the transport, storage, and homeostasis of iron in the body.
2.8.2.1 Transferrin and ferroportin
Transferrin is a protein carrier responsible for carrying two atoms of ferric iron
through extracellular spaces from the reticuloendothelial system and the small intestine to
the bone marrow for the synthesis of hemoglobin in developing red blood cells (Dallman,
1986; Toblli and Angerosa, 2014). Transferrin delivers iron at a rate which is dependent
upon the amount of mono- and di-ferric transferrin, as well as the frequency of red blood
cell production (Huebers and Finch, 1984). Transferrin carries ferric iron across the target
cell’s membrane where it is then released (Munoz et al., 2009). Once ferric iron is inside
the cell, ferric reductase then reduces it to the ferrous state, allowing it to be transported
to the cytoplasm by DMT-1 (Munoz et al., 2009). Ferroportin expression is also vital in
the transportation of iron for the regulation of homeostasis via its ability to traffic iron
into circulating pools from enterocytes and macrophages (Wessling-Resnick, 2010).
2.8.3 Role and function in living organisms
Iron can alternate between the divalent and trivalent states, this property is what
allows it to be so beneficial for living organisms. Ferric iron is the oxidized state of iron
(Fe3+) whereas ferrous iron is the reduced state (Fe2+). The alternation between ferric and
ferrous states, act as the functional basis for protein binding and other physiological
functions such as the redox reactions in which iron participates (McAnena, 2005).
20
2.8.3.1 Erythropoiesis
Erythropoiesis is the development of red blood cells (erythrocytes) (Beckman et al.,
2010). Erythrocytes make up the majority of the cell types in blood. Erythrocytes are first
produced in fetal animals by differentiation of erythro-myeloid progenitors in the yolk
sac and fetal liver (Dzierzak and Philipsen, 2013). The iron accumulated during
pregnancy in the fetal liver is the main source of iron used for the early stages of
erythropoiesis by the fetus (Rao and Georgieff, 2007). However, at the time of birth the
site of erythropoiesis switches from the liver to the bone marrow and spleen (Dzierzak
and Philipsen, 2013). In the case of immature or young pigs, early-in-life erythropoiesis
can occur extramedullary pushing the process to the liver and spleen (Beckman et al.,
2010).
2.8.3.2 Hemoglobin and myoglobin
Hemoglobin represents more than 65% of the iron found in the body and functions as
the transport protein that carries oxygen from the lungs to the tissues via the bloodstream
(Dallman, 1986; Munoz et al., 2009). The heme portion of hemoglobin contains iron
which acts as a coordinating ion and binds to molecular oxygen (Casiday and Frey,
1998). Iron combines with a protoporphyrin to make up the heme polypeptide.
Hemoglobin is then made up of 4 heme polypeptide chains that interlock and make a
globular protein (Ali, 1976).
Myoglobin represents about 10% of body iron and is the red pigmentation in muscle.
It is responsible for the transport and storage of oxygen during muscle contraction
(Dallman, 1986). Similar to hemoglobin, myoglobin transfers the oxygen from
hemoglobin to muscle cells and cytochromes which are used for energy (Casiday and
21
Frey, 1998). Although similar to hemoglobin, myoglobin is comprised of only 1 heme
polypeptide chain (Kendrew et al., 1960).
2.8.3.3 Energy metabolism
In the body, iron also exists as iron-sulfur clusters, which play a vital role in energy
metabolism. These non-heme iron compounds such as nicotinamide adenine dinucleotide
(NADH) dehydrogenase, succinic dehydrogenase, and xanthine oxidase, can account for
more iron present in the mitochondria than cytochromes (Dallman, 1986). Cytochromes
are similar in structure (one atom of iron) to myoglobin, they are enzymes found in the
mitochondria and are essential for the production of adenosine triphosphate (ATP)
(Dallman, 1986). The major cytochrome associated with iron is ferricreductase (Dcybt).
2.8.4 Bioavailability
2.8.4.1 Absorption and utilization
Work by Conrad et al. (2000) showed that there are two separate independent
pathways for transport and uptake of ferric and ferrous iron. Ferric iron is absorbed by a
Β3 integrin and mobilferrin pathway (IMP) that is independent of any other minerals, in
contrast to ferrous iron, which is regulated by the shared divalent metal transporter-1
(DMT-1) (Conrad and Umbreit, 2002). However, due to the continuous growth of the
gastrointestinal tract of the young pig, it is well thought that the expression of DMT-1 is
relatively low (Svoboda and Drabek, 2005). Iron absorption into the body’s circulation
requires the passage through the apical membrane, by translocation through the cytosol,
and the export across the basolateral membrane (Lieu et al., 2001). Absorption occurs in
the proximal small intestine (duodenum) (Conrad and Umbreit, 2000). It is also thought
22
that the enterocytes present in the crypts of the duodenum absorb iron from the plasma
(Munoz et al., 2009).
2.8.4.1.1 Dietary absorption
Dietary iron is made up of about 10% heme iron and 90% non-heme iron which rely
on different mechanisms for absorption (Munoz et al., 2009). Heme iron is soluble at
intestinal pH and is not influenced by dietary constituents (Conrad and Umbreit, 2000).
Heme iron precipitates under acidic conditions and is absorbed through a heme carrier
protein (HCP1) which is responsible for transporting heme across the apical membrane of
the duodenal epithelial cells (Krishnamurthy et al., 2007). After globin degradation by the
pancreatic enzymes, heme enters the intestinal absorptive cell as a metalloporphyrin and
is not competitive with non-heme iron (Conrad and Umbreit, 2000). Next, the absorptive
cell releases inorganic iron from the porphyrin ring by heme oxygenase (Raffin et al.,
1974). Once released by the absorptive cell, iron from the heme source and non-heme
iron compete for transfer from the cell into the circulating plasma (Conrad and Umbreit,
2000).
Non-heme iron is less available for absorption due to the high oxidation rate of iron
(II) to iron (III) (Spiro et al., 1967). Dietary non-heme iron is primarily in the form of
ferrous salts, which usually oxidizes to the ferric form under the acidic conditions found
in the stomach and duodenum rendering it insoluble (Conrad and Umbreit, 2000).
Absorption of non-heme iron is most prevalent in intestinal villi as the soluble ferrous
ions are low-molecular-weight ligands which are facilitated by the acidic conditions of
the stomach (Hunt, 2005). However to become available for absorption the ferric state of
iron has to be reduced to ferrous through the Dcytb or chelated before DMT-1 moves it
23
across the intestinal epithelium (Munoz et al., 2009). DMT1 transports iron across the
electrochemical gradient and apical membrane of the enterocytes through a proton
cotransport mechanism (Pietrangelo et al., 1992; Fleming et al., 1997; Shawki et al.,
2012).
2.8.4.1.2 Intramuscular injection absorption
Early work found that anemic piglets utilized 93% of the dose of iron dextran by 14
days after intramuscular injection, suggesting that an intramuscular injection has a high
and rapid absorption rate (Martin et al., 1955). After administration of an iron-
carbohydrate complex (iron dextran), the complex mixes with plasma and enters the
reticuloendothelial system (RES) via an intravascular fluid compartment (Danielson,
2004). Once in the RES, phagocytes from the liver, spleen, and bone marrow collect the
iron agent and release it from the iron-binding compound (Danielson, 2004). Ferrous iron
is cleaved via the endosome fusing with the lysosome creating an acidic and reducing
environment allowing DMT-1 to transport it across the endolysosomal membrane to enter
the iron pool found in the macrophage cytoplasm (Geisser and Burckhardt, 2011).
Microscopic analysis of liver sections showed heavy non-heme iron accumulation in the
liver of pigs as soon as 5 days after injection of iron dextran, however, the iron deposits
decreased as piglet body weight increased (Pu et al., 2018).
2.8.5 Regulation and homeostasis
Iron homeostasis is tightly regulated due to the toxicity and cell death from free
radical formation and lipid peroxidation that is associated with iron overload (Britton et
al., 1994). Iron is highly recycled and is negligibly excreted through major bleeding,
urination, defecation, and sloughing of skin cells (Casiday and Frey, 1998). Because of
24
this, the absorption of dietary iron is strictly regulated on the basis of homeostasis within
the body (Siah et al., 2006). To maintain iron homeostasis, iron uptake, transport, storage,
and utilization is all controlled by intracellular iron levels through a feedback regulatory
mechanism that uses specific mRNA-protein interactions in the cytoplasm (Lieu et al.,
2001). For example, mucosal absorption of iron from the lumen is regulated by the
concentration of iron within the absorptive cell (Conrad and Umbreit, 2000). For the
regulation of circulating iron in the blood, ferritin can release iron when there is a
shortage of circulating iron and can also store iron when there is an abundance (Casiday
and Frey, 1998). Tight regulation of iron homeostasis was supported in work showing
that increasing dietary iron intake can increase overall iron absorption, however it
reduces the efficiency of iron absorption (Werner et al., 1982).
2.8.5.1 Iron toxicity
Iron toxicosis is not a common problem seen in most domestic animals as iron is
highly regulated and absorption is dependent on the need of the animal. Nonetheless, in
extreme scenarios where iron is in abundance, signs of iron toxicosis can occur when an
iron overload of tissues and iron-binding capacity is exceeded, allowing free ionic iron to
cause peroxidative damage in tissues and membranes (NRC, 2005). The NRC (2005) has
set a maximum tolerable level of dietary iron at 3000 mg/kg for swine which is defined as
the dietary level that when fed for a defined period of time will not impair accepted
indices of animal health and performance. However, most iron toxicosis research is
focused on orally or dietary amounts of iron in contrast to parenteral iron
supplementation such as an intramuscular (IM) injection.
25
There is a large concern that high levels of injectable iron may influence bacterial
growth. Ku et al. (1983) found that after administering a 150 mg intramuscular (IM) iron
injection to piglets, serum iron drastically increased by 6 hours and peaked at 24 hours
where it then declined sharply at 4 days suggesting that iron is well absorbed after an IM
injection and is removed from the serum about 1 day after the injection where it is readily
available for hemoglobin synthesis or spleen and liver iron storage. Furthermore, work by
Knight et al. (1983) demonstrated that after an IM injection of either 100 or 200 mg iron
as iron dextran, serum iron peaked at 8 hours for the 100 mg iron treatment in contrast to
the 200 mg iron treatment which peaked at 16 hours. More importantly, there was a
clearance of 90% of the peak serum iron concentration by d 2 and 4 respective of the
treatment, suggesting that the rate of serum iron clearance is dependent on the amount of
iron injected. In a different experiment looking at the relation of serum iron and bacterial
growth, Knight et al. (1983) reported that pigs injected with 200 mg iron dextran
exhibited much higher (P < 0.01) E. coli growth in the serum only on day 1 after injection
compared to serum from pigs injected with 100 mg iron dextran. On days 3, 5, 7, 9, and
11 there were no differences in serum bacteria growth between the 100 and 200 mg iron
dextran treatments.
Lipiński et al. (2010) showed that piglets that were supplemented with high levels of
iron dextran (100 mg Fe/ kg BW) were found to have improved hematological indices but
also exhibited large iron deposits in hepatic macrophages as well as fully saturated levels
of ferritin in the liver which could possibly indicate the onset of iron overload.
Parenteral iron toxicity has been noted for piglets born from sows fed inadequate
levels of vitamin E and selenium (Velásquez and Aranzazu, 2004). Piglets from these
26
sows showed signs of toxicity (hypothermia, anorexia, and oliguria) as early as 6 hours
after administration of 200 mg iron dextran which led to an 80 % mortality incidence.
Patterson et al. (1969) demonstrated that an iron dextrose injection (47 mg iron/ kg
BW) administered to piglets that were vitamin E deficient resulted in an increase in
muscle peroxides that were twice the levels of those observed before the injection,
indicating that the iron injection initiated degenerative myopathy through peroxidative
damage to muscle. It was also suggested that iron toxicity in piglets is exacerbated by a
vitamin E deficient state as skeletal muscle has an increased affinity for iron. Notably, the
experiment by Patterson et al. (1969) used iron dextrose rather than iron dextran, which
iron dextrose was observed to be absorbed more rapidly than iron dextran and there is a
reduced risk of iron toxicity when iron dextran is administered as iron is tightly bound to
the larger polysaccharide molecule. Later work by Patterson et al. (1971) resulted in
similar findings to previous work as degenerative myopathy was observed through
stainable iron deposits (Prussian blue method) in the cytoplasm and nuclear membrane of
affected muscle fibers as well as reticuloendothelial cells.
Kadis et al. (1984) showed that piglets challenged with Escherichia coli (E. coli) after
receiving an iron injection (200 mg iron dextran) either 30 minutes or 2 days after birth
resulted in a numerical increase in mortality compared to piglets that were not challenged
with E. coli but administered iron injections. The higher mortality that was observed was
likely due to the greater incidence of diarrhea that was observed with iron injected pigs
challenged with E. coli. Altogether, iron is cleared from the circulating serum and
deposited in storage sites rather quickly. However, in situations of vitamin E or selenium
deficiency, high levels of iron may be detrimental to pigs and cause iron overload.
27
2.8.5.2 Hepcidin
Hepcidin is a key negative regulator in iron metabolism that is found in liver
hepatocytes (Ganz, 2003). It aids in iron homeostasis by inhibiting iron influx into the
plasma from the duodenal enterocytes, macrophages that recycle iron, and hepatocytes
that store iron by binding and degrading ferroportin (Nemeth et al., 2004b; Nemeth and
Ganz, 2006). Also by controlling the expression of ferroportin on the basolateral
membrane, hepcidin can control the rate of iron absorption (Munoz et al., 2009).
Hepcidin production is elevated by iron and inflammation whereas it is reduced in
anemic and hypoxic states (Nemeth and Ganz, 2006). Rivera et al. (2005) showed the
regulating effect of hepcidin by injecting mice with a synthetic form of hepcidin and
finding that as early as 1-hour post-injection there was a significant decrease in serum
iron.
2.8.6 Immune function
Iron is a crucial element for its role in immune development by promoting growth for
immune cells and its close relation with cell-mediated immune responses and cytokines
(Wessling-Resnick, 2010; Pu et al., 2018). Anemia of inflammation or hypoferremia is a
decrease of iron in the serum and is associated with obstruction of systemic iron
homeostasis caused by the hepcidin antimicrobial peptide (HEPC) (Nemeth et al., 2004a;
Roy et al., 2007). Hepcidin synthesis is greatly increased under infectious and
inflammatory conditions, in turn decreasing iron absorption and becoming the key factor
to anemia of inflammation (Nemeth and Ganz, 2006). Hepcidin has antimicrobial
properties but its ability to decrease circulating iron which is a growth factor for invading
pathogens is thought to be more beneficial to the body (Pagani et al., 2011). Work done
28
in mice that were in an iron-deficient state where hepcidin levels are low, had a higher
inflammatory response to LPS (Pagani et al., 2011).
2.9 Nutrient interactions
2.9.1 Non-competitive and competitive inhibition
Dietary interactions between minerals often occur in the alimentary canal. It is widely
accepted that inorganic substances with similar chemical properties will interact greatly
with each other because of the shared use of absorption channels resulting in competition
or coadaptation (Hill and Matrone, 1970; Rosenberg and Solomons, 1982). Work by
Gunshin et al. (1997) showed a wide range of metal elements (Fe2+, Zn2+, Mn2+, Co2+,
Cd2+, Cu2+, Ni2+, and Pb2+) that DMT1 can transport.
It is thought that zinc transporter protein 14 (ZIP14) plays a role in iron transport in
hepatocytes and acinar cells under pathological conditions by moving non-transferrin-
bound-iron (NTBI) when there is an overload of iron (Camaschella and Pagani, 2018). It
is well thought that when zinc and iron are present in ionic form, there will be a
competitive interaction between the two (Solomons, 1988). The competitive interaction
between iron and zinc was demonstrated early using a zinc tolerance test which resulted
in a decrease in circulating zinc when the ratio of iron:zinc increased from 1:1 to 3:1
(Solomons and Jacob, 1981).
In addition to zinc, copper has been known to be another mineral that interacts with
the absorption of iron. Copper has very similar properties to those of iron. Copper is also
a key component for hemoglobin as it stimulates the maturation of red blood cells and
increases their survival time (Lloyd et al., 1960). More specific, copper in the form of
ceruloplasmin in circulating plasma causes ferroxidase activity to release hepatic iron for
29
hemoglobin synthesis in erythropoiesis (Miller, 1991). Ceruloplasmin is a metalloprotein
that contains eight copper atoms per molecule and is the main source of copper in the
circulating plasma. Hill et al. (1983) created copper-deficient piglets from sows fed high
levels of zinc (5000 mg/kg Zn as zinc oxide). These pigs were fed supplemental copper
diets (0, 5, or 10 mg/kg Cu as copper sulfate) at 3 to 5 days after birth and the pigs that
were fed 0 mg/kg Cu showed signs of anemia by 35 days of age with low hemoglobin
and ceruloplasmin concentrations.
Lee et al. (1968) demonstrated that administering an intramuscular injection of iron to
copper-deficient piglets did not prevent hypochromic and microcytic anemia. It was also
observed that there were iron metabolism defects in the duodenal mucosa,
reticuloendothelial system (RES), and hepatic parenchymal cells that led to an
impairment in the release and transfer of iron. However, later work by Ragan et al. (1969)
showed that the defects seen in iron metabolism associated with copper deficiency in pigs
can be reversed with an intravenous injection of ceruloplasmin. This leads to the
hypothesis that copper deficiency causes hypoceruloplasminemia resulting in an “iron
block”.
Astrup and Lyso (1986) demonstrated a reduction in hepatic copper levels compared
to control values when dietary iron was increased at levels of 20 and 40 times that of
dietary copper. Work by Klevay (2001) using rats fed low or high levels of copper in
addition to high levels of iron suggest that the copper requirement is increased when the
iron level is increased due to the low cardiac and hepatic copper concentration observed
for the low but not high copper fed rats. It has also been demonstrated that hepatic copper
levels in rodents are greater when an iron-deficient state is induced (Sourkes et al., 1968;
30
Owen, 1973). Although it is not completely understood but apparent that there are
interactions between iron and copper absorption, Collins et al. (2010) suggests that the
interactions are physiological responses for managing overall body metal levels. Calcium
can also act as a non-competitive inhibitor to iron on the interaction with DMT1,
reducing dietary iron absorption (Shawki and Mackenzie, 2010). Other dietary
constituents that could have an impact on iron absorption are phytates, carbonates,
phosphates, oxalates, and tannates which can cause ferric iron to precipitate and form
macromolecules rendering it unavailable for absorption (Conrad and Umbreit, 2000).
2.9.2 Facilitators of iron absorption
Due to the favorable redox capacity of iron, it is thought that it is better absorbed
when facilitated by other nutrients. To remain in the reduced state for absorption, ferrous
iron must rely on continuous reduction or chelation that prohibits exposure to oxygen.
Ascorbic acid is the best known reducing agent in the diet (Conrad and Schade, 1968;
Solomons, 1988). Ascorbic acid consumed in the diet helps maintain the solubility of iron
by keeping it in the reduced state (Hunt, 2005). Work by Fidler et al. (2004)
demonstrated that the addition of erythorbic acid (a stereoisomer of ascorbic acid) to the
diet at ratios 2:1 and 4:1 of iron, increased iron absorption in women by 10 and 18%.
2.10 Conclusion
Piglet health status and growth performance are critical during the pre and
postweaning periods as it is the foundation for success in subsequent periods of life. A
major contributor to this is iron status. Iron is a vital mineral that is needed to transport
oxygen throughout the body, as well as many other cellular and enzymatic functions that
are required for living organisms. Without an exogenous supply of iron given shortly
31
after birth, piglets become iron deficient and anemic. Even when iron is supplemented to
newborn piglets, there is still a chance that iron deficiency may occur depending on the
growth rate of the pig. In contrast, when the iron status is improved in pigs before
weaning, there is a greater chance for an enhanced postweaning performance which leads
to heavier pigs and fewer days to market weight. In the current swine industry, the
incidence of iron deficiency at weaning has recently been estimated to cost producers
millions of dollars (Olsen, 2019). However, the iron deficiency issue can potentially be
corrected by simply supplying more iron. To precisely correct the iron issue, additional
research is needed to truly understand the time course of iron status in piglets during
lactation, weaning, and postweaning.
Therefore, the objective of the present research was to assess and evaluate the iron
status of piglets after receiving an iron injection after birth (Chapter 3 and 4), as well as
determine the effects of an additional iron injection administered before weaning on
growth performance and iron status (Chapter 5).
32
CHAPTER 3. Assessment of the iron status of young pigs in a confinement herd
3.1 Abstract
The objective of the present experiment was to assess the iron status of the University
of Kentucky swine herd by evaluating the relationship between BW and hematological
status at various time points for young pigs. A total of 120 crossbred pigs (1 d of age;
initial BW of 1.77 ± 0.38 kg) were selected for evaluation of iron status from 1 d of age
to 35d-postweaning. Body weight and blood samples were collected at d 1, weaning (d 18
to 25), 21d-postweaning, and 35d-postweaning. All pigs were administered an
intramuscular injection of iron dextran providing 150 mg iron on d 1 of age after the
blood sample was collected. Pigs were weaned to nursery pens at an age of 18 to 25 d
where they received a common two-phase nursery diet. The nursery diet was formulated
to meet or exceed the NRC (1998) nutrient requirement estimates for energy and protein
for pigs 7 to 25 kg. Blood samples that were collected were analyzed for a complete
blood count (CBC). At weaning 50% of the pigs were below the industry hemoglobin
concentration (Hb) critical limit of 11 g/dL. In addition, at weaning there was a negative
relationship between hemoglobin concentration and BW or BW gain; indicated by the
decrease in Hb concentration as BW and BW gain increased (Hb =-0.489(BW) and Hb =
-0.659(BW gain); P < 0.0001). Following weaning, at 21d-postweaning and 35d-
postweaning there were only 2 pigs (2%) considered below the hemoglobin critical limit.
The relationship of hemoglobin concentration and BW at 21d-postweaning became
positive (Hb = 0.028 (BW); P = 0.3481) and this was even more pronounced at 35d-
postweaning where the relationship of Hb concentration and BW was more positive (Hb
= 0.101(BW); P < 0.0001). The results of this experiment indicate that at weaning there
33
are pigs in the UK swine herd that are below the critical limit of hemoglobin which may
indicate iron deficiency, however by 21d- postweaning and 35d-postweaning the
incidence is reduced greatly indicating that the iron requirement is being met by the
nursery diet. Therefore, the UK herd is suitable for the evaluation of the time course of
iron deficient anemia and the potential means to reduce or eliminate its adverse effects.
Key Words: anemia, iron deficiency, iron, pigs, weaning
34
3.2 Introduction
Pigs reared in confinement production systems have very limited sources of iron. The
sow is responsible for the provision of nutrients to her developing offspring which can
often be a hard task given that swine are litter bearing species. Consequently, piglets are
born with very low hepatic iron reserves and, to exacerbate the issue, the primary feed
source for pigs’ post-partum is sow milk which has been demonstrated to be very low in
iron (Venn et al., 1947).
For these reasons, it is a routine practice in swine production to administer a
supplemental iron source shortly after birth. Over the years the supplemental supply of
iron has often been in the form of iron dextran, as an intramuscular injection. Iron
injections generally range from 100-200 mg iron and are administered anywhere from the
time of birth to 1 week following birth (Szudzik et al., 2018). This early iron injection has
been used for numerous years to give piglets the iron supply they need until they are
weaned to a diet which will contain more iron than is contained in the milk.
However, with modern genetics, elevated productivity levels, and rapid growth
performances there have been concerns regarding the adequacy of the early-life iron
injection. Recent research has demonstrated that heavier and fast-growing piglets may
outgrow the initial iron supplement as they are susceptible to have a lower iron status at
weaning (Bhattarai and Nielsen, 2015; Jolliff and Mahan, 2011). Therefore, the objective
of the present experiment was to assess the iron status of the UK swine herd by
evaluating the relationship between BW and hematological status at various time points
for young pigs.
35
3.3 Experimental procedures
This experiment was conducted in environmentally controlled rooms at the University
of Kentucky Swine Research Center under protocols approved by the Institutional
Animal Care and Use Committee of the University of Kentucky.
3.3.1 Animals, housing, management, and experimental design
A total of 120 newborn, crossbred piglets from 13 sows [52 barrows, 68 gilts;
(Yorkshire × Landrace× Duroc)] with a mean initial BW of 1.77 ± 0.38 kg were selected
for assessment of iron status through the lactation and nursery periods. All piglets were
weighed and injected with a single intramuscular (IM) injection of iron dextran (Henry
Schein Animal Health, Dublin, OH), containing approximately 150 mg iron one d after
birth. At this time, all pigs underwent tail docking, needle teeth removal, and ear notching
procedures. There was no cross-fostering during this experiment.
Pigs on the experiment were kept in farrowing crates with their respective dams.
Farrowing crates (1.52 × 2.13 m2) were in environmentally-controlled rooms equipped
with a plastic-coated, woven wire floor, heat lamps, and nipple waterers for the sow and
piglets. Sows had ad libitum feed access through a feed trough on the front gate of the
farrowing crate. All animals had unlimited access to water, piglets were not offered creep
feed but were not restricted from the sow feed.
Piglets were weaned to a nursery site at 18 to 25 days of age. In the nursery, pigs
were placed in elevated pens (1.22 m × 1.22 m) with plastic coated, welded wire flooring.
Pigs were placed in pens based on BW, considering that stocking density is a contributor
36
to growth performance. Pens consisted of a three-hole plastic feeder and a nipple waterer
from which all pigs had ad libitum access during the 35 d nursery period.
3.3.2 Experimental diets
The diets fed in the nursery were formulated to meet or exceed the NRC (1998)
requirement estimates for energy and protein for pigs based on body weight. All pigs
were assigned to the same diet for the two nursery phases. Phase I and II diets (Table 3.1)
were fed for the first 21 days after weaning and from 21d-postweaning to 35d-
postweaning, respectively.
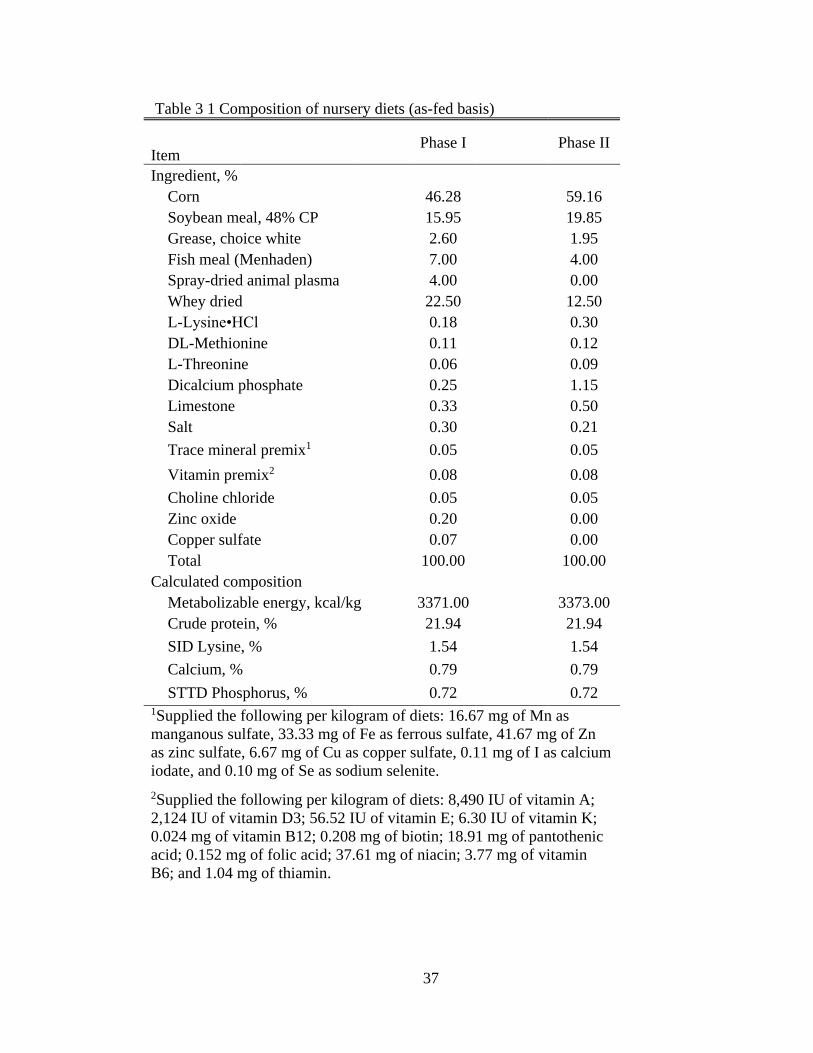
37
Table 3 1 Composition of nursery diets (as-fed basis)
Phase I
Phase II
Item
Ingredient, %
Corn 46.28 59.16
Soybean meal, 48% CP 15.95 19.85
Grease, choice white 2.60 1.95
Fish meal (Menhaden) 7.00 4.00
Spray-dried animal plasma 4.00 0.00
Whey dried 22.50 12.50
L-Lysine•HCl 0.18 0.30
DL-Methionine 0.11 0.12
L-Threonine 0.06 0.09
Dicalcium phosphate 0.25 1.15
Limestone 0.33 0.50
Salt 0.30 0.21
Trace mineral premix1 0.05 0.05
Vitamin premix2 0.08 0.08
Choline chloride 0.05 0.05
Zinc oxide 0.20 0.00
Copper sulfate 0.07 0.00
Total 100.00 100.00
Calculated composition
Metabolizable energy, kcal/kg 3371.00 3373.00
Crude protein, % 21.94 21.94
SID Lysine, % 1.54 1.54
Calcium, % 0.79 0.79
STTD Phosphorus, % 0.72 0.72 1Supplied the following per kilogram of diets: 16.67 mg of Mn as
manganous sulfate, 33.33 mg of Fe as ferrous sulfate, 41.67 mg of Zn
as zinc sulfate, 6.67 mg of Cu as copper sulfate, 0.11 mg of I as calcium
iodate, and 0.10 mg of Se as sodium selenite.
2Supplied the following per kilogram of diets: 8,490 IU of vitamin A;
2,124 IU of vitamin D3; 56.52 IU of vitamin E; 6.30 IU of vitamin K;
0.024 mg of vitamin B12; 0.208 mg of biotin; 18.91 mg of pantothenic
acid; 0.152 mg of folic acid; 37.61 mg of niacin; 3.77 mg of vitamin
B6; and 1.04 mg of thiamin.
38
3.3.3 Data and sample collection
3.3.3.1 Growth performance response measures
Pig body weights were recorded at birth, weaning, 21d-postweaning, and 35d-
postweaning. During the time in the nursery, feeders were checked daily to ensure proper
flow and amount of feed present. Water nipple heights were adjusted to ensure easy
access based on the size of the pigs.
3.3.3.2 Blood collection
All blood samples were collected by jugular venipuncture. Samples were collected
from all pigs at birth, weaning, 21d-postweaning, and 35d-postweaning. Whole blood
was collected by a 10 mL syringe with a 1”, 18 gauge needle and transferred into EDTA
(purple-top) tubes (BD Vacutainer®, Franklin Lakes, NJ). Samples were placed on ice
and transported to the University of Kentucky Veterinary Diagnostic Lab (UKVDL)
within 4 hours of collection for complete blood count (CBC) analysis.
3.3.4 Sample processing and laboratory analysis
3.3.4.1 Blood analysis
CBC analysis was performed for all pigs at all collection times during this experiment
by the UKVDL. The UKVDL analyzed the whole blood samples for a CBC using a
veterinary hematological analyzer (Forcyte Veterinary Hematology Analyzer, Oxford
Science, Oxford, CT). Before analysis, all blood samples were thoroughly mixed and
brought to room temperature. The CBC analysis consisted of hemoglobin concentration
(Hb), hematocrit (HCT), red blood cell count (RBC), white blood cell count (WBC),
mean corpuscular volume (MCV), mean corpuscular hemoglobin (MCH), and mean
corpuscular hemoglobin concentration (MCHC).
39
3.3.5 Statistical analysis
All data were subjected to a statistical outlier test through Grubb’s test outlier
calculator (GraphPad Software, San Diego, CA, USA). For all data, ranges and means
were calculated. Selected data underwent scatter plot analysis with the trendline,
graphical equation, and the R2 being calculated.
3.4 Results
A total of 120 crossbred pigs were weighed and bled the d after birth, weaning, 21d-
postweaning, and 35d-postweaning. Two blood samples clotted at both birth and 35d-
postweaning and were unable to be analyzed for CBC.
Table 3.2 provides the ranges and means of BW and CBC measures throughout the
experiment. During the duration of the study, mean Hb, HCT, and RBC all increased as
time increased. At birth and weaning, the mean hemoglobin concentration is below the
optimal hemoglobin classification (11 g/dL), subsequently, at 21 and 35 days
postweaning the mean hemoglobin concentration surpassed the optimal hemoglobin
concentration. At weaning, 50 % of the 120 pigs were classified with hemoglobin
concentrations below the optimal concentration (Table 3.3). But by 21 and 35 days
postweaning, only 2% of pigs remained below that critical limit.
Figure 3.1 represents the hemoglobin concentration of pigs based on their birth
weight. At birth there is a large portion of the population that is below the optimal
hemoglobin limit (80%); however, there is a positive relationship (Hb = 1.528(BW)) of
hemoglobin concentration and body weight at birth.
40
Later, at weaning (Figure 3.2) the slope is negative (Hb = -0.489(BW)) demonstrating
a decrease in hemoglobin concentration as weaning BW increases. Also at weaning, there
is a more negative relationship (Hb = -0.659(BW gain)) of hemoglobin concentration and
total BW gain to weaning (Figure 3.3). Following weaning, there are only two pigs that
are below the optimal hemoglobin limit. In Figure 3.4, the relationship between
hemoglobin concentration and 21d-postweaning BW shows the trendline becoming
positive (Hb = 0.028(BW)). Furthermore at 35 days postweaning the trendline becomes
even more positive (Hb = 0.101(BW)) (Figure 3.5).
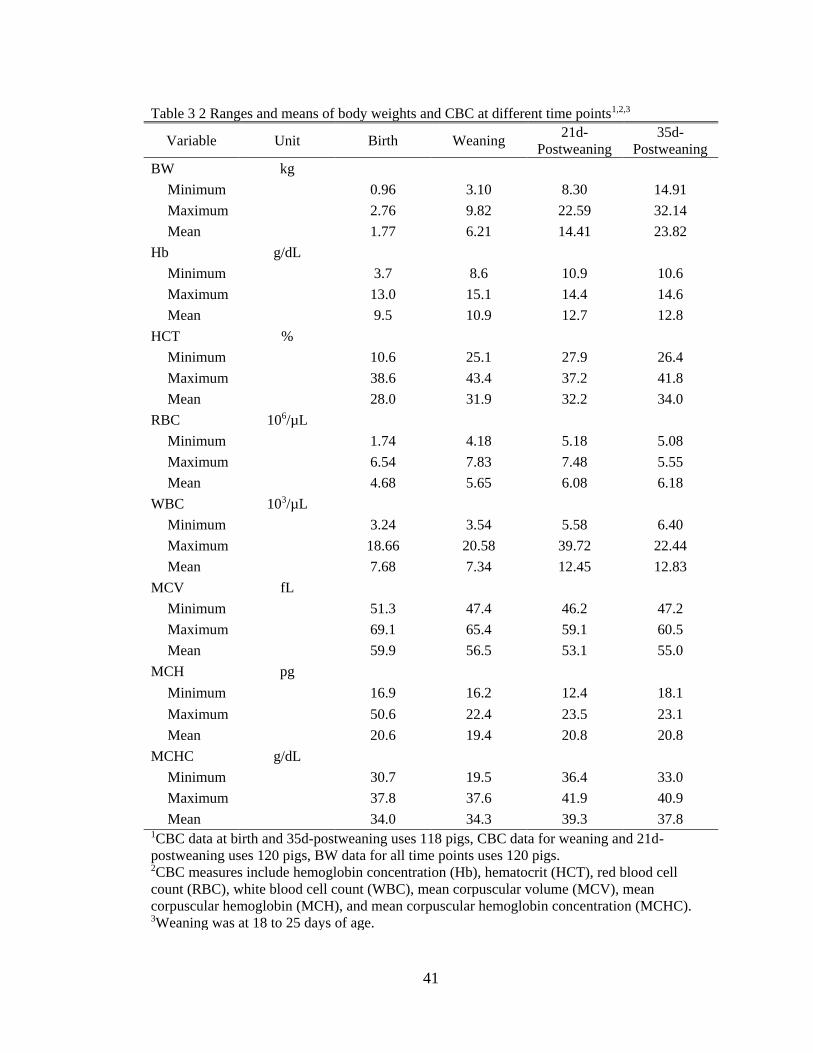
41
Table 3 2 Ranges and means of body weights and CBC at different time points1,2,3
Variable Unit Birth Weaning 21d-
Postweaning
35d-
Postweaning
BW kg
Minimum 0.96 3.10 8.30 14.91
Maximum 2.76 9.82 22.59 32.14
Mean 1.77 6.21 14.41 23.82
Hb g/dL
Minimum 3.7 8.6 10.9 10.6
Maximum 13.0 15.1 14.4 14.6
Mean 9.5 10.9 12.7 12.8
HCT %
Minimum 10.6 25.1 27.9 26.4
Maximum 38.6 43.4 37.2 41.8
Mean 28.0 31.9 32.2 34.0
RBC 106/µL
Minimum 1.74 4.18 5.18 5.08
Maximum 6.54 7.83 7.48 5.55
Mean 4.68 5.65 6.08 6.18
WBC 103/µL
Minimum 3.24 3.54 5.58 6.40
Maximum 18.66 20.58 39.72 22.44
Mean 7.68 7.34 12.45 12.83
MCV fL
Minimum 51.3 47.4 46.2 47.2
Maximum 69.1 65.4 59.1 60.5
Mean 59.9 56.5 53.1 55.0
MCH pg
Minimum 16.9 16.2 12.4 18.1
Maximum 50.6 22.4 23.5 23.1
Mean 20.6 19.4 20.8 20.8
MCHC g/dL
Minimum 30.7 19.5 36.4 33.0
Maximum 37.8 37.6 41.9 40.9
Mean 34.0 34.3 39.3 37.8 1CBC data at birth and 35d-postweaning uses 118 pigs, CBC data for weaning and 21d-
postweaning uses 120 pigs, BW data for all time points uses 120 pigs. 2CBC measures include hemoglobin concentration (Hb), hematocrit (HCT), red blood cell
count (RBC), white blood cell count (WBC), mean corpuscular volume (MCV), mean
corpuscular hemoglobin (MCH), and mean corpuscular hemoglobin concentration (MCHC). 3Weaning was at 18 to 25 days of age.
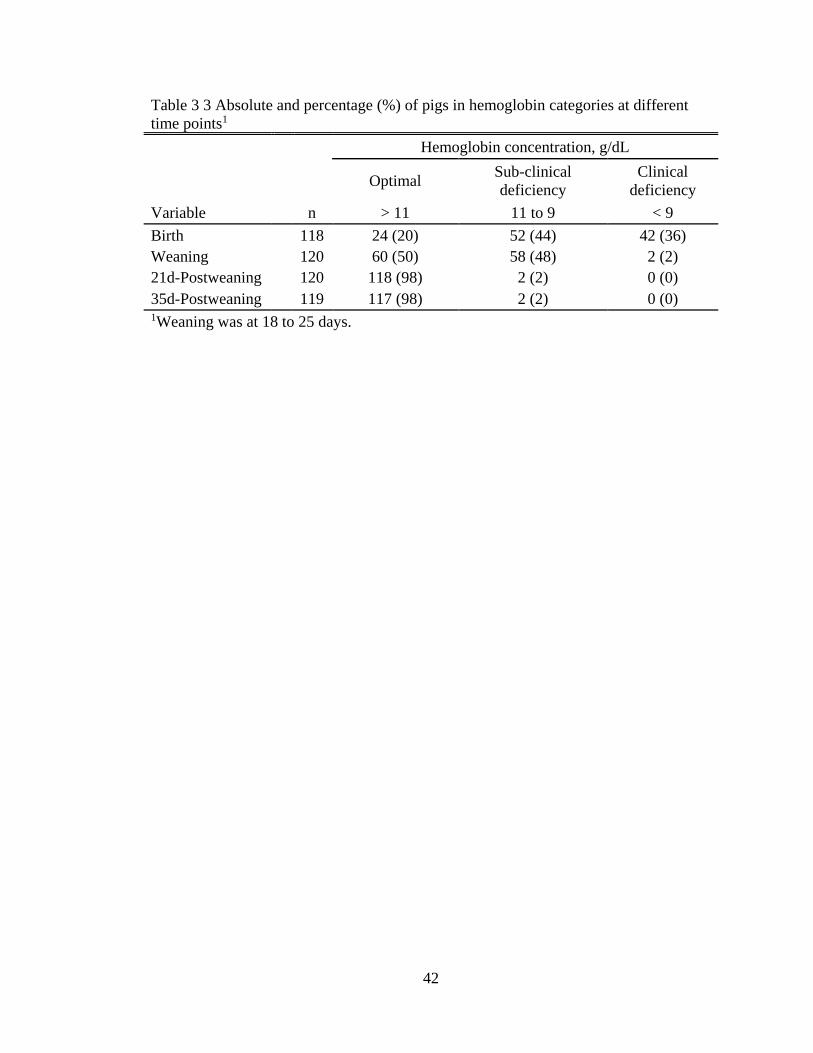
42
Table 3 3 Absolute and percentage (%) of pigs in hemoglobin categories at different
time points1
Hemoglobin concentration, g/dL
Optimal Sub-clinical
deficiency
Clinical
deficiency
Variable n > 11 11 to 9 < 9
Birth 118 24 (20) 52 (44) 42 (36)
Weaning 120 60 (50) 58 (48) 2 (2)
21d-Postweaning 120 118 (98) 2 (2) 0 (0)
35d-Postweaning 119 117 (98) 2 (2) 0 (0) 1Weaning was at 18 to 25 days.
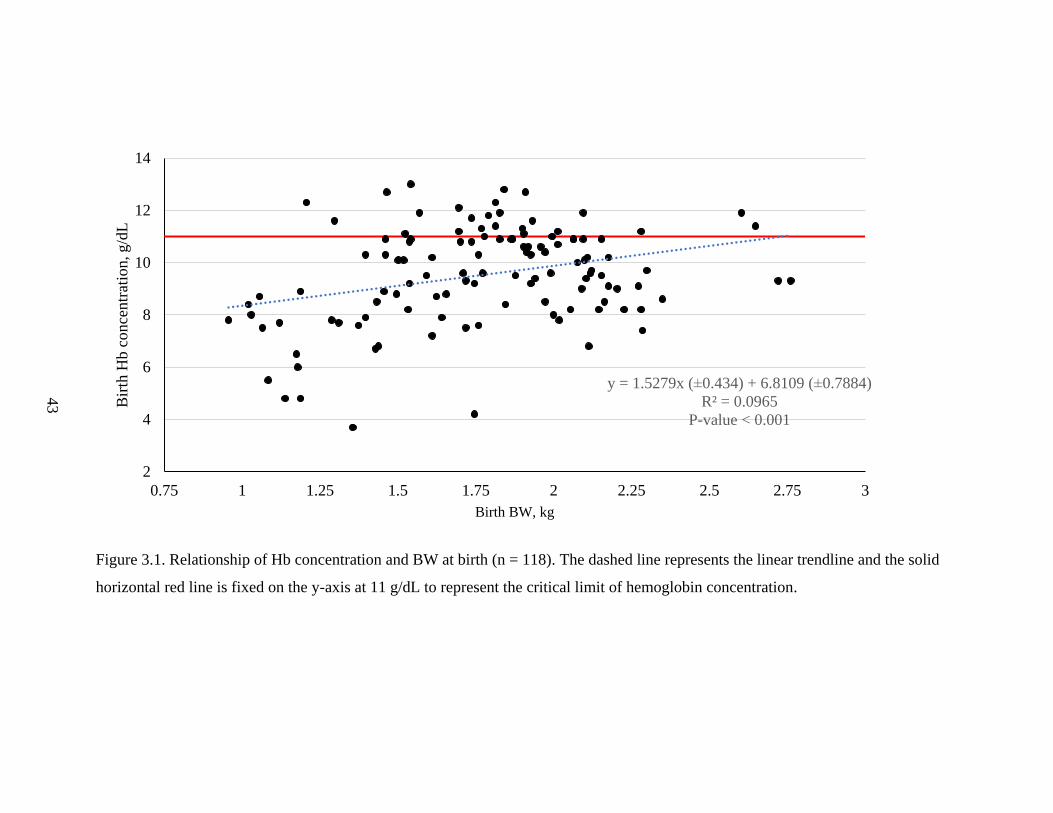
43
Figure 3.1. Relationship of Hb concentration and BW at birth (n = 118). The dashed line represents the linear trendline and the solid
horizontal red line is fixed on the y-axis at 11 g/dL to represent the critical limit of hemoglobin concentration.
y = 1.5279x (±0.434) + 6.8109 (±0.7884)
R² = 0.0965
P-value < 0.001
2
4
6
8
10
12
14
0.75 1 1.25 1.5 1.75 2 2.25 2.5 2.75 3
Bir
th H
b c
once
ntr
atio
n, g/d
L
Birth BW, kg
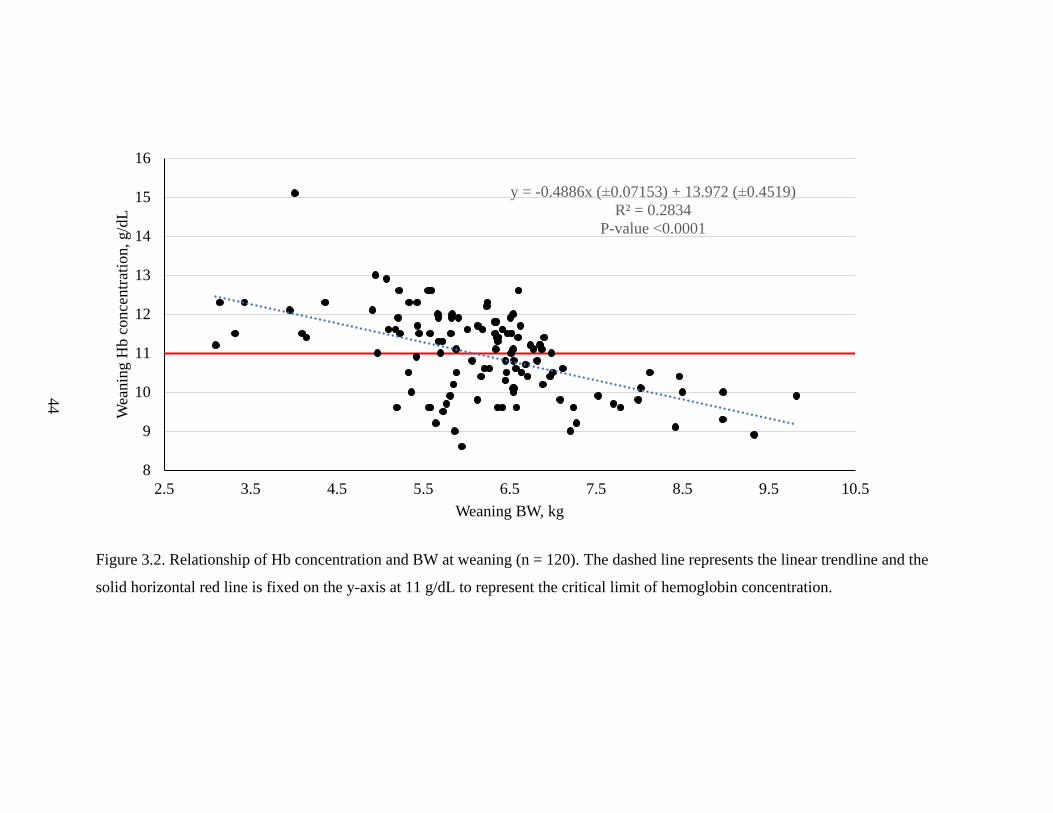
44
Figure 3.2. Relationship of Hb concentration and BW at weaning (n = 120). The dashed line represents the linear trendline and the
solid horizontal red line is fixed on the y-axis at 11 g/dL to represent the critical limit of hemoglobin concentration.
y = -0.4886x (±0.07153) + 13.972 (±0.4519)
R² = 0.2834
P-value <0.0001
8
9
10
11
12
13
14
15
16
2.5 3.5 4.5 5.5 6.5 7.5 8.5 9.5 10.5
Wea
nin
g H
b c
once
ntr
atio
n, g/d
L
Weaning BW, kg
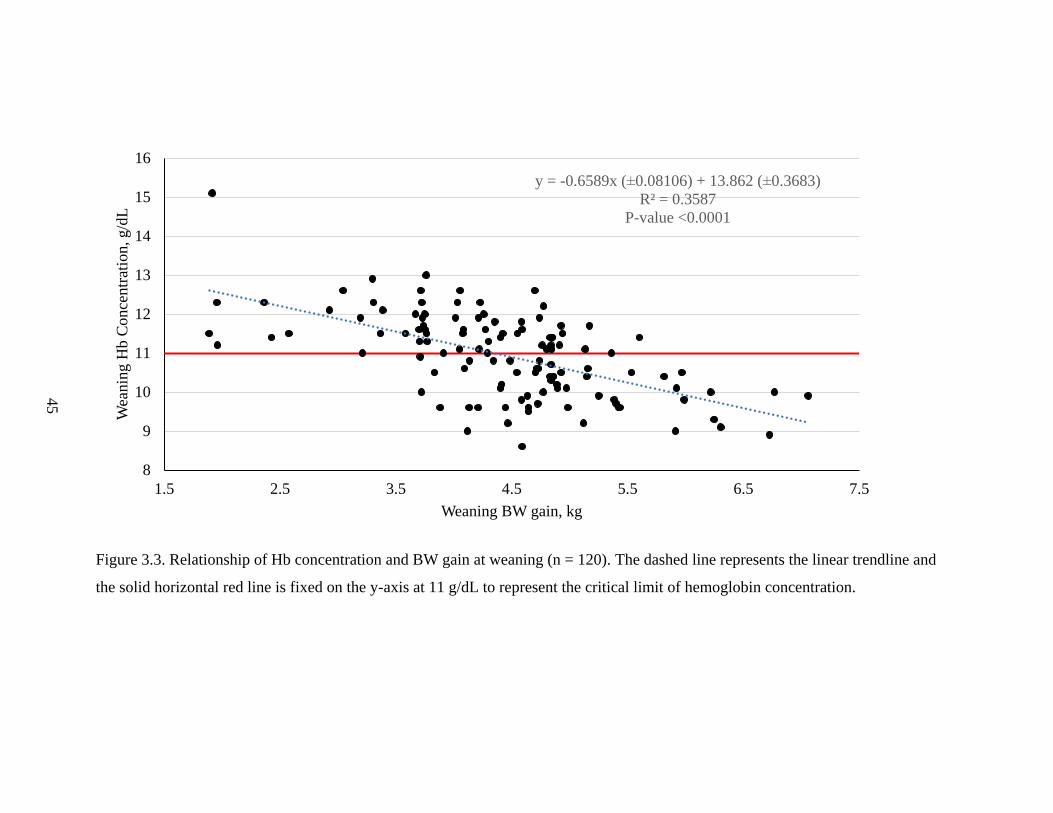
45
Figure 3.3. Relationship of Hb concentration and BW gain at weaning (n = 120). The dashed line represents the linear trendline and
the solid horizontal red line is fixed on the y-axis at 11 g/dL to represent the critical limit of hemoglobin concentration.
y = -0.6589x (±0.08106) + 13.862 (±0.3683)
R² = 0.3587
P-value <0.0001
8
9
10
11
12
13
14
15
16
1.5 2.5 3.5 4.5 5.5 6.5 7.5
Wea
nin
g H
b C
once
ntr
atio
n, g/d
L
Weaning BW gain, kg
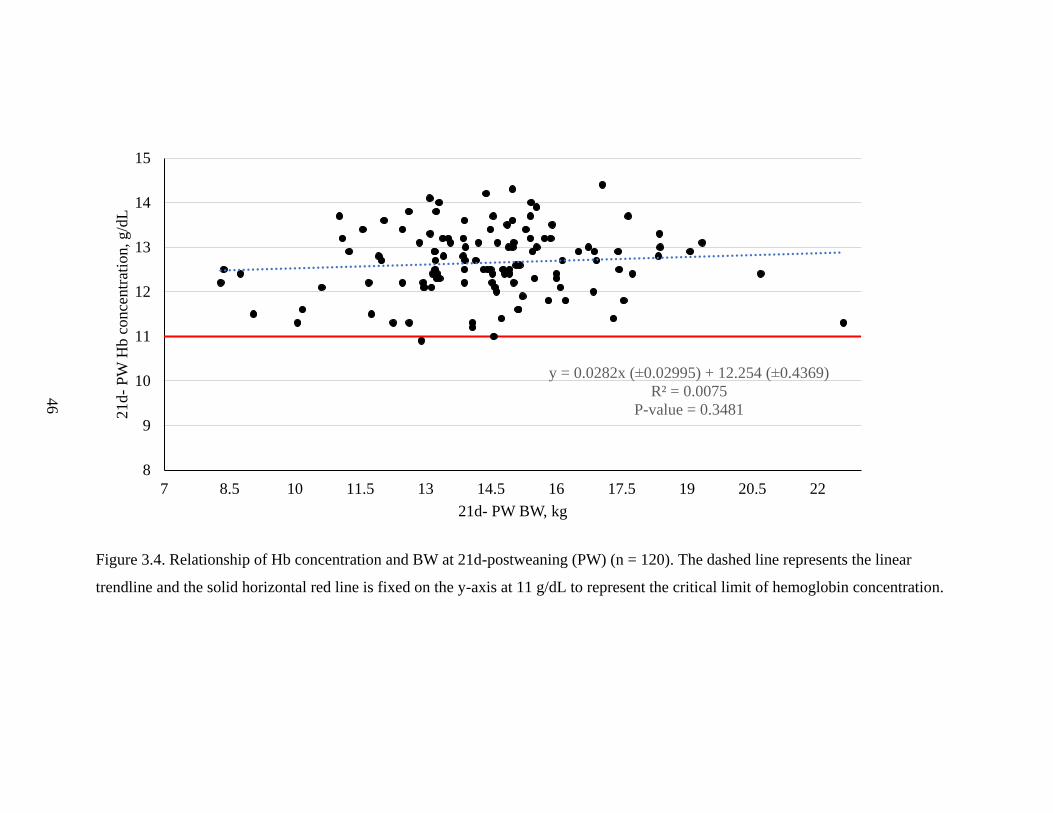
46
Figure 3.4. Relationship of Hb concentration and BW at 21d-postweaning (PW) (n = 120). The dashed line represents the linear
trendline and the solid horizontal red line is fixed on the y-axis at 11 g/dL to represent the critical limit of hemoglobin concentration.
y = 0.0282x (±0.02995) + 12.254 (±0.4369)
R² = 0.0075
P-value = 0.3481
8
9
10
11
12
13
14
15
7 8.5 10 11.5 13 14.5 16 17.5 19 20.5 22
21d-
PW
Hb c
once
ntr
atio
n, g/d
L
21d- PW BW, kg
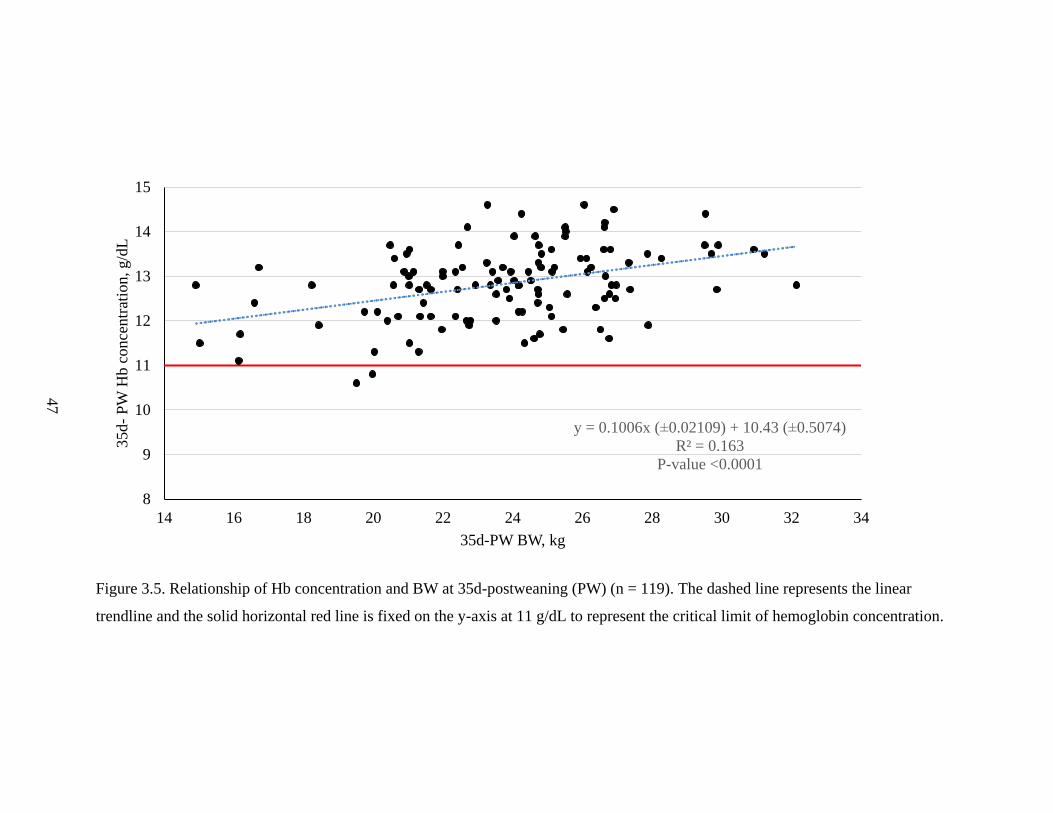
47
Figure 3.5. Relationship of Hb concentration and BW at 35d-postweaning (PW) (n = 119). The dashed line represents the linear
trendline and the solid horizontal red line is fixed on the y-axis at 11 g/dL to represent the critical limit of hemoglobin concentration.
y = 0.1006x (±0.02109) + 10.43 (±0.5074)
R² = 0.163
P-value <0.0001
8
9
10
11
12
13
14
15
14 16 18 20 22 24 26 28 30 32 34
35d-
PW
Hb c
once
ntr
atio
n, g/d
L
35d-PW BW, kg
48
3.5 Discussion
At birth of the current experiment, there was a large group (80%) of piglets with
hemoglobin levels below 11 g/dL. In the developing fetus, iron is transported from the
mother to the fetus through endometrial secretions of uteroferrin across the
maternoplacental barrier which is limited in the pig (Roberts and Bazer, 1980). The
results of the current experiment confirm earlier research, where Venn et al. (1947)
demonstrated that piglets are born with a low body iron. With the exception of low birth
weight humans, pigs are the only mammalian species that experience neonatal iron
deficiency which is largely attributable to low iron reserves at birth. However, there is
limited work on the course of blood measures in young pigs from birth to weaning.
In the current experiment, 50% of the pigs were found to be below the optimal
hemoglobin concentration (< 11 g/dL) at weaning, which is an improvement from d 1.
This could be attributable to the iron injection administered after the blood sample was
collected on d 1. However, there is a large percentage of piglets at weaning with below
optimal hemoglobin levels indicating that the iron supplement may not be adequate to
sustain all pigs until weaning. More so, recent work has also shown populations of pigs
below the optimal hemoglobin limit at weaning (Bhattarai and Nielsen, 2013; Jolliff and
Mahan, 2011; Perri et al., 2016). Jolliff and Mahan (2011) also showed that the pigs
below the optimal hemoglobin concentration at weaning were more likely to be the
faster-growing pigs rather than small or slow-growing pigs. This is in agreement with the
current experiment, where at weaning there was a negative relationship between
hemoglobin concentration and BW or BW gain (Figures 3.2 and 3.3).
49
At 21d- and 35d-postweaning there were only 2 pigs (2%) that were considered sub-
clinical iron deficient and no pigs considered anemic. The 2 pigs that were below optimal
hemoglobin concentrations were a result of low iron status at weaning and poor feed
intake that was estimated from the daily gain in the nursery. Together these pigs had BW
gains that were 30 g and 200 g less than the average at 21d- and 35d-postweaning
respectively. The low occurrence of postweaning iron deficiency in the current
experiment is contrary to results from Perri et al. (2016), who reported a greater incidence
of iron deficiency and anemia 3 weeks postweaning compared to the incidence at
weaning. Notably, the current experimental diet only contained 0.2% Zinc oxide, which
is a much lower level of zinc (20 mg/kg ZnO) than diets used in the study of Perri et al.
(2016) (250-7000 mg/kg ZnO). Thus because of the competitive effect that zinc has with
iron for transport by DMT-1 (Gunshin et al., 1997), the higher incidence of iron
deficiency and anemia observed by Perri et al. (2016) can plausibly be explained.
3.6 Conclusion
In the current experiment, piglets had low hemoglobin concentration at birth, and
after receiving an iron injection containing 150 mg iron at d 1, there was still a large
portion (50%) of the pigs considered below optimal Hb concentration (11 g/dL) at
weaning (d 18-25). Additionally, there was a negative relationship between weaning
hemoglobin concentration and both weaning BW/ BW gain. In contrast, 21d- and 35d-
postweaning hemoglobin concentration had a positive relationship with BW. Furthermore
in the nursery, there were only 2 pigs (2%) that were considered iron-deficient compared
to the 50% observed at weaning. Further research to focus on the time course of the iron
status of the pig through the lactation and nursery periods may provide more precise

50
information of when the iron supply runs low in piglets and suggest when it should be
addressed with some type of intervention.
51
CHAPTER 4. Effects of increasing iron dosage to newborn piglets on growth
performance, hematological measures, and tissue mineral concentrations pre and
postweaning
4.1 Abstract
The objective of the current experiment was to evaluate and determine the course of
the blood profile, growth performance, and tissue mineral concentration of pigs during
pre and postweaning periods after receiving an iron injection at birth. In a 52-d trial, a
total of 70 piglets (initial BW of 1.51 ± 0.56 kg) from 7 litters were assigned to 1 of 5
different iron injection dosage treatments on d 0. Injectable iron dextran treatments were
as follows: 0, 50, 100, 200, and 300 mg iron. Pigs were weaned to nursery pens at d 22
where they were housed by treatment and fed a common nursery diet. BW was measured
on d 0 (before injection), 1, 2, 3, 4, 6, 8, 11, 14, 17, 22 (weaning), 23, 24, 25, 29, 38, 44,
and 52. Blood was collected at the same time points as listed above with the exception of
d 44. Tissue samples were also collected on d 22, 38, and 52. The individual pig served
as the experimental unit and CBC data was analyzed as repeated measures. Overall, the
pigs that were not injected with iron had the lowest growth performance, complete blood
count (CBC), and tissue mineral measures that indicated a state of anemia. During
lactation, at Weeks 1 and 3 there was a linear increase (P < 0.05) in ADG for increasing
injectable iron dosages. After weaning, at Weeks 4 and 5 there were both linear
improvements (P < 0.01) for ADG in response to iron dosage, additionally at Week 5
there was a quadratic tendency (P = 0.07) for greater ADG with the 300 mg iron dose
having the greatest ADG. Increasing iron dosage also resulted in a quadratic increase (P =
0.03) in ADFI for the overall nursery period (d 22 to d 52). Hemoglobin (Hb)
52
concentration improved (P = 0.01) with increasing injectable iron as early as d 1 and
continued to d 38, thereafter (d 52) no differences in Hb concentration were observed. A
similar pattern where an increase was observed early on in the experiment and continued
to d 38 but then disappeared at d 52 existed with the other CBC measures. The iron
concentration of all tissues (liver, spleen, heart, and kidneys) were greater (P ≤ 0.01) at
weaning with increasing iron dosage. Interestingly, at weaning and d 38, the absolute and
relative heart weight was higher (P ≤ 0.02) for pigs receiving no iron injection. Results
indicate that an iron injection administered shortly after birth is vital for proper growth
and hematological functions. Additionally the administration of 300 mg iron injection
had no negative effects, and may also provide a more consistent level of iron during the
pre and postweaning periods for pigs.
Key Words: anemia, iron, iron injection, dosage, piglets
53
4.2 Introduction
Current advancements with genetics in the swine industry have led to an increase in
growth rates of newly born piglets (Pig Champ, 2019), suggesting a greater demand for
certain nutrients. Due to the increases in body size, low amounts of iron in sow milk, and
small initial iron reserve, it is a common practice to provide pigs with an intramuscular
injection of iron shortly after birth in order to prevent anemia. However, current research
has questioned if the single iron injection early in life is sufficient for the lactation and
weaning periods before the pig starts to consume nursery diets (Jolliff and Mahan, 2011;
Perri et al., 2016). More recent work by Morales et al. (2018) demonstrated that after
administration of an iron injection (200 mg iron) at processing, serum iron was declining
past initial serum iron concentrations by days 14 to 17. These findings could be related to
the common occurrence of newly weaned pigs becoming lethargic leading to poor
nursery performance.
It is evident that optimizing iron status at weaning can have benefits to the pig in the
subsequent nursery period. However, there is limited information on the time course of
iron status of the pig from the time of the initial iron injection to weaning. By
understanding the natural decline of iron status before weaning, more targeted
interventions for maximizing hematological status and growth performance in pigs can be
made. Therefore, the objective of the present experiment was to critically monitor the
time course of the blood profile, growth performance, and tissue mineral concentration of
pigs during pre and postweaning periods after receiving various amounts of iron in an
iron injection at birth.
54
4.3 Experimental procedures
This experiment was conducted in environmentally controlled rooms at the University
of Kentucky Swine Research Center under protocols approved by the Institutional
Animal Care and Use Committee of the University of Kentucky
4.3.1 Animals, housing, management, and experimental design
A total of 70, one -day-old pigs [32 barrows, 38 gilts; (Yorkshire x Landrace) x Large
White] from 7 litters with an initial BW of 1.51 ± 0.26 kg were used in this experiment.
Piglets were weighed and randomly allotted within litters shortly after birth to 5 different
iron dextran injection treatments (14 pigs/treatment). The five different treatments
consisted of a single intramuscular (IM) injection of 0, 50, 100, 200, or 300 mg iron from
iron dextran (Henry Schein Animal Health, Dublin, OH). Before treatments were
administered, all piglets underwent normal farm processing procedures (removal of
needle teeth, tail-docking, and ear-notching). All male pigs were castrated on d 8 of the
experiment and no cross-fostering occurred. All iron injections were administered in the
right neck muscle of the piglets. Early during the experiment (d 4), 1 pig from the 200 mg
iron treatment died, resulting in individual BW and ADG means represented by 13 pigs
per treatment for that treatment.
Pigs on the experiment were kept in farrowing crates with their respective dam.
Farrowing crates (1.52 × 2.13 m2) were in environmentally-controlled rooms equipped
with a plastic-coated, woven wire floor, heat lamps, and nipple waterers for sows and
piglets. Sows had ad libitum access to feed through a feed trough on the front gate of the
farrowing crate. All animals had unlimited access to water, piglets were not offered creep
55
feed but were not restricted from the sow feed. The experiment was carried out for a total
of 52 days.
Pigs were weaned to a nursery site at 22 days of age. In the nursery, pigs were
allotted to pens based on BW and treatment. Pens consisted of 4 or 5 pigs per pen and
were equalized between treatments to 3 pens per treatment.
All nursery pens (1.22 m × 1.22 m) were elevated off of the ground in an
environmentally-controlled room with plastic-coated wire flooring. All pens were
equipped with a three-hole plastic feeder and a nipple waterer. Pigs had ad libitum access
to water and feed for the duration of the experiment. Pigs from all treatments were fed
common two-phase nursery diets.
4.3.2 Experimental diets
All pigs received a common two-phase nursery diet sequence that was formulated to
meet or exceed NRC (2012) requirement estimates for pigs 7 to 25 kg (Table 3.1). Phase
I was fed for the first 16 days of the nursery (d 22 to 38) while Phase II was fed from d 38
to 52. The trace mineral premix used in both phases supplied the following per kilogram
of the diet: 50 mg of Mn as manganous sulfate, 100 mg of iron as ferrous sulfate, 100 mg
of Zn as zinc sulfate, 18 mg of Cu as copper sulfate, 0.7 mg of I as calcium iodate, and
0.30 mg of Se as sodium selenite.
Phase I and II diets were analyzed for selected trace mineral concentrations (Fe, Zn,
and Cu). The analyzed mineral composition of Phase I diets were 117 ppm Fe, 118 ppm
Zn, and 17 ppm Cu. For Phase II diets, the analyzed mineral composition was 220 ppm
Fe, 108 ppm Zn, and 15 ppm Cu. Both diets were also analyzed for Ca and P content, for

56
Phase I the Ca and P concentration was 0.76% and 0.61%, respectively. For the Phase II
diets Ca and P were 0.70% and 0.64%, respectively.
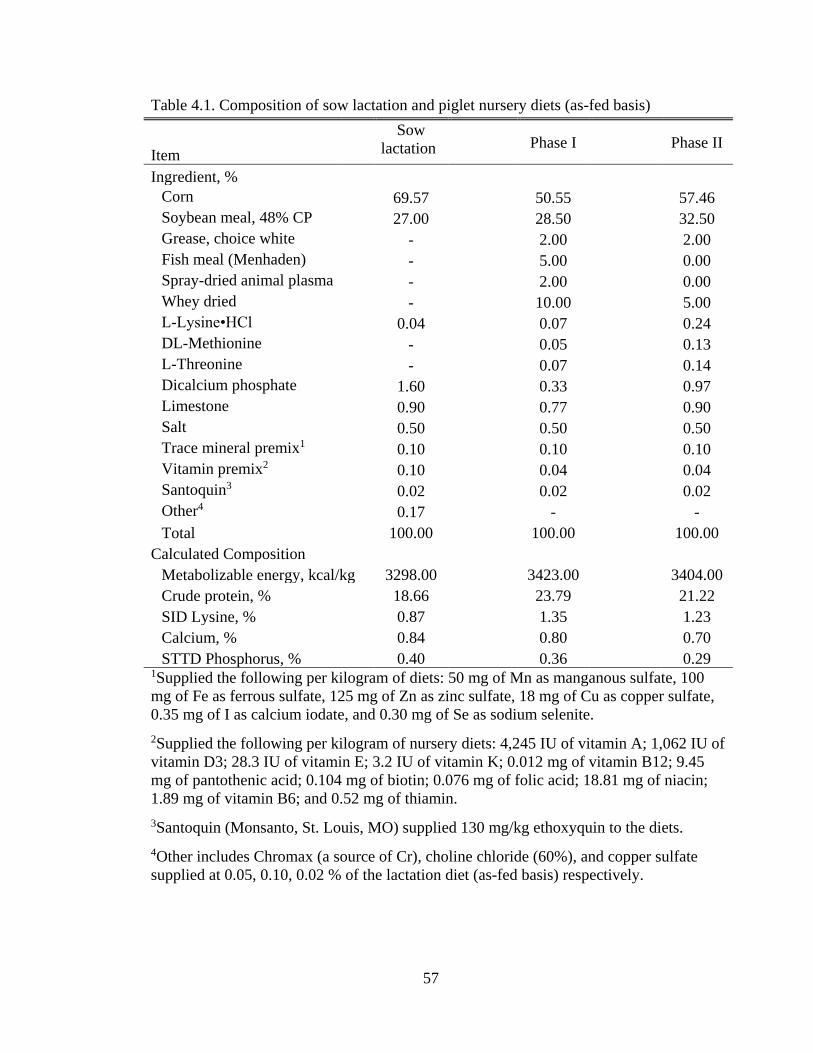
57
Table 4.1. Composition of sow lactation and piglet nursery diets (as-fed basis)
Item
Sow
lactation
Phase I Phase II
Ingredient, %
Corn 69.57 50.55 57.46
Soybean meal, 48% CP 27.00 28.50 32.50
Grease, choice white - 2.00 2.00
Fish meal (Menhaden) - 5.00 0.00
Spray-dried animal plasma - 2.00 0.00
Whey dried - 10.00 5.00
L-Lysine•HCl 0.04 0.07 0.24
DL-Methionine - 0.05 0.13
L-Threonine - 0.07 0.14
Dicalcium phosphate 1.60 0.33 0.97
Limestone 0.90 0.77 0.90
Salt 0.50 0.50 0.50
Trace mineral premix1 0.10 0.10 0.10
Vitamin premix2 0.10 0.04 0.04
Santoquin3 0.02 0.02 0.02
Other4 0.17 - -
Total 100.00 100.00 100.00
Calculated Composition
Metabolizable energy, kcal/kg 3298.00 3423.00 3404.00
Crude protein, % 18.66 23.79 21.22
SID Lysine, % 0.87 1.35 1.23
Calcium, % 0.84 0.80 0.70
STTD Phosphorus, % 0.40 0.36 0.29 1Supplied the following per kilogram of diets: 50 mg of Mn as manganous sulfate, 100
mg of Fe as ferrous sulfate, 125 mg of Zn as zinc sulfate, 18 mg of Cu as copper sulfate,
0.35 mg of I as calcium iodate, and 0.30 mg of Se as sodium selenite.
2Supplied the following per kilogram of nursery diets: 4,245 IU of vitamin A; 1,062 IU of
vitamin D3; 28.3 IU of vitamin E; 3.2 IU of vitamin K; 0.012 mg of vitamin B12; 9.45
mg of pantothenic acid; 0.104 mg of biotin; 0.076 mg of folic acid; 18.81 mg of niacin;
1.89 mg of vitamin B6; and 0.52 mg of thiamin.
3Santoquin (Monsanto, St. Louis, MO) supplied 130 mg/kg ethoxyquin to the diets.
4Other includes Chromax (a source of Cr), choline chloride (60%), and copper sulfate
supplied at 0.05, 0.10, 0.02 % of the lactation diet (as-fed basis) respectively.
58
4.3.3 Data and sample collection
4.3.3.1 Feed collection
Representative samples of corn, soybean meal, and mixed feed were collected at the
feed mill for both phases of the experimental diets. Feed samples were stored at -20°C
until analyzed.
4.3.3.2 Growth performance and blood collection
Body weight and blood samples were collected on d 0 (pre-injection), 1, 2, 3, 4, 6, 8,
11, 14, 17, and 22 (weaning) during the lactation period. After weaning, body and feeder
weights were collected on d 23, 24, 25, 29, 38, 44, and 52. Blood samples were also
collected at the same time points with the exception of d 44. The amount of feed added
and discarded were recorded daily for each feeder.
For blood collection, only 50 of the 70 initial piglets (10 piglets per treatment) were
used throughout the experiment. Blood samples were collected from each of the 50 pigs
by jugular venipuncture. Blood was collected in 3 mL vacutainer tubes coated with
K2EDTA (Becton, Dickinson and Company, Franklin Lakes, NJ) for complete blood
count (CBC) analysis. Blood samples were immediately placed on ice and transported to
the University of Kentucky Veterinary Diagnostic Laboratory (UKVDL).
4.3.3.3 Tissue collection
A subset of pigs (3 pigs/treatment) was selected and sacrificed at weaning, d 38 (end
of Phase I), and d 52 (end of Phase II) to evaluate tissue mineral concentrations. For this
experiment, there was a total of 45 pigs that were euthanized by injection of sodium
pentobarbital (SOCUMB, Henry Schein Animal Health, Dublin, OH). Following
59
euthanasia, pigs were dissected for selected tissues (liver, spleen, both kidneys, and heart)
that were weighed, collected, and stored at -20°C until further analysis.
4.3.4 Sample processing and laboratory analysis
4.3.4.1 Experimental diet measures
For micro-minerals (Zn, Fe, and Cu) and calcium analysis, feed samples were first
digested using a microwave digester (MARS 6, CEM Cooperation, Matthews, NC), then
analyzed by flame atomic absorption spectrometry (Thermoelemental, SOLAAR Mf;
Thermo Electron Corp., Verona, WI). Phosphorus content was analyzed using a
gravimetric determination method (modification of method 968.08; AOAC, 1990).
4.3.4.2 Blood and tissue measures
Blood was analyzed at the UKVDL for a complete blood count (CBC) using a
hematological analyzer (Forcyte Veterinary Hematology Analyzer, Oxford Science,
Oxford, CT). Before analysis, all blood samples were thoroughly mixed and brought to
room temperature. The CBC analysis consisted of hemoglobin concentration (Hb),
hematocrit (HCT), red blood cell count (RBC), white blood cell count (WBC), mean
corpuscular volume (MCV), mean corpuscular hemoglobin (MCH), and mean
corpuscular hemoglobin concentration (MCHC).
Tissue samples were placed through a kitchen-grade meat grinder (The butcher shop
premium, KRUPS USA, Parsippany, NJ) to provide a homogenous tissue sample. After
samples were ground and mixed, 1-2 g of tissue was digested with nitric acid in a
pressurized microwave digester (MARS 6 CEM, Matthews, NC) according to the
recommendations by the manufacturer, and appropriately diluted. Diluted samples were
analyzed for trace mineral composition (Zn, Fe, and Cu) by flame atomic absorption
60
spectrophotometry (Thermoelemental, SOLAAR M5; Thermo Electron Corp., Verona,
WI). Dry matter (DM) was determined for all tissue samples by placing around 2-3 g of
ground sample into a gravity convection drying oven at 107°C for approximately 24
hours and weighing the sample again to observe the moisture content lost.
4.3.5 Statistical analysis
Prior to analyses, all data were evaluated to identify any potential statistical outliers
detected by Grubb’s test outlier calculator (Graphpad Software, San Diego, CA). All data
for individual days were subjected to ANOVA by using the GLM procedure in SAS
(Statistical Analysis System, Cary, NC). The individual pig was the experimental unit for
individual BW and ADG, CBC measures, and tissue mineral concentrations. Results are
reported as least squares means. Orthogonal polynomial contrasts were performed to
evaluate the linear and quadratic effects of increasing iron injection dosage. Least squares
means were calculated using the LSMEANS option of SAS. The level of significance
was determined by a P-value of < 0.05. The data of growth performance, blood, and
tissue measures for the pigs were analyzed by the model:
Yijk = µ + ironi + litterj + sexk(litter j) + eijk , where,
Y = the response variables (ADG, blood CBC, organ weights, and tissue mineral
concentrations)
µ = a constant common to all observations
ironi = the iron injection dosage level
litterj = the litter number
61
sexk(litter j) = litter nested within sex
eijk = the error term of the model
For nursery pen performance, the pen served as the experimental unit by the model:
Yi= µ + ironi + ei , where
Y = the response variables (nursery ADG, ADFI, and F:G)
µ = a constant common to all observations
ironi = the iron injection dosage level
ei = the error term of the model
Complete blood count (CBC) data were also analyzed as repeated measures with the
PROC MIXED function of SAS to examine time and time by iron treatment interactions
using the individual pig as the experimental unit by the model:
Yijkl = µ + ironi + litterj + sexk(litter j) + dayl + (iron×day)il + eijkl , where
Y = the response variables (blood CBC measures)
µ = a constant common to all observations
ironi = the iron injection dosage level
litterj = the litter number
sexk(litter j) = litter nested within sex
dayl = the day of sampling
(iron×day)il = the iron injection dosage level × day of sampling interaction
62
eijkl = the error term of the model
4.4 Results
4.4.1 Growth performance
Pigs that did not receive an iron injection at birth had the lowest numerical BW by d 6
of the experiment, they continued to have the lowest BW during the rest of the sampling
times (Table 4.2). This can be further explained by the low daily gains for the control
pigs seen in Table 4.3. Weeks 1 and 3 following the iron injection at birth (Table 4.4)
had a linear increase (P = 0.03 and P = 0.02) in ADG which led to a linear trend (P =
0.06) in heavier BW from d 8 to 17 (Table 4.2). By d 22 (weaning) there was a more
noticeable linear response (P = 0.02) to iron injection dosage for BW which continued to
the end of the experiment (d 52). Following weaning at Week 3 (Table 4.3), there was a
clear linear increase (P < 0.01) with quadratic trends (P < 0.0001 and P = 0.07,
respectively) in ADG for Weeks 4 and 5. When combined these results led to a noticeable
linear and quadratic improvement (P < 0.001) in ADG during Phase I. Overall (Weeks 1
to 7), ADG was improved (P ≤ 0.02) in a linear and quadratic fashion in response to
increasing iron injection dosage.
Nursery performance data from nursery pen means is provided in Table 4.5. Similar
to the results demonstrated in Table 4.4, ADG was increased linearly (P ≤ 0.01) for
Weeks 4 and 5. The improved ADG for Weeks 4 and 5 are accompanied by an increased
(P ≤ 0.02, linear) ADFI at the same sampling times. During Phase I ADFI was increased
(P = 0.01 and P = 0.02, respectively) both linearly and quadratically. In addition, ADFI
for the nursery period was quadratically higher (P = 0.03); with a linear tendency (P =
0.07) as iron injection dosage increased.
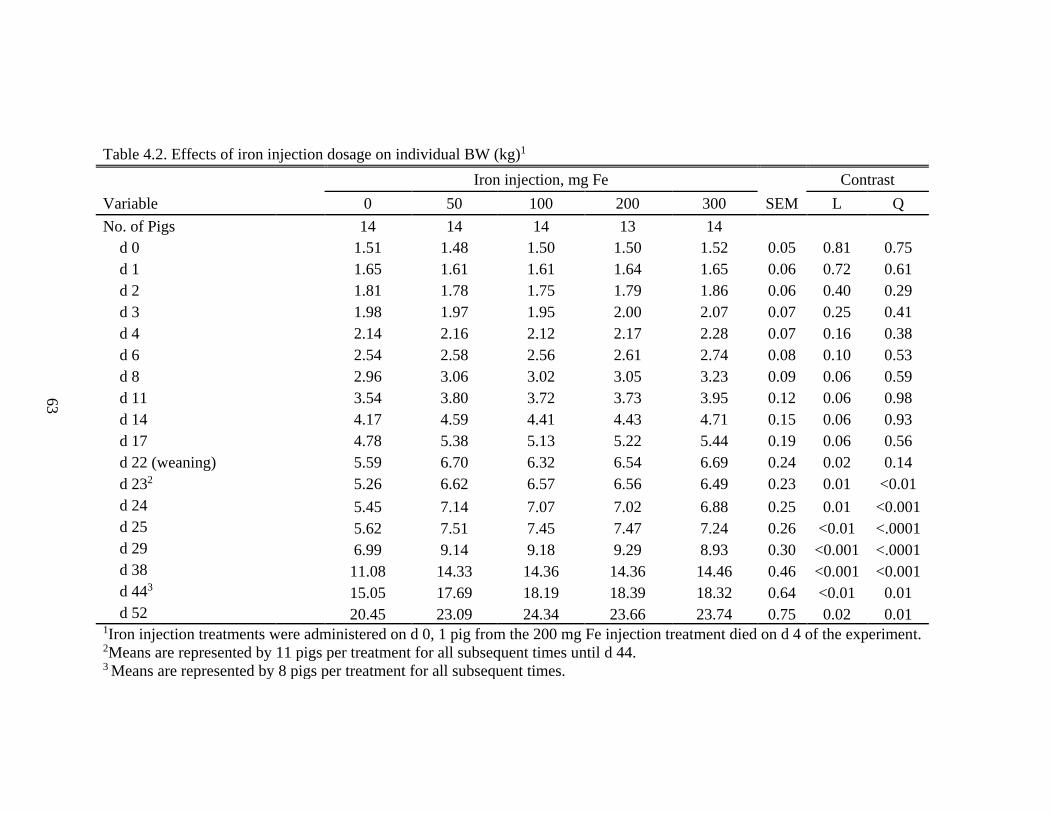
63
Table 4.2. Effects of iron injection dosage on individual BW (kg)1
Iron injection, mg Fe Contrast
Variable 0 50 100 200 300 SEM L Q
No. of Pigs 14 14 14 13 14
d 0 1.51 1.48 1.50 1.50 1.52 0.05 0.81 0.75
d 1 1.65 1.61 1.61 1.64 1.65 0.06 0.72 0.61
d 2 1.81 1.78 1.75 1.79 1.86 0.06 0.40 0.29
d 3 1.98 1.97 1.95 2.00 2.07 0.07 0.25 0.41
d 4 2.14 2.16 2.12 2.17 2.28 0.07 0.16 0.38
d 6 2.54 2.58 2.56 2.61 2.74 0.08 0.10 0.53
d 8 2.96 3.06 3.02 3.05 3.23 0.09 0.06 0.59
d 11 3.54 3.80 3.72 3.73 3.95 0.12 0.06 0.98
d 14 4.17 4.59 4.41 4.43 4.71 0.15 0.06 0.93
d 17 4.78 5.38 5.13 5.22 5.44 0.19 0.06 0.56
d 22 (weaning) 5.59 6.70 6.32 6.54 6.69 0.24 0.02 0.14
d 232 5.26 6.62 6.57 6.56 6.49 0.23 0.01 <0.01
d 24 5.45 7.14 7.07 7.02 6.88 0.25 0.01 <0.001
d 25 5.62 7.51 7.45 7.47 7.24 0.26 <0.01 <.0001
d 29 6.99 9.14 9.18 9.29 8.93 0.30 <0.001 <.0001
d 38 11.08 14.33 14.36 14.36 14.46 0.46 <0.001 <0.001
d 443 15.05 17.69 18.19 18.39 18.32 0.64 <0.01 0.01
d 52 20.45 23.09 24.34 23.66 23.74 0.75 0.02 0.01
1Iron injection treatments were administered on d 0, 1 pig from the 200 mg Fe injection treatment died on d 4 of the experiment. 2Means are represented by 11 pigs per treatment for all subsequent times until d 44. 3 Means are represented by 8 pigs per treatment for all subsequent times.
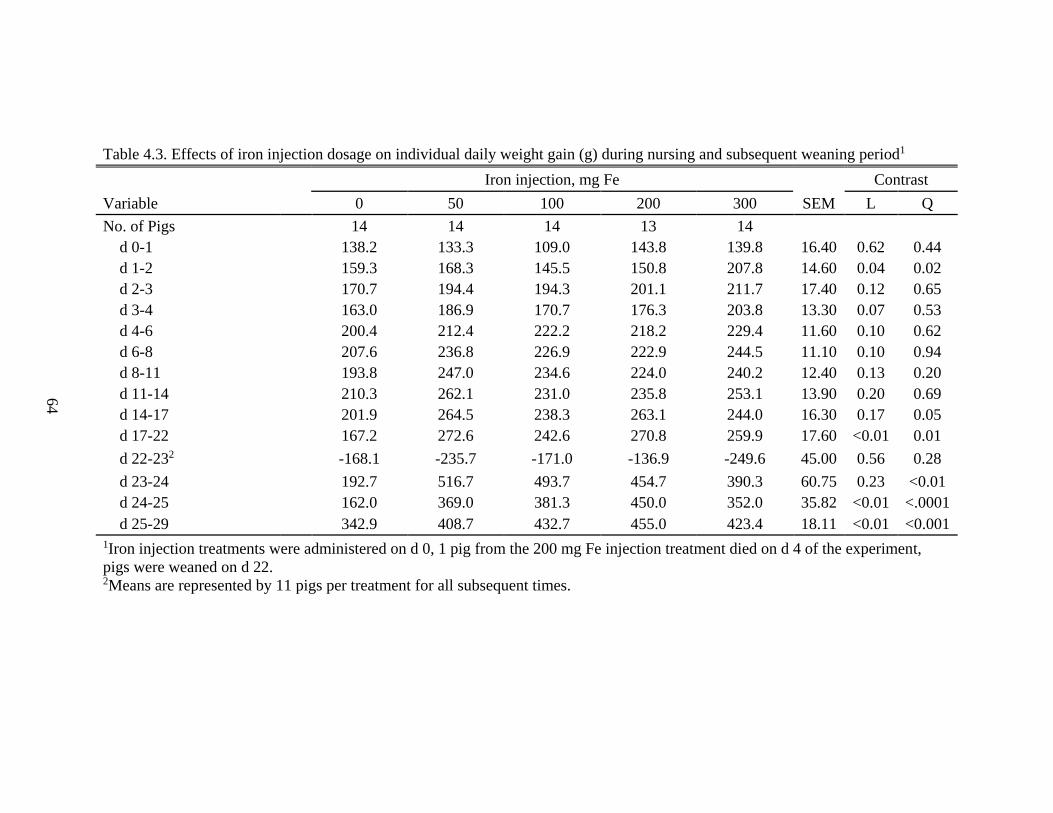
64
Table 4.3. Effects of iron injection dosage on individual daily weight gain (g) during nursing and subsequent weaning period1
Iron injection, mg Fe Contrast
Variable 0 50 100 200 300 SEM L Q
No. of Pigs 14 14 14 13 14
d 0-1 138.2 133.3 109.0 143.8 139.8 16.40 0.62 0.44
d 1-2 159.3 168.3 145.5 150.8 207.8 14.60 0.04 0.02
d 2-3 170.7 194.4 194.3 201.1 211.7 17.40 0.12 0.65
d 3-4 163.0 186.9 170.7 176.3 203.8 13.30 0.07 0.53
d 4-6 200.4 212.4 222.2 218.2 229.4 11.60 0.10 0.62
d 6-8 207.6 236.8 226.9 222.9 244.5 11.10 0.10 0.94
d 8-11 193.8 247.0 234.6 224.0 240.2 12.40 0.13 0.20
d 11-14 210.3 262.1 231.0 235.8 253.1 13.90 0.20 0.69
d 14-17 201.9 264.5 238.3 263.1 244.0 16.30 0.17 0.05
d 17-22 167.2 272.6 242.6 270.8 259.9 17.60 <0.01 0.01
d 22-232 -168.1 -235.7 -171.0 -136.9 -249.6 45.00 0.56 0.28
d 23-24 192.7 516.7 493.7 454.7 390.3 60.75 0.23 <0.01
d 24-25 162.0 369.0 381.3 450.0 352.0 35.82 <0.01 <.0001
d 25-29 342.9 408.7 432.7 455.0 423.4 18.11 <0.01 <0.001
1Iron injection treatments were administered on d 0, 1 pig from the 200 mg Fe injection treatment died on d 4 of the experiment,
pigs were weaned on d 22. 2Means are represented by 11 pigs per treatment for all subsequent times.
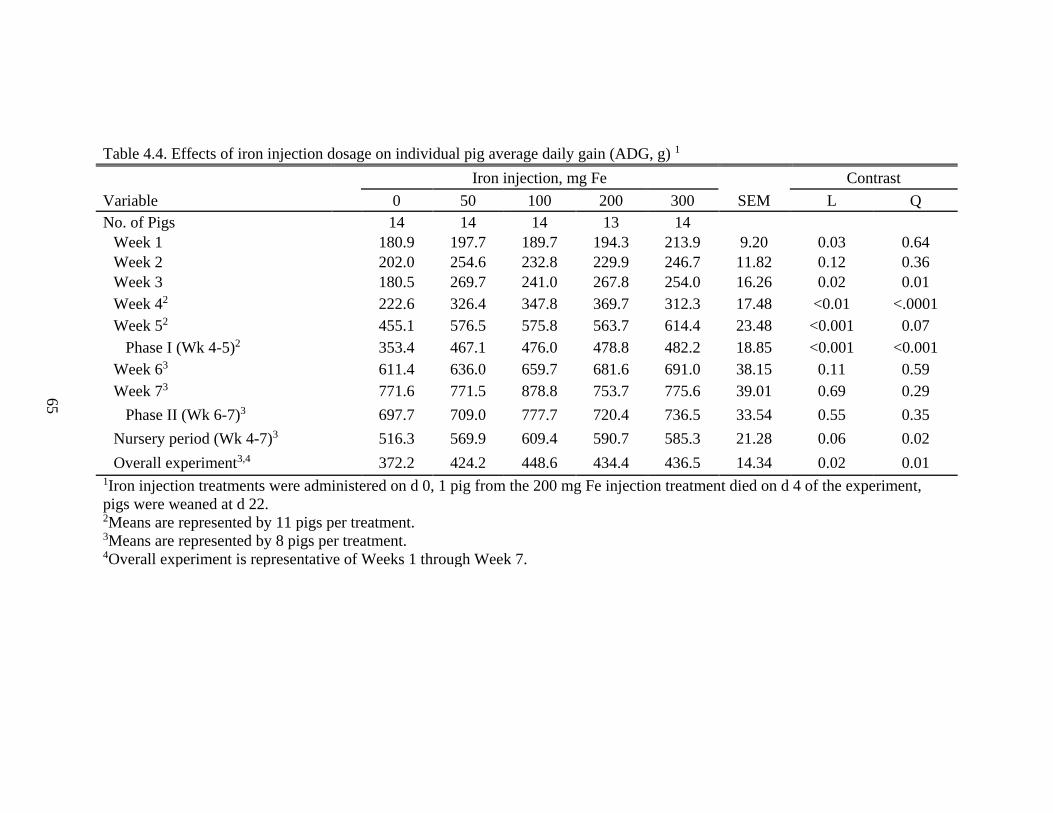
65
Table 4.4. Effects of iron injection dosage on individual pig average daily gain (ADG, g) 1
Iron injection, mg Fe Contrast
Variable 0 50 100 200 300 SEM L Q
No. of Pigs 14 14 14 13 14 Week 1 180.9 197.7 189.7 194.3 213.9 9.20 0.03 0.64
Week 2 202.0 254.6 232.8 229.9 246.7 11.82 0.12 0.36
Week 3 180.5 269.7 241.0 267.8 254.0 16.26 0.02 0.01
Week 42 222.6 326.4 347.8 369.7 312.3 17.48 <0.01 <.0001
Week 52 455.1 576.5 575.8 563.7 614.4 23.48 <0.001 0.07
Phase I (Wk 4-5)2 353.4 467.1 476.0 478.8 482.2 18.85 <0.001 <0.001
Week 63 611.4 636.0 659.7 681.6 691.0 38.15 0.11 0.59
Week 73 771.6 771.5 878.8 753.7 775.6 39.01 0.69 0.29
Phase II (Wk 6-7)3 697.7 709.0 777.7 720.4 736.5 33.54 0.55 0.35
Nursery period (Wk 4-7)3 516.3 569.9 609.4 590.7 585.3 21.28 0.06 0.02
Overall experiment3,4 372.2 424.2 448.6 434.4 436.5 14.34 0.02 0.01 1Iron injection treatments were administered on d 0, 1 pig from the 200 mg Fe injection treatment died on d 4 of the experiment,
pigs were weaned at d 22. 2Means are represented by 11 pigs per treatment. 3Means are represented by 8 pigs per treatment. 4Overall experiment is representative of Weeks 1 through Week 7.
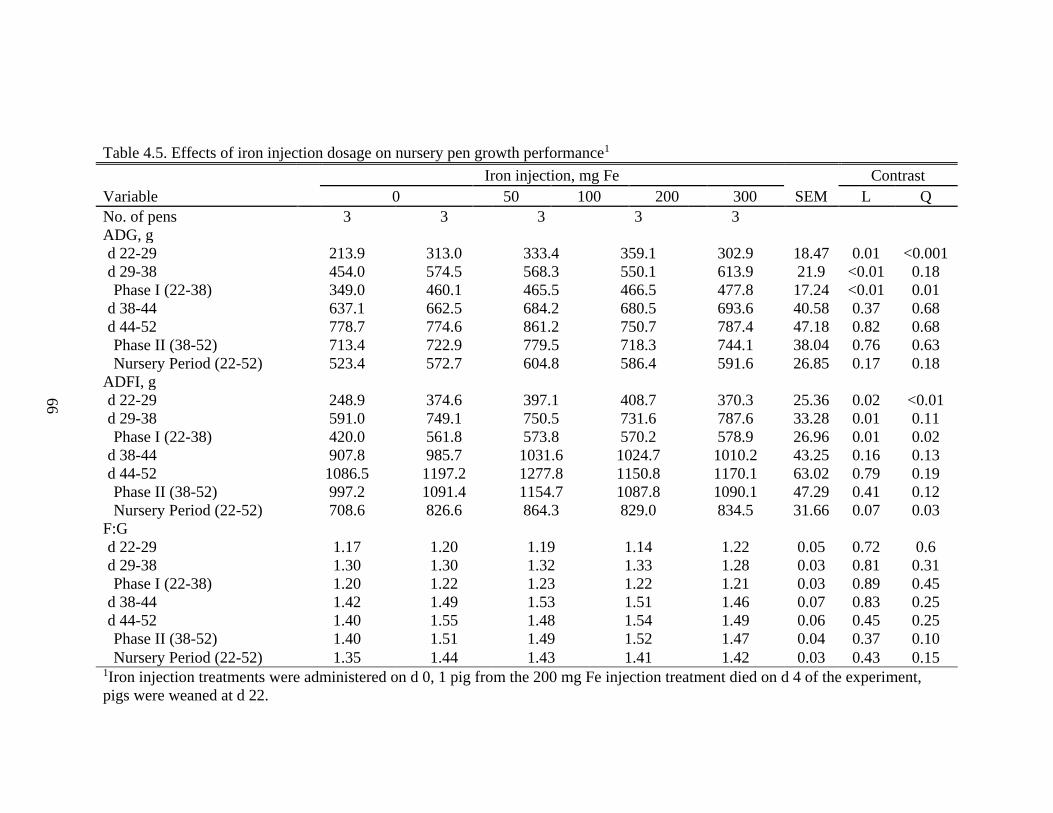
66
Table 4.5. Effects of iron injection dosage on nursery pen growth performance1
Iron injection, mg Fe Contrast
Variable 0 50 100 200 300 SEM L Q
No. of pens 3 3 3 3 3 ADG, g d 22-29 213.9 313.0 333.4 359.1 302.9 18.47 0.01 <0.001
d 29-38 454.0 574.5 568.3 550.1 613.9 21.9 <0.01 0.18
Phase I (22-38) 349.0 460.1 465.5 466.5 477.8 17.24 <0.01 0.01
d 38-44 637.1 662.5 684.2 680.5 693.6 40.58 0.37 0.68
d 44-52 778.7 774.6 861.2 750.7 787.4 47.18 0.82 0.68
Phase II (38-52) 713.4 722.9 779.5 718.3 744.1 38.04 0.76 0.63
Nursery Period (22-52) 523.4 572.7 604.8 586.4 591.6 26.85 0.17 0.18
ADFI, g d 22-29 248.9 374.6 397.1 408.7 370.3 25.36 0.02 <0.01
d 29-38 591.0 749.1 750.5 731.6 787.6 33.28 0.01 0.11
Phase I (22-38) 420.0 561.8 573.8 570.2 578.9 26.96 0.01 0.02
d 38-44 907.8 985.7 1031.6 1024.7 1010.2 43.25 0.16 0.13
d 44-52 1086.5 1197.2 1277.8 1150.8 1170.1 63.02 0.79 0.19
Phase II (38-52) 997.2 1091.4 1154.7 1087.8 1090.1 47.29 0.41 0.12
Nursery Period (22-52) 708.6 826.6 864.3 829.0 834.5 31.66 0.07 0.03
F:G d 22-29 1.17 1.20 1.19 1.14 1.22 0.05 0.72 0.6
d 29-38 1.30 1.30 1.32 1.33 1.28 0.03 0.81 0.31
Phase I (22-38) 1.20 1.22 1.23 1.22 1.21 0.03 0.89 0.45
d 38-44 1.42 1.49 1.53 1.51 1.46 0.07 0.83 0.25
d 44-52 1.40 1.55 1.48 1.54 1.49 0.06 0.45 0.25
Phase II (38-52) 1.40 1.51 1.49 1.52 1.47 0.04 0.37 0.10
Nursery Period (22-52) 1.35 1.44 1.43 1.41 1.42 0.03 0.43 0.15 1Iron injection treatments were administered on d 0, 1 pig from the 200 mg Fe injection treatment died on d 4 of the experiment,
pigs were weaned at d 22.
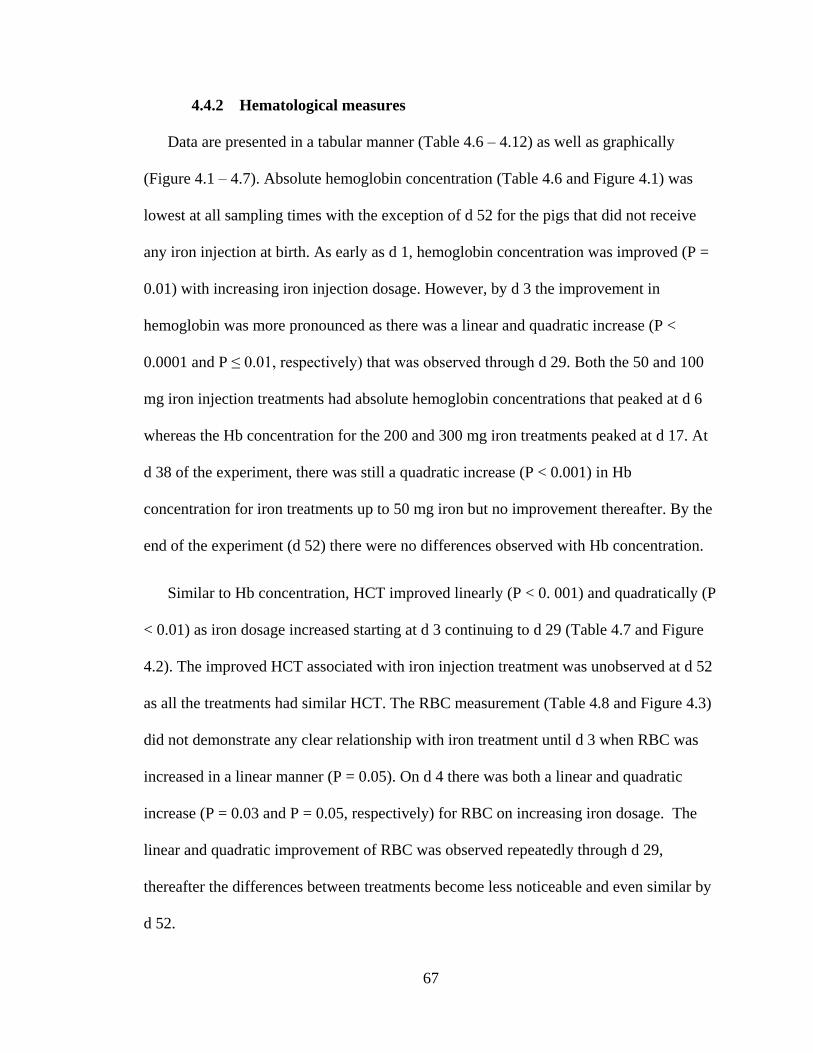
67
4.4.2 Hematological measures
Data are presented in a tabular manner (Table 4.6 – 4.12) as well as graphically
(Figure 4.1 – 4.7). Absolute hemoglobin concentration (Table 4.6 and Figure 4.1) was
lowest at all sampling times with the exception of d 52 for the pigs that did not receive
any iron injection at birth. As early as d 1, hemoglobin concentration was improved (P =
0.01) with increasing iron injection dosage. However, by d 3 the improvement in
hemoglobin was more pronounced as there was a linear and quadratic increase (P <
0.0001 and P ≤ 0.01, respectively) that was observed through d 29. Both the 50 and 100
mg iron injection treatments had absolute hemoglobin concentrations that peaked at d 6
whereas the Hb concentration for the 200 and 300 mg iron treatments peaked at d 17. At
d 38 of the experiment, there was still a quadratic increase (P < 0.001) in Hb
concentration for iron treatments up to 50 mg iron but no improvement thereafter. By the
end of the experiment (d 52) there were no differences observed with Hb concentration.
Similar to Hb concentration, HCT improved linearly (P < 0. 001) and quadratically (P
< 0.01) as iron dosage increased starting at d 3 continuing to d 29 (Table 4.7 and Figure
4.2). The improved HCT associated with iron injection treatment was unobserved at d 52
as all the treatments had similar HCT. The RBC measurement (Table 4.8 and Figure 4.3)
did not demonstrate any clear relationship with iron treatment until d 3 when RBC was
increased in a linear manner (P = 0.05). On d 4 there was both a linear and quadratic
increase (P = 0.03 and P = 0.05, respectively) for RBC on increasing iron dosage. The
linear and quadratic improvement of RBC was observed repeatedly through d 29,
thereafter the differences between treatments become less noticeable and even similar by
d 52.
68
Unlike the previous CBC measurements, WBC (Table 4.9 and Figure 4.4) showed a
linear increase (P < 0.05) starting before the treatments were administered and lasting
until d 29. At d 38 and 52 there were no differences in WBC for the five treatments.
Mean corpuscular volume (MCV) (Table 4.10 and Figure 4.5) was greater (P < 0.01,
linear) at d 3 and continued to be greater at all sampling times through d 29. Mean
corpuscular hemoglobin (MCH) (Table 4.11 and Figure 4.6) was similar to MCV in
showing a linear increase starting at d 3 (P = 0.02) and continuing to d 29. Differently,
absolute MCHC (Table 4.12 and Figure 4.7) was numerically greater for pigs receiving
no iron injection at d 6 through 14. At d 22 MCHC was greater (P <0.0001) as treatments
increased, this observation continued on d 29. At d 38 MCHC showed a quadratic
response (P = 0.02) to birth iron dosage.
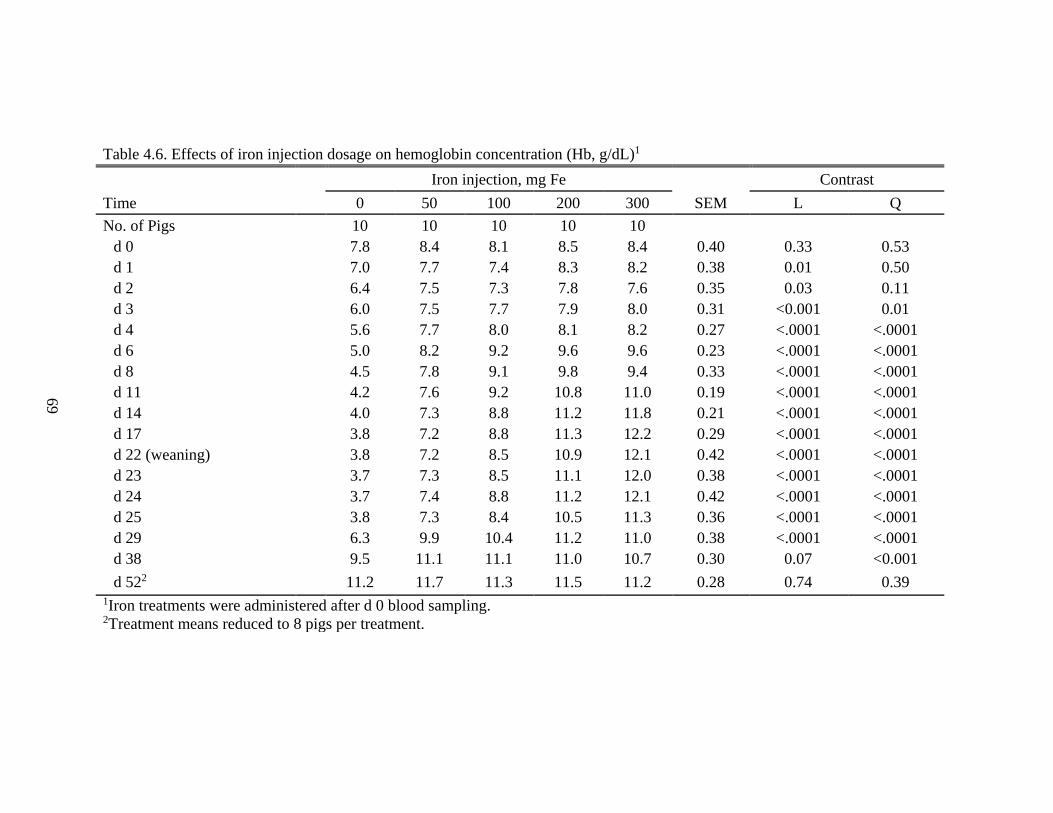
69
Table 4.6. Effects of iron injection dosage on hemoglobin concentration (Hb, g/dL)1
Iron injection, mg Fe Contrast
Time 0 50 100 200 300 SEM L Q
No. of Pigs 10 10 10 10 10
d 0 7.8 8.4 8.1 8.5 8.4 0.40 0.33 0.53
d 1 7.0 7.7 7.4 8.3 8.2 0.38 0.01 0.50
d 2 6.4 7.5 7.3 7.8 7.6 0.35 0.03 0.11
d 3 6.0 7.5 7.7 7.9 8.0 0.31 <0.001 0.01
d 4 5.6 7.7 8.0 8.1 8.2 0.27 <.0001 <.0001
d 6 5.0 8.2 9.2 9.6 9.6 0.23 <.0001 <.0001
d 8 4.5 7.8 9.1 9.8 9.4 0.33 <.0001 <.0001
d 11 4.2 7.6 9.2 10.8 11.0 0.19 <.0001 <.0001
d 14 4.0 7.3 8.8 11.2 11.8 0.21 <.0001 <.0001
d 17 3.8 7.2 8.8 11.3 12.2 0.29 <.0001 <.0001
d 22 (weaning) 3.8 7.2 8.5 10.9 12.1 0.42 <.0001 <.0001
d 23 3.7 7.3 8.5 11.1 12.0 0.38 <.0001 <.0001
d 24 3.7 7.4 8.8 11.2 12.1 0.42 <.0001 <.0001
d 25 3.8 7.3 8.4 10.5 11.3 0.36 <.0001 <.0001
d 29 6.3 9.9 10.4 11.2 11.0 0.38 <.0001 <.0001
d 38 9.5 11.1 11.1 11.0 10.7 0.30 0.07 <0.001
d 522 11.2 11.7 11.3 11.5 11.2 0.28 0.74 0.39 1Iron treatments were administered after d 0 blood sampling. 2Treatment means reduced to 8 pigs per treatment.
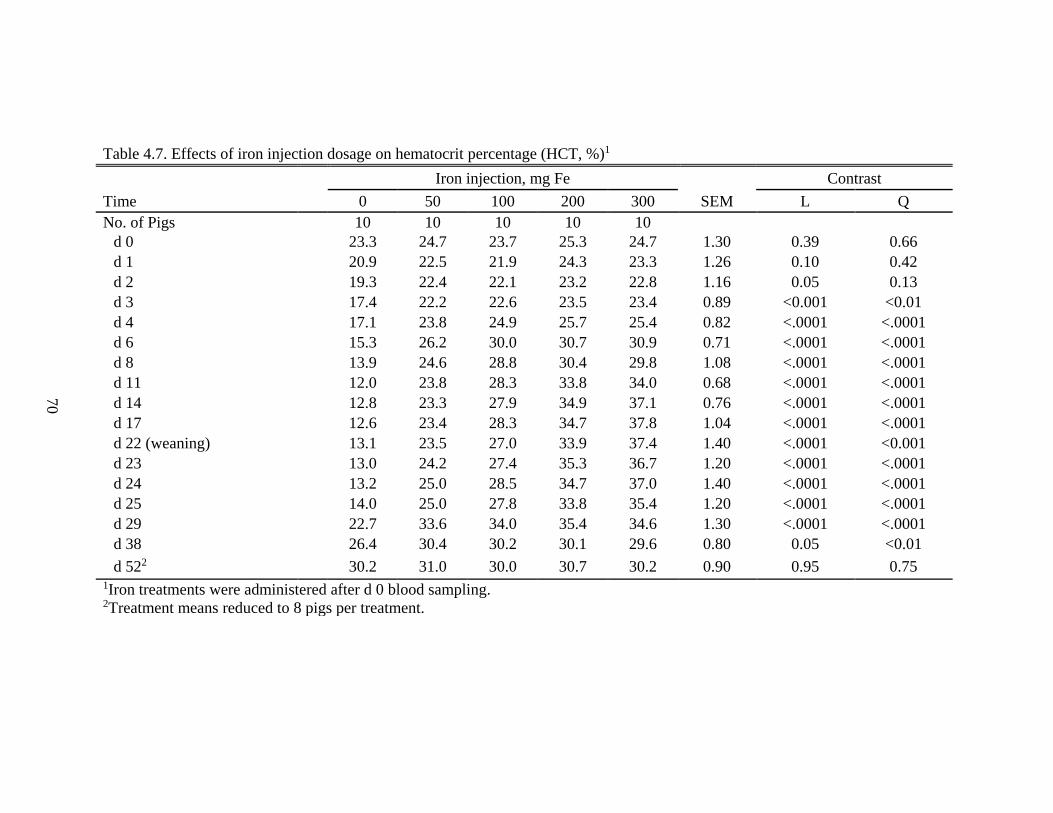
70
Table 4.7. Effects of iron injection dosage on hematocrit percentage (HCT, %)1
Iron injection, mg Fe Contrast
Time 0 50 100 200 300 SEM L Q
No. of Pigs 10 10 10 10 10
d 0 23.3 24.7 23.7 25.3 24.7 1.30 0.39 0.66
d 1 20.9 22.5 21.9 24.3 23.3 1.26 0.10 0.42
d 2 19.3 22.4 22.1 23.2 22.8 1.16 0.05 0.13
d 3 17.4 22.2 22.6 23.5 23.4 0.89 <0.001 <0.01
d 4 17.1 23.8 24.9 25.7 25.4 0.82 <.0001 <.0001
d 6 15.3 26.2 30.0 30.7 30.9 0.71 <.0001 <.0001
d 8 13.9 24.6 28.8 30.4 29.8 1.08 <.0001 <.0001
d 11 12.0 23.8 28.3 33.8 34.0 0.68 <.0001 <.0001
d 14 12.8 23.3 27.9 34.9 37.1 0.76 <.0001 <.0001
d 17 12.6 23.4 28.3 34.7 37.8 1.04 <.0001 <.0001
d 22 (weaning) 13.1 23.5 27.0 33.9 37.4 1.40 <.0001 <0.001
d 23 13.0 24.2 27.4 35.3 36.7 1.20 <.0001 <.0001
d 24 13.2 25.0 28.5 34.7 37.0 1.40 <.0001 <.0001
d 25 14.0 25.0 27.8 33.8 35.4 1.20 <.0001 <.0001
d 29 22.7 33.6 34.0 35.4 34.6 1.30 <.0001 <.0001
d 38 26.4 30.4 30.2 30.1 29.6 0.80 0.05 <0.01
d 522 30.2 31.0 30.0 30.7 30.2 0.90 0.95 0.75 1Iron treatments were administered after d 0 blood sampling. 2Treatment means reduced to 8 pigs per treatment.

71
Table 4.8. Effects of iron injection dosage on red blood cell count (RBC, 106/µL)1
Iron injection, mg Fe Contrast
Time 0 50 100 200 300 SEM L Q
No. of Pigs 10 10 10 10 10
d 0 3.50 3.84 3.73 4.03 3.88 0.20 0.14 0.29
d 1 3.22 3.63 3.47 3.94 3.67 0.21 0.08 0.17
d 2 3.05 3.46 3.34 3.56 3.43 0.19 0.20 0.24
d 3 2.89 3.33 3.26 3.48 3.37 0.16 0.05 0.12
d 4 2.91 3.34 3.37 3.54 3.41 0.15 0.03 0.05
d 6 2.71 3.71 3.89 4.00 3.98 0.17 <.0001 <0.001
d 8 2.68 3.90 4.05 4.13 4.21 0.19 <.0001 <0.01
d 11 2.45 4.14 4.39 4.70 4.79 0.18 <.0001 <.0001
d 14 2.90 4.45 4.78 5.08 5.38 0.19 <.0001 <.0001
d 17 3.07 4.84 5.29 5.44 5.77 0.24 <.0001 <0.01
d 22 (weaning) 3.44 5.49 5.69 5.81 5.98 0.29 <.0001 <0.001
d 23 3.37 5.68 5.83 6.12 5.96 0.24 <.0001 <.0001
d 24 3.44 5.87 6.08 6.01 6.05 0.26 <.0001 <.0001
d 25 3.40 5.63 5.82 5.86 5.78 0.24 <.0001 <.0001
d 29 4.10 6.21 6.22 5.94 5.55 0.23 0.01 <.0001
d 38 4.14 5.08 5.11 4.98 4.71 0.16 0.17 <.0001
d 522 4.89 5.19 5.03 5.07 5.02 0.15 0.85 0.43 1Iron treatments were administered after d 0 blood sampling. 2Treatment means reduced to 8 pigs per treatment.
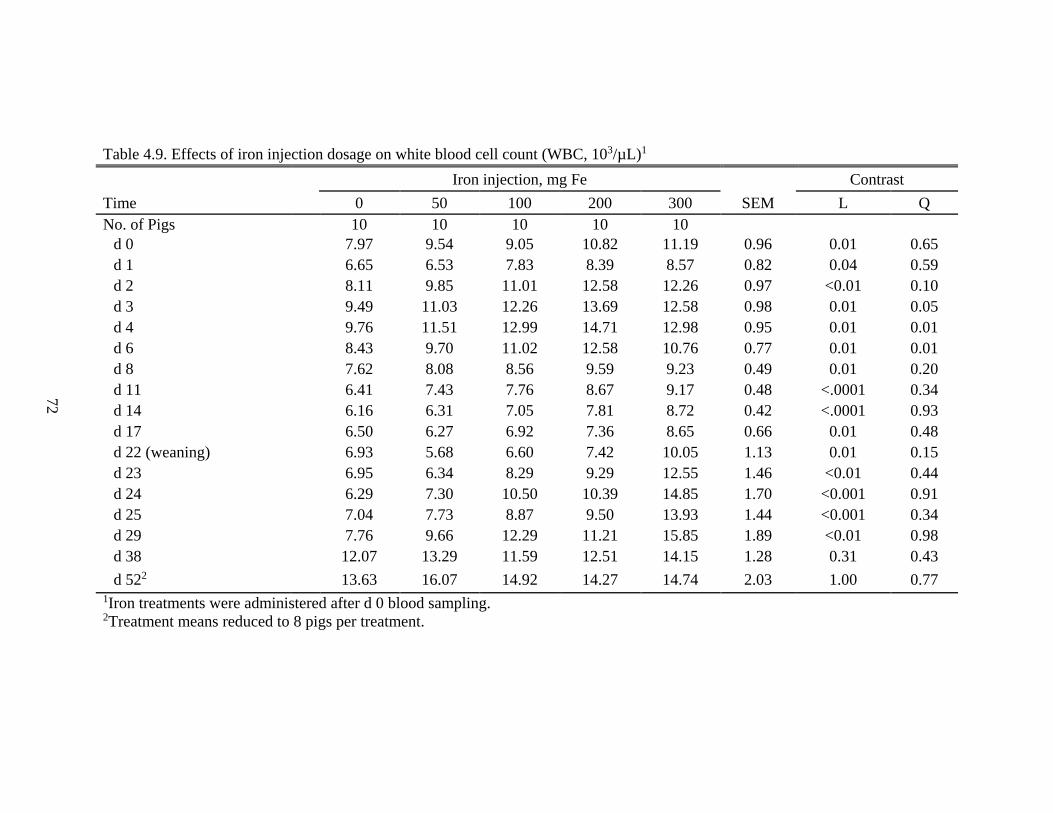
72
Table 4.9. Effects of iron injection dosage on white blood cell count (WBC, 103/µL)1
Iron injection, mg Fe Contrast
Time 0 50 100 200 300 SEM L Q
No. of Pigs 10 10 10 10 10
d 0 7.97 9.54 9.05 10.82 11.19 0.96 0.01 0.65
d 1 6.65 6.53 7.83 8.39 8.57 0.82 0.04 0.59
d 2 8.11 9.85 11.01 12.58 12.26 0.97 <0.01 0.10
d 3 9.49 11.03 12.26 13.69 12.58 0.98 0.01 0.05
d 4 9.76 11.51 12.99 14.71 12.98 0.95 0.01 0.01
d 6 8.43 9.70 11.02 12.58 10.76 0.77 0.01 0.01
d 8 7.62 8.08 8.56 9.59 9.23 0.49 0.01 0.20
d 11 6.41 7.43 7.76 8.67 9.17 0.48 <.0001 0.34
d 14 6.16 6.31 7.05 7.81 8.72 0.42 <.0001 0.93
d 17 6.50 6.27 6.92 7.36 8.65 0.66 0.01 0.48
d 22 (weaning) 6.93 5.68 6.60 7.42 10.05 1.13 0.01 0.15
d 23 6.95 6.34 8.29 9.29 12.55 1.46 <0.01 0.44
d 24 6.29 7.30 10.50 10.39 14.85 1.70 <0.001 0.91
d 25 7.04 7.73 8.87 9.50 13.93 1.44 <0.001 0.34
d 29 7.76 9.66 12.29 11.21 15.85 1.89 <0.01 0.98
d 38 12.07 13.29 11.59 12.51 14.15 1.28 0.31 0.43
d 522 13.63 16.07 14.92 14.27 14.74 2.03 1.00 0.77 1Iron treatments were administered after d 0 blood sampling. 2Treatment means reduced to 8 pigs per treatment.
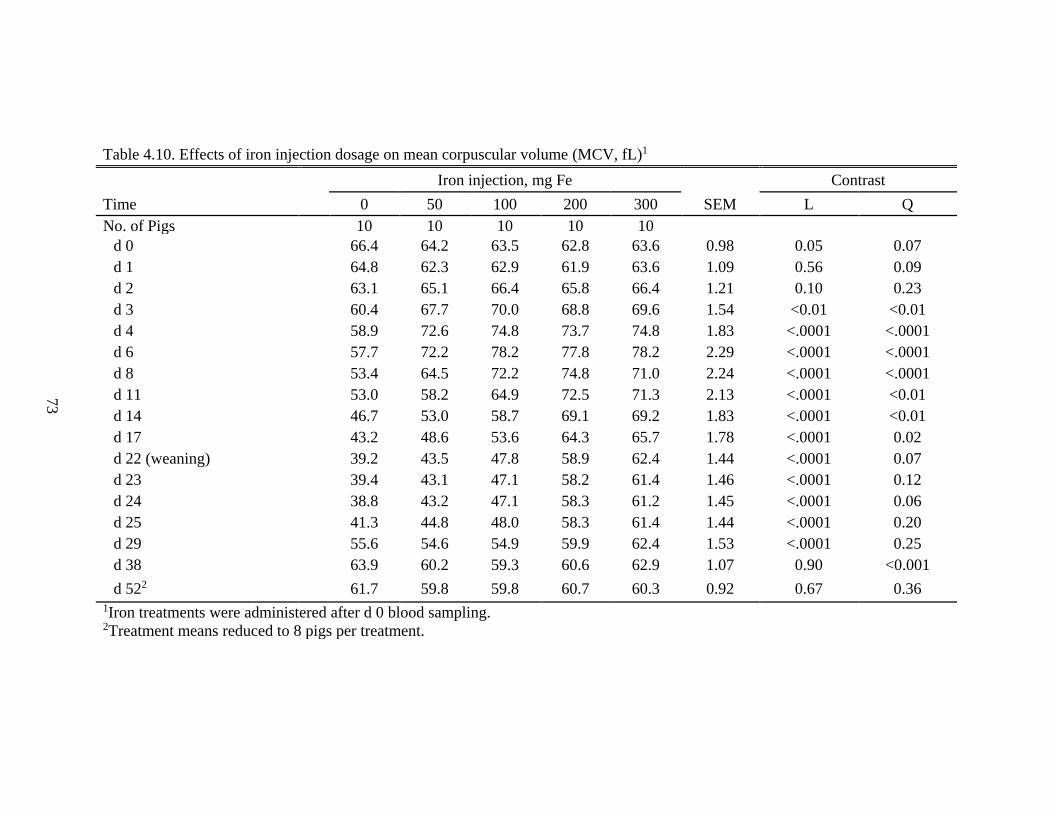
73
Table 4.10. Effects of iron injection dosage on mean corpuscular volume (MCV, fL)1
Iron injection, mg Fe Contrast
Time 0 50 100 200 300 SEM L Q
No. of Pigs 10 10 10 10 10
d 0 66.4 64.2 63.5 62.8 63.6 0.98 0.05 0.07
d 1 64.8 62.3 62.9 61.9 63.6 1.09 0.56 0.09
d 2 63.1 65.1 66.4 65.8 66.4 1.21 0.10 0.23
d 3 60.4 67.7 70.0 68.8 69.6 1.54 <0.01 <0.01
d 4 58.9 72.6 74.8 73.7 74.8 1.83 <.0001 <.0001
d 6 57.7 72.2 78.2 77.8 78.2 2.29 <.0001 <.0001
d 8 53.4 64.5 72.2 74.8 71.0 2.24 <.0001 <.0001
d 11 53.0 58.2 64.9 72.5 71.3 2.13 <.0001 <0.01
d 14 46.7 53.0 58.7 69.1 69.2 1.83 <.0001 <0.01
d 17 43.2 48.6 53.6 64.3 65.7 1.78 <.0001 0.02
d 22 (weaning) 39.2 43.5 47.8 58.9 62.4 1.44 <.0001 0.07
d 23 39.4 43.1 47.1 58.2 61.4 1.46 <.0001 0.12
d 24 38.8 43.2 47.1 58.3 61.2 1.45 <.0001 0.06
d 25 41.3 44.8 48.0 58.3 61.4 1.44 <.0001 0.20
d 29 55.6 54.6 54.9 59.9 62.4 1.53 <.0001 0.25
d 38 63.9 60.2 59.3 60.6 62.9 1.07 0.90 <0.001
d 522 61.7 59.8 59.8 60.7 60.3 0.92 0.67 0.36 1Iron treatments were administered after d 0 blood sampling. 2Treatment means reduced to 8 pigs per treatment.
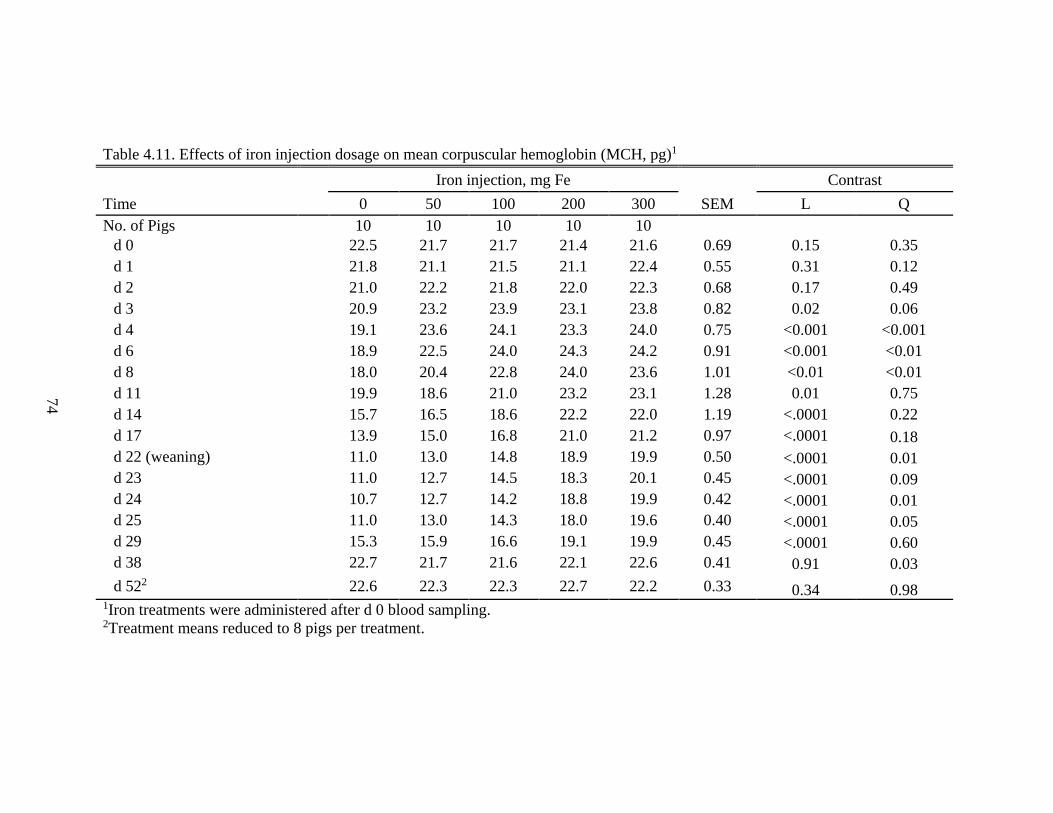
74
Table 4.11. Effects of iron injection dosage on mean corpuscular hemoglobin (MCH, pg)1
Iron injection, mg Fe Contrast
Time 0 50 100 200 300 SEM L Q
No. of Pigs 10 10 10 10 10
d 0 22.5 21.7 21.7 21.4 21.6 0.69 0.15 0.35
d 1 21.8 21.1 21.5 21.1 22.4 0.55 0.31 0.12
d 2 21.0 22.2 21.8 22.0 22.3 0.68 0.17 0.49
d 3 20.9 23.2 23.9 23.1 23.8 0.82 0.02 0.06
d 4 19.1 23.6 24.1 23.3 24.0 0.75 <0.001 <0.001
d 6 18.9 22.5 24.0 24.3 24.2 0.91 <0.001 <0.01
d 8 18.0 20.4 22.8 24.0 23.6 1.01 <0.01 <0.01
d 11 19.9 18.6 21.0 23.2 23.1 1.28 0.01 0.75
d 14 15.7 16.5 18.6 22.2 22.0 1.19 <.0001 0.22
d 17 13.9 15.0 16.8 21.0 21.2 0.97 <.0001 0.18
d 22 (weaning) 11.0 13.0 14.8 18.9 19.9 0.50 <.0001 0.01
d 23 11.0 12.7 14.5 18.3 20.1 0.45 <.0001 0.09
d 24 10.7 12.7 14.2 18.8 19.9 0.42 <.0001 0.01
d 25 11.0 13.0 14.3 18.0 19.6 0.40 <.0001 0.05
d 29 15.3 15.9 16.6 19.1 19.9 0.45 <.0001 0.60
d 38 22.7 21.7 21.6 22.1 22.6 0.41 0.91 0.03
d 522 22.6 22.3 22.3 22.7 22.2 0.33 0.34 0.98 1Iron treatments were administered after d 0 blood sampling. 2Treatment means reduced to 8 pigs per treatment.
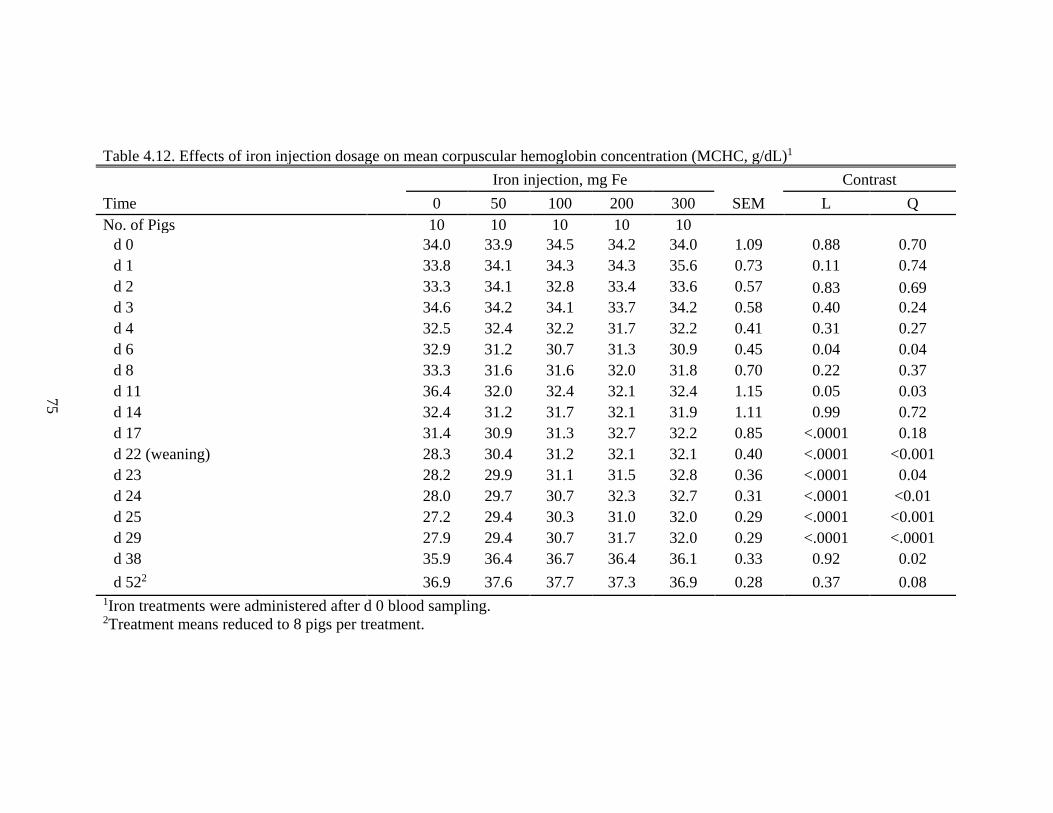
75
Table 4.12. Effects of iron injection dosage on mean corpuscular hemoglobin concentration (MCHC, g/dL)1
Iron injection, mg Fe Contrast
Time 0 50 100 200 300 SEM L Q
No. of Pigs 10 10 10 10 10
d 0 34.0 33.9 34.5 34.2 34.0 1.09 0.88 0.70
d 1 33.8 34.1 34.3 34.3 35.6 0.73 0.11 0.74
d 2 33.3 34.1 32.8 33.4 33.6 0.57 0.83 0.69
d 3 34.6 34.2 34.1 33.7 34.2 0.58 0.40 0.24
d 4 32.5 32.4 32.2 31.7 32.2 0.41 0.31 0.27
d 6 32.9 31.2 30.7 31.3 30.9 0.45 0.04 0.04
d 8 33.3 31.6 31.6 32.0 31.8 0.70 0.22 0.37
d 11 36.4 32.0 32.4 32.1 32.4 1.15 0.05 0.03
d 14 32.4 31.2 31.7 32.1 31.9 1.11 0.99 0.72
d 17 31.4 30.9 31.3 32.7 32.2 0.85 <.0001 0.18
d 22 (weaning) 28.3 30.4 31.2 32.1 32.1 0.40 <.0001 <0.001
d 23 28.2 29.9 31.1 31.5 32.8 0.36 <.0001 0.04
d 24 28.0 29.7 30.7 32.3 32.7 0.31 <.0001 <0.01
d 25 27.2 29.4 30.3 31.0 32.0 0.29 <.0001 <0.001
d 29 27.9 29.4 30.7 31.7 32.0 0.29 <.0001 <.0001
d 38 35.9 36.4 36.7 36.4 36.1 0.33 0.92 0.02
d 522 36.9 37.6 37.7 37.3 36.9 0.28 0.37 0.08 1Iron treatments were administered after d 0 blood sampling. 2Treatment means reduced to 8 pigs per treatment.
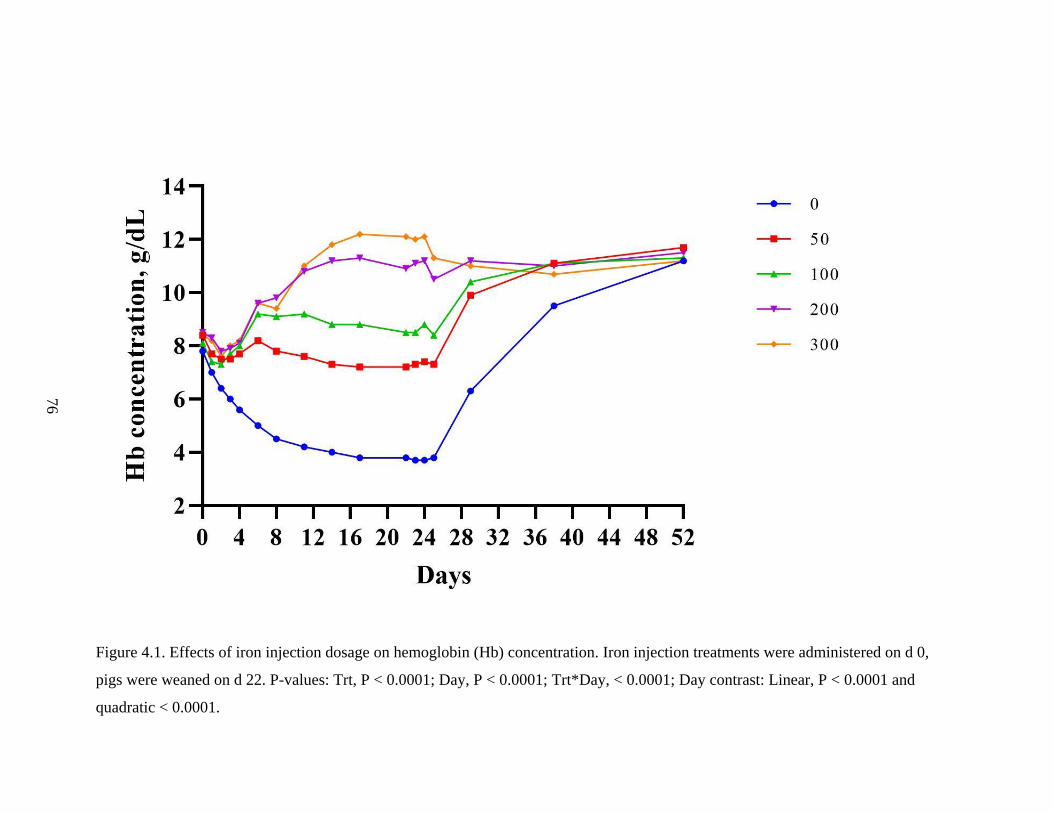
76
Figure 4.1. Effects of iron injection dosage on hemoglobin (Hb) concentration. Iron injection treatments were administered on d 0,
pigs were weaned on d 22. P-values: Trt, P < 0.0001; Day, P < 0.0001; Trt*Day, < 0.0001; Day contrast: Linear, P < 0.0001 and
quadratic < 0.0001.
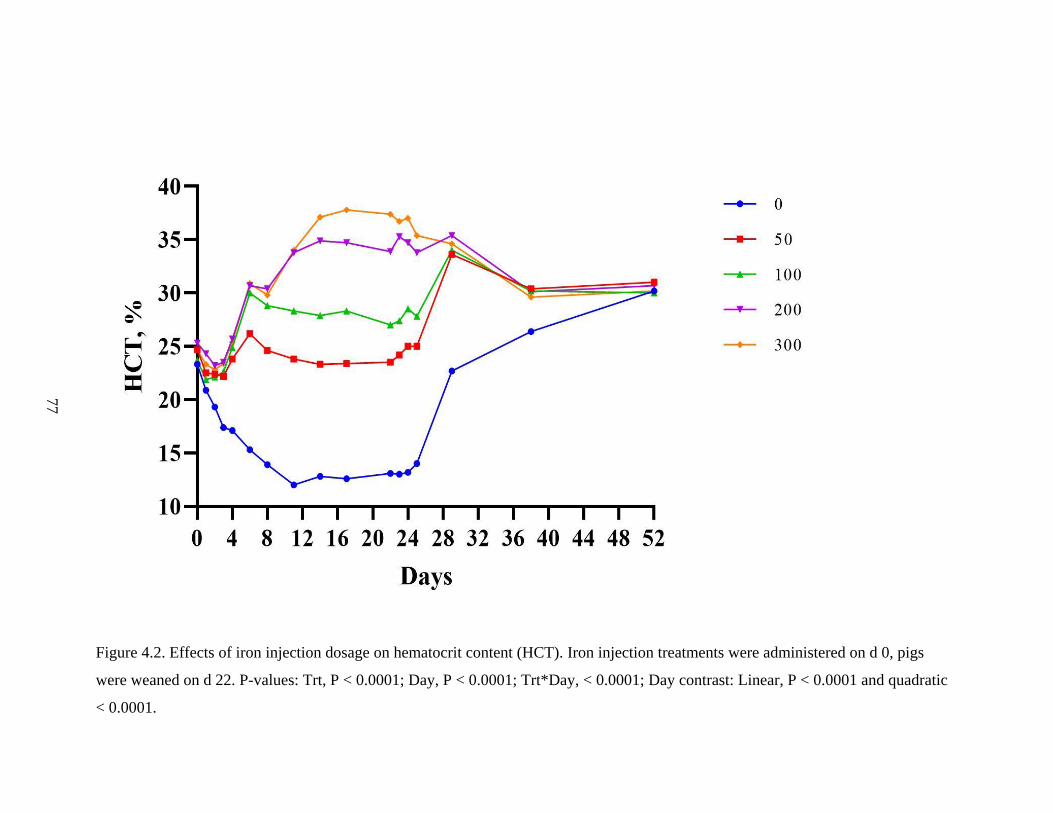
77
Figure 4.2. Effects of iron injection dosage on hematocrit content (HCT). Iron injection treatments were administered on d 0, pigs
were weaned on d 22. P-values: Trt, P < 0.0001; Day, P < 0.0001; Trt*Day, < 0.0001; Day contrast: Linear, P < 0.0001 and quadratic
< 0.0001.
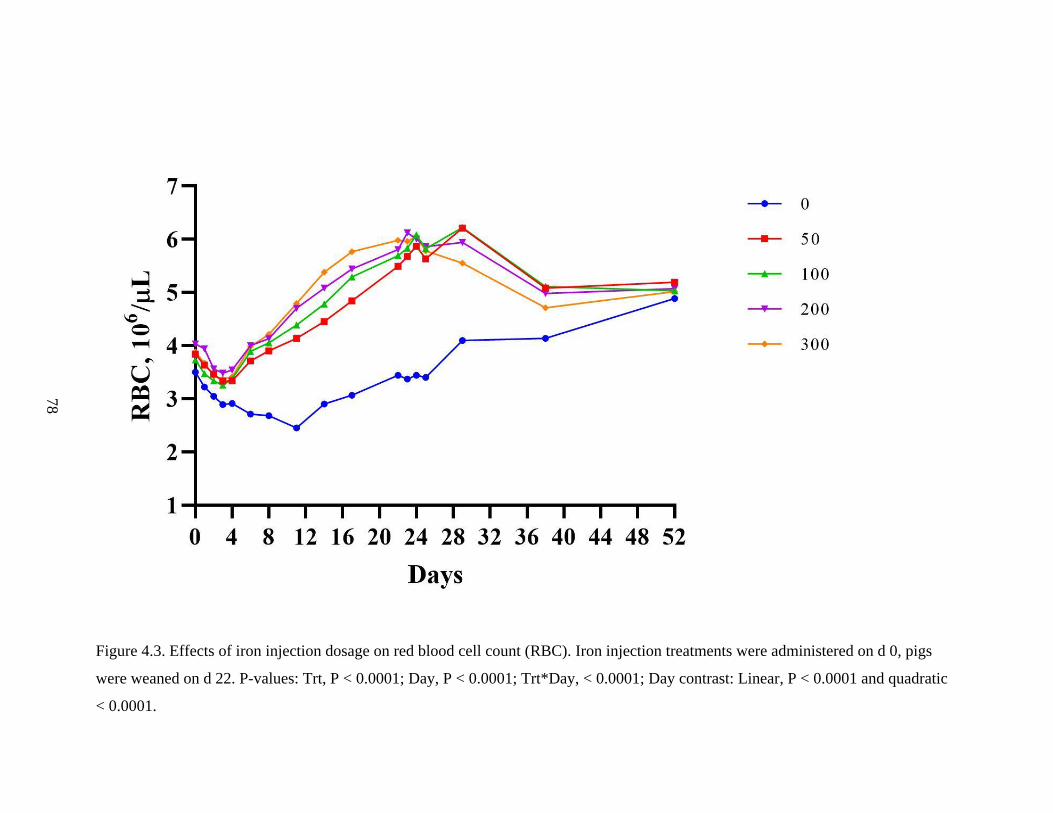
78
Figure 4.3. Effects of iron injection dosage on red blood cell count (RBC). Iron injection treatments were administered on d 0, pigs
were weaned on d 22. P-values: Trt, P < 0.0001; Day, P < 0.0001; Trt*Day, < 0.0001; Day contrast: Linear, P < 0.0001 and quadratic
< 0.0001.
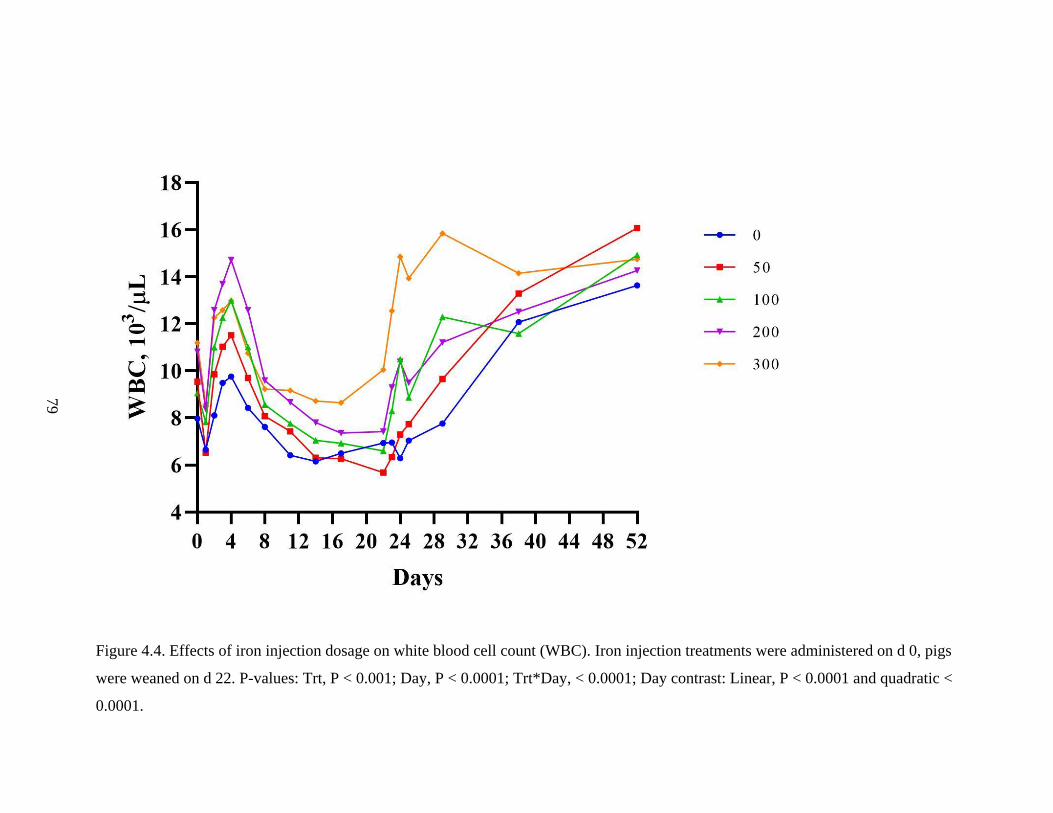
79
Figure 4.4. Effects of iron injection dosage on white blood cell count (WBC). Iron injection treatments were administered on d 0, pigs
were weaned on d 22. P-values: Trt, P < 0.001; Day, P < 0.0001; Trt*Day, < 0.0001; Day contrast: Linear, P < 0.0001 and quadratic <
0.0001.
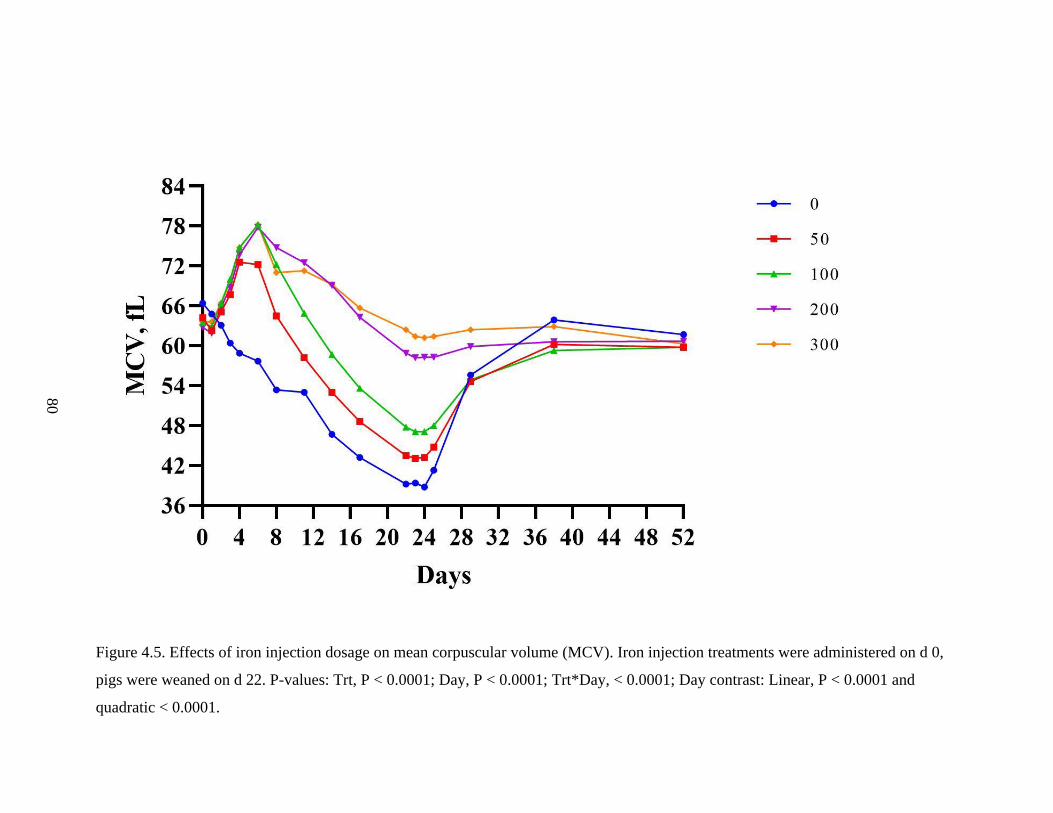
80
Figure 4.5. Effects of iron injection dosage on mean corpuscular volume (MCV). Iron injection treatments were administered on d 0,
pigs were weaned on d 22. P-values: Trt, P < 0.0001; Day, P < 0.0001; Trt*Day, < 0.0001; Day contrast: Linear, P < 0.0001 and
quadratic < 0.0001.
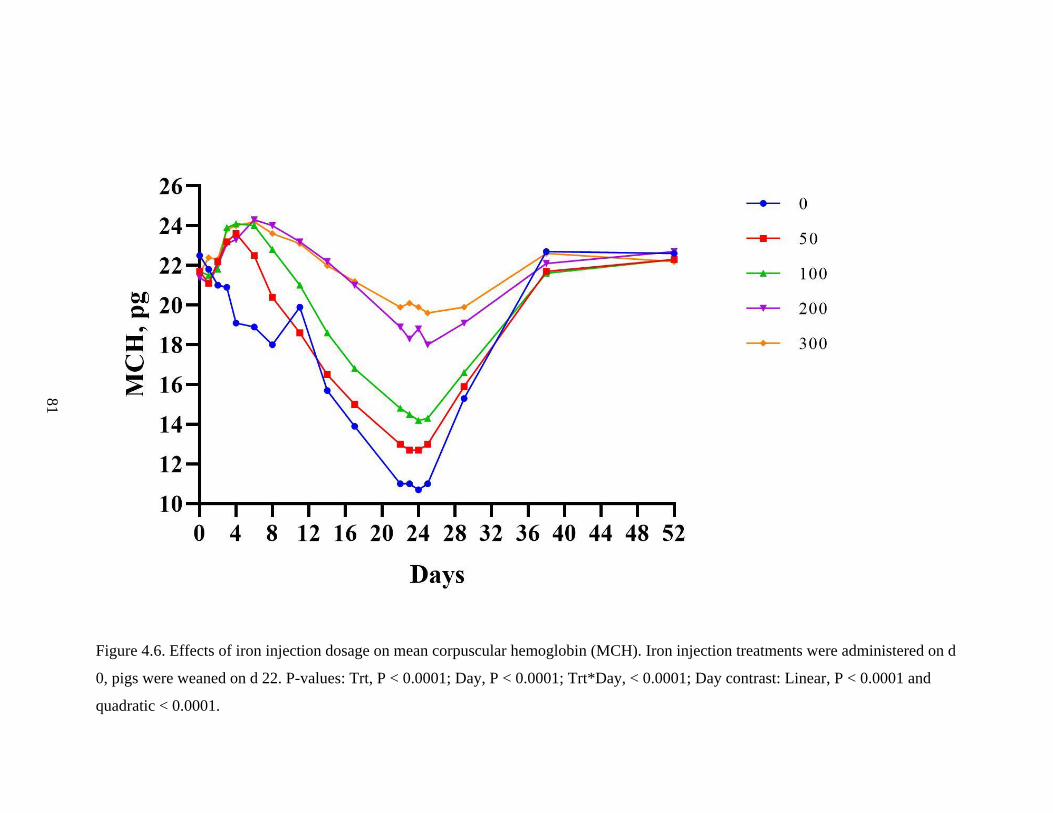
81
Figure 4.6. Effects of iron injection dosage on mean corpuscular hemoglobin (MCH). Iron injection treatments were administered on d
0, pigs were weaned on d 22. P-values: Trt, P < 0.0001; Day, P < 0.0001; Trt*Day, < 0.0001; Day contrast: Linear, P < 0.0001 and
quadratic < 0.0001.
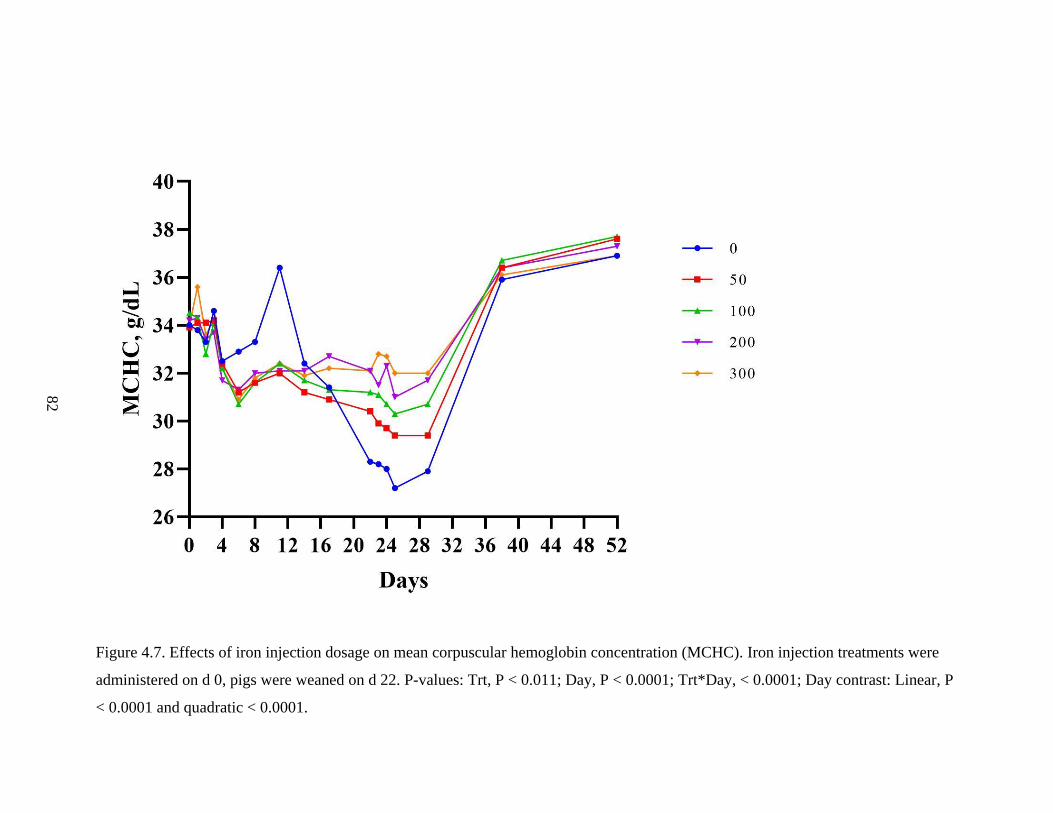
82
Figure 4.7. Effects of iron injection dosage on mean corpuscular hemoglobin concentration (MCHC). Iron injection treatments were
administered on d 0, pigs were weaned on d 22. P-values: Trt, P < 0.011; Day, P < 0.0001; Trt*Day, < 0.0001; Day contrast: Linear, P
< 0.0001 and quadratic < 0.0001.
83
4.4.3 Tissue measures
A total of 3 pigs per treatment per sampling period were used to determine the
mineral concentration of liver, spleen, heart, and kidney. Tissue mineral concentrations
are reported on a DM basis. Throughout the experiment, the average DM content for
liver, spleen, heart, and kidney were 22.2, 19.5, 18.3, and 17.1 % respectively.
Liver iron concentration (Table 4.13) was higher in response to increasing iron
injection dosage at weaning (d 22) and d 38 (end of Phase I) (P < 0.01 and P = 0.02;
respectively). Also at weaning, the 300 mg iron treatment had liver iron concentrations
about 17 times greater than the pigs not receiving iron. Liver zinc concentration increased
(P = 0.01) with increasing iron treatments at d 52 (end of Phase II).
Similar to the liver, at weaning the spleen (Table 4.14) exhibited an increase in iron
concentration (P < 0.01), but differently there was a decrease in spleen zinc content (P =
0.03) as iron injection dosage increased with a tendency (P= 0.08) to decrease
quadratically with the 200 mg iron treatment having the largest reduction which
thereafter was increased. At d 38 the relative weight of the spleen decreased (P = 0.02) as
treatments increased. Interestingly at d 52 (end of Phase II), an increase (P = 0.04) in
spleen iron content as iron dosage increased was observed again. Also at d 52, there was
a numerical decrease in spleen zinc content through the 200 mg iron treatment then an
increase was observed for the 300 mg iron treatment. Notably, over the tissue collection
periods of the experiment (weaning, d 38, and d 52), a decrease in mean zinc and copper
concentration was observed for both the liver and spleen in contrast to iron which
increased with time.
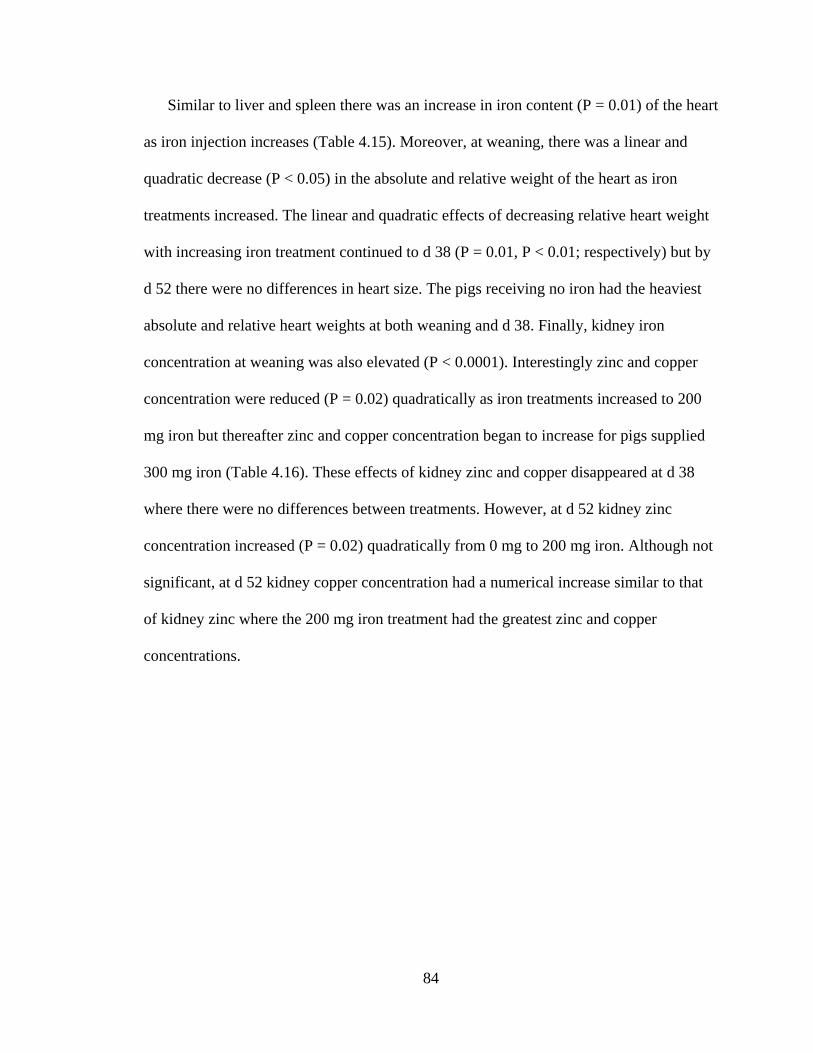
84
Similar to liver and spleen there was an increase in iron content (P = 0.01) of the heart
as iron injection increases (Table 4.15). Moreover, at weaning, there was a linear and
quadratic decrease (P < 0.05) in the absolute and relative weight of the heart as iron
treatments increased. The linear and quadratic effects of decreasing relative heart weight
with increasing iron treatment continued to d 38 (P = 0.01, P < 0.01; respectively) but by
d 52 there were no differences in heart size. The pigs receiving no iron had the heaviest
absolute and relative heart weights at both weaning and d 38. Finally, kidney iron
concentration at weaning was also elevated (P < 0.0001). Interestingly zinc and copper
concentration were reduced (P = 0.02) quadratically as iron treatments increased to 200
mg iron but thereafter zinc and copper concentration began to increase for pigs supplied
300 mg iron (Table 4.16). These effects of kidney zinc and copper disappeared at d 38
where there were no differences between treatments. However, at d 52 kidney zinc
concentration increased (P = 0.02) quadratically from 0 mg to 200 mg iron. Although not
significant, at d 52 kidney copper concentration had a numerical increase similar to that
of kidney zinc where the 200 mg iron treatment had the greatest zinc and copper
concentrations.
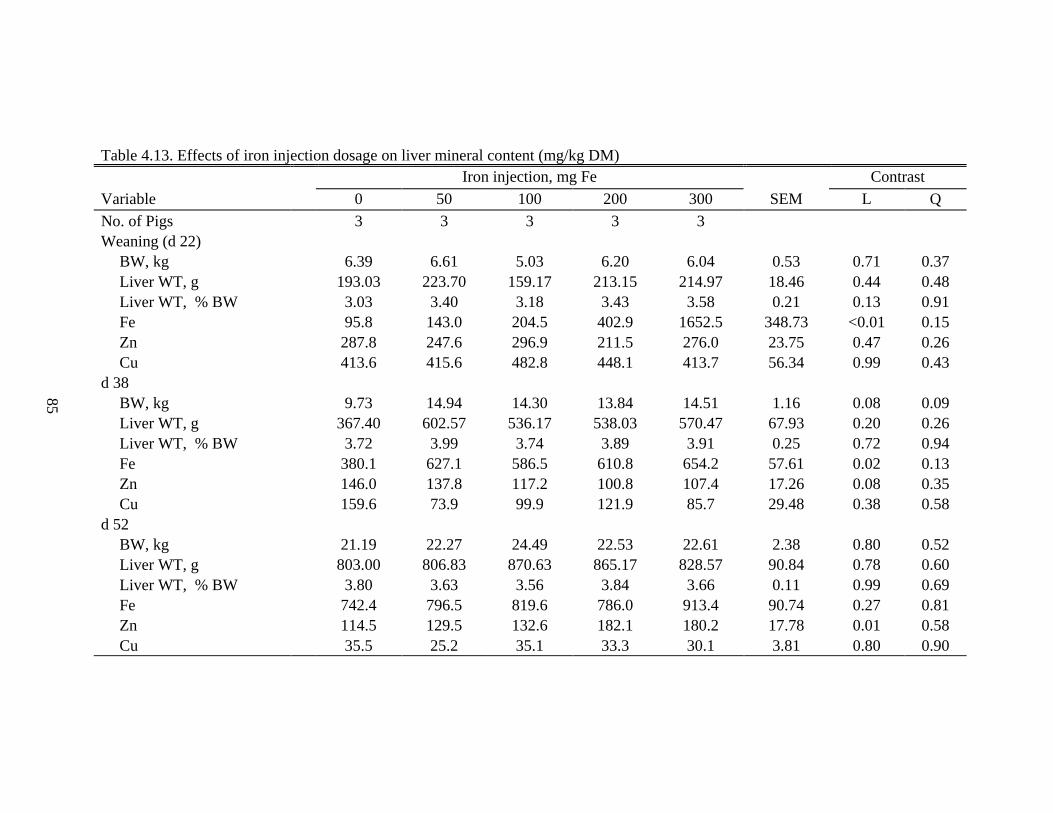
85
Table 4.13. Effects of iron injection dosage on liver mineral content (mg/kg DM)
Iron injection, mg Fe Contrast
Variable 0 50 100 200 300 SEM L Q
No. of Pigs 3 3 3 3 3
Weaning (d 22)
BW, kg 6.39 6.61 5.03 6.20 6.04 0.53 0.71 0.37
Liver WT, g 193.03 223.70 159.17 213.15 214.97 18.46 0.44 0.48
Liver WT, % BW 3.03 3.40 3.18 3.43 3.58 0.21 0.13 0.91
Fe 95.8 143.0 204.5 402.9 1652.5 348.73 <0.01 0.15
Zn 287.8 247.6 296.9 211.5 276.0 23.75 0.47 0.26
Cu 413.6 415.6 482.8 448.1 413.7 56.34 0.99 0.43
d 38
BW, kg 9.73 14.94 14.30 13.84 14.51 1.16 0.08 0.09
Liver WT, g 367.40 602.57 536.17 538.03 570.47 67.93 0.20 0.26
Liver WT, % BW 3.72 3.99 3.74 3.89 3.91 0.25 0.72 0.94
Fe 380.1 627.1 586.5 610.8 654.2 57.61 0.02 0.13
Zn 146.0 137.8 117.2 100.8 107.4 17.26 0.08 0.35
Cu 159.6 73.9 99.9 121.9 85.7 29.48 0.38 0.58
d 52
BW, kg 21.19 22.27 24.49 22.53 22.61 2.38 0.80 0.52
Liver WT, g 803.00 806.83 870.63 865.17 828.57 90.84 0.78 0.60
Liver WT, % BW 3.80 3.63 3.56 3.84 3.66 0.11 0.99 0.69
Fe 742.4 796.5 819.6 786.0 913.4 90.74 0.27 0.81
Zn 114.5 129.5 132.6 182.1 180.2 17.78 0.01 0.58
Cu 35.5 25.2 35.1 33.3 30.1 3.81 0.80 0.90
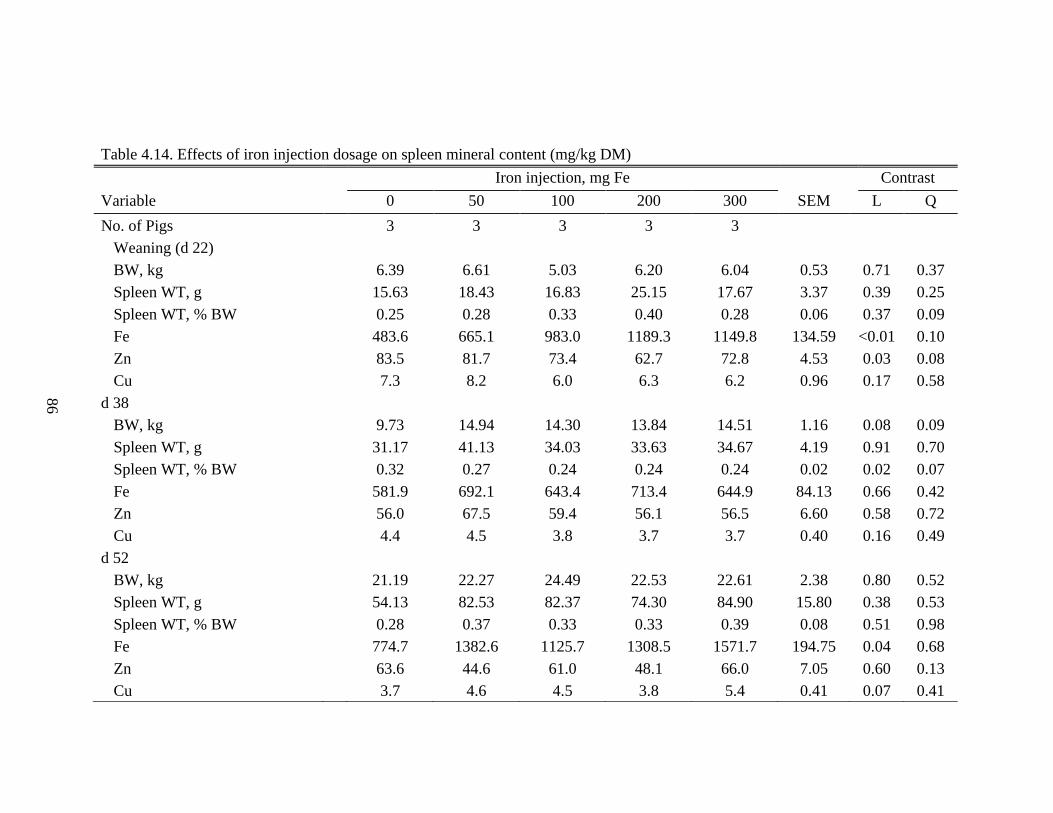
86
Table 4.14. Effects of iron injection dosage on spleen mineral content (mg/kg DM)
Iron injection, mg Fe Contrast
Variable 0 50 100 200 300 SEM L Q
No. of Pigs 3 3 3 3 3
Weaning (d 22)
BW, kg 6.39 6.61 5.03 6.20 6.04 0.53 0.71 0.37
Spleen WT, g 15.63 18.43 16.83 25.15 17.67 3.37 0.39 0.25
Spleen WT, % BW 0.25 0.28 0.33 0.40 0.28 0.06 0.37 0.09
Fe 483.6 665.1 983.0 1189.3 1149.8 134.59 <0.01 0.10
Zn 83.5 81.7 73.4 62.7 72.8 4.53 0.03 0.08
Cu 7.3 8.2 6.0 6.3 6.2 0.96 0.17 0.58
d 38
BW, kg 9.73 14.94 14.30 13.84 14.51 1.16 0.08 0.09
Spleen WT, g 31.17 41.13 34.03 33.63 34.67 4.19 0.91 0.70
Spleen WT, % BW 0.32 0.27 0.24 0.24 0.24 0.02 0.02 0.07
Fe 581.9 692.1 643.4 713.4 644.9 84.13 0.66 0.42
Zn 56.0 67.5 59.4 56.1 56.5 6.60 0.58 0.72
Cu 4.4 4.5 3.8 3.7 3.7 0.40 0.16 0.49
d 52
BW, kg 21.19 22.27 24.49 22.53 22.61 2.38 0.80 0.52
Spleen WT, g 54.13 82.53 82.37 74.30 84.90 15.80 0.38 0.53
Spleen WT, % BW 0.28 0.37 0.33 0.33 0.39 0.08 0.51 0.98
Fe 774.7 1382.6 1125.7 1308.5 1571.7 194.75 0.04 0.68
Zn 63.6 44.6 61.0 48.1 66.0 7.05 0.60 0.13
Cu 3.7 4.6 4.5 3.8 5.4 0.41 0.07 0.41
87
Table 4.15. Effects of iron injection dosage on heart mineral content (mg/kg DM)
Iron injection, mg Fe Contrast
Variable 0 50 100 200 300 SEM L Q
No. of Pigs 3 3 3 3 3
Weaning (d 22)
BW, kg 6.39 6.61 5.03 6.20 6.04 0.53 0.71 0.37
Heart WT, g 57.50 46.07 32.97 42.90 38.67 3.46 0.01 0.02
Heart WT, % BW 0.90 0.70 0.66 0.70 0.65 0.03 <0.01 0.01
Fe 163.19 190.56 341.71 283.96 379.09 50.11 0.01 0.49
Zn 56.60 61.33 72.03 65.09 53.32 7.64 0.68 0.13
Cu 10.55 12.48 13.84 11.79 10.72 1.18 0.65 0.11
d 38
BW, kg 9.73 14.94 14.30 13.84 14.51 1.16 0.08 0.09
Heart WT, g 72.47 86.23 77.67 73.43 81.33 7.25 0.86 0.97
Heart WT, % BW 0.75 0.58 0.54 0.53 0.56 0.03 0.01 <0.01
Fe 222.72 281.58 247.58 243.68 259.03 28.29 0.75 0.76
Zn 59.29 60.09 55.09 47.95 55.48 2.99 0.08 0.10
Cu 11.95 13.83 13.97 11.83 13.47 0.68 0.82 0.67
d 52
BW, kg 21.19 22.27 24.49 22.53 22.61 2.38 0.80 0.52
Heart WT, g 111.40 108.47 121.20 118.00 115.23 12.89 0.74 0.67
Heart WT, % BW 0.55 0.49 0.49 0.53 0.51 0.05 0.88 0.64
Fe 294.68 357.50 345.50 380.64 320.40 33.82 0.65 0.12
Zn 53.81 47.37 46.79 52.34 49.40 3.44 0.88 0.51
Cu 16.16 14.65 14.08 15.87 14.87 1.46 0.87 0.69
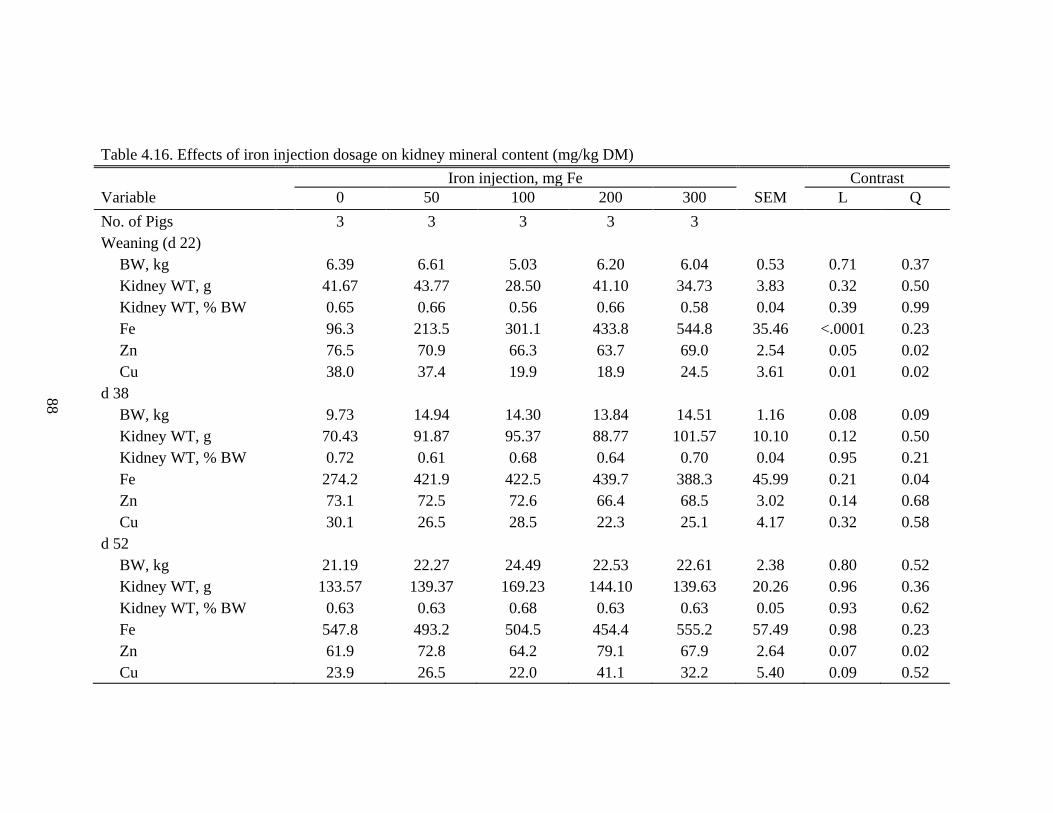
88
Table 4.16. Effects of iron injection dosage on kidney mineral content (mg/kg DM)
Iron injection, mg Fe Contrast
Variable 0 50 100 200 300 SEM L Q
No. of Pigs 3 3 3 3 3
Weaning (d 22)
BW, kg 6.39 6.61 5.03 6.20 6.04 0.53 0.71 0.37
Kidney WT, g 41.67 43.77 28.50 41.10 34.73 3.83 0.32 0.50
Kidney WT, % BW 0.65 0.66 0.56 0.66 0.58 0.04 0.39 0.99
Fe 96.3 213.5 301.1 433.8 544.8 35.46 <.0001 0.23
Zn 76.5 70.9 66.3 63.7 69.0 2.54 0.05 0.02
Cu 38.0 37.4 19.9 18.9 24.5 3.61 0.01 0.02
d 38
BW, kg 9.73 14.94 14.30 13.84 14.51 1.16 0.08 0.09
Kidney WT, g 70.43 91.87 95.37 88.77 101.57 10.10 0.12 0.50
Kidney WT, % BW 0.72 0.61 0.68 0.64 0.70 0.04 0.95 0.21
Fe 274.2 421.9 422.5 439.7 388.3 45.99 0.21 0.04
Zn 73.1 72.5 72.6 66.4 68.5 3.02 0.14 0.68
Cu 30.1 26.5 28.5 22.3 25.1 4.17 0.32 0.58
d 52
BW, kg 21.19 22.27 24.49 22.53 22.61 2.38 0.80 0.52
Kidney WT, g 133.57 139.37 169.23 144.10 139.63 20.26 0.96 0.36
Kidney WT, % BW 0.63 0.63 0.68 0.63 0.63 0.05 0.93 0.62
Fe 547.8 493.2 504.5 454.4 555.2 57.49 0.98 0.23
Zn 61.9 72.8 64.2 79.1 67.9 2.64 0.07 0.02
Cu 23.9 26.5 22.0 41.1 32.2 5.40 0.09 0.52
89
4.5 Discussion
4.5.1 Growth performance
Increasing iron injection dosages at birth resulted in increased growth performance
during both the lactation and nursery periods. The improved growth in the present
experiment was mostly noticed at Week 3, which was the week of weaning, and the first
2 weeks of the nursery period (Week 4 and 5). The days leading up to weaning (d 17 to
21) have been shown to be important in regard to hematological measures declining and
to levels lower than initial values (Holter et al., 1991). It has also been observed that
optimal iron status (Hb > 11g/dL) at weaning may lead to improved growth performance
in the subsequent nursery period (Fredericks et al., 2018). The positive growth
performance that may be associated with optimal iron status is attributed to improved
oxygen transport, immune function, vitality, and metabolism (Von der Recke et al.,
2014).
Overall, pigs not receiving an iron supplement demonstrated numerically and
statistically the lowest growth performance. This poor growth performance from the 0 mg
iron injection group is accompanied by low CBC and tissue mineral concentrations
indicating that iron-deficient anemia was induced. There was a linear increase (P = 0.03)
in ADG during Week 1 as the iron dosage increased, which was later observed in Week 3
with a quadratic increase (P = 0.01) as well. Williams et al. (2018) demonstrated only a
quadratic (P = 0.002) improvement in ADG with increasing iron dosage from 0 to 50 mg
iron and no further improvement thereafter for the lactation period after being
administered various amounts of injectable iron (0, 50, 100, 150, and 200 mg iron).
90
4.5.2 Hematological measures
As expected, before the administration of iron treatments all CBC measurements with
the exception of WBC were similar between treatments. Unexpectedly, WBC results
were different before any of the treatments were administered. Although there was a
difference, all means were within the reference ranges described by Perri et al. (2017).
In the current experiment, increasing the dosage of injectable iron at birth led to
increasing CBC measurements (Hb, HCT, RBC, WBC, MCV, MCH, and MCHC)
throughout the experiment. For the most part, the time course of Hb, HCT, RBC, MCV,
and MCH were very similar. These measurements tended to noticeably differ around d 3
post-injection, continuing to differ until d 29. However, by d 38 the differences between
treatments were less clear than the previous days, and by d 52 the differences that were
once present disappeared. Williams et al. (2018) reported linear and quadratic increases
(P = 0.001) of Hb concentrations and HCT on d 11 and 21 in response to increasing iron
dosage (0, 50, 100, 150, and 200 mg iron). These findings agree with the present study;
however, Williams et al. (2018) also reported a linear increase (P = 0.001) in Hb and
HCT observed on d 35. In contrast with the previous work, on d 38 Hb and HCT
increased from iron treatments 0 to 50, but thereafter remained similar. Notably, the
nursery diets used by Williams et al. (2018) contained similar analyzed levels of iron in
the diet compared to the present experiment (255 ppm vs 220 ppm iron). In the present
experiment, absolute Hb concentration for the 200 and 300 mg iron treatments peaked at
17 days after administration of the injection where it then began to decline. This is in
agreement with the theoretical model proposed by Van Gorp et al. (2012), suggesting that
the iron supply from the initial iron injection will only last approximately 17 to 18 days.
91
Egeli et al. (1998) reported normal and anemic values for HCT, RBC, MCV, MCH,
and MCHC at 21 d after receiving or not receiving an iron injection. In agreement with
Egeli et al. (1998), only the 300 mg iron treatment in the present experiment was equal to
or above their normal HCT (37% vs. 34%) and MCH (19.9 pg vs. 19.2 pg) values which
were observed from pigs receiving 180 mg iron at processing, while all the treatments in
the current study with the exception of 0 mg iron were above the RBC and MCHC values
(> 5.35 M/µL, > 30.2 g/dL; respectively). In contrast, all of the treatments in the current
experiment were below the MCV value (63.6) reported by Egegli et al. (1998). Notably,
in the experiment reported by Egegli et al. (1998) they offered a creep feed as an
additional supplement during the lactation period in contrast to no creep feed being
offered in the current study which could possibly explain some differences between the
two studies.
White blood cell count also was higher as the iron treatments increased at similar time
points as the RBC measurements. WBC is often used with other indicators to evaluate
immune function. However, because white blood cell count is a total measurement of all
white blood cells which includes neutrophils, basophils, eosinophils, monocytes, and
lymphocytes it can be deceptive by concluding anything simply on total WBC values.
Therefore the reduction seen in WBC for treatments containing no or low doses of iron
could indicate a possible increase in susceptibility to infection, but without the
measurements of the individual components of white blood cells this assumption is
uncertain.
Different from all the other CBC measurements, mean corpuscular hemoglobin
concentration (MCHC) decreased in response to increasing iron dosage from d 6 to 11.
92
More so from d 17 to 29, the results were completely opposite in which MCHC increased
with increasing iron. Mean corpuscular hemoglobin concentration is the concentration of
hemoglobin within the RBC usually indicating the oxygen-carrying capacity of the blood.
Data reported by Egegli et al. (1998) demonstrated that anemic pigs supplied with no iron
at birth have higher MCHC values than normal pigs which received an iron injection.
This would explain the decrease in MCHC observed with increasing iron in the current
experiment from d 6 to 11. Due to the lower RBC number for pigs not receiving iron at
birth the body may be compensating by loading hemoglobin within the red blood cells
that are present. Later on from d 17 through 29 there was an increase in MCHC with
increasing iron dosage, this improvement is simply explained by the other improvements
in CBC measurements associated with increasing iron dosage which all can contribute to
improved hematological measures. The elevated MCHC at d 6 to 11 for pigs not
receiving iron at birth is in disagreement with current literature explaining that iron-
deficient anemia is defined by hypochromic red blood cells (Dallman, 1986; Szudizik et
al., 2018). Due to the high MCHC content, the red blood cells will appear a darker color
because of the higher hemoglobin concentration within the red blood cells. This is
particularly interesting because, from the current data, it seems that the pigs receiving 0
mg iron at birth were demonstrating a biological compensation for the lack of iron until it
is physically incapable of doing so (after d 11).
4.5.3 Tissue measures
In the current experiment, there was an increase in the iron concentration of the liver,
spleen, heart, and kidneys at weaning when the injectable iron dose at birth increased.
The liver and spleen are major sites for ferritin and hemosiderin which are iron storage
93
compounds (Dallman, 1986). Thus it is explained why there was a linear response to iron
treatments for liver and spleen concentration at weaning. Iron transport through the body
is dependent on the transport protein transferrin. Transferrin delivers iron at a rate
dependent on the pace of RBC production which is dependent on the overall iron status
of the individual (Huebers and Finch, 1984). This concept may explain why in the present
study there were greater concentrations of iron in tissues of those receiving greater iron
dosages.
At weaning, the heart was larger for pigs receiving no supplemental iron. Due to the
low amount of hemoglobin or oxygen in the blood of anemic pigs, it is proposed that the
heart has to compensate and increase output to deliver more blood (oxygen) to tissues.
These results are in agreement with an explanation by Dallman (1986) describing that
severe anemia leads to cardiac hypertrophy which is what was observed at weaning in the
current experiment.
Also at weaning, the zinc concentration of the spleen and kidney reduced as injectable
iron dosage increased. Iron and zinc have been known to have competitive interaction for
cellular transport especially when there are elevated iron levels (Solomons and Jacob,
1981). More interestingly, Camaschella and Pagani (2018) demonstrated that with higher
iron concentrations in the body, zinc transporter protein 14 (ZIP14) will transport iron in
hepatocytes and other cells which is in agreement with the current data. This could also
explain the trend for a decrease (P = 0.08) in liver zinc concentrations observed at d 38,
which later became an increase (P = 0.01) in liver zinc by the end of the experiment (d
52). Biologically at d 38, the liver and hepatocytes may still be processing the higher iron
concentrations observed at weaning, but once the iron concentrations are under control

94
(observed at d 38) the liver and hepatocytes can then start to compensate for the lower
zinc concentrations leading to the improvement in zinc concentrations by d 52.
4.6 Conclusion
The results from the current experiment demonstrated that without an iron
supplement given at birth pigs become iron deficient which leads to iron-deficient
anemia. Improved growth performance and CBC measurements were observed with
greater injectable iron dosages administered at birth. These data are in agreement with
literature suggesting that an initial supplement of iron given to newborn piglets is vital for
the growth and ability to thrive in later periods of life. In regard to iron injection dosage
in this experiment, the 50, 100, and 200 mg iron treatments were somewhat similar.
However, the 300 mg iron treatment seemed to have a more consistent improvement in
iron status throughout the various times of the experiment.
95
CHAPTER 5. Effects of an additional iron injection administered 4 days before
weaning on growth performance, hematological status, and tissue mineral
concentrations of nursery pigs
5.1 Abstract
The objective of the present experiment was to evaluate the effects of administering
an additional iron injection 4 days before weaning on growth performance, hematological
status, and tissue mineral concentration pre and postweaning. A total of 136 crossbred
pigs (14 to 20 d; initial BW of 5.48 ± 1.08 kg) were selected in pairs that were within a
litter, the same sex, and a BW difference of < 0.41 kg and then assigned to either a
control or treatment group. All pigs received an initial intramuscular (IM) injection of
iron dextran (150 mg iron) at d 1 after birth. Pigs that were assigned to the treatment
group received an additional 150 mg iron injection 4 days before weaning (14 to 20 d), in
contrast to the control group which received no additional iron injection at this time. Pigs
were then weaned 4 days later (at 18 to 24 days) to nursery pens where they were fed a
common two-phase nursery diet. The common nursery diets were formulated to meet or
exceed the NRC (2012) nutrient requirement estimates for pigs 7 to 25 kg. Pigs were
weighed at d -4 (preweaning), 0 (weaning), and then weekly for 4 weeks in the nursery.
Blood and tissue samples were collected at d -4 (preweaning), 0 (weaning), 14, and 27-30
of the nursery for complete blood count (CBC) and tissue mineral concentration (Fe, Zn,
Cu) analysis. All data were subjected to ANOVA by using the individual pig as the
experimental unit. Pigs that received an additional iron injection 4 days before weaning
had a greater (P < 0.05) ADG compared to control pigs at weeks 1, 2, and 3. The
treatment pigs also had greater (P 0.01) ADG for the overall nursery period, and the
96
overall experimental period including the 4 days preweaning. Consequently, the
accumulation of improved growth by pigs that were administered an additional iron
injection before weaning led to a heavier (P < 0.001) final BW (~1 kg) at 4 weeks in the
nursery compared to control pigs. Treatment pigs had higher (P < 0.001) Hb, HCT, RBC,
WBC, MCV and MCH values compared to the control pigs at weaning. The additional
iron injected pigs continued to have higher (P 0.02) Hb, MCV, and MCH values at d
14. However, by the end of the experiment, all CBC measures were similar between the
control and treatment pigs. Similar to the blood measures, the iron concentration of the
liver, spleen, heart, and kidney were all numerically greater for the added-injection pigs
at weaning compared to the control pigs. The results of this experiment suggest that an
additional iron injection administered 4 days before weaning may benefit overall growth
performance as well as improve iron status in the blood and tissues at weaning.
Key Words: iron, iron injection, pigs, weaning, preweaning
97
5.2 Introduction
Modern swine production has undergone improvements in genetic potential leading to
increased growth rates of nursing piglets. It is routine practice to supplement iron to
newborn pigs shortly after birth as they have limited sources of iron. However, recent
work has shown that the iron supplemented to piglets shortly after birth is not sufficient
to maintain the iron status of the pig throughout the lactation period (see Chapter 4;
Bhattarai and Nielsen, 2015; Perri et al., 2016) In addition, the faster-growing pigs are
more susceptible to become iron deficient around weaning causing postweaning problems
(Jolliff and Mahan., 2011). Morales et al. (2018) reported a decline in serum ferritin
concentration on d 17 and 21 from the previous time on d 14 for pigs administered iron
(200 mg iron) after birth indicating that an initial iron injection may only last 14 to 17
days. If so pigs that do grow faster and require more iron during lactation often are
predisposed to an iron gap during the weaning transition. This is where the iron status has
declined in the latter part of the nursing period, then consequently the decline becomes
exacerbated by the weaning stress and low feed intake during the first few days
postweaning.
A practical solution to compensate for the low iron status at weaning would be to
consider an additional iron injection before weaning. Work by Urbaniak et al. (2017)
reported larger pigs (> 6 kg) at weaning that received a second iron injection had greater
growth performance than single injected pigs. Recent work at Kansas State (Williams et
al., 2018b) revealed that at 21 and 35d post-partum pigs receiving an additional iron
injection (administered at d 11) had higher hemoglobin concentration than pigs only
receiving a single injection at processing (d 3). Estienne (2018) showed similar benefiting
98
growth results in the nursery period and increased hematocrit when injecting a second
intramuscular injection of iron at weaning (Estienne and Clark-Deener, 2018).
Van Gorp et al. (2012) suggest that a nursing pig with a normal growth of 7 kg over a
28 d lactation period needs approximately 390 mg iron to last until a dietary source is
available. Fredericks et al. (2018) reported that pigs classified at weaning with optimal
hemoglobin levels (> 11 g/dL) had greater BW at 8 weeks postweaning compared to pigs
under the optimal level. Therefore, it is believed that optimizing the iron status at
weaning can have immense benefits in the nursery. Thus the objective of the present
experiment was to evaluate the effects of administering an additional iron injection 4
days before weaning on growth performance, hematological status, and tissue mineral
concentration pre and postweaning.
5.3 Experimental procedures
This experiment was conducted in environmentally controlled rooms at the University
of Kentucky Swine Research Center under protocols approved by the Institutional
Animal Care and Use Committee of the University of Kentucky.
5.3.1 Animals, housing, management, and experimental design
A total of 136 crossbred pigs [82 barrows and 54 gilts; (Yorkshire x Landrace) x
Large White] from 20 litters with an initial BW of 5.48 ± 1.08 kg were assigned to either
a control or treatment group at around 14-20 days of age through a pairing scheme. At
around 1 d of age, all pigs were subjected to normal farm processing procedures (tail
docking, ear notching, and needle-teeth removal). At this same time, all piglets received a
150 mg iron intramuscular (IM) injection of iron dextran (Henry Schein Animal Health,
Dublin, OH) in the right side of the neck. The pairing process selected pigs based on the
99
following: two pigs from the same litter, with the same sex, and a BW difference of <
0.41 kg. Within a given pair, one pig was assigned to the treatment group and the other
pig to the control group. Pigs assigned to the treatment group received an additional 150
mg iron IM injection 4 days before weaning (14-20 days). In contrast, the pigs allotted to
the control group received no additional injection at this time.
Pigs were weaned in two different groups to a nursery site 4 days following the
additional iron injection of the treatment pigs (18-24 days). The weaning groups were
based on the farrowing schedule of selected litters. In the nursery, pigs were allotted to
pens based on BW, treatment, and sex. Pens consisted of 3 to 5 pigs per pen and were
equalized between treatments. The experiment continued through 27-30 days in the
nursery.
All nursery pens (1.22 m × 1.22 m) were elevated off of the ground in an
environmentally-controlled room and had plastic coated wire flooring. All pens were
equipped with a three-hole plastic feeder and a nipple waterer. Pigs had ad libitum access
to water and feed for the duration of the experiment. Both the control and treatment pigs
received the same nursery diets.
A total of 8 pigs (4 pigs per treatment) were selected for sacrifice on days -4 (pre-
wean), 0 (weaning), 14, and 28. All pigs used for tissue mineral determination in this
experiment were barrows. The liver, spleen, kidney, and heart samples were collected
from the sacrificed pigs.
100
5.3.2 Experimental diets
All pigs received common two-phase nursery diets that were formulated to meet or
exceed NRC (2012) requirement estimates for pigs 7 to 25 kg (Table 5.1). Phase I and II
diets were fed for 14 and 16 days respectively. Representative diet samples were
collected at the time of diet mixing and stored at -20°C until further analysis. The trace
mineral premix used in both phases supplied the following per kilogram of the diet: 50
mg of Mn as manganous sulfate, 100 mg of Fe as ferrous sulfate, 125 mg of Zn as zinc
sulfate, 20 mg of Cu as copper sulfate, 0.35 mg of I as calcium iodate, and 0.30 mg of Se
as sodium selenite.
Phase I and II diets were analyzed for trace mineral concentration (Fe, Zn, and Cu).
The analyzed trace mineral composition of Phase I diets was 220 ppm Fe, 138 ppm Zn,
and 19 ppm Cu. For Phase II diets, the analyzed mineral composition was 247 ppm Fe,
140 ppm Zn, and 19 ppm Cu. Both diets were also analyzed for Ca and P content, for
Phase I the Ca and P concentration was 0.79% and 0.62%, respectively. For the Phase II
diets Ca and P were 0.75% and 0.66%, respectively.
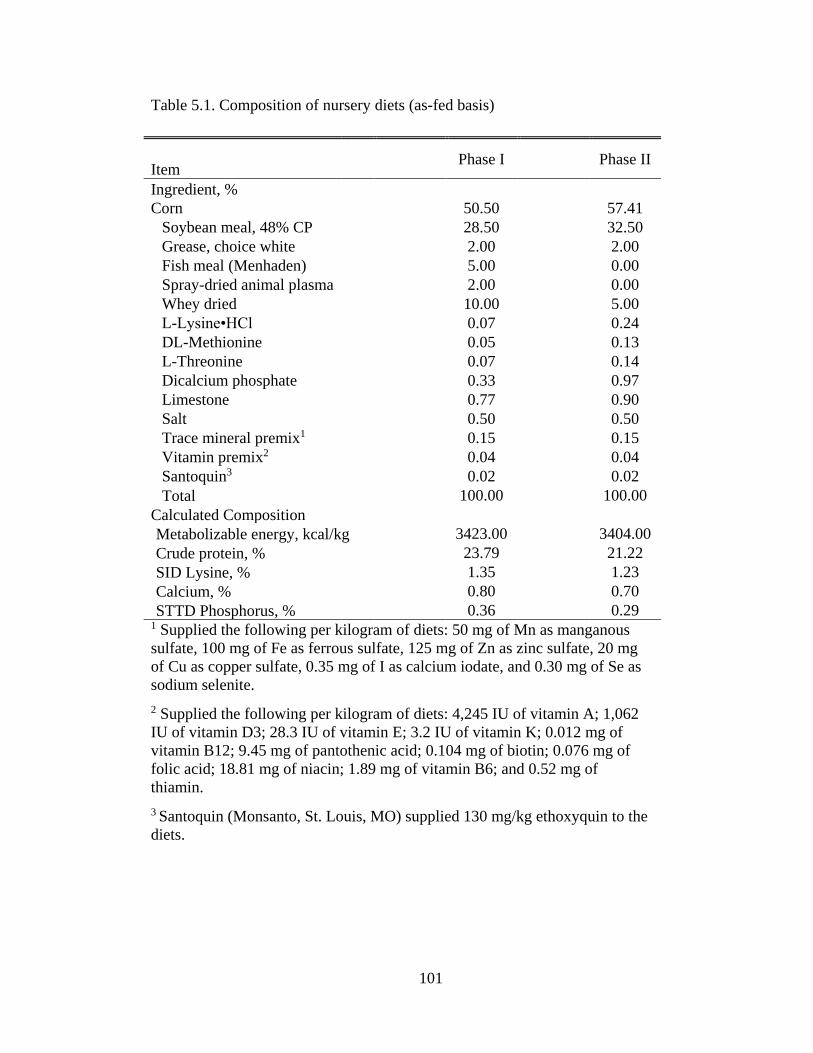
101
Table 5.1. Composition of nursery diets (as-fed basis)
Item
Phase I Phase II
Ingredient, %
Corn 50.50 57.41
Soybean meal, 48% CP 28.50 32.50
Grease, choice white 2.00 2.00
Fish meal (Menhaden) 5.00 0.00
Spray-dried animal plasma 2.00 0.00
Whey dried 10.00 5.00
L-Lysine•HCl 0.07 0.24
DL-Methionine 0.05 0.13
L-Threonine 0.07 0.14
Dicalcium phosphate 0.33 0.97
Limestone 0.77 0.90
Salt 0.50 0.50
Trace mineral premix1 0.15 0.15
Vitamin premix2 0.04 0.04
Santoquin3 0.02 0.02
Total 100.00 100.00
Calculated Composition
Metabolizable energy, kcal/kg 3423.00 3404.00
Crude protein, % 23.79 21.22
SID Lysine, % 1.35 1.23
Calcium, % 0.80 0.70
STTD Phosphorus, % 0.36 0.29 1 Supplied the following per kilogram of diets: 50 mg of Mn as manganous
sulfate, 100 mg of Fe as ferrous sulfate, 125 mg of Zn as zinc sulfate, 20 mg
of Cu as copper sulfate, 0.35 mg of I as calcium iodate, and 0.30 mg of Se as
sodium selenite.
2 Supplied the following per kilogram of diets: 4,245 IU of vitamin A; 1,062
IU of vitamin D3; 28.3 IU of vitamin E; 3.2 IU of vitamin K; 0.012 mg of
vitamin B12; 9.45 mg of pantothenic acid; 0.104 mg of biotin; 0.076 mg of
folic acid; 18.81 mg of niacin; 1.89 mg of vitamin B6; and 0.52 mg of
thiamin.
3 Santoquin (Monsanto, St. Louis, MO) supplied 130 mg/kg ethoxyquin to the
diets.
102
5.3.3 Data and sample collection
5.3.3.1 Feed collection
Representative samples of corn, soybean meal, and mixed feed were collected in the
feed mill for both phases of the experimental diets. Feed samples were stored at -20°C
until analyzed.
5.3.3.2 Growth performance and blood collection
Pigs were weighed at d -4 (preweaning) to be allotted to the control or treatment
group. Pigs and feeders were also weighed at d 0 (weaning), and then weekly for 4 weeks
in the nursery to determine ADG, ADFI, and F:G. Blood samples were collected from
each pig through jugular venipuncture at d -4, 0, 14, and 27 or 30 of the nursery. The
final blood collection was sampled on either d 27 or 30 of the nursery depending on the
weaning time for the pair. Blood was collected in 3 mL vacutainer tubes coated with
K2EDTA (Becton, Dickinson and Company, Franklin Lakes, NJ). Blood samples were
immediately placed on ice and transported to the University of Kentucky Veterinary
Diagnostic Laboratory (UKVDL) for complete blood count (CBC) analysis.
5.3.3.3 Tissue collection
A total of 32 barrows over the course of the experiment were sacrificed for tissue
mineral concentration. Representative pigs (4 pigs per treatment) of the control and
treatment groups were euthanized on d -4, 0, 14, and 27 or 30 of the nursery by injection
of sodium pentobarbital (SOCUMB, Henry Schein Animal Health, Dublin, OH). The
final tissue collection occurred on d 27 or 30 depending on the weaning time for the pair.
Following euthanasia, pigs were dissected for tissue (liver, spleen, both kidneys, and
heart) collection, then weighed, and stored at -20°C until further analysis.
103
5.3.4 Sample processing and laboratory analysis
5.3.4.1 Experimental diet measures
For micro-mineral (Zn, Fe, and Cu) and calcium analysis, feed samples were first
digested using a microwave digester (MARS 6, CEM Cooperation, Matthews, NC), then
analyzed for the minerals by flame atomic absorption spectrometry (Thermoelemental,
SOLAAR Mf; Thermo Electron Corp., Verona, WI). Phosphorus content was analyzed
using a gravimetric determination method (modification of method 968.08; AOAC,
1990).
5.3.4.2 Blood and tissue measures
Whole blood samples were transported to the UKVDL where they were analyzed for
a complete blood count (CBC) using a hematological analyzer (Forcyte Veterinary
Hematology Analyzer, Oxford Science, Oxford, CT). Before analysis, all blood samples
were thoroughly mixed and brought to room temperature. The CBC analysis provided
hemoglobin concentration (Hb), hematocrit (HCT), red blood cell count (RBC), white
blood cell count (WBC), mean corpuscular volume (MCV), mean corpuscular
hemoglobin (MCH), and mean corpuscular hemoglobin concentration (MCHC).
Tissue samples were placed through a kitchen-grade meat grinder (The butcher shop
premium, KRUPS USA, Parsippany, NJ) to provide a homogenous tissue sample. After
samples were ground and mixed, around 1-2 g of tissue was digested with nitric acid in a
pressurized microwave digester (MARS 6 CEM, Matthews, NC) according to
recommendations set by the manufacturer, and appropriately diluted. Diluted samples
were analyzed for trace mineral composition (Zn, Fe, and Cu) by flame atomic absorption
spectrophotometry (Thermoelemental, SOLAAR M5; Thermo Electron Corp., Verona,
104
WI). Dry matter (DM) was determined for all tissue samples by placing 2-3 g of ground
sample into a gravity convection drying oven at 107°C for approximately 24 hours and
then weighed again to observe the moisture content lost.
5.3.5 Statistical analysis
Prior to analyses, all data were evaluated to identify any potential statistical outliers
detected by Grubb’s test outlier calculator (Graphpad Software, San Diego, CA). All
data were subjected to ANOVA by using the GLM procedure in SAS (Statistical
Analysis System, Cary, NC). The individual pig was the experimental unit for individual
BW and ADG, CBC measures, and tissue mineral concentrations and the results are
reported as least squares means. Treatment least squares means were calculated using the
LSMEANS option and of SAS. The level of significance was determined by a P-value of
< 0.05. The data of individual BW and ADG, as well as CBC, were analyzed by the
model:
Yijk = µ + Ti + sexj + pairk + (T × sex)ij + eijk , where
Y = the response variables (BW, ADG; Hb, HCT, RBC, WBC, MCV, MCH,
MCHC)
µ = a constant common to all observations
Ti = the treatment
sexj = sex of the pig
pairk = the pair
(T × sex)ij = the treatment × sex interaction
105
eijk = the error term of the model
The data for pen performance (pen ADG, ADFI, and F:G) were analyzed using the
pen as the experimental unit and by the model:
Yi = µ + Ti + sexj + (T × sex)ij + eij , where
Y = the response variables (ADG, ADFI, F:G)
µ = a constant common to all observations
Ti = the treatment
sexj = the sex of pen
(T × sex)ij = the treatment × sex interaction
eij = the error term of the model
The data for tissue mineral concentration was analyzed by the model:
Yij = µ + Ti+ pairj +eij , where
Y = the response variables (tissue mineral concentration)
µ = a constant common to all observations
Ti = the treatment
pairj = the pair
eij = the error term of the model
106
5.4 Results
5.4.1 Growth performance
The results for growth performance on an individual basis are presented in Table 5.2.
Before the additional iron injection administered to the treatment group, the control and
treatment groups had an initial BW difference of 0.03 kg, which was still present at
weaning (0.02 kg). Once weaned, pigs from the treatment group had greater ADG (P <
0.05) during weeks 1, 2, and 3. The ADG was also higher (P ≤ 0.01) for pigs receiving
the additional iron injection during Phase I, Phase II, and overall nursery period.
Altogether the treated pigs had an increased (P < 0.001) ADG for the entire experimental
period (pre-injection to nursery week 4) leading to a heavier (P < 0.001) final BW of
approximately 1 kg.
Growth performance data using the nursery pen as the experimental unit is presented
in Table 5.3. Values differ somewhat from individual data in Table 5.2, but this
presentation is done to assess the ADFI and F:G. The added-injection treatment had an
increased (P = 0.03) ADG for Phase I. The ADFI for Phase I, weeks 2, and 3 tended to
be higher (P = 0.09, 0.09, and 0.08; respectively) for the treatment group. However, feed
efficiency was not different between the control and treatment groups. There was no
treatment by sex interactions (P 0.10) observed for growth performance, however, the
barrows did grow faster compared to the gilts leading to some sex effects for growth
performance observed throughout the trial.
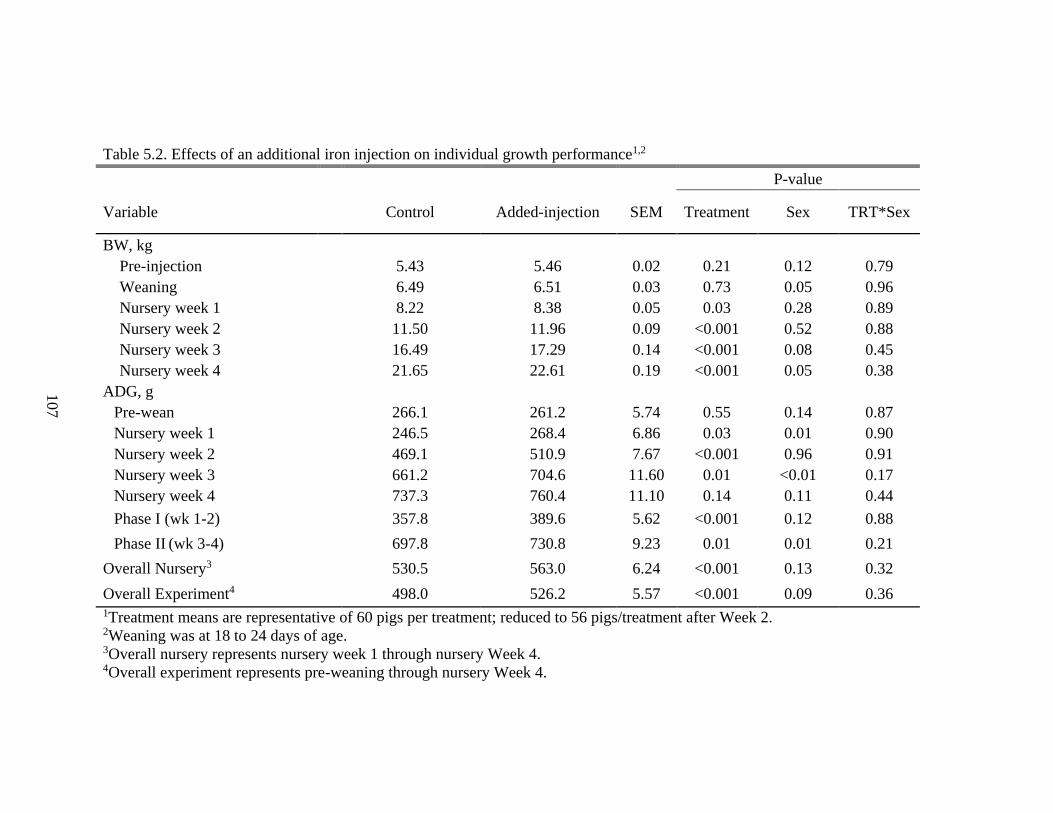
107
Table 5.2. Effects of an additional iron injection on individual growth performance1,2
P-value
Variable Control Added-injection SEM Treatment Sex TRT*Sex
BW, kg
Pre-injection 5.43 5.46 0.02 0.21 0.12 0.79
Weaning 6.49 6.51 0.03 0.73 0.05 0.96
Nursery week 1 8.22 8.38 0.05 0.03 0.28 0.89
Nursery week 2 11.50 11.96 0.09 <0.001 0.52 0.88
Nursery week 3 16.49 17.29 0.14 <0.001 0.08 0.45
Nursery week 4 21.65 22.61 0.19 <0.001 0.05 0.38
ADG, g
Pre-wean 266.1 261.2 5.74 0.55 0.14 0.87
Nursery week 1 246.5 268.4 6.86 0.03 0.01 0.90
Nursery week 2 469.1 510.9 7.67 <0.001 0.96 0.91
Nursery week 3 661.2 704.6 11.60 0.01 <0.01 0.17
Nursery week 4 737.3 760.4 11.10 0.14 0.11 0.44
Phase I (wk 1-2) 357.8 389.6 5.62 <0.001 0.12 0.88
Phase II (wk 3-4) 697.8 730.8 9.23 0.01 0.01 0.21
Overall Nursery3 530.5 563.0 6.24 <0.001 0.13 0.32
Overall Experiment4 498.0 526.2 5.57 <0.001 0.09 0.36 1Treatment means are representative of 60 pigs per treatment; reduced to 56 pigs/treatment after Week 2. 2Weaning was at 18 to 24 days of age.
3Overall nursery represents nursery week 1 through nursery Week 4.
4Overall experiment represents pre-weaning through nursery Week 4.
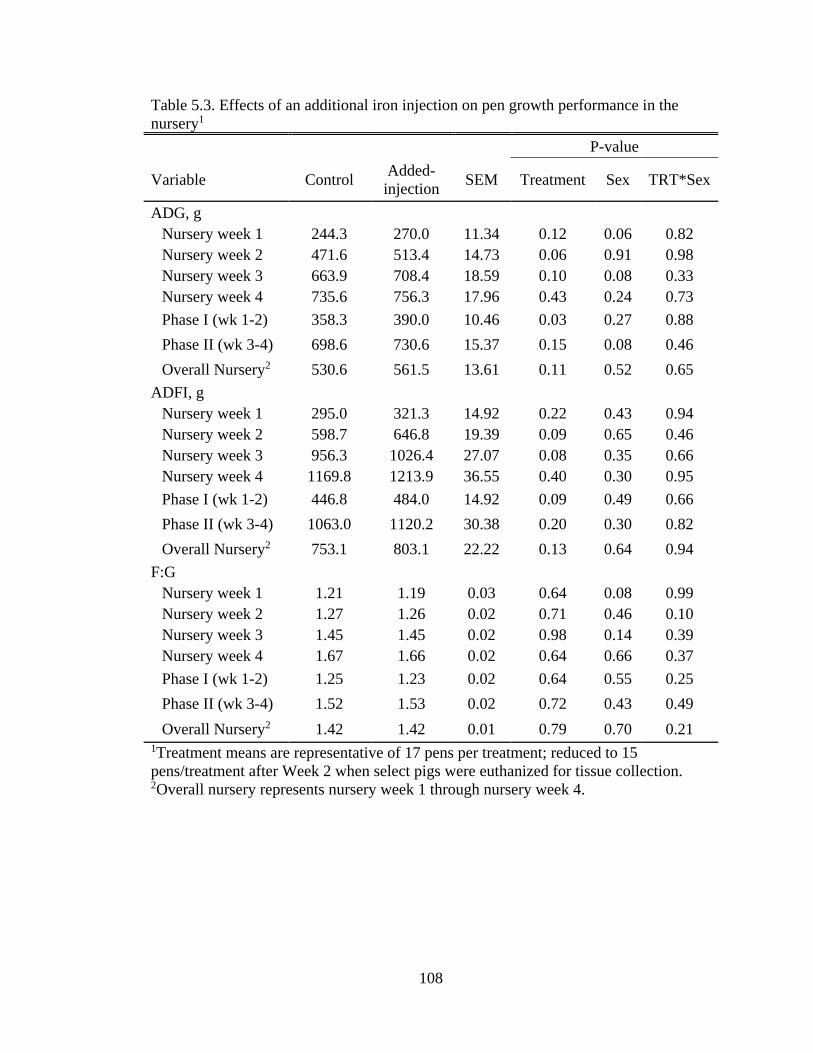
108
Table 5.3. Effects of an additional iron injection on pen growth performance in the
nursery1
P-value
Variable Control Added-
injection SEM Treatment Sex TRT*Sex
ADG, g
Nursery week 1 244.3 270.0 11.34 0.12 0.06 0.82
Nursery week 2 471.6 513.4 14.73 0.06 0.91 0.98
Nursery week 3 663.9 708.4 18.59 0.10 0.08 0.33
Nursery week 4 735.6 756.3 17.96 0.43 0.24 0.73
Phase I (wk 1-2) 358.3 390.0 10.46 0.03 0.27 0.88
Phase II (wk 3-4) 698.6 730.6 15.37 0.15 0.08 0.46
Overall Nursery2 530.6 561.5 13.61 0.11 0.52 0.65
ADFI, g
Nursery week 1 295.0 321.3 14.92 0.22 0.43 0.94
Nursery week 2 598.7 646.8 19.39 0.09 0.65 0.46
Nursery week 3 956.3 1026.4 27.07 0.08 0.35 0.66
Nursery week 4 1169.8 1213.9 36.55 0.40 0.30 0.95
Phase I (wk 1-2) 446.8 484.0 14.92 0.09 0.49 0.66
Phase II (wk 3-4) 1063.0 1120.2 30.38 0.20 0.30 0.82
Overall Nursery2 753.1 803.1 22.22 0.13 0.64 0.94
F:G
Nursery week 1 1.21 1.19 0.03 0.64 0.08 0.99
Nursery week 2 1.27 1.26 0.02 0.71 0.46 0.10
Nursery week 3 1.45 1.45 0.02 0.98 0.14 0.39
Nursery week 4 1.67 1.66 0.02 0.64 0.66 0.37
Phase I (wk 1-2) 1.25 1.23 0.02 0.64 0.55 0.25
Phase II (wk 3-4) 1.52 1.53 0.02 0.72 0.43 0.49
Overall Nursery2 1.42 1.42 0.01 0.79 0.70 0.21 1Treatment means are representative of 17 pens per treatment; reduced to 15
pens/treatment after Week 2 when select pigs were euthanized for tissue collection.
2Overall nursery represents nursery week 1 through nursery week 4.
109
5.4.2 Hematological measures
Tables 5.4 to 5.10 represent the CBC data using the individual pig as the experimental
unit. Pigs from both the control and treatment groups had a similar CBC profile during
preweaning sampling. At weaning, the treatment pigs had higher (P < 0.001) Hb, HCT,
RBC, WBC, MCV and MCH values. Interestingly, also at weaning the control group had
a numerical decrease in Hb, HCT, WBC, MCV, and MCH content compared to the
previous sampling at d -4. Hemoglobin concentration continued to be higher (P < 0.02) in
the treatment group at d 14 sampling but not at d 27-30. Furthermore, at d 14, the MCV,
MCH, and MCHC content was higher (P ≤ 0.02) in pigs administered the additional iron
injection. By the end of the experiment (d 27-30), there were no differences in the CBC
profiles for both groups of pigs. There was no treatment by sex interactions observed for
any CBC measures, however, the barrows did exhibit some increases in blood measures
after weaning (d 14 and d 27-30) which caused a sex effect for certain measures (RBC,
MCV, and MCHC).
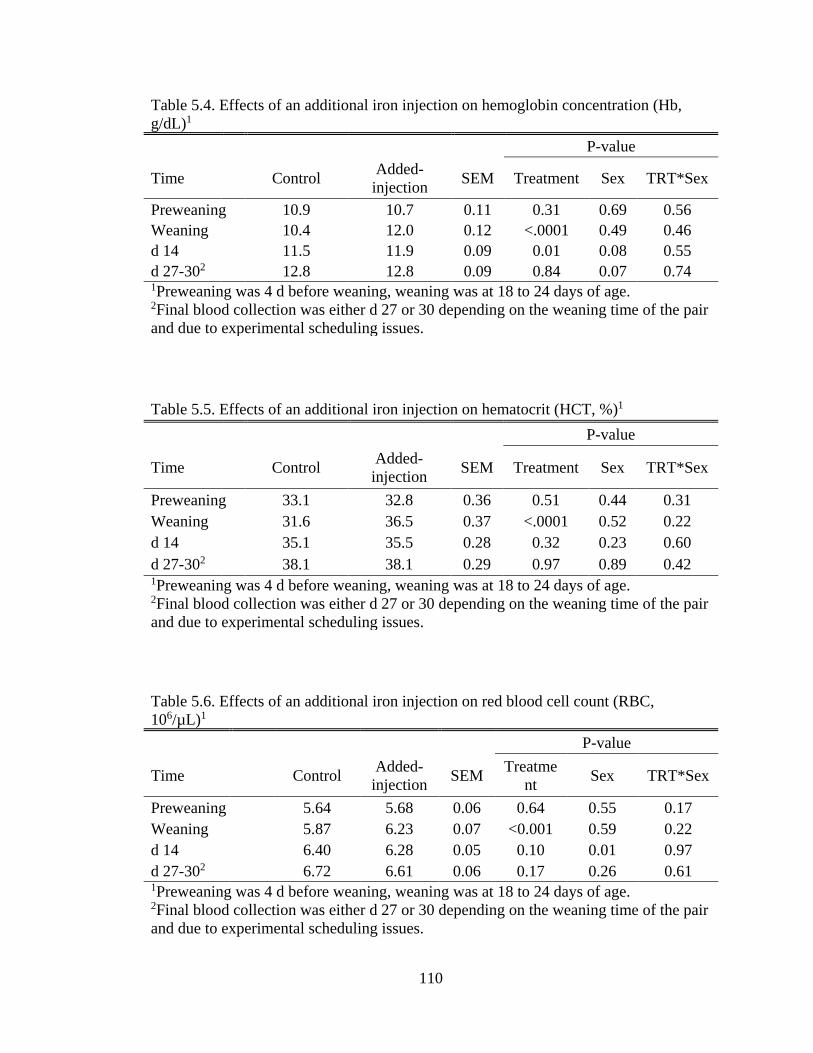
110
Table 5.4. Effects of an additional iron injection on hemoglobin concentration (Hb,
g/dL)1
P-value
Time Control Added-
injection SEM Treatment Sex TRT*Sex
Preweaning 10.9 10.7 0.11 0.31 0.69 0.56
Weaning 10.4 12.0 0.12 <.0001 0.49 0.46
d 14 11.5 11.9 0.09 0.01 0.08 0.55
d 27-302 12.8 12.8 0.09 0.84 0.07 0.74 1Preweaning was 4 d before weaning, weaning was at 18 to 24 days of age. 2Final blood collection was either d 27 or 30 depending on the weaning time of the pair
and due to experimental scheduling issues.
Table 5.5. Effects of an additional iron injection on hematocrit (HCT, %)1
P-value
Time
Control Added-
injection SEM Treatment Sex TRT*Sex
Preweaning 33.1 32.8 0.36 0.51 0.44 0.31
Weaning 31.6 36.5 0.37 <.0001 0.52 0.22
d 14 35.1 35.5 0.28 0.32 0.23 0.60
d 27-302 38.1 38.1 0.29 0.97 0.89 0.42
1Preweaning was 4 d before weaning, weaning was at 18 to 24 days of age. 2Final blood collection was either d 27 or 30 depending on the weaning time of the pair
and due to experimental scheduling issues.
Table 5.6. Effects of an additional iron injection on red blood cell count (RBC,
106/µL)1
P-value
Time
Control Added-
injection SEM
Treatme
nt Sex TRT*Sex
Preweaning 5.64 5.68 0.06 0.64 0.55 0.17
Weaning 5.87 6.23 0.07 <0.001 0.59 0.22
d 14 6.40 6.28 0.05 0.10 0.01 0.97
d 27-302 6.72 6.61 0.06 0.17 0.26 0.61
1Preweaning was 4 d before weaning, weaning was at 18 to 24 days of age. 2Final blood collection was either d 27 or 30 depending on the weaning time of the pair
and due to experimental scheduling issues.
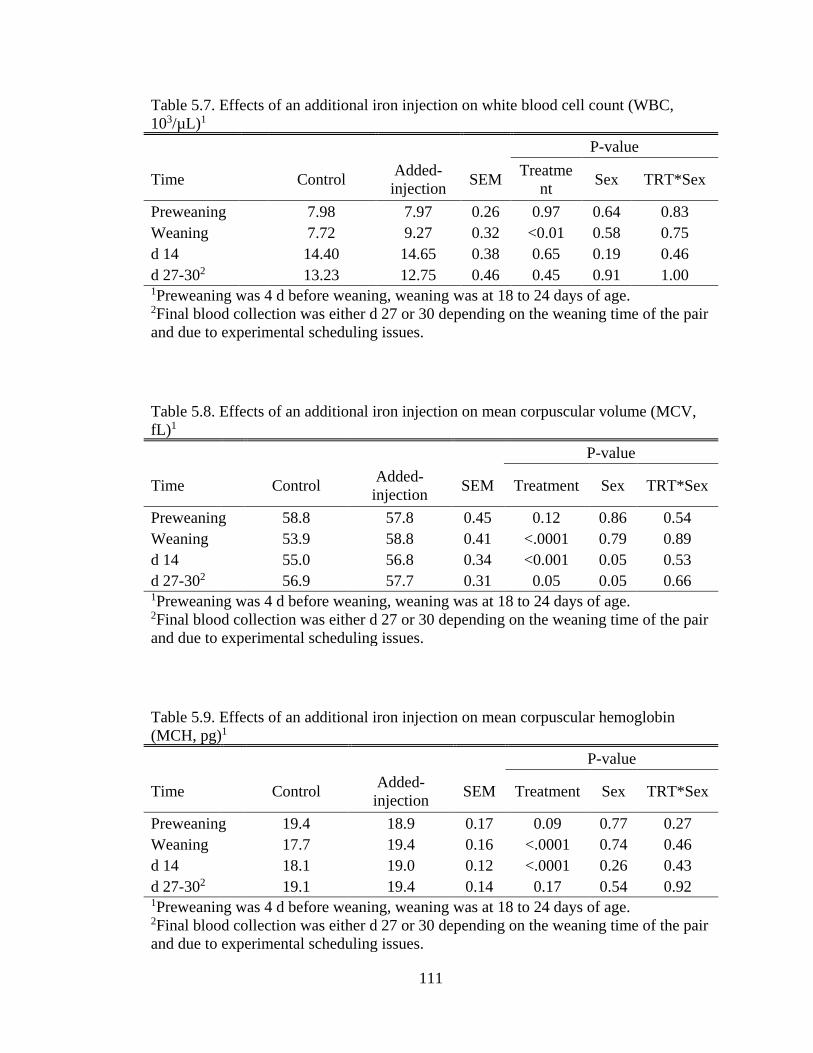
111
Table 5.7. Effects of an additional iron injection on white blood cell count (WBC,
103/µL)1
P-value
Time
Control Added-
injection SEM
Treatme
nt Sex TRT*Sex
Preweaning 7.98 7.97 0.26 0.97 0.64 0.83
Weaning 7.72 9.27 0.32 <0.01 0.58 0.75
d 14 14.40 14.65 0.38 0.65 0.19 0.46
d 27-302 13.23 12.75 0.46 0.45 0.91 1.00
1Preweaning was 4 d before weaning, weaning was at 18 to 24 days of age. 2Final blood collection was either d 27 or 30 depending on the weaning time of the pair
and due to experimental scheduling issues.
Table 5.8. Effects of an additional iron injection on mean corpuscular volume (MCV,
fL)1
P-value
Time
Control Added-
injection SEM Treatment Sex TRT*Sex
Preweaning 58.8 57.8 0.45 0.12 0.86 0.54
Weaning 53.9 58.8 0.41 <.0001 0.79 0.89
d 14 55.0 56.8 0.34 <0.001 0.05 0.53
d 27-302 56.9 57.7 0.31 0.05 0.05 0.66
1Preweaning was 4 d before weaning, weaning was at 18 to 24 days of age. 2Final blood collection was either d 27 or 30 depending on the weaning time of the pair
and due to experimental scheduling issues.
Table 5.9. Effects of an additional iron injection on mean corpuscular hemoglobin
(MCH, pg)1
P-value
Time
Control Added-
injection SEM Treatment Sex TRT*Sex
Preweaning 19.4 18.9 0.17 0.09 0.77 0.27
Weaning 17.7 19.4 0.16 <.0001 0.74 0.46
d 14 18.1 19.0 0.12 <.0001 0.26 0.43
d 27-302 19.1 19.4 0.14 0.17 0.54 0.92
1Preweaning was 4 d before weaning, weaning was at 18 to 24 days of age. 2Final blood collection was either d 27 or 30 depending on the weaning time of the pair
and due to experimental scheduling issues.
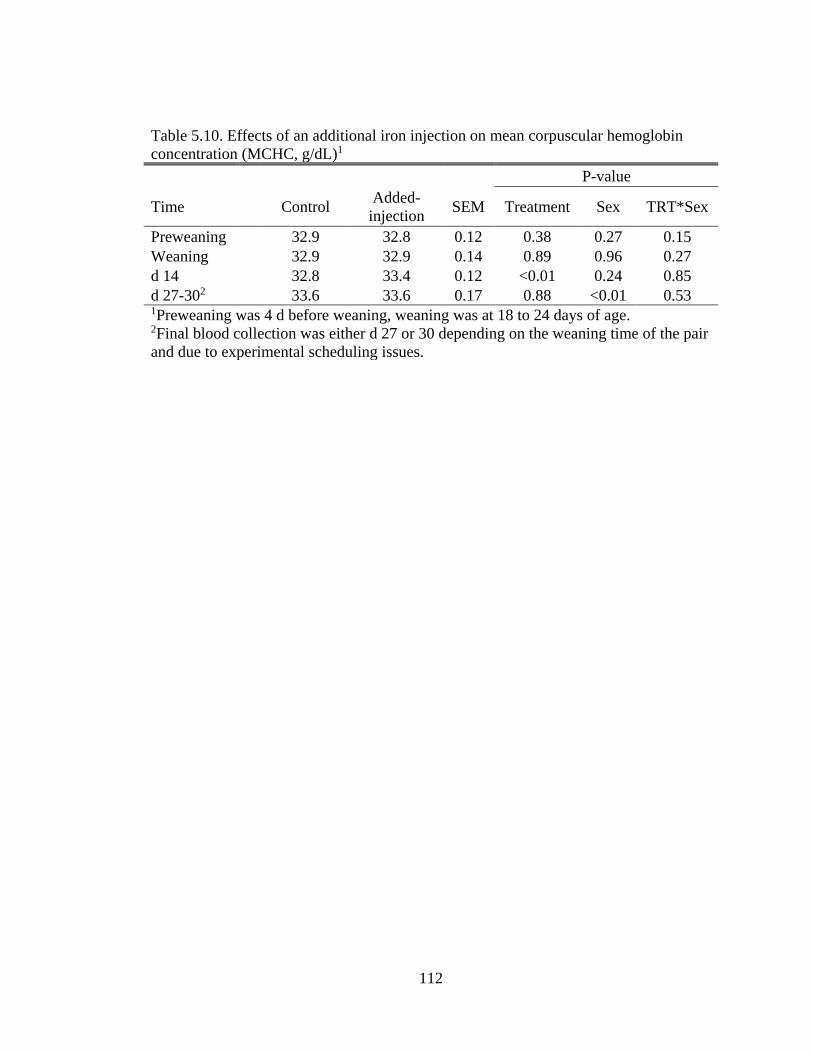
112
Table 5.10. Effects of an additional iron injection on mean corpuscular hemoglobin
concentration (MCHC, g/dL)1
P-value
Time Control Added-
injection SEM Treatment Sex TRT*Sex
Preweaning 32.9 32.8 0.12 0.38 0.27 0.15
Weaning 32.9 32.9 0.14 0.89 0.96 0.27
d 14 32.8 33.4 0.12 <0.01 0.24 0.85
d 27-302 33.6 33.6 0.17 0.88 <0.01 0.53 1Preweaning was 4 d before weaning, weaning was at 18 to 24 days of age. 2Final blood collection was either d 27 or 30 depending on the weaning time of the pair
and due to experimental scheduling issues.
113
5.4.3 Tissue measures
Liver, spleen, heart, and kidney samples were analyzed for mineral content from pigs
at preweaning, weaning, and d 14 and d 27-30 of the nursery and presented as a DM
basis. The average DM content for liver, spleen, heart, and kidney was 23.3, 20.0, 20.3,
and 16.9 % respectively, throughout the experiment. In the control pigs, the liver iron
content (Table 5.11) numerically decreased from the preweaning sample to weaning
while the liver iron content of pigs that received the additional iron injection prior to
weaning was much higher (P = 0.02) compared to the control pigs. However, by d 14
there was only a nonsignificant numerical increase in liver iron content for the added-
injection group which became essentially equal at d 27-30. Liver Zn and Cu content did
not seem to be impacted by the additional iron injection as both groups were similar at all
periods of the experiment. However, there was a drastic decline in liver Cu for both
treatments from weaning to the end of the experiment.
The iron content of spleen (Table 5.12) tended to be higher in added-injection pigs
compared to the control pigs at weaning, but not at d 14, and d 27-30 of the nursery. The
spleen iron content was 5 to 6 times higher at weaning than at preweaning and
maintained that increase for the rest of the study. Similar to liver iron content, the heart
iron content in the control pigs was numerically lower at weaning compared to
preweaning. Also, similar to the liver and spleen, the iron content of the heart (Table
5.13) was numerically greater at weaning, d 14, and d 27-30 for the added-injection pigs.
Observed once again, the control pigs had a decreased kidney iron content from
preweaning to weaning compared to the added-injection pigs which had a numerical
increase (Table 5.14). Interestingly the control pigs had a greater (P = 0.03) heart copper

114
content at d 14 than those of the pigs injected before weaning (Table 5.13). More so, the
heart copper concentration remained relatively constant from preweaning to the end of
the experiment compared to the liver and spleen, where there was at least a 50% decrease
in copper concentration from weaning to d 27-30.
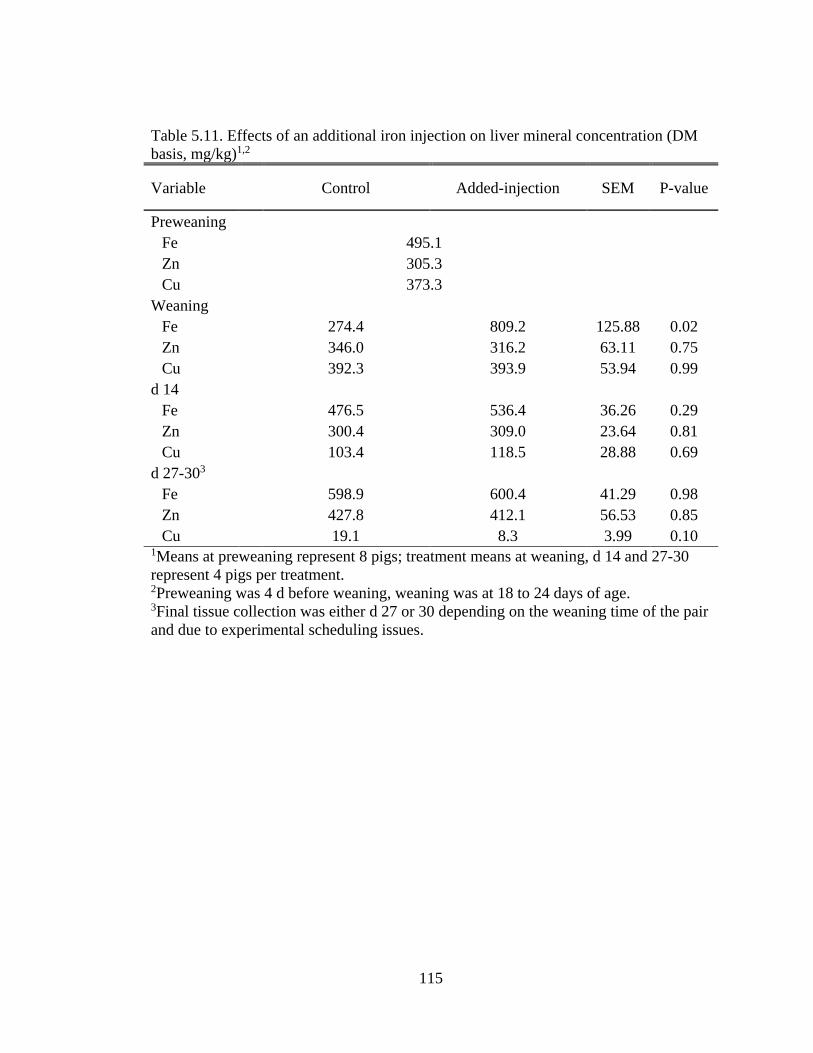
115
Table 5.11. Effects of an additional iron injection on liver mineral concentration (DM
basis, mg/kg)1,2
Variable
Control Added-injection SEM P-value
Preweaning
Fe 495.1
Zn 305.3
Cu 373.3
Weaning
Fe 274.4 809.2 125.88 0.02
Zn 346.0 316.2 63.11 0.75
Cu 392.3 393.9 53.94 0.99
d 14
Fe 476.5 536.4 36.26 0.29
Zn 300.4 309.0 23.64 0.81
Cu 103.4 118.5 28.88 0.69
d 27-303
Fe 598.9 600.4 41.29 0.98
Zn 427.8 412.1 56.53 0.85
Cu 19.1 8.3 3.99 0.10 1Means at preweaning represent 8 pigs; treatment means at weaning, d 14 and 27-30
represent 4 pigs per treatment. 2Preweaning was 4 d before weaning, weaning was at 18 to 24 days of age. 3Final tissue collection was either d 27 or 30 depending on the weaning time of the pair
and due to experimental scheduling issues.
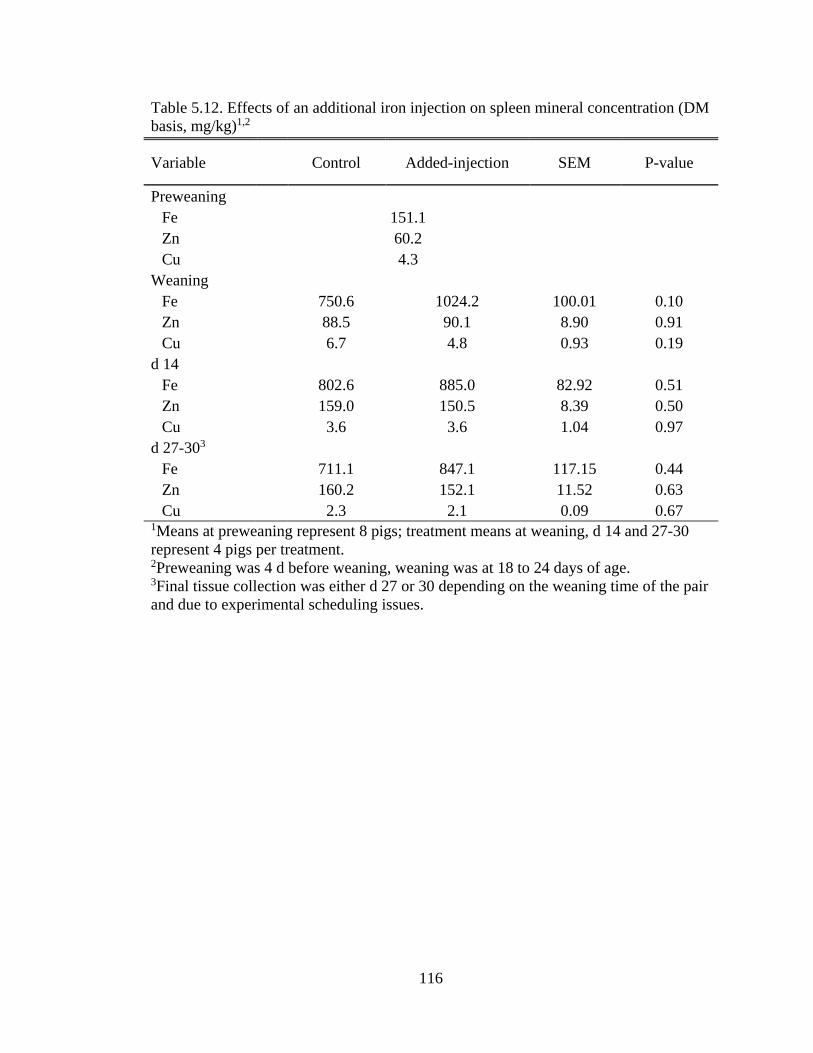
116
Table 5.12. Effects of an additional iron injection on spleen mineral concentration (DM
basis, mg/kg)1,2
Variable
Control Added-injection SEM P-value
Preweaning
Fe 151.1
Zn 60.2
Cu 4.3
Weaning
Fe 750.6 1024.2 100.01 0.10
Zn 88.5 90.1 8.90 0.91
Cu 6.7 4.8 0.93 0.19
d 14
Fe 802.6 885.0 82.92 0.51
Zn 159.0 150.5 8.39 0.50
Cu 3.6 3.6 1.04 0.97
d 27-303
Fe 711.1 847.1 117.15 0.44
Zn 160.2 152.1 11.52 0.63
Cu 2.3 2.1 0.09 0.67 1Means at preweaning represent 8 pigs; treatment means at weaning, d 14 and 27-30
represent 4 pigs per treatment. 2Preweaning was 4 d before weaning, weaning was at 18 to 24 days of age. 3Final tissue collection was either d 27 or 30 depending on the weaning time of the pair
and due to experimental scheduling issues.
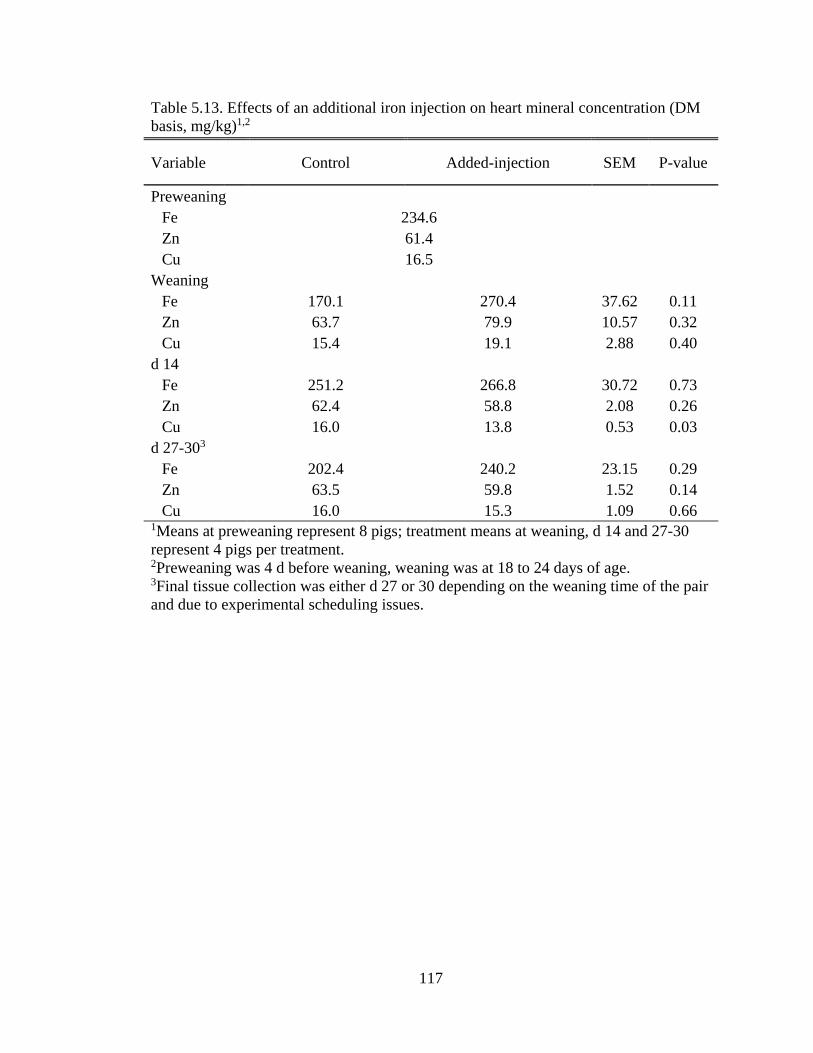
117
Table 5.13. Effects of an additional iron injection on heart mineral concentration (DM
basis, mg/kg)1,2
Variable
Control Added-injection SEM P-value
Preweaning
Fe 234.6
Zn 61.4
Cu 16.5
Weaning
Fe 170.1 270.4 37.62 0.11
Zn 63.7 79.9 10.57 0.32
Cu 15.4 19.1 2.88 0.40
d 14
Fe 251.2 266.8 30.72 0.73
Zn 62.4 58.8 2.08 0.26
Cu 16.0 13.8 0.53 0.03
d 27-303
Fe 202.4 240.2 23.15 0.29
Zn 63.5 59.8 1.52 0.14
Cu 16.0 15.3 1.09 0.66 1Means at preweaning represent 8 pigs; treatment means at weaning, d 14 and 27-30
represent 4 pigs per treatment. 2Preweaning was 4 d before weaning, weaning was at 18 to 24 days of age. 3Final tissue collection was either d 27 or 30 depending on the weaning time of the pair
and due to experimental scheduling issues.
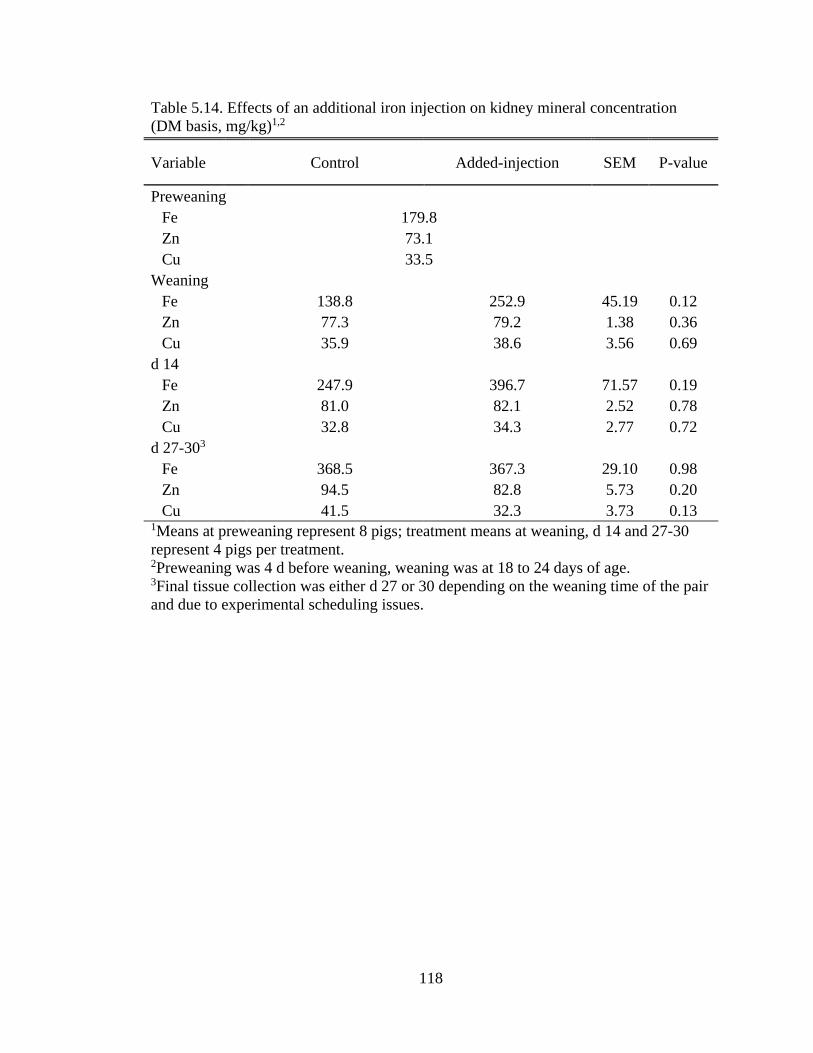
118
Table 5.14. Effects of an additional iron injection on kidney mineral concentration
(DM basis, mg/kg)1,2
Variable Control Added-injection SEM P-value
Preweaning
Fe 179.8
Zn 73.1
Cu 33.5
Weaning
Fe 138.8 252.9 45.19 0.12
Zn 77.3 79.2 1.38 0.36
Cu 35.9 38.6 3.56 0.69
d 14
Fe 247.9 396.7 71.57 0.19
Zn 81.0 82.1 2.52 0.78
Cu 32.8 34.3 2.77 0.72
d 27-303
Fe 368.5 367.3 29.10 0.98
Zn 94.5 82.8 5.73 0.20
Cu 41.5 32.3 3.73 0.13 1Means at preweaning represent 8 pigs; treatment means at weaning, d 14 and 27-30
represent 4 pigs per treatment. 2Preweaning was 4 d before weaning, weaning was at 18 to 24 days of age. 3Final tissue collection was either d 27 or 30 depending on the weaning time of the pair
and due to experimental scheduling issues.
119
5.5 Discussion
5.5.1 Growth performance
The addition of a second iron injection (150 mg iron) administered to pigs 4 days
before they were weaned resulted in an increased ADG throughout the experimental
period. The increase in ADG is likely a result of the higher ADFI that the added-injection
pigs demonstrated. Jolliff and Mahan (2011) reported a greater ADFI (P < 0.05) from 7 to
21d-postweaning in pigs injected with an additional iron injection 6 days before weaning
(d 17). Kamphues et al. (1982) reported that pigs administered a second iron injection one
week prior to weaning had an increase in daily BW gain (380 g vs. 362 g) through three
weeks in the nursery agreeing with the current findings of a 33 g increase during a 4
week nursery period. However, in contrast to the current experiment, Williams et al.
(2018) found no effect on growth performance in pigs given a second iron injection.
Notably, however, Williams et al. (2018) administered the second iron injection on d 11
and weaned pigs on d 21 compared to the current experiment where the second injection
was administered at 14-20 days (d -4). Thus the time of the second injection may explain
the differences observed in growth performance.
The second iron injection will not be as efficient if the pig has substantial amounts of
body iron (less of a demand); closer to weaning or later in lactation the iron status of the
pig declines which increases the demand for more iron. Holter et al. (1991) and Jolliff
and Mahan (2011) reported a reduction in hematological measures as early as 17 days for
pigs that were administered an iron supplement at birth (180 and 200 mg iron,
respectively). The reduction in iron status stated previously, and considering a standard
120
weaning age in the United States of ~21 days, the concept of a second iron injection
administered 4 days before weaning seems appropriate.
5.5.2 Hematological and tissue measures
Another possible explanation for the increased ADG is the elevated CBC measures
that were observed at weaning. It is thought that optimizing the hemoglobin
concentration and the overall iron status of pigs can promote maximum immunity thereby
increasing the health status of pigs (Perrin et al., 2016). Optimizing health status before
weaning can be a major contributor to subsequent growth performance in the nursery as
this transition can be very stressful for young pigs. Work conducted by Fredericks et al.
(2018) revealed that pigs with optimal hemoglobin status (> 11 g/dL) at weaning had a
higher BW at 8 weeks postweaning in contrast to pigs with lower hemoglobin
concentrations (< 11 g/dL). In the present experiment, pigs administered the second iron
injection 4 days before weaning had a heavier final BW at 4 weeks in the nursery, and
had a mean Hb concentration above the optimal level at weaning agreeing with the
previous literature (Haugegaard et al., 2008; Jolliff and Mahan, 2011; Williams et al.,
2018). The difference in final BW between treatments would be a function of the
accumulation of increased ADG and the length of the experiment for the treatment pigs;
thus some differences between studies would be a function of the experimental
procedures of a given study.
In the current experiment, administering an additional iron injection 4 days before
weaning resulted in increased Hb, HCT, RBC, WBC, MCV, and MCH at weaning. The
improvement in hematological measures at weaning in the current experiment can be
explained from the additional iron given to the pigs. These findings are in agreement with
121
other similar work in which a second iron injection improved hematological parameters
(Haugegaard et al., 2008; Williams et al., 2018). It is proposed that an intramuscular
injection of iron dextran is absorbed by the body relatively fast through the
reticuloendothelial system due to the phagocytes in the liver, spleen, and bone marrow
(Danielson, 2004). In regards to the rapid increase in hematological measures as early as
4 days after the additional iron injection in the current experiment, Pu et al. (2018)
reported observations of iron accumulation in the liver of pigs as early as 5 days after
injection. The previously stated literature is also in agreement with the current findings,
showing that liver iron concentration was elevated 4 days after the second iron injection.
Interestingly, a normal blood hemoglobin concentration, but reduced liver iron
concentration can indicate the beginning of iron deficiency as hemoglobin synthesis will
pull iron from body reserves (Conrad et al., 2002).
The liver, heart, and kidneys from pigs not receiving a second iron injection all had
decreasing iron concentrations from preweaning to weaning. The reduction in tissue iron
concentration may be from the body pulling iron from tissue reserves to support normal
erythropoiesis and hemoglobin synthesis. Dallman (1986) suggests that of all the iron
sites (hemoglobin, serum iron, etc.), the storage sites are the last to be depleted in an iron-
deficient state.
Lastly, pigs injected with an additional iron supplement 4 days before weaning had a
lower Cu concentration of the heart 2 weeks after weaning compared to pigs that were
not given a second iron injection. The reduced heart copper concentration associated with
pigs given more iron could be a result of an inhibitory interaction between iron and
copper. Astrup and Lyso (1986) reported that high dietary iron had a negative effect that
122
reduced hepatic Cu levels. However, the results reported from Astrup and Lyso (1986)
were from increased dietary ratios of iron to copper (20:1 and 40:1) which is different
than the current experimental dietary ratio (11:1). Even though the dietary ratio is lower
compared to previous literature, there could be an additive effect by dietary iron to
copper as well as the iron injection administered before weaning. Alternatively, the
observation of this effect is observed in only 1 of the 4 tissues and could simply be a type
II statistical error.
5.6 Conclusion
The results of the present experiment demonstrated that an additional iron injection
administered to pigs 4 days before weaning both increased iron status in the blood at
weaning as well as promoted growth performance during the nursery. The second iron
injection also led to improved tissue iron contents at weaning. These results and the
literature reviewed suggest that the additional iron is beneficial to the iron status of pigs
especially during the stressful time of weaning where there is a low feed intake. There are
also possibilities of improved growth performance associated with a second iron
injection, however, the timing of the second injection will be maximally efficient when
administered at a time of iron decline from the initial injection. Therefore, future studies
should aim to investigate the optimal time to administer a second iron injection.
123
CHAPTER 6.General discussion
Iron status of young pigs has been a topic of concern since the early transition from
rearing pigs on pasture to raising them in modern confinement housing. The transition
dates back to when McGowan and Crichton (1924) demonstrated that farrowing sows
indoors on a concrete floor compared to pasture led to iron deficiency and anemia. Since
this time, iron supplementation to piglets has been extensively researched as it is one of
the largest nutritional deficiencies observed in modern pig production. Early research has
indicated that pigs are born with very limited iron reserves and receive minimal iron from
sow milk (Venn et al., 1947). It has also been proved that it is necessary to administer an
iron injection early after birth to prevent iron-deficient anemia. The latest edition of the
NRC (2012) suggests administering 100 to 200 mg Fe intramuscularly within the first
few days after birth.
With continuous improvements in the modern swine industry like improved genetic
selection, productivity is at an all-time high. Under greater production demands, certain
nutrient requirements like iron change. There is a growing concern that iron supply
provided at birth is not sufficient to meet the iron requirement of every pig until they
transition to a feed source that offers adequate iron.
Jolliff and Mahan (2011), Bhattarai and Nielsen (2015), and Perri et al. (2016) all
demonstrated that there were pigs within herds that were deemed iron deficient (Hb
concentration < 11 g/dL) at weaning. Jolliff and Mahan (2011) demonstrated that as
weaning BW increased the Hb concentration at weaning decreased. Later work by
Bhattaria and Nielsen (2015) found similar results in which larger piglets tended to be at
an increased risk of lower Hb concentration and iron status at weaning. Perri et al. (2016)
124
found that pigs with an anemic hemoglobin concentration (< 8 g/dL) at weaning were 0.8
kg lighter than other pigs. Gillespie (2019) suggests that occurrences of sub-optimal iron
levels (Hb < 11 g/dL) of pigs at weaning has been estimated to cost the United States
swine industry millions of dollars.
In the first experiment of the current study (Chapter 3), there was an incidence of
50% (60 pigs) that had Hb concentrations below 11 g/dL at weaning after receiving an
iron injection at birth (Table 3.3). These results demonstrated that there is a population
within the University of Kentucky swine herd that has a sub-optimal iron status at
weaning in agreement with previous work assessing iron status at weaning. The
occurrence of lower hemoglobin concentration at weaning was in relationship to
increasing BW and BW gain (Figure 3.2 and 3.3; respectively). Thus these findings were
similar to the earlier work reported by Jolliff and Mahan (2011), Bhattarai and Nielsen
(2015), and Perri et al. (2016). The similarity of UK pigs to previous observations
suggests the pigs are suitable as a model for research pertaining to piglet iron questions.
However in the present study, in the postweaning period (21 and 35d) there was a
minimal incidence of hemoglobin concentration below the critical point; even more so,
there were positive relationships between Hb concentrations and BW at these times
(Figure 3.4 and 3.5; respectively). These results differ from the results by Perri et al.
(2016), where the iron-deficient incidence increased from weaning to 3 weeks
postweaning. Thus, there must be differences across herds or feeding practices that
account for the differences. It was likely that the greater incidence observed in the work
by Perri et al. (2016) was due to the high inclusion of zinc in the nursery diets.
125
With the realization that some pigs within the University of Kentucky swine herd
demonstrate low iron status at weaning, the question of how the time course of
hematological status changes during lactation and weaning for pigs receiving an iron
injection at birth arose as well as whether there is an impact on growth or tissue mineral
concentration. Therefore the time course of the blood profile and for pigs was evaluated
during the pre and postweaning periods after receiving various amounts of iron (Chapter
4). During the second experiment growth and blood CBC were measured at many
periods’ pre and postweaning. Pigs that did not receive an iron injection at birth had
lower ADG by the first week which led to a lower final BW on d 52. Growth during the
present experiment was observed mainly at weeks 3, 4, and 5 for pigs with increasing
injectable iron (0, 50, 100, 200, and 300). The improvement in growth observed at these
times may be due to the declining MCV and MCH values most noticeably at d 17 to 22,
which are lower than the initial values at birth for pigs with a lower iron dose. Holter et
al. (1991) also demonstrated a decline in MCV and MCH at 17 and 21 days that
surpassed initial values. Week 3 in the current experiment was also the time of weaning,
which could be crucial to postweaning performance previously illustrated by Fredericks
et al. (2018) where pigs with an improved iron status (Hb > 11 g/dL) at weaning had
greater growth in subsequent periods.
Pigs that did not receive an iron injection had the lowest CBC measures and tissue
iron concentrations through d 38 of the experiment indicating that they were in an anemic
state. However, by d 52, these pigs seem to recover as CBC measurements are similar to
other treatments. There was a similar pattern observed for CBC response measures that
were exhibited when iron dosage increased, this pattern was clear early in the experiment
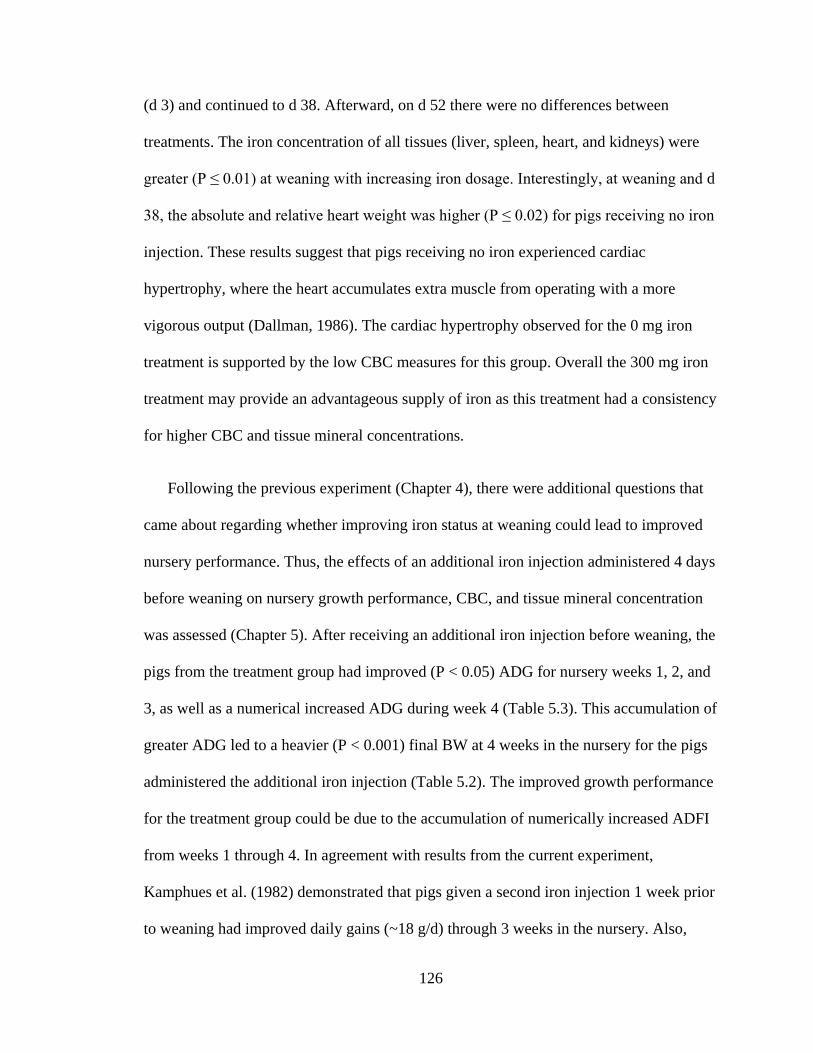
126
(d 3) and continued to d 38. Afterward, on d 52 there were no differences between
treatments. The iron concentration of all tissues (liver, spleen, heart, and kidneys) were
greater (P ≤ 0.01) at weaning with increasing iron dosage. Interestingly, at weaning and d
38, the absolute and relative heart weight was higher (P ≤ 0.02) for pigs receiving no iron
injection. These results suggest that pigs receiving no iron experienced cardiac
hypertrophy, where the heart accumulates extra muscle from operating with a more
vigorous output (Dallman, 1986). The cardiac hypertrophy observed for the 0 mg iron
treatment is supported by the low CBC measures for this group. Overall the 300 mg iron
treatment may provide an advantageous supply of iron as this treatment had a consistency
for higher CBC and tissue mineral concentrations.
Following the previous experiment (Chapter 4), there were additional questions that
came about regarding whether improving iron status at weaning could lead to improved
nursery performance. Thus, the effects of an additional iron injection administered 4 days
before weaning on nursery growth performance, CBC, and tissue mineral concentration
was assessed (Chapter 5). After receiving an additional iron injection before weaning, the
pigs from the treatment group had improved (P < 0.05) ADG for nursery weeks 1, 2, and
3, as well as a numerical increased ADG during week 4 (Table 5.3). This accumulation of
greater ADG led to a heavier (P < 0.001) final BW at 4 weeks in the nursery for the pigs
administered the additional iron injection (Table 5.2). The improved growth performance
for the treatment group could be due to the accumulation of numerically increased ADFI
from weeks 1 through 4. In agreement with results from the current experiment,
Kamphues et al. (1982) demonstrated that pigs given a second iron injection 1 week prior
to weaning had improved daily gains (~18 g/d) through 3 weeks in the nursery. Also,
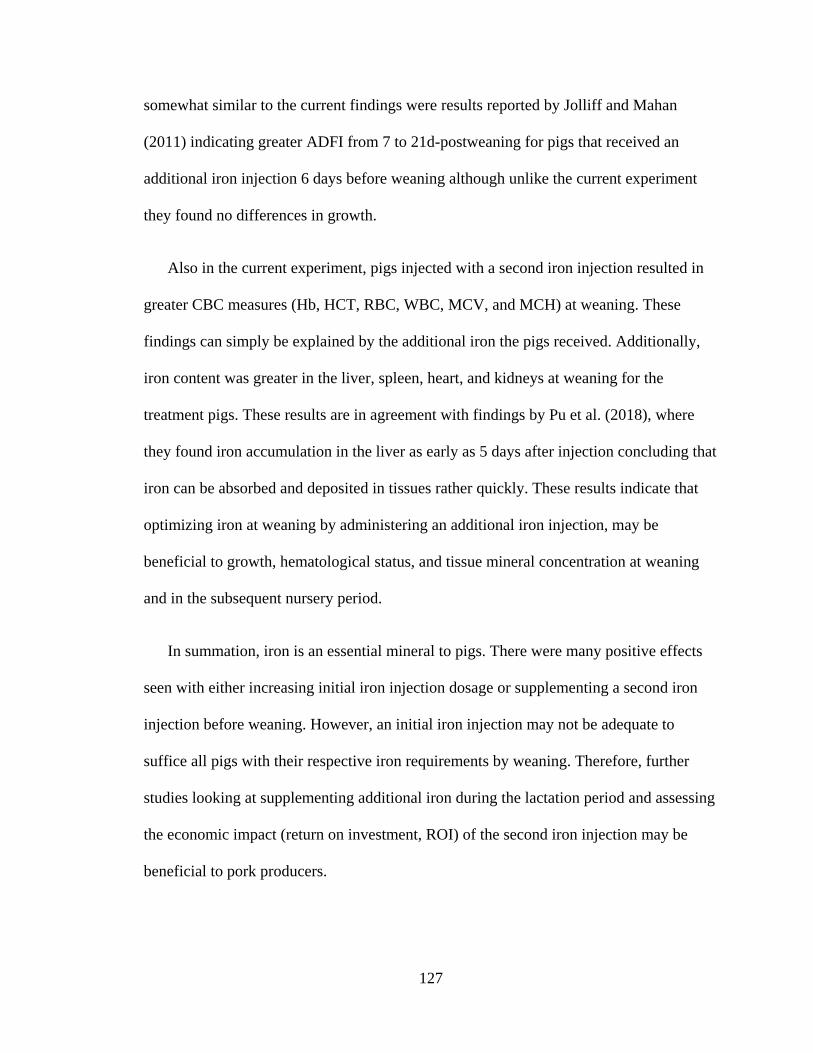
127
somewhat similar to the current findings were results reported by Jolliff and Mahan
(2011) indicating greater ADFI from 7 to 21d-postweaning for pigs that received an
additional iron injection 6 days before weaning although unlike the current experiment
they found no differences in growth.
Also in the current experiment, pigs injected with a second iron injection resulted in
greater CBC measures (Hb, HCT, RBC, WBC, MCV, and MCH) at weaning. These
findings can simply be explained by the additional iron the pigs received. Additionally,
iron content was greater in the liver, spleen, heart, and kidneys at weaning for the
treatment pigs. These results are in agreement with findings by Pu et al. (2018), where
they found iron accumulation in the liver as early as 5 days after injection concluding that
iron can be absorbed and deposited in tissues rather quickly. These results indicate that
optimizing iron at weaning by administering an additional iron injection, may be
beneficial to growth, hematological status, and tissue mineral concentration at weaning
and in the subsequent nursery period.
In summation, iron is an essential mineral to pigs. There were many positive effects
seen with either increasing initial iron injection dosage or supplementing a second iron
injection before weaning. However, an initial iron injection may not be adequate to
suffice all pigs with their respective iron requirements by weaning. Therefore, further
studies looking at supplementing additional iron during the lactation period and assessing
the economic impact (return on investment, ROI) of the second iron injection may be
beneficial to pork producers.
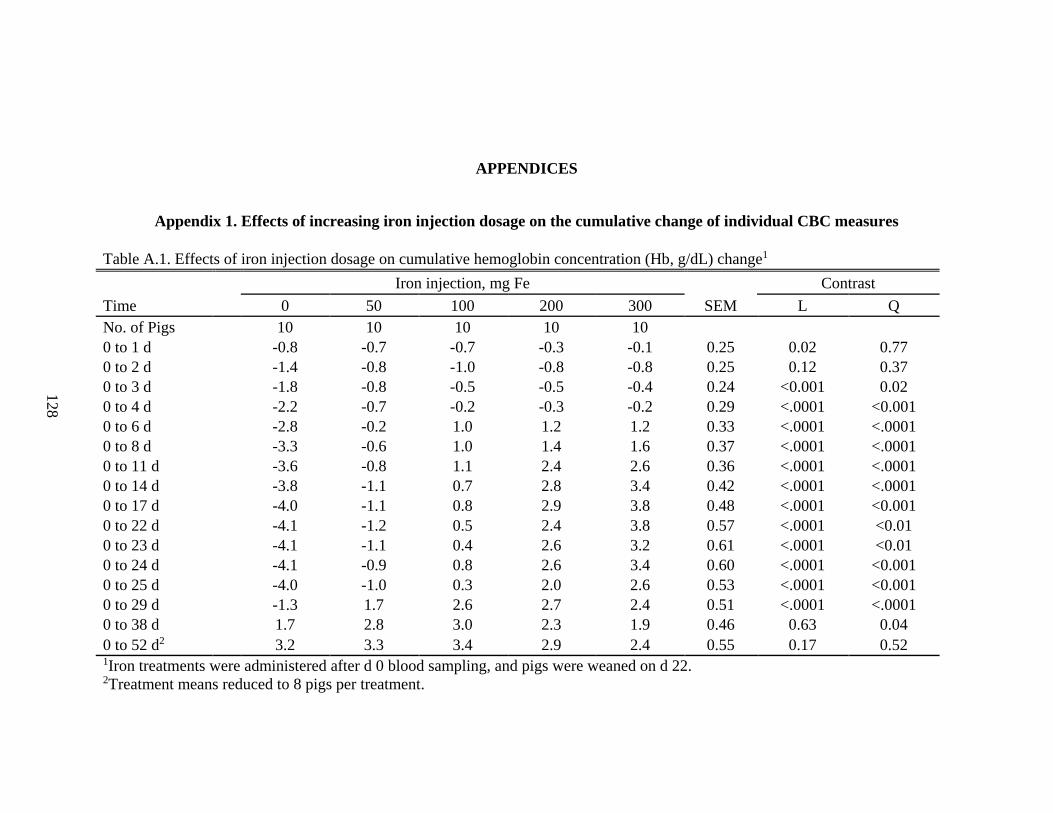
128
APPENDICES
Appendix 1. Effects of increasing iron injection dosage on the cumulative change of individual CBC measures
Table A.1. Effects of iron injection dosage on cumulative hemoglobin concentration (Hb, g/dL) change1
Iron injection, mg Fe Contrast
Time 0 50 100 200 300 SEM L Q
No. of Pigs 10 10 10 10 10
0 to 1 d -0.8 -0.7 -0.7 -0.3 -0.1 0.25 0.02 0.77
0 to 2 d -1.4 -0.8 -1.0 -0.8 -0.8 0.25 0.12 0.37
0 to 3 d -1.8 -0.8 -0.5 -0.5 -0.4 0.24 <0.001 0.02
0 to 4 d -2.2 -0.7 -0.2 -0.3 -0.2 0.29 <.0001 <0.001
0 to 6 d -2.8 -0.2 1.0 1.2 1.2 0.33 <.0001 <.0001
0 to 8 d -3.3 -0.6 1.0 1.4 1.6 0.37 <.0001 <.0001
0 to 11 d -3.6 -0.8 1.1 2.4 2.6 0.36 <.0001 <.0001
0 to 14 d -3.8 -1.1 0.7 2.8 3.4 0.42 <.0001 <.0001
0 to 17 d -4.0 -1.1 0.8 2.9 3.8 0.48 <.0001 <0.001
0 to 22 d -4.1 -1.2 0.5 2.4 3.8 0.57 <.0001 <0.01
0 to 23 d -4.1 -1.1 0.4 2.6 3.2 0.61 <.0001 <0.01
0 to 24 d -4.1 -0.9 0.8 2.6 3.4 0.60 <.0001 <0.001
0 to 25 d -4.0 -1.0 0.3 2.0 2.6 0.53 <.0001 <0.001
0 to 29 d -1.3 1.7 2.6 2.7 2.4 0.51 <.0001 <.0001
0 to 38 d 1.7 2.8 3.0 2.3 1.9 0.46 0.63 0.04
0 to 52 d2 3.2 3.3 3.4 2.9 2.4 0.55 0.17 0.52
1Iron treatments were administered after d 0 blood sampling, and pigs were weaned on d 22. 2Treatment means reduced to 8 pigs per treatment.
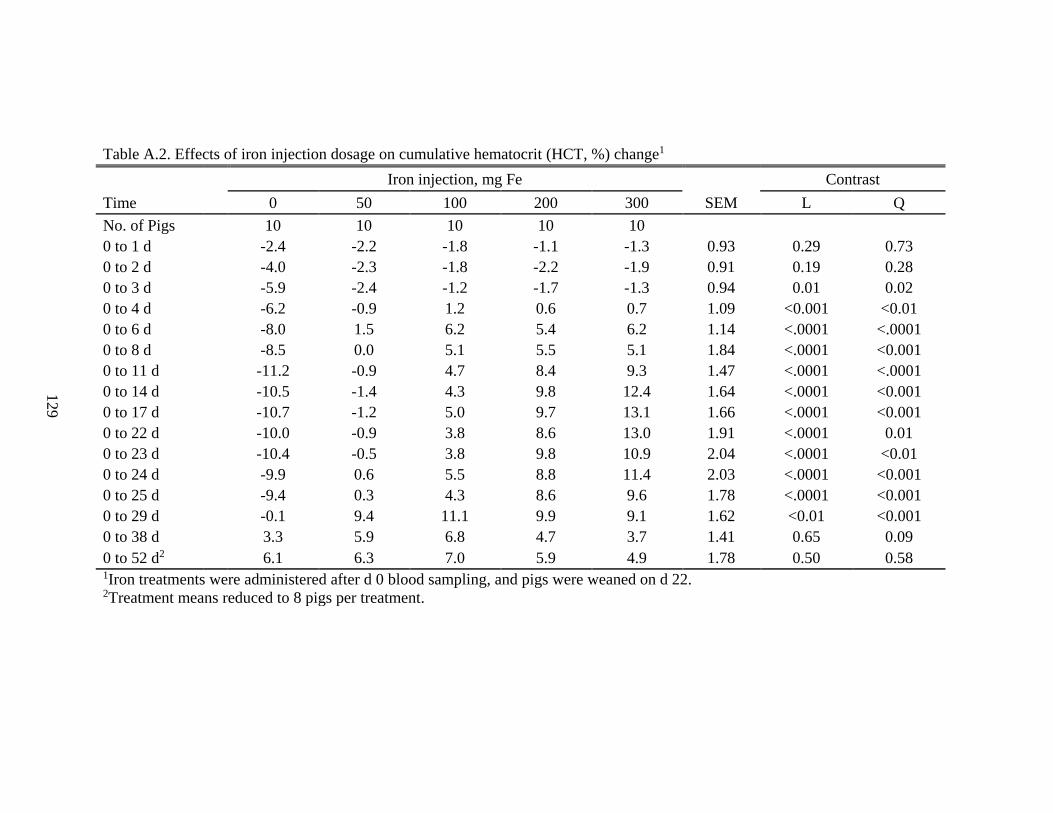
129
Table A.2. Effects of iron injection dosage on cumulative hematocrit (HCT, %) change1
Iron injection, mg Fe Contrast
Time 0 50 100 200 300 SEM L Q
No. of Pigs 10 10 10 10 10
0 to 1 d -2.4 -2.2 -1.8 -1.1 -1.3 0.93 0.29 0.73
0 to 2 d -4.0 -2.3 -1.8 -2.2 -1.9 0.91 0.19 0.28
0 to 3 d -5.9 -2.4 -1.2 -1.7 -1.3 0.94 0.01 0.02
0 to 4 d -6.2 -0.9 1.2 0.6 0.7 1.09 <0.001 <0.01
0 to 6 d -8.0 1.5 6.2 5.4 6.2 1.14 <.0001 <.0001
0 to 8 d -8.5 0.0 5.1 5.5 5.1 1.84 <.0001 <0.001
0 to 11 d -11.2 -0.9 4.7 8.4 9.3 1.47 <.0001 <.0001
0 to 14 d -10.5 -1.4 4.3 9.8 12.4 1.64 <.0001 <0.001
0 to 17 d -10.7 -1.2 5.0 9.7 13.1 1.66 <.0001 <0.001
0 to 22 d -10.0 -0.9 3.8 8.6 13.0 1.91 <.0001 0.01
0 to 23 d -10.4 -0.5 3.8 9.8 10.9 2.04 <.0001 <0.01
0 to 24 d -9.9 0.6 5.5 8.8 11.4 2.03 <.0001 <0.001
0 to 25 d -9.4 0.3 4.3 8.6 9.6 1.78 <.0001 <0.001
0 to 29 d -0.1 9.4 11.1 9.9 9.1 1.62 <0.01 <0.001
0 to 38 d 3.3 5.9 6.8 4.7 3.7 1.41 0.65 0.09
0 to 52 d2 6.1 6.3 7.0 5.9 4.9 1.78 0.50 0.58
1Iron treatments were administered after d 0 blood sampling, and pigs were weaned on d 22. 2Treatment means reduced to 8 pigs per treatment.
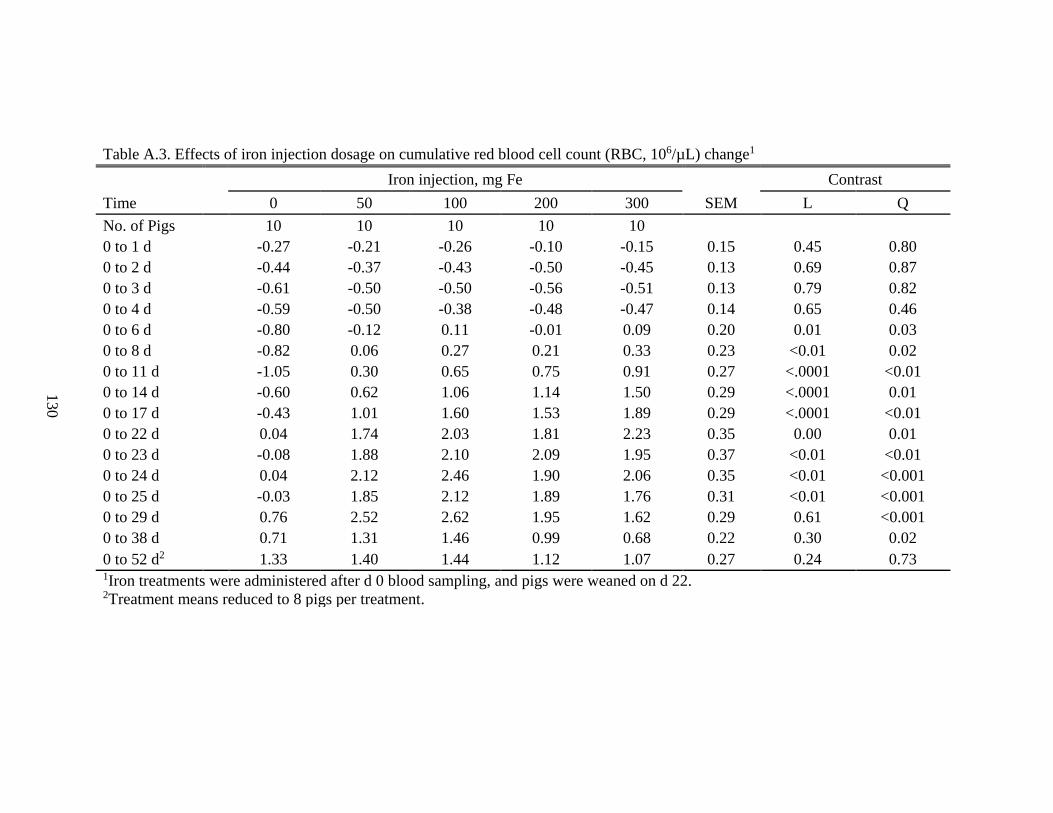
130
Table A.3. Effects of iron injection dosage on cumulative red blood cell count (RBC, 106/µL) change1
Iron injection, mg Fe Contrast
Time 0 50 100 200 300 SEM L Q
No. of Pigs 10 10 10 10 10 0 to 1 d -0.27 -0.21 -0.26 -0.10 -0.15 0.15 0.45 0.80
0 to 2 d -0.44 -0.37 -0.43 -0.50 -0.45 0.13 0.69 0.87
0 to 3 d -0.61 -0.50 -0.50 -0.56 -0.51 0.13 0.79 0.82
0 to 4 d -0.59 -0.50 -0.38 -0.48 -0.47 0.14 0.65 0.46
0 to 6 d -0.80 -0.12 0.11 -0.01 0.09 0.20 0.01 0.03
0 to 8 d -0.82 0.06 0.27 0.21 0.33 0.23 <0.01 0.02
0 to 11 d -1.05 0.30 0.65 0.75 0.91 0.27 <.0001 <0.01
0 to 14 d -0.60 0.62 1.06 1.14 1.50 0.29 <.0001 0.01
0 to 17 d -0.43 1.01 1.60 1.53 1.89 0.29 <.0001 <0.01
0 to 22 d 0.04 1.74 2.03 1.81 2.23 0.35 0.00 0.01
0 to 23 d -0.08 1.88 2.10 2.09 1.95 0.37 <0.01 <0.01
0 to 24 d 0.04 2.12 2.46 1.90 2.06 0.35 <0.01 <0.001
0 to 25 d -0.03 1.85 2.12 1.89 1.76 0.31 <0.01 <0.001
0 to 29 d 0.76 2.52 2.62 1.95 1.62 0.29 0.61 <0.001
0 to 38 d 0.71 1.31 1.46 0.99 0.68 0.22 0.30 0.02
0 to 52 d2 1.33 1.40 1.44 1.12 1.07 0.27 0.24 0.73
1Iron treatments were administered after d 0 blood sampling, and pigs were weaned on d 22. 2Treatment means reduced to 8 pigs per treatment.
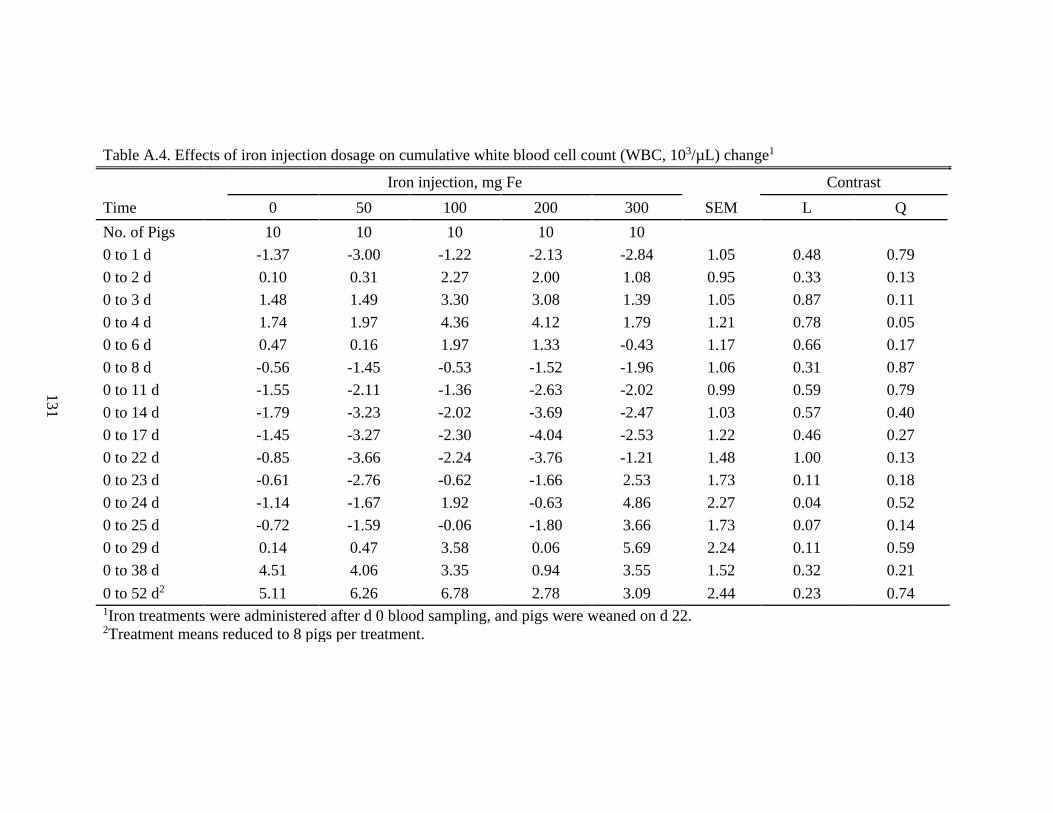
131
Table A.4. Effects of iron injection dosage on cumulative white blood cell count (WBC, 103/µL) change1
Iron injection, mg Fe Contrast
Time 0 50 100 200 300 SEM L Q
No. of Pigs 10 10 10 10 10
0 to 1 d -1.37 -3.00 -1.22 -2.13 -2.84 1.05 0.48 0.79
0 to 2 d 0.10 0.31 2.27 2.00 1.08 0.95 0.33 0.13
0 to 3 d 1.48 1.49 3.30 3.08 1.39 1.05 0.87 0.11
0 to 4 d 1.74 1.97 4.36 4.12 1.79 1.21 0.78 0.05
0 to 6 d 0.47 0.16 1.97 1.33 -0.43 1.17 0.66 0.17
0 to 8 d -0.56 -1.45 -0.53 -1.52 -1.96 1.06 0.31 0.87
0 to 11 d -1.55 -2.11 -1.36 -2.63 -2.02 0.99 0.59 0.79
0 to 14 d -1.79 -3.23 -2.02 -3.69 -2.47 1.03 0.57 0.40
0 to 17 d -1.45 -3.27 -2.30 -4.04 -2.53 1.22 0.46 0.27
0 to 22 d -0.85 -3.66 -2.24 -3.76 -1.21 1.48 1.00 0.13
0 to 23 d -0.61 -2.76 -0.62 -1.66 2.53 1.73 0.11 0.18
0 to 24 d -1.14 -1.67 1.92 -0.63 4.86 2.27 0.04 0.52
0 to 25 d -0.72 -1.59 -0.06 -1.80 3.66 1.73 0.07 0.14
0 to 29 d 0.14 0.47 3.58 0.06 5.69 2.24 0.11 0.59
0 to 38 d 4.51 4.06 3.35 0.94 3.55 1.52 0.32 0.21
0 to 52 d2
5.11 6.26 6.78 2.78 3.09 2.44 0.23 0.74 1Iron treatments were administered after d 0 blood sampling, and pigs were weaned on d 22. 2Treatment means reduced to 8 pigs per treatment.
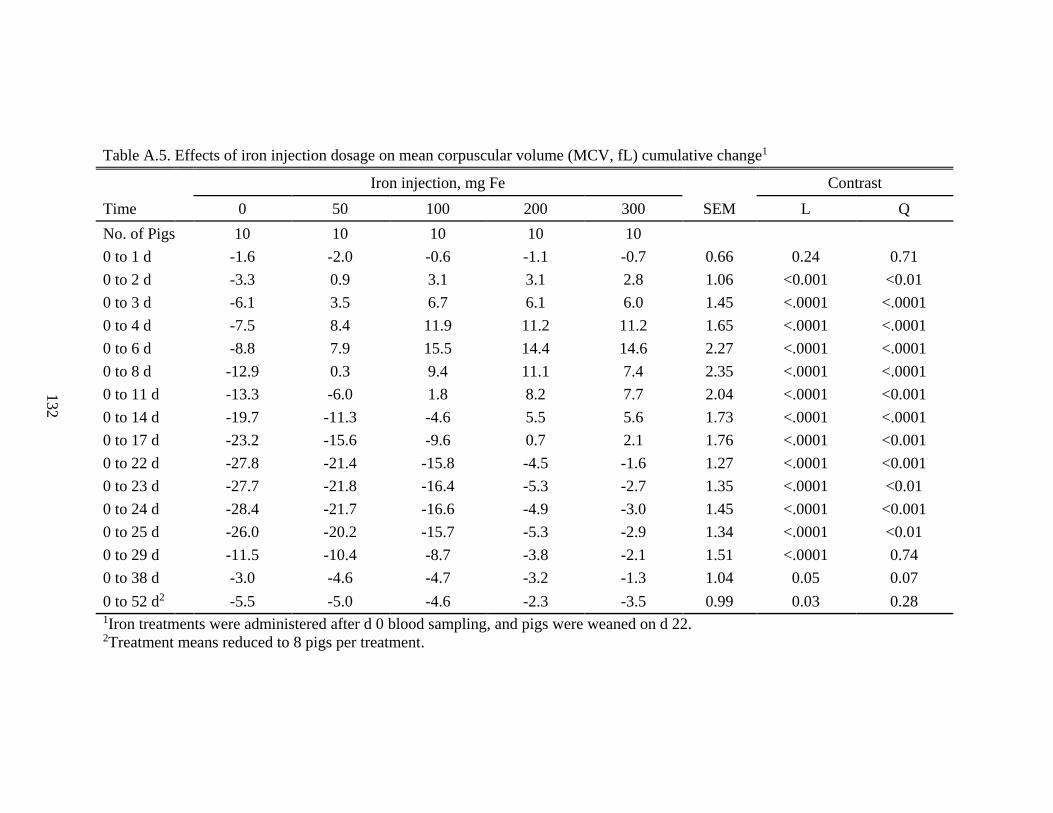
132
Table A.5. Effects of iron injection dosage on mean corpuscular volume (MCV, fL) cumulative change1
Iron injection, mg Fe Contrast
Time 0 50 100 200 300 SEM L Q
No. of Pigs 10 10 10 10 10
0 to 1 d -1.6 -2.0 -0.6 -1.1 -0.7 0.66 0.24 0.71
0 to 2 d -3.3 0.9 3.1 3.1 2.8 1.06 <0.001 <0.01
0 to 3 d -6.1 3.5 6.7 6.1 6.0 1.45 <.0001 <.0001
0 to 4 d -7.5 8.4 11.9 11.2 11.2 1.65 <.0001 <.0001
0 to 6 d -8.8 7.9 15.5 14.4 14.6 2.27 <.0001 <.0001
0 to 8 d -12.9 0.3 9.4 11.1 7.4 2.35 <.0001 <.0001
0 to 11 d -13.3 -6.0 1.8 8.2 7.7 2.04 <.0001 <0.001
0 to 14 d -19.7 -11.3 -4.6 5.5 5.6 1.73 <.0001 <.0001
0 to 17 d -23.2 -15.6 -9.6 0.7 2.1 1.76 <.0001 <0.001
0 to 22 d -27.8 -21.4 -15.8 -4.5 -1.6 1.27 <.0001 <0.001
0 to 23 d -27.7 -21.8 -16.4 -5.3 -2.7 1.35 <.0001 <0.01
0 to 24 d -28.4 -21.7 -16.6 -4.9 -3.0 1.45 <.0001 <0.001
0 to 25 d -26.0 -20.2 -15.7 -5.3 -2.9 1.34 <.0001 <0.01
0 to 29 d -11.5 -10.4 -8.7 -3.8 -2.1 1.51 <.0001 0.74
0 to 38 d -3.0 -4.6 -4.7 -3.2 -1.3 1.04 0.05 0.07
0 to 52 d2
-5.5 -5.0 -4.6 -2.3 -3.5 0.99 0.03 0.28 1Iron treatments were administered after d 0 blood sampling, and pigs were weaned on d 22. 2Treatment means reduced to 8 pigs per treatment.
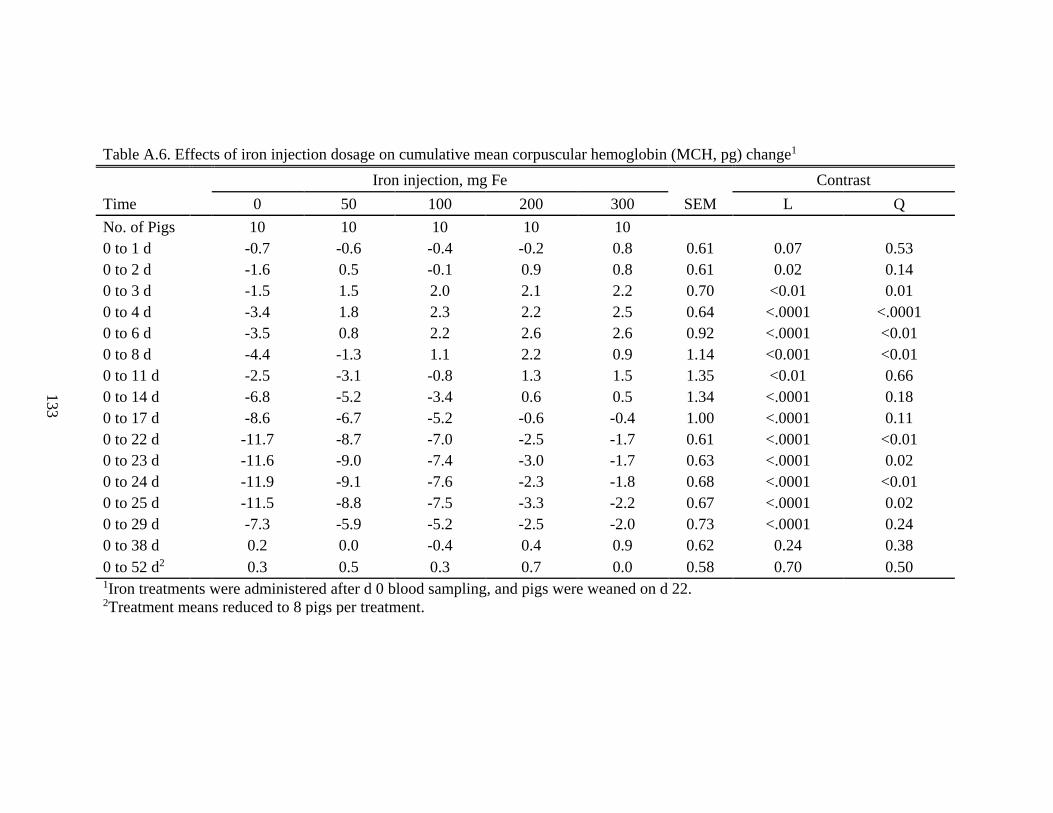
133
Table A.6. Effects of iron injection dosage on cumulative mean corpuscular hemoglobin (MCH, pg) change1
Iron injection, mg Fe Contrast
Time 0 50 100 200 300 SEM L Q
No. of Pigs 10 10 10 10 10
0 to 1 d -0.7 -0.6 -0.4 -0.2 0.8 0.61 0.07 0.53
0 to 2 d -1.6 0.5 -0.1 0.9 0.8 0.61 0.02 0.14
0 to 3 d -1.5 1.5 2.0 2.1 2.2 0.70 <0.01 0.01
0 to 4 d -3.4 1.8 2.3 2.2 2.5 0.64 <.0001 <.0001
0 to 6 d -3.5 0.8 2.2 2.6 2.6 0.92 <.0001 <0.01
0 to 8 d -4.4 -1.3 1.1 2.2 0.9 1.14 <0.001 <0.01
0 to 11 d -2.5 -3.1 -0.8 1.3 1.5 1.35 <0.01 0.66
0 to 14 d -6.8 -5.2 -3.4 0.6 0.5 1.34 <.0001 0.18
0 to 17 d -8.6 -6.7 -5.2 -0.6 -0.4 1.00 <.0001 0.11
0 to 22 d -11.7 -8.7 -7.0 -2.5 -1.7 0.61 <.0001 <0.01
0 to 23 d -11.6 -9.0 -7.4 -3.0 -1.7 0.63 <.0001 0.02
0 to 24 d -11.9 -9.1 -7.6 -2.3 -1.8 0.68 <.0001 <0.01
0 to 25 d -11.5 -8.8 -7.5 -3.3 -2.2 0.67 <.0001 0.02
0 to 29 d -7.3 -5.9 -5.2 -2.5 -2.0 0.73 <.0001 0.24
0 to 38 d 0.2 0.0 -0.4 0.4 0.9 0.62 0.24 0.38
0 to 52 d2 0.3 0.5 0.3 0.7 0.0 0.58 0.70 0.50
1Iron treatments were administered after d 0 blood sampling, and pigs were weaned on d 22. 2Treatment means reduced to 8 pigs per treatment.
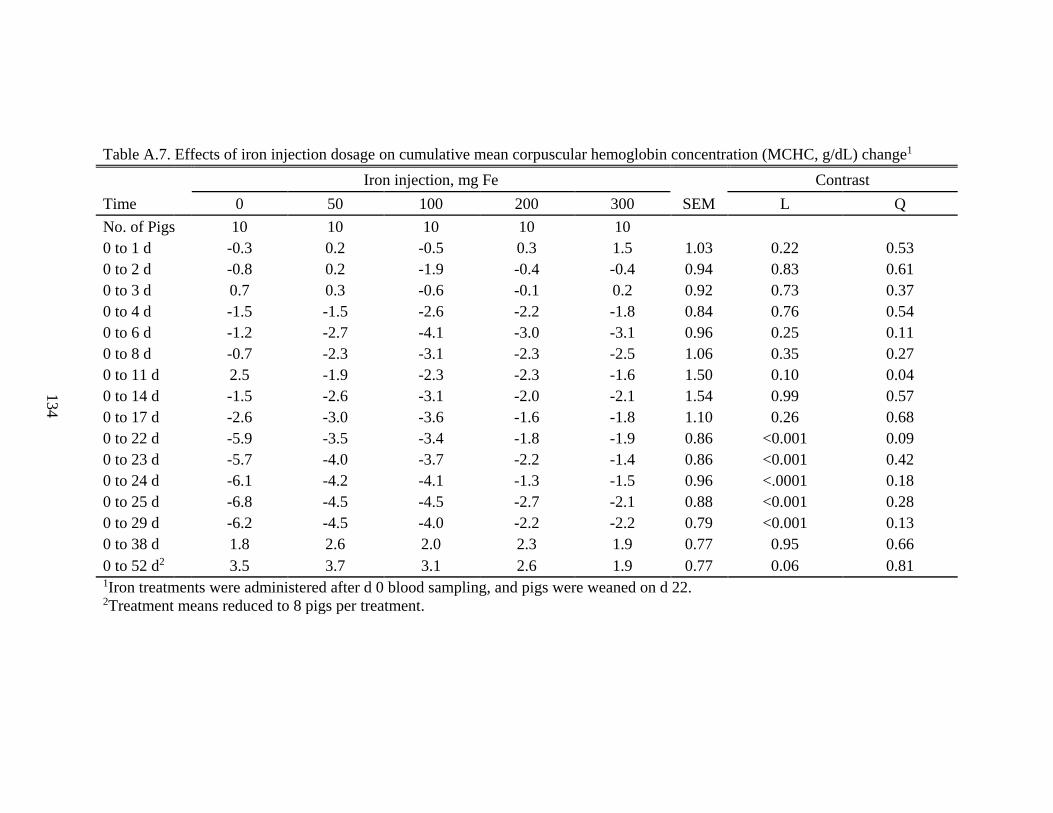
134
Table A.7. Effects of iron injection dosage on cumulative mean corpuscular hemoglobin concentration (MCHC, g/dL) change1
Iron injection, mg Fe Contrast
Time 0 50 100 200 300 SEM L Q
No. of Pigs 10 10 10 10 10
0 to 1 d -0.3 0.2 -0.5 0.3 1.5 1.03 0.22 0.53
0 to 2 d -0.8 0.2 -1.9 -0.4 -0.4 0.94 0.83 0.61
0 to 3 d 0.7 0.3 -0.6 -0.1 0.2 0.92 0.73 0.37
0 to 4 d -1.5 -1.5 -2.6 -2.2 -1.8 0.84 0.76 0.54
0 to 6 d -1.2 -2.7 -4.1 -3.0 -3.1 0.96 0.25 0.11
0 to 8 d -0.7 -2.3 -3.1 -2.3 -2.5 1.06 0.35 0.27
0 to 11 d 2.5 -1.9 -2.3 -2.3 -1.6 1.50 0.10 0.04
0 to 14 d -1.5 -2.6 -3.1 -2.0 -2.1 1.54 0.99 0.57
0 to 17 d -2.6 -3.0 -3.6 -1.6 -1.8 1.10 0.26 0.68
0 to 22 d -5.9 -3.5 -3.4 -1.8 -1.9 0.86 <0.001 0.09
0 to 23 d -5.7 -4.0 -3.7 -2.2 -1.4 0.86 <0.001 0.42
0 to 24 d -6.1 -4.2 -4.1 -1.3 -1.5 0.96 <.0001 0.18
0 to 25 d -6.8 -4.5 -4.5 -2.7 -2.1 0.88 <0.001 0.28
0 to 29 d -6.2 -4.5 -4.0 -2.2 -2.2 0.79 <0.001 0.13
0 to 38 d 1.8 2.6 2.0 2.3 1.9 0.77 0.95 0.66
0 to 52 d2 3.5 3.7 3.1 2.6 1.9 0.77 0.06 0.81
1Iron treatments were administered after d 0 blood sampling, and pigs were weaned on d 22. 2Treatment means reduced to 8 pigs per treatment.
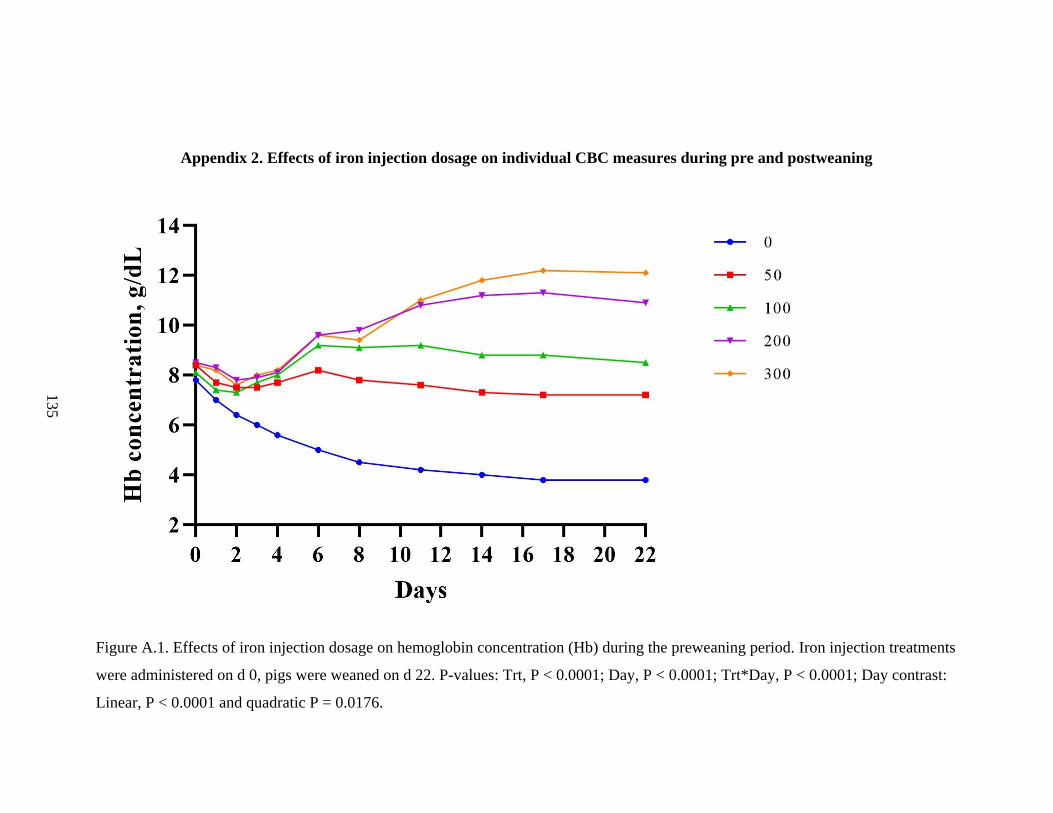
135
Appendix 2. Effects of iron injection dosage on individual CBC measures during pre and postweaning
Figure A.1. Effects of iron injection dosage on hemoglobin concentration (Hb) during the preweaning period. Iron injection treatments
were administered on d 0, pigs were weaned on d 22. P-values: Trt, P < 0.0001; Day, P < 0.0001; Trt*Day, P < 0.0001; Day contrast:
Linear, P < 0.0001 and quadratic P = 0.0176.
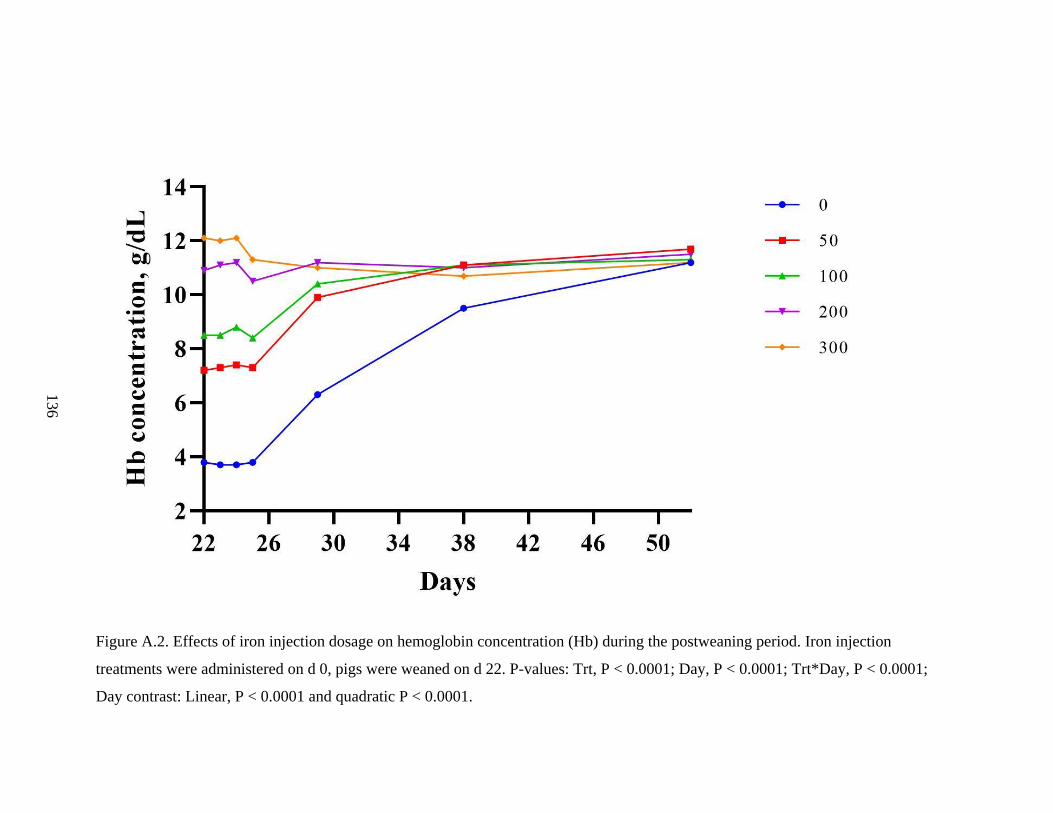
136
Figure A.2. Effects of iron injection dosage on hemoglobin concentration (Hb) during the postweaning period. Iron injection
treatments were administered on d 0, pigs were weaned on d 22. P-values: Trt, P < 0.0001; Day, P < 0.0001; Trt*Day, P < 0.0001;
Day contrast: Linear, P < 0.0001 and quadratic P < 0.0001.
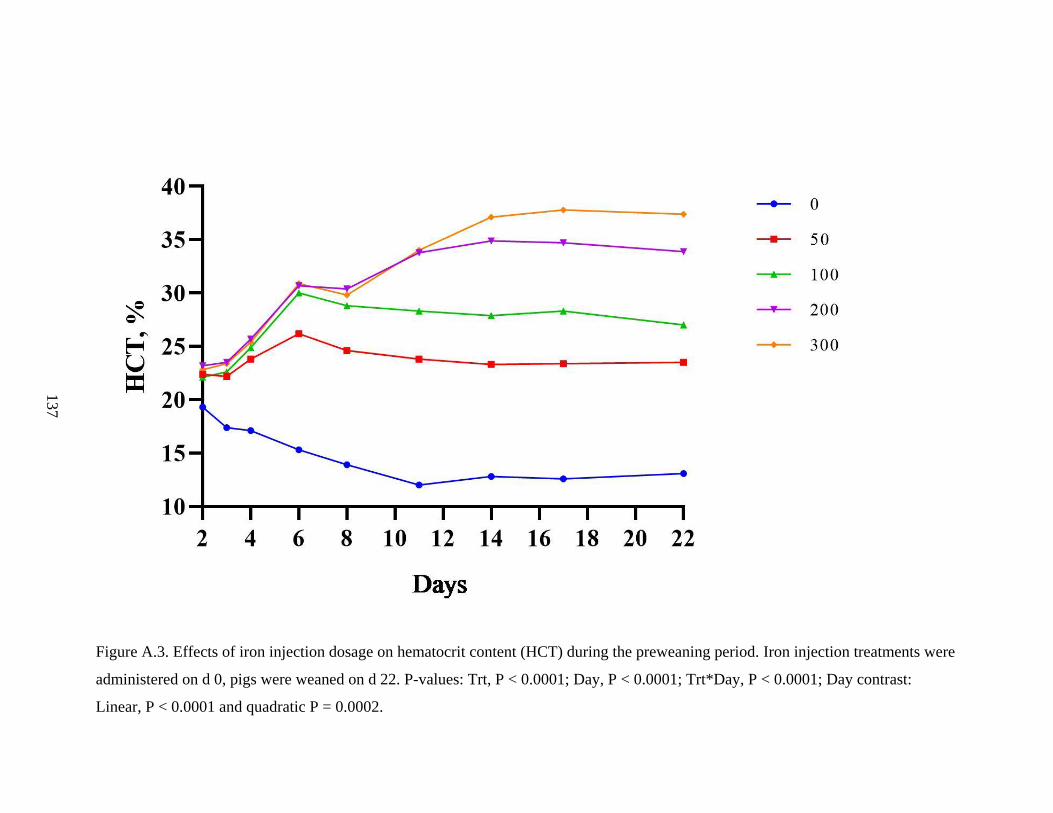
137
Figure A.3. Effects of iron injection dosage on hematocrit content (HCT) during the preweaning period. Iron injection treatments were
administered on d 0, pigs were weaned on d 22. P-values: Trt, P < 0.0001; Day, P < 0.0001; Trt*Day, P < 0.0001; Day contrast:
Linear, P < 0.0001 and quadratic P = 0.0002.
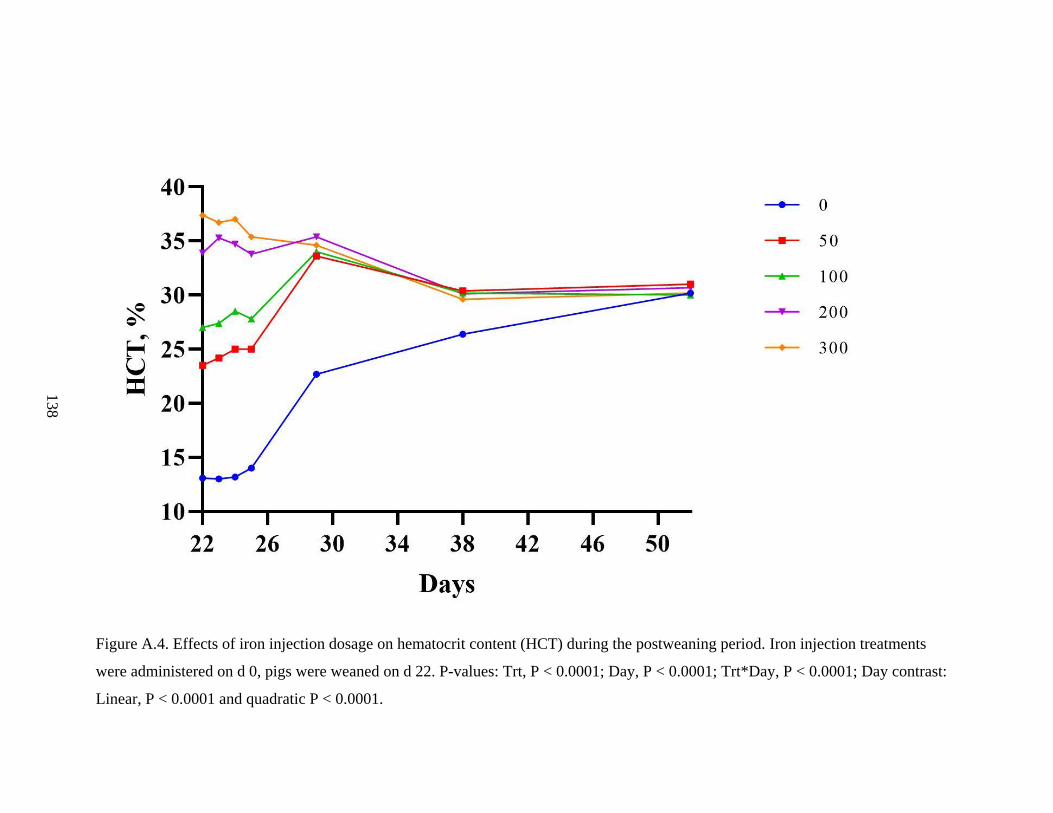
138
Figure A.4. Effects of iron injection dosage on hematocrit content (HCT) during the postweaning period. Iron injection treatments
were administered on d 0, pigs were weaned on d 22. P-values: Trt, P < 0.0001; Day, P < 0.0001; Trt*Day, P < 0.0001; Day contrast:
Linear, P < 0.0001 and quadratic P < 0.0001.
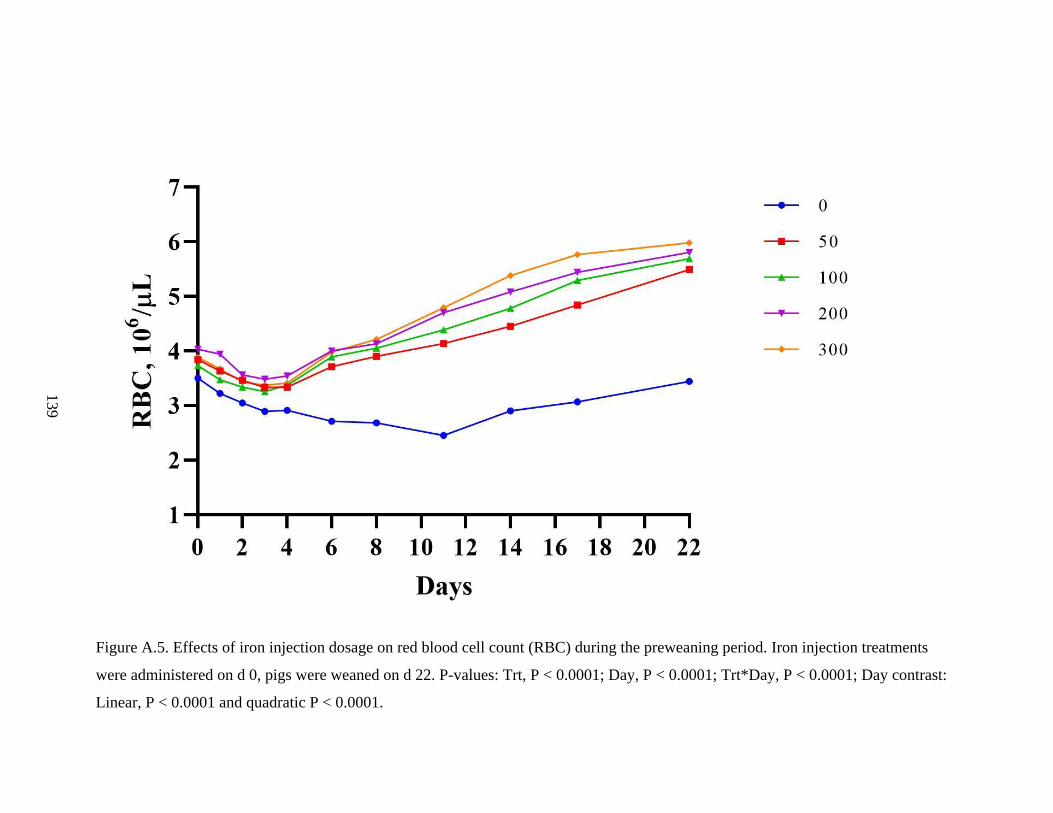
139
Figure A.5. Effects of iron injection dosage on red blood cell count (RBC) during the preweaning period. Iron injection treatments
were administered on d 0, pigs were weaned on d 22. P-values: Trt, P < 0.0001; Day, P < 0.0001; Trt*Day, P < 0.0001; Day contrast:
Linear, P < 0.0001 and quadratic P < 0.0001.
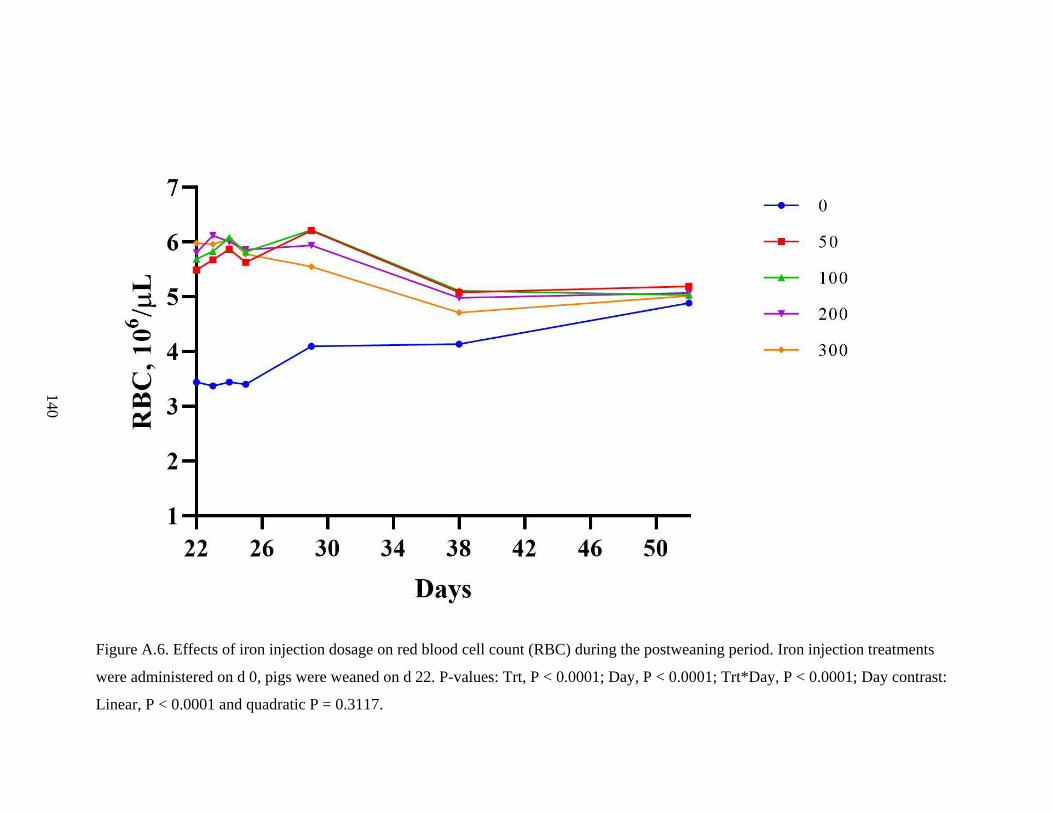
140
Figure A.6. Effects of iron injection dosage on red blood cell count (RBC) during the postweaning period. Iron injection treatments
were administered on d 0, pigs were weaned on d 22. P-values: Trt, P < 0.0001; Day, P < 0.0001; Trt*Day, P < 0.0001; Day contrast:
Linear, P < 0.0001 and quadratic P = 0.3117.
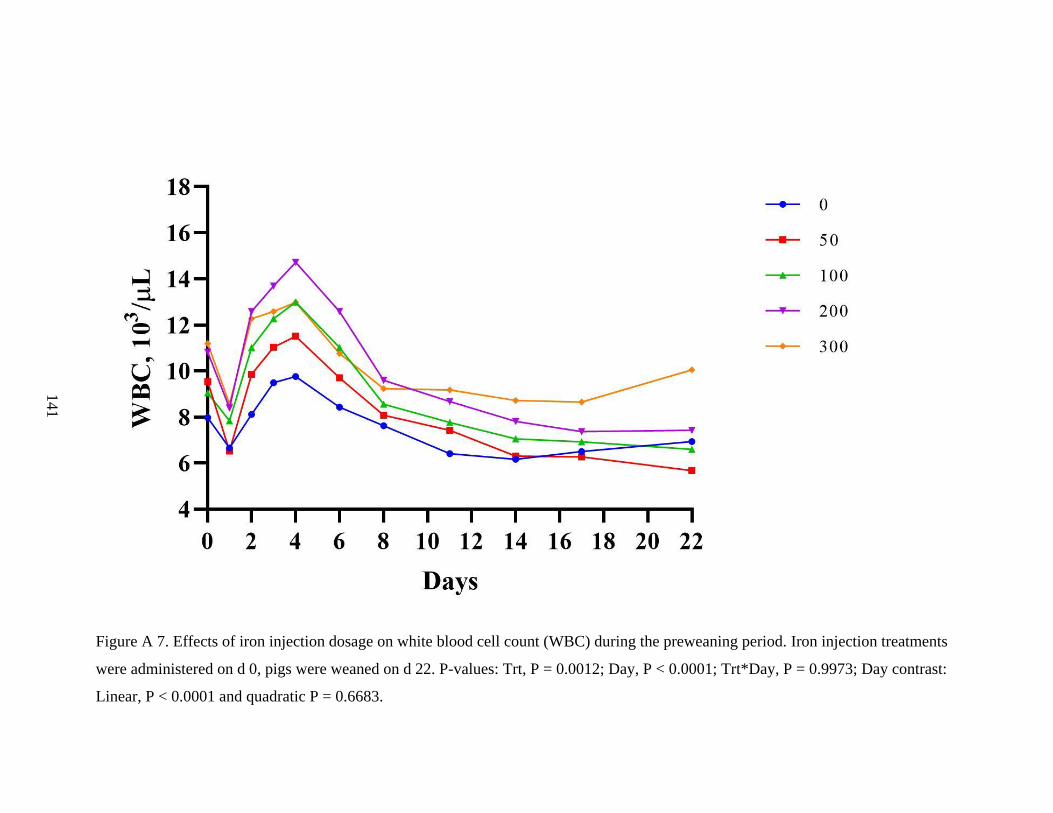
141
Figure A 7. Effects of iron injection dosage on white blood cell count (WBC) during the preweaning period. Iron injection treatments
were administered on d 0, pigs were weaned on d 22. P-values: Trt, P = 0.0012; Day, P < 0.0001; Trt*Day, P = 0.9973; Day contrast:
Linear, P < 0.0001 and quadratic P = 0.6683.
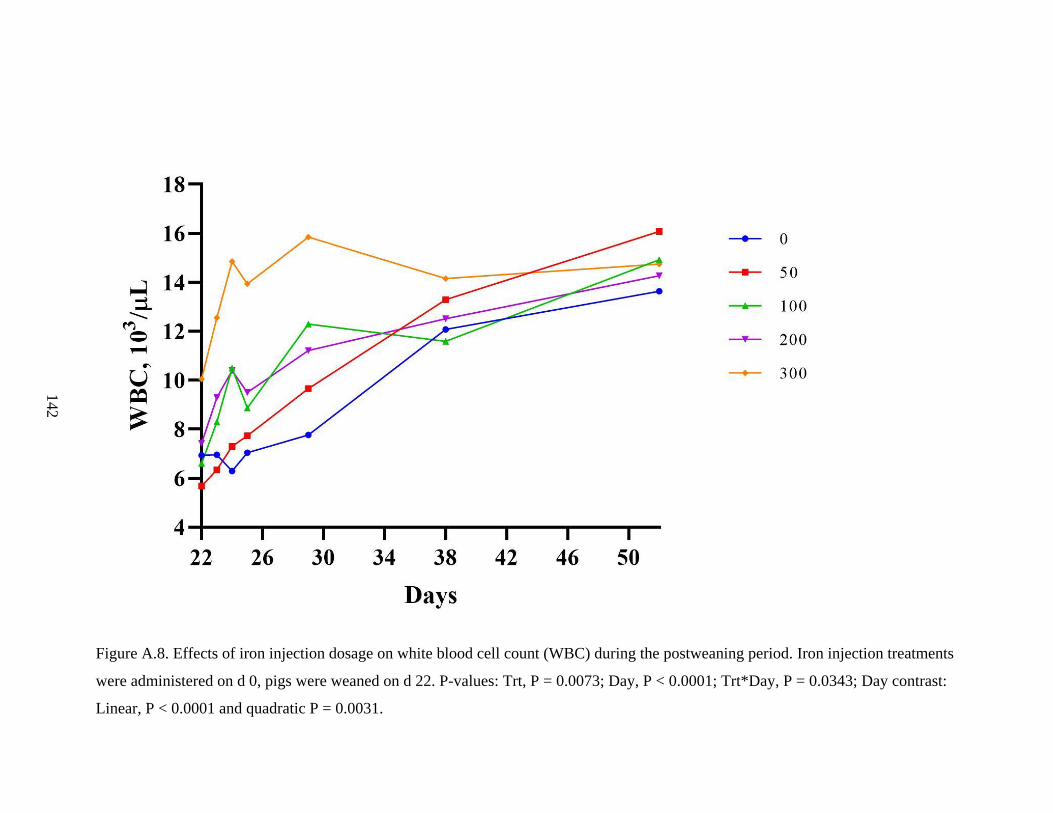
142
Figure A.8. Effects of iron injection dosage on white blood cell count (WBC) during the postweaning period. Iron injection treatments
were administered on d 0, pigs were weaned on d 22. P-values: Trt, P = 0.0073; Day, P < 0.0001; Trt*Day, P = 0.0343; Day contrast:
Linear, P < 0.0001 and quadratic P = 0.0031.
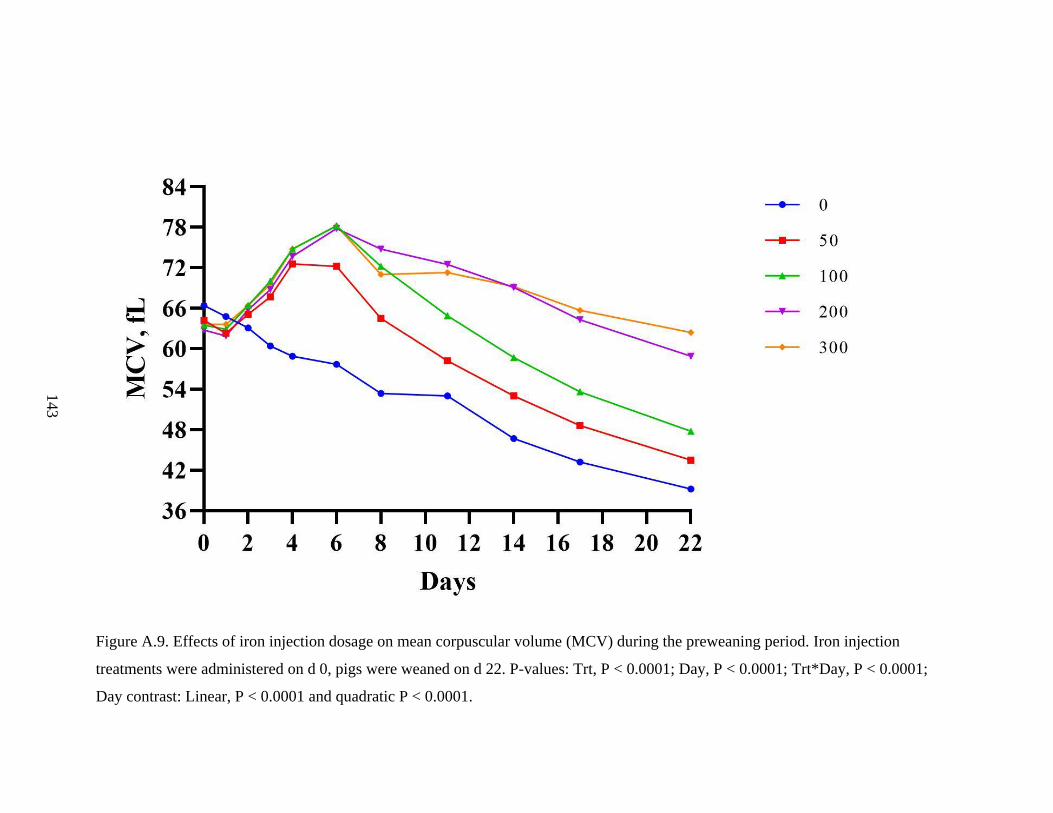
143
Figure A.9. Effects of iron injection dosage on mean corpuscular volume (MCV) during the preweaning period. Iron injection
treatments were administered on d 0, pigs were weaned on d 22. P-values: Trt, P < 0.0001; Day, P < 0.0001; Trt*Day, P < 0.0001;
Day contrast: Linear, P < 0.0001 and quadratic P < 0.0001.
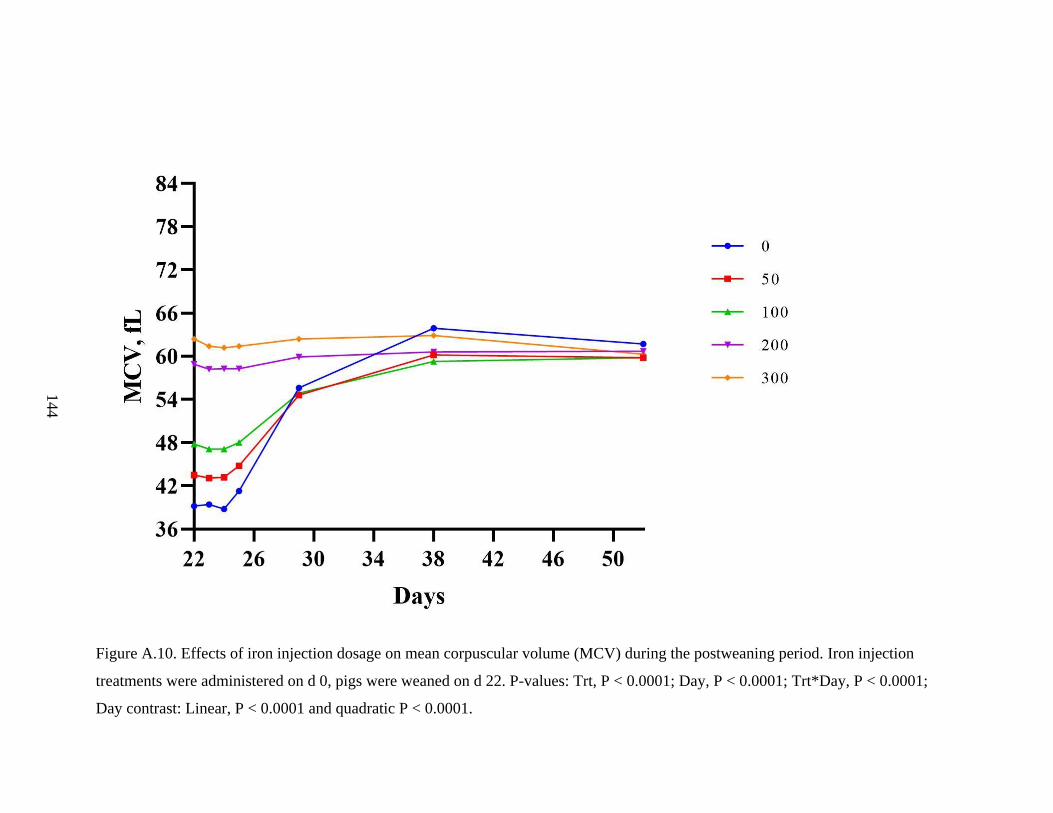
144
Figure A.10. Effects of iron injection dosage on mean corpuscular volume (MCV) during the postweaning period. Iron injection
treatments were administered on d 0, pigs were weaned on d 22. P-values: Trt, P < 0.0001; Day, P < 0.0001; Trt*Day, P < 0.0001;
Day contrast: Linear, P < 0.0001 and quadratic P < 0.0001.
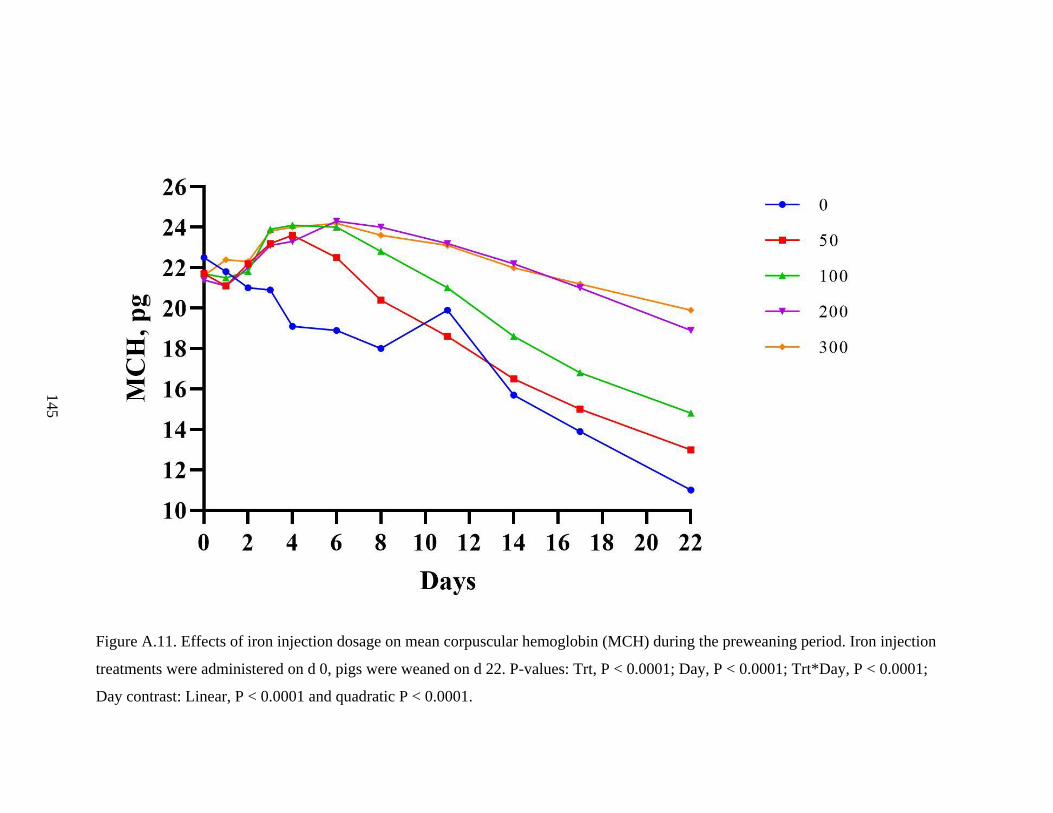
145
Figure A.11. Effects of iron injection dosage on mean corpuscular hemoglobin (MCH) during the preweaning period. Iron injection
treatments were administered on d 0, pigs were weaned on d 22. P-values: Trt, P < 0.0001; Day, P < 0.0001; Trt*Day, P < 0.0001;
Day contrast: Linear, P < 0.0001 and quadratic P < 0.0001.
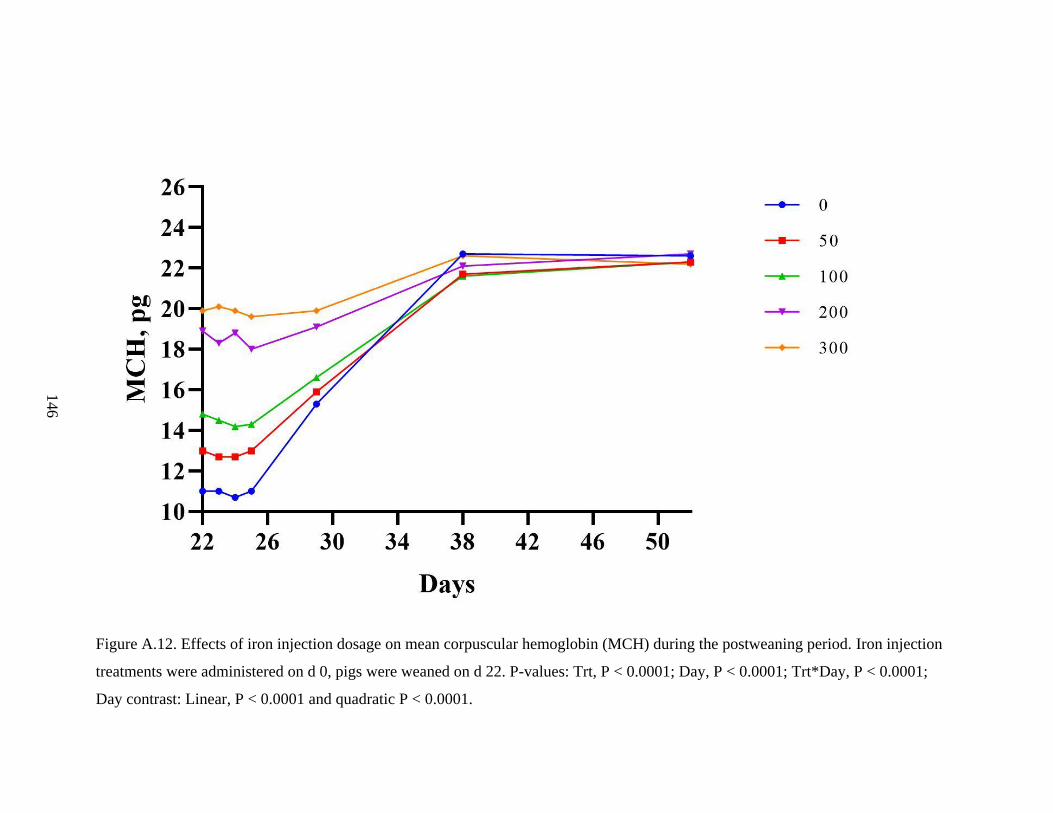
146
Figure A.12. Effects of iron injection dosage on mean corpuscular hemoglobin (MCH) during the postweaning period. Iron injection
treatments were administered on d 0, pigs were weaned on d 22. P-values: Trt, P < 0.0001; Day, P < 0.0001; Trt*Day, P < 0.0001;
Day contrast: Linear, P < 0.0001 and quadratic P < 0.0001.
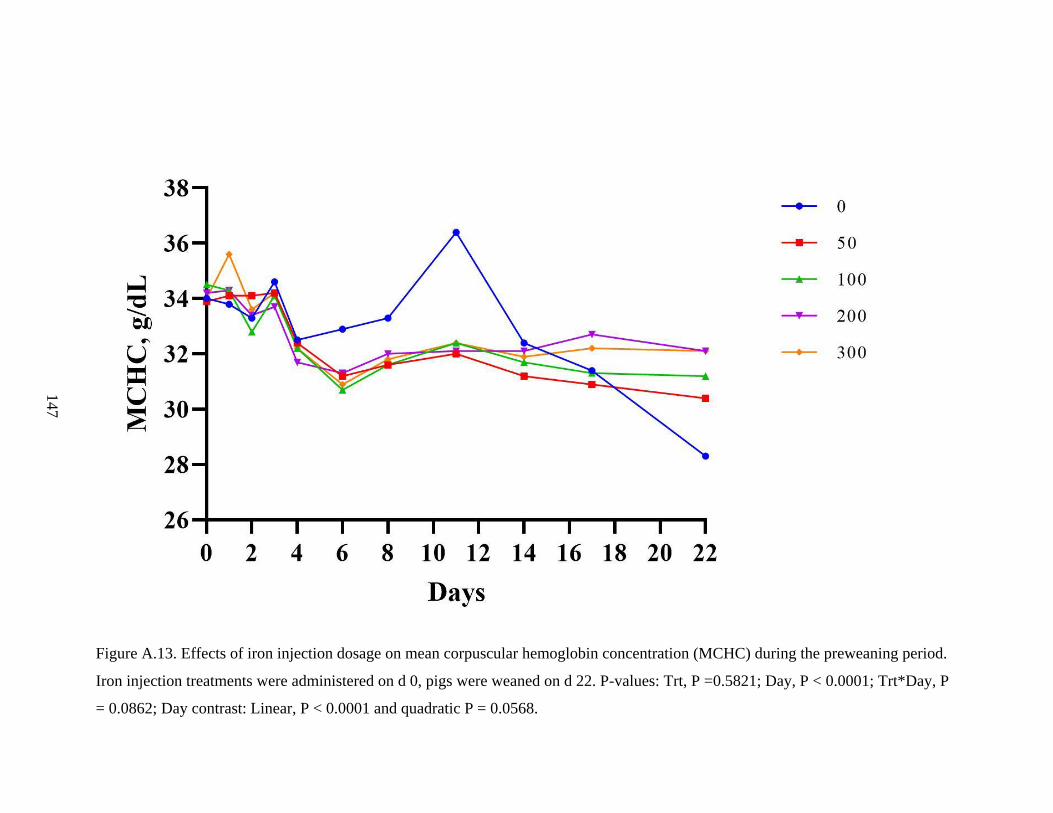
147
Figure A.13. Effects of iron injection dosage on mean corpuscular hemoglobin concentration (MCHC) during the preweaning period.
Iron injection treatments were administered on d 0, pigs were weaned on d 22. P-values: Trt, P =0.5821; Day, P < 0.0001; Trt*Day, P
= 0.0862; Day contrast: Linear, P < 0.0001 and quadratic P = 0.0568.
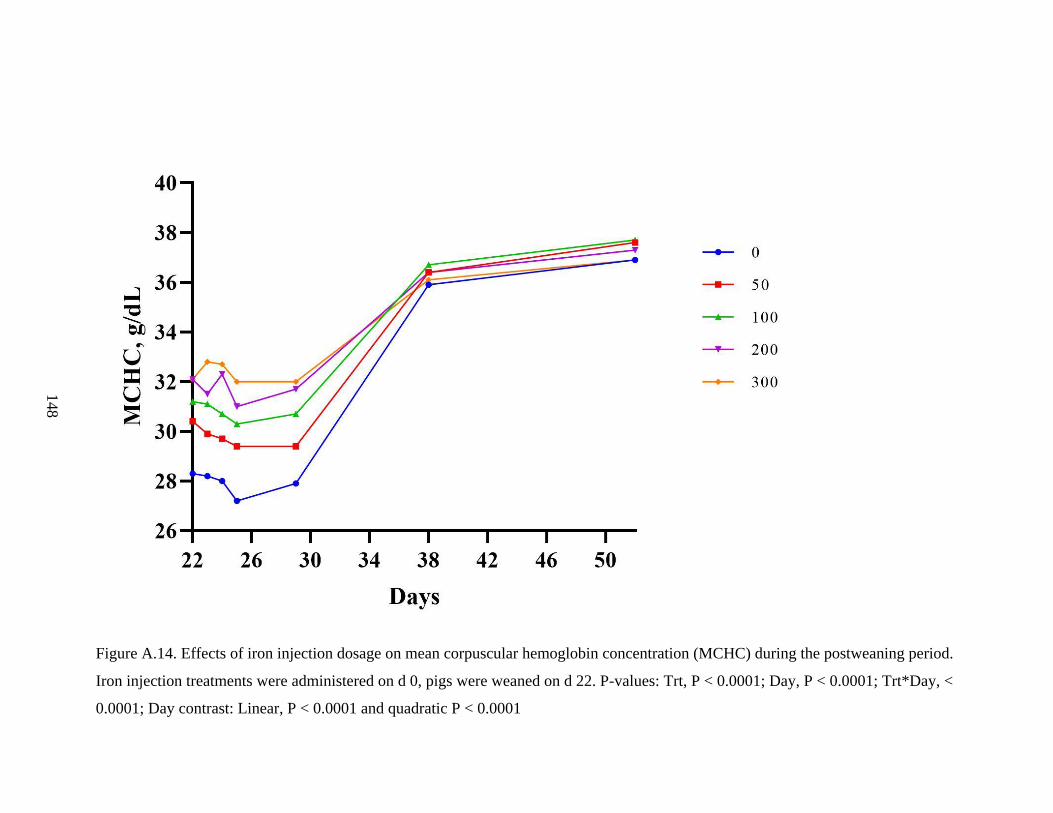
148
Figure A.14. Effects of iron injection dosage on mean corpuscular hemoglobin concentration (MCHC) during the postweaning period.
Iron injection treatments were administered on d 0, pigs were weaned on d 22. P-values: Trt, P < 0.0001; Day, P < 0.0001; Trt*Day, <
0.0001; Day contrast: Linear, P < 0.0001 and quadratic P < 0.0001
149
REFERENCES
Aisen, P., C. Enns, and M. Wessling-Resnick. 2001. Chemistry and biology of eukaryotic
iron metabolism. Int. J. Biochem. Cell Biol. 33(10):940-959. doi:
https://doi.org/10.1016/S1357-2725(01)00063-2.
Ali, M. A. 1976. The hypochromic anemias. Can. Fam. Physician. 22:42-46.
Almond, G., E. Byers, J. Seate, and P. Boyer. 2017. Supplemental iron dextran injections:
influence on hemoglobin concentrations and piglet growth. J. Swine Health Prod.
25(6):308-312.
AOAC. 1990. Official methods of analysis 15th ed. AOAC, Arlington, Va.
Astrup, H. N., and A. Lyso. 1986. Nutritional Cu, Fe interrelation affected by energy
levels? The effect of iron and thyroxine on pigs given extra copper. Acta
Pharmacol. Tox. 59 Suppl. 7:152-155.
Bach, J. E. 2006. Effect of an additional iron injection in a PMWS postitive herd in
respect to haemoglobin, hematocrit, growth rate and differential blood cell count.
In: 19th IPVS Congress Copenhagen, Denmark. p 565.
Bazer, F. W., T. T. Chen, J. W. Knight, D. Schlosnagle, N. J. Baldwin, and R. M.
Roberts. 1975. Presence of a progesterone-induced, uterine specific, acid
phosphatase in allantoic fluid of gilts. J. Anim. Sci. 41(4):1112-1119.
Beckman, B., P. Silberstein, and I. T. Aldoss. 2010. Erythropoiesis. In: S. J. Enna and D.
B. Bylund, editors, xPharm: The Comprehensive Pharmacology Reference.
Elsevier, New York. p. 1-4.
Bhattarai, S., and J. P. Nielsen. 2015. Early indicators of iron deficiency in large piglets
at weaning. J. Swine Health Prod. 23(1):10-17.
150
Bökönyi, S. 1974. History of domestic mammals in central and eastern Europe.
Akadémiai Kiadó, Budapest.
Braude, R., A. G. Chamberlain, M. Kotarbinska, and K. G. Mitchell. 1962. The
metabolism of iron in piglets given labelled iron either orally or by injection. Brit.
J. Nutr. 16:427-449.
Britton, R. S., G. A. Ramm, J. Olynyk, R. Singh, R. O'Neill, and B. R. Bacon. 1994.
Pathophysiology of iron toxicity. Adv. Exp. Med. and Biol. 356:239-253. doi:
10.1007/978-1-4615-2554-7_26.
Camaschella, C. 2017. New insights into iron deficiency and iron deficiency anemia.
Blood Rev. 31(4):225-233. doi: 10.1016/j.blre.2017.02.004.
Camaschella, C., and A. Pagani. 2018. Advances in understanding iron metabolism and
its crosstalk with erythropoiesis. Br. J. Haematol. 182(4):481-494. doi:
10.1111/bjh.15403.
Carpenter, K. J. 1990. The history of a controversy over the role of inorganic iron in the
treatment of anemia. J. Nutr. 120(2):141-147. doi: 10.1093/jn/120.2.141.
Casiday, R., and R. Frey. 1998. Iron use and storage in the body: ferritin and molecular
representations. Department of Chemistry, Washington University, St. Louis.
USA.
Coffey, M. T., R. W. Seerley, and J. W. Mabry. 1982. The effect of source of
supplemental dietary energy on sow milk yield, milk composition and litter
performance. J. Anim. Sci. 55(6):1388-1394. doi: 10.2527/jas1982.5561388x.
Collins, J. F., J. R. Prohaska, and M. D. Knutson. 2010. Metabolic crossroads of iron and
copper. Nutr. Rev. 68(3):133-147. doi: 10.1111/j.1753-4887.2010.00271.x.
151
Colombo, C., G. Palumbo, J.-Z. He, R. Pinton, and S. Cesco. 2014. Review on iron
availability in soil: interaction of Fe minerals, plants, and microbes. J. Soils
Sediments. 14(3):538-548.
Conrad, M. E., and S. G. Schade. 1968. Ascorbic acid chelates in iron absorption: a role
for hydrochloric acid and bile. Gastroenterology 55:35-45.
Conrad, M. E., and J. N. Umbreit. 2000. Iron absorption and transport-an update. Am. J.
Hematol. 64(4):287-298.
Conrad, M. E., and J. N. Umbreit. 2002. Pathways of iron absorption. Blood Cells Mol.
Dis. 29(3):336-355. doi: https://doi.org/10.1006/bcmd.2002.0564.
Conrad, M. E., J. N. Umbreit, E. G. Moore, L. N. Hainsworth, M. Porubcin, M. J.
Simovich, M. T. Nakada, K. Dolan, and M. D. Garrick. 2000. Separate pathways
for cellular uptake of ferric and ferrous iron. Am. J. Physiol. Gastrointest. Liver
Physiol. 279(4):G767-G774. doi: 10.1152/ajpgi.2000.279.4.G767.
Csapo, J., Z. Csapokiss, T. G. Martin, and Z. Hazas. 1995. Composition of sows
colostrum and milk .2. Fatty-acid composition, and contents of fat, vitamins and
macroelement and microelements. Acta Aliment. 24(2):145-159.
Cunha, T. J. 1977. Swine feeding and nutrition. Academic Press, New York.
Dallman, P. R. 1986. Biochemical basis for the manifestations of iron deficiency. Annu.
Rev. Nutr. 6(1):13-40.
Danielson, B. G. 2004. Structure, chemistry, and pharmacokinetics of intravenous iron
agents. J. Am. Soc. Nephrol.: JASN 15 Suppl 2:S93-98. doi:
10.1097/01.asn.0000143814.49713.c5.
152
Douglas, T. A., J. P. Renton, C. Watts, and H. A. Ducker. 1972. Placental transfer of iron
in the sow (Sus domesticus). Comp Biochem Physiol A Comp Physiol. 43(3):665-
671.
Dzierzak, E., and S. Philipsen. 2013. Erythropoiesis: development and differentiation.
Cold Spring Harbor. Perspect Med. 3(4):a011601. doi:
10.1101/cshperspect.a011601.
Egeli, A. K., and T. Framstad. 1998. Evaluation of the efficacy of perorally administered
glutamic acid-chelated iron and iron-dextran injected subcutaneously in Duroc
and Norwegian Landrace piglets. Zentralbl Veterinarmed A. 45(1):53-61.
Egeli, A. K., T. Framstad, and H. Morberg. 1998. Clinical biochemistry, haematology
and body weight in piglets. Acta Vet. Scand. 39(3):381-393.
Elliott, R. F., G. W. Vander Noot, R. L. Gilbreath, and H. Fisher. 1971. Effect of dietary
protein level on composition changes in sow colostrum and milk. J. Anim. Sci.
32(6):1128-1137. doi: 10.2527/jas1971.3261128x.
Estienne, M. J., and S. G. Clark-Deener. 2018. Effect of iron treatment at weaning on
growth performance in nursery pigs fed diets supplemented with copper- NPB
#17-052.
Fidler, M. C., L. Davidsson, C. Zeder, and R. F. Hurrell. 2004. Erythorbic acid is a potent
enhancer of nonheme-iron absorption. Am. J. Clin. Nutr. 79(1):99-102. doi:
10.1093/ajcn/79.1.99.
Fleming, M. D., C. C. Trenor, 3rd, M. A. Su, D. Foernzler, D. R. Beier, W. F. Dietrich,
and N. C. Andrews. 1997. Microcytic anaemia mice have a mutation in Nramp2, a
153
candidate iron transporter gene. Nat. Genet. 16(4):383-386. doi: 10.1038/ng0897-
383.
Foreign Agricultural Service, U. F. A. 2019. Livestock and Poultry: World Markets and
Trade.
Fredericks, L., C. Olsen, A. Maschoff, and C. Shull. 2018. Evaluation of the impact of
iron dosage on post-weaning weight gain, and mortality. In: 49th Annual Meeting
of the Association of Swine Veterinarians, San Diego, California. p 315.
Gaddy, H. J., J. D. Prussman, and D. A. Gable. 2012. A review of recent supplemental
iron industry practices and current usage of Uniferon ® (iron dextran complex
injection, 200 mg/mL) in baby pigs. In: AASV 43rd Annual Meeting Proceedings,
Denver, Colorado. p 167-171.
Ganz, T. 2003. Hepcidin, a key regulator of iron metabolism and mediator of anemia of
inflammation. Blood. 102(3):783-788. doi: 10.1182/blood-2003-03-0672.
Geisser, P., and S. Burckhardt. 2011. The pharmacokinetics and pharmacodynamics of
iron preparations. Pharmaceutics. 3(1):12-33.
Gentry, J. L., J. W. G. M. Swinkels, M. D. Lindemann, and J. W. Schrama. 1997. Effect
of hemoglobin and immunization status on energy metabolism of weanling pigs.
J. Anim. Sci. 75(4):1032-1040. doi: 10.2527/1997.7541032x.
Gillespie, T. 2019. What is IDA? Experience and success factors used to eliminate iron
deficiency anemia and achieve peak performance that lasts a pigs lifetime. In:
50th Annual Meeting of the American Association of Swine Veterinarians
Orlando, FL. p 156-158.
154
Giuffra, E., J. M. Kijas, V. Amarger, O. Carlborg, J. T. Jeon, and L. Andersson. 2000.
The origin of the domestic pig: independent domestication and subsequent
introgression. Genetics. 154(4):1785-1791.
Gunshin, H., B. Mackenzie, U. V. Berger, Y. Gunshin, M. F. Romero, W. F. Boron, S.
Nussberger, J. L. Gollan, and M. A. Hediger. 1997. Cloning and characterization
of a mammalian proton-coupled metal-ion transporter. Nature. 388(6641):482-
488. doi: 10.1038/41343.
Haugegaard, J., H. Wachmann, and P. Kristensen. 2008. Effect of supplementing
fastgrowing, late-weaned piglets twice with 200 mg iron dextran intra-muscularly.
Pig. J. 61(6).
Hemmings, W. A., and F. W. Brambell. 1961. Protein transfer across the foetal
membranes. Br. Med. Bull. 17:96-101. doi: 10.1093/oxfordjournals.bmb.a069903.
Hill, C. H., and G. Matrone. 1970. Chemical parameters in the study of in vivo and in
vitro interactions of transition elements. Federation Proceedings 29(4):1474-1481.
Hill, G., P. Ku, E. Miller, D. Ullrey, T. Losty, and B. O'Dell. 1983. A copper deficiency
in neonatal pigs induced by a high zinc maternal diet. J. Nutr. 113(4):867-872.
Holter, P. H., T. Framstad, A. Aulie, H. E. Refsum, and Ø. V. Sjaastad. 1991. Effect of
iron treatment on erythrocyte parameters in postnatal anemia of the pig. Pediatr.
Hematol. Oncol. 8(1):1-11. doi: 10.3109/08880019109033422.
Huebers, H. A., and C. A. Finch. 1984. Transferrin: physiologic behavior and clinical
implications. Blood. 64(4):763-767.
155
Hunt, J. R. 2005. Dietary and physiological factors that affect the absorption and
bioavailability of iron. Int. J. Vitam. Nutr. Res. 75(6):375-384. doi: 10.1024/0300-
9831.75.6.375.
Hurley, W. 2015. Composition of sow colostrum and milk. The gestating and lactating
sow: p. 193-229.
Jain, N. C. 1986. Schalm's veterinary hematology. 4 ed. Lea & Febiger, Philadelphia.
Jolliff, J., and D. Mahan. 2011. Effect of injected and dietary iron in young pigs on blood
hematology and postnatal pig growth performance. J.Anim. Sci. 89(12):4068-
4080.
Kadis, S., F. A. Udeze, J. Polanco, and D. W. Dreesen. 1984. Relationship of iron
administration to susceptibility of newborn pigs to enterotoxic colibacillosis. Am.
J. Vet. Res. 45(2):255-259.
Kamphues, J., K. Männer, and C. Netzer. 1992. Effects of a 2nd iron injection in suckling
pigs on iron retention and performance before and after weaning. In: Proceedings
of the 12th IPVS Congress.
Kendrew, J. C., R. E. Dickerson, B. E. Strandberg, R. G. Hart, D. R. Davies, D. C.
Phillips, and V. Shore. 1960. Structure of myoglobin: A three-dimensional
Fourier synthesis at 2 Å. resolution. Nature. 185(4711):422.
Klevay, L. M. 2001. Iron overload can induce mild copper deficiency. J. Trace Elem.
Med. Biol. 14(4):237-240. doi: 10.1016/s0946-672x(01)80009-2.
Knight, C. D., K. C. Klasing, and D. M. Forsyth. 1983. E. coli growth in serum of iron
dextran-supplemented pigs. J. Anim. Sci. 57(2):387-395. doi:
10.2527/jas1983.572387x.
156
Krishnamurthy, P., T. Xie, and J. D. Schuetz. 2007. The role of transporters in cellular
heme and porphyrin homeostasis. Pharmacol. Ther. 114(3):345-358. doi:
10.1016/j.pharmthera.2007.02.001.
Ku, P. K., E. R. Miller, and D. E. Ullrey. 1983. Effect of parenteral iron on serum
electrolytes of the baby pig. J. Anim. Sci. 57(3):638-644. doi:
10.2527/jas1983.573638x.
Larson, G., T. Cucchi, and K. Dobney. 2011. Genetic aspects of pig domestication. In: M.
F. Rothschild and A. Ruvinsky, editor, The genetics of the pig: second edition.
CABI, Cambridge, MA. p. 14-37.
Lee, G. R., S. Nacht, J. N. Lukens, and G. E. Cartwright. 1968. Iron metabolism in
copper-deficient swine. J. Clin. Invest. 47(9):2058-2069. doi: 10.1172/JCI105891.
Li, Y., W. Yang, D. Dong, S. Jiang, Z. Yang, and Y. Wang. 2018. Effect of different
sources and levels of iron in the diet of sows on iron status in neonatal pigs.
Anim. Nutr. 4(2):197-202. doi: https://doi.org/10.1016/j.aninu.2018.01.002.
Lieu, P. T., M. Heiskala, P. A. Peterson, and Y. Yang. 2001. The roles of iron in health
and disease. Mol. Aspects Med. 22(1-2):1-87.
Lipiński, P., R. R. Starzyński, F. Canonne-Hergaux, B. Tudek, R. Oliński, P. Kowalczyk,
T. Dziaman, O. Thibaudeau, M. A. Gralak, E. Smuda, J. Woliński, A. Usińska,
and R. Zabielski. 2010. Benefits and risks of iron supplementation in anemic
neonatal pigs. Am. J. Pathol. 177(3):1233-1243. doi:
10.2353/ajpath.2010.091020.
Lloyd, L. E., B. E. McDonald, and E. W. Crampton. 1960. Fundamentals of Nutrition. 2
ed. WH Freeman And Company; San Francisco.
157
Lu, N. 2018. Long-term effects of dietary copper source and level on performance and
health of sows and piglets. Theses and Dissertations--Animal and Food Sciences.
85. https://uknowledge.uky.edu/animalsci_etds/85.
Mahan, D. C., M. R. Watts, and N. St-Pierre. 2009. Macro- and micromineral
composition of fetal pigs and their accretion rates during fetal development1,2. J.
Anim. Sci. 87(9):2823-2832. doi: 10.2527/jas.2008-1266.
Martin, L. E., C. M. Bates, C. R. Beresford, J. D. Donaldson, F. F. McDonald, D.
Dunlop, P. Sheard, E. London, and G. D. Twigg. 1955. The pharmacology of an
iron-dextran intramuscular haematinic. Br. J. Pharmacol. Chemother. 10(3):375-
382. doi: 10.1111/j.1476-5381.1955.tb00887.x.
Massey, A. C. 1992. Microcytic anemia. Differential diagnosis and management of iron
deficiency anemia. Med. Clin. North Am. 76(3):549-566.
McAnena, L. 2005. Lessons in human mineral nutrition: what can we learn? In: J. Taylor-
Pickard and L. Tucker, editors, Re-defining mineral nutrition. p. 127-146.
McGowan, J. P., and A. Crichton. 1924. Iron deficiency in pigs. Biochem. J. 18(1):204-
207. doi: 10.1042/bj0180265.
Miller, E. R. 1991. Chapter 15 - Iron, copper, zinc, manganese, and iodine in swine
nutrition. In: E. R. Miller, D. E. Ullrey and A. J. Lewis, editors, Swine Nutrition.
Butterworth-Heinemann. p. 267-284.
Morales, J., A. Manso, T. Martín-Jiménez, K. Hamadi, and D. Sperling. 2018.
Comparison of the pharmacokinetics and efficacy of two different iron
supplementation products in suckling piglets. J. Swine Health Prod.
2018;26(4):200-207.
158
Munoz, M., I. Villar, and J. A. Garcia-Erce. 2009. An update on iron physiology. World
J. Gastroenterol. 15(37):4617-4626. doi: 10.3748/wjg.15.4617.
Murphy, K. A. 1997. Effects of weaning age and dosage of supplemented iron on the
hemoglobin concentrations and growth rate of piglets. Journal of Swine Health
and Production 5(4):135-138.
Naghii, M. R., and A. I. Fouladi. 2006. Correct assessment of iron depletion and iron
deficiency anemia. Nutr. Health. 18(2):133-139. doi:
10.1177/026010600601800205.
Nemeth, E., and T. Ganz. 2006. Hepcidin and iron-loading anemias. Haematologica
91(6):727-732.
Nemeth, E., S. Rivera, V. Gabayan, C. Keller, S. Taudorf, B. K. Pedersen, and T. Ganz.
2004a. IL-6 mediates hypoferremia of inflammation by inducing the synthesis of
the iron regulatory hormone hepcidin. J. Clin. Invest. 113(9):1271-1276. doi:
10.1172/jci20945.
Nemeth, E., M. S. Tuttle, J. Powelson, M. B. Vaughn, A. Donovan, D. M. Ward, T.
Ganz, and J. Kaplan. 2004b. Hepcidin regulates cellular iron efflux by binding to
ferroportin and inducing its internalization. Science (New York, N.Y.)
306(5704):2090-2093. doi: 10.1126/science.1104742.
NRC. 1998. Nutrient requirements of swine: 10th Revised Edition. The National
Academies Press, Washington, DC.
NRC. 2005. Mineral Tolerance of Animals: Second Revised Edition, 2005. The National
Academies Press, Washington, DC.
159
NRC. 2012. Nutrient requirements of swine: Eleventh Revised Edition. The National
Academies Press, Washington, DC.
Olsen, C. 2019. The economics of iron deficiency anemia on US swine production: An
annual impact of 46-335 million US dollars. In: 50th Annual Meeting of the
American Association of Swine Veterinarians Orlando, FL. p 351-352.
Owen, C. A., Jr. 1973. Effects of iron on copper metabolism and copper on iron
metabolism in rats. Am. J. Physiol. 224(3):514-518. doi:
10.1152/ajplegacy.1973.224.3.514.
Pagani, A., A. Nai, G. Corna, L. Bosurgi, P. Rovere-Querini, C. Camaschella, and L.
Silvestri. 2011. Low hepcidin accounts for the proinflammatory status associated
with iron deficiency. Blood. 118(3):736-746. doi: 10.1182/blood-2011-02-
337212.
Patterson, D. S., W. M. Allen, S. Berrett, D. Sweasey, and J. T. Done. 1971. The toxicity
of parenteral iron preparations in the rabbit and pig with a comparison of the
clinical and biochemical responses to iron-dextrose in 2 days old and 8 days old
piglets. Zentralbl Veterinarmed A. 18(6):453-464. doi: 10.1111/j.1439-
0442.1971.tb00601.x.
Patterson, D. S., W. M. Allen, S. Berrett, D. Sweasey, D. C. Thurley, and J. T. Done.
1969. A biochemical study of the pathogenesis of iron-induced myodegeneration
of piglets. Zentralbl Veterinarmed A.16(3):199-214. doi: 10.1111/j.1439-
0442.1969.tb00722.x.
160
Perri, A. M., R. M. Friendship, J. C. Harding, and T. L. O’Sullivan. 2016. An
investigation of iron deficiency and anemia in piglets and the effect of iron status
at weaning on post-weaning performance. J. Swine Health Prod. 24(1):10-20.
Perrin, E., A. Perri, R. Friendship, and T. O'Sullivan. 2016. Evaluation of a second iron
supplementation and the use of zinc oxide in the prevention of iron-deficient
anemia in young pigs. In: AASV 47th Annual Meeting New Orleans, Louisiana. p
87.
Peters, J.C., and D. C. Mahan. 2008. Effects of neonatal iron status, iron injections at
birth, and weaning in young pigs from sows fed either organic or inorganic trace
minerals. J. Anim. Sci. 86(9):2261-2269.
Peters, J. C., D. C. Mahan, T. G. Wiseman, and N. D. Fastinger. 2010. Effect of dietary
organic and inorganic micromineral source and level on sow body, liver,
colostrum, mature milk, and progeny mineral compositions over six parities. J.
Anim. Sci. 88(2):626. doi: 10.2527/jas.2009-1782.
Pietrangelo, A., E. Rocchi, G. Casalgrandi, G. Rigo, A. Ferrari, M. Perini, E. Ventura,
and G. Cairo. 1992. Regulation of transferrin, transferrin receptor, and ferritin
genes in human duodenum. Gastroenterology. 102(3):802-809.
Pig Champ 2019. Benchmark. https://www.pigchamp.com/benchmarking/benchmarking-
summaries.
Pond, W. G., T. L. Veum, and V. A. Lazar. 1965. Zinc and iron concentration of sows'
milk. J. Anim. Sci. 24(3):668-670. doi: 10.2527/jas1965.243668x.
Pu, Y., S. Li, H. Xiong, X. Zhang, Y. Wang, and H. Du. 2018. Iron promotes intestinal
development in neonatal piglets. Nutrients. 10(6)doi: 10.3390/nu10060726.
161
Raffin, S. B., C. H. Woo, K. T. Roost, D. C. Price, and R. Schmid. 1974. Intestinal
absorption of hemoglobin iron-heme cleavage by mucosal heme oxygenase. J.
Clin. Invest. 54(6):1344-1352.
Ragan, H., S. Nacht, G. Lee, C. Bishop, and G. Cartwright. 1969. Effect of ceruloplasmin
on plasma iron in copper-deficient swine. Am. J. Physiol. 217(5):1320-1323. doi:
10.1152/ajplegacy.1969.217.5.1320.
Rao, R., and M. K. Georgieff. 2007. Iron in fetal and neonatal nutrition. Semin. Fetal
Neonatal Med. 12(1):54-63. doi: 10.1016/j.siny.2006.10.007.
Renegar, R. H., F. W. Bazer, and R. M. Roberts. 1982. Placental transport and
distribution of uteroferrin in the fetal pig. Biol. Reprod.27(5):1247-1260.
Rincker, M. J., G. M. Hill, J. E. Link, A. M. Meyer, and J. E. Rowntree. 2005. Effects of
dietary zinc and iron supplementation on mineral excretion, body composition,
and mineral status of nursery pigs1,2. J. Anim. Sci. 83(12):2762-2774. doi:
10.2527/2005.83122762x.
Rincker, M. J., G. M. Hill, J. E. Link, and J. E. Rowntree. 2004. Effects of dietary iron
supplementation on growth performance, hematological status, and whole-body
mineral concentrations of nursery pigs1. J. Anim. Sci. 82(11):3189-3197. doi:
10.2527/2004.82113189x.
Rivera, S., E. Nemeth, V. Gabayan, M. A. Lopez, D. Farshidi, and T. Ganz. 2005.
Synthetic hepcidin causes rapid dose-dependent hypoferremia and is concentrated
in ferroportin-containing organs. Blood 106(6):2196-2199. doi: 10.1182/blood-
2005-04-1766.
162
Roberts, R., and F. Bazer. 1980. The properties, function and hormonal control of
synthesis of uteroferrin, the purple protein of the pig uterus. In: M. Beato, editor,
Steroid induced uterine proteins, Elsevier/ North Holland, Amsterdam. P. 133-
149.
Roberts, R. M., and F. W. Bazer. 1988. The functions of uterine secretions. J. Reprod.
Fertil. 82(2):875-892.
Rosenberg, I. H., and N. W. Solomons. 1982. Biological availability of minerals and
trace elements: a nutritional overview. Am. J. Clin. Nutr. 35(4):781-782. doi:
10.1093/ajcn/35.4.781.
Roy, C. N., H. H. Mak, I. Akpan, G. Losyev, D. Zurakowski, and N. C. Andrews. 2007.
Hepcidin antimicrobial peptide transgenic mice exhibit features of the anemia of
inflammation. Blood. 109(9):4038-4044. doi: 10.1182/blood-2006-10-051755.
Sarma, P. 1990. Red Cell Indices. In: H. Walker, W. Hall and J. Hurst, editors, Clinical
methods: the history, physical, and laboratory examinations. Butterworths,
Boston.
Shawki, A., P. B. Knight, B. D. Maliken, E. J. Niespodzany, and B. Mackenzie. 2012.
H(+)-coupled divalent metal-ion transporter-1: functional properties,
physiological roles and therapeutics. Curr. Top. Membr. 70:169-214. doi:
10.1016/b978-0-12-394316-3.00005-3.
Shawki, A., and B. Mackenzie. 2010. Interaction of calcium with the human divalent
metal-ion transporter-1. Biochem. Biophys. Res. Commun. 393(3):471-475. doi:
10.1016/j.bbrc.2010.02.025.
163
Siah, C. W., J. Ombiga, L. A. Adams, D. Trinder, and J. K. Olynyk. 2006. Normal iron
metabolism and the pathophysiology of iron overload disorders. Clin. Biochem.
Rev. 27(1):5-16.
Smith, A. L., K. J. Stalder, T. V. Serenius, and et al. 2008. Effect of weaning age on
nursery pig and sow reproductive performance. J. Swine Health Prod. 16(3):131-
137.
Solomons, N. W. 1988. Physiological interaction of minerals. In: C. E. Bodwell and J. W.
Erdman Jr., editors, Nutrient interactions. Marcel Dekker INC., New York, New
York. p. 115-148.
Solomons, N. W., and R. A. Jacob. 1981. Studies on the bioavailability of zinc in
humans: effects of heme and nonheme iron on the absorption of zinc. Am. J. Clin.
Nutr. 34(4):475-482. doi: 10.1093/ajcn/34.4.475.
Sourkes, T. L., K. Lloyd, and H. Birnbaum. 1968. Inverse relationship of heptic copper
and iron concentrations in rats fed deficient diets. Can. J. of Biochem. 46(3):267-
271. doi: 10.1139/o68-038.
Spiro, T. G., L. Pape, and P. Saltman. 1967. Hydrolytic polymerization of ferric citrate. I.
Chemistry of the polymer. J. Am. Chem. Soc. 89(22):5555-5559. doi:
10.1021/ja00998a008.
Stockman, R. 1893. The treatment of chlorosis by iron and some other drugs. Br. Med. J.
1(1687):881-885. doi: 10.1136/bmj.1.1687.881.
Strain, J. J., and K. D. Cashman. 2002. Minerals and trace elements In: M. Gibney, H.
Vorster and F. Kok, editors, Introduction to human nutrition. Wiley-Blackwell. P
188-237.
164
Svoboda, M., and J. Drabek. 2005. Iron deficiency in suckling piglets: etiology, clinical
aspects and diagnosis. Folia Vet. 49:104-111.
Szudzik, M., R. R. Starzyński, A. Jończy, R. Mazgaj, M. Lenartowicz, and P. Lipiński.
2018. Iron supplementation in suckling piglets: an ostensibly easy therapy of
neonatal iron deficiency anemia. Pharmaceuticals (Basel). 11(4):128. doi:
10.3390/ph11040128.
Toblli, J. E., and M. Angerosa. 2014. Optimizing iron delivery in the management of
anemia: patient considerations and the role of ferric carboxymaltose. Drug Des.
Devel. Ther. 8:2475-2491. doi: 10.2147/dddt.s55499.
Trumbo, P., A. A. Yates, S. Schlicker, and M. Poos. 2001. Dietary reference intakes:
vitamin A, vitamin K, arsenic, boron, chromium, copper, iodine, iron, manganese,
molybdenum, nickel, silicon, vanadium, and zinc. J. Am. Diet. Assoc.
101(3):294-301. doi: 10.1016/s0002-8223(01)00078-5.
Urbaniak, O., P. Spyrka, and A. Rząsa. 2017. Can iron work for pigs as a booster? Adv.
Cell Biol. 5(2):118-123.
USDA. 2012. Hogs and pigs report through 1994; farms, land in farms and livestock
operations 1995-2011.
Van Gorp, S., H. Segers, and C. Von der Recke. 2012. Preventing iron deficiency by
avoiding an iron gap in modern pig production. In: AASV 43rd Annual Meeting
Proceedings, Denver, Colorado. p 407-408.
Velásquez, J. I., and D. A. Aranzazu. 2004. An acute case of iron toxicity on newborn
piglets from Vitamin E/Se deficient sows. Revista Colombiana de Ciencias
Pecuarias 17(1):60-62.
165
Venn, J., R. McCance, and E. Widdowson. 1947. Iron metabolism in piglet anaemia. J.
Comp. Pathol. Ther. 57:314-325.
Veum, T. L., J. T. Gallo, W. G. Pond, L. D. Van Vleck, and J. K. Loosli. 1965. Effect of
ferrous fumarate in the lactation diet on sow milk iron, pig hemoglobin and
weight gain. J. Anim. Sci. 24(4):1169-1173. doi: 10.2527/jas1965.2441169x.
Von der Recke, C., and J. Heisel. 2014. Defining, evaluating and understanding iron
deficiency and anemia in modern swine production. In: AASV 45th Annual
Meeting, Dallas, Texas. p 173-174.
Wei, K. Q., Z. R. Xu, X. G. Luo, L. L. Zeng, W. R. Chen, and M. F. Timothy. 2005.
Effects of iron from an amino acid complex on the iron status of neonatal and
suckling piglets. Asian-Australas. J. Anim. Sci. 18(10):1485-1491. doi:
10.5713/ajas.2005.1485.
Werner, E., P. Roth, and J. P. Kaltwasser. 1982. Relationship between the dose
administered and the instestinal absorption of iron from ferrous sulphate in
humans. In: P. Saltman and J. Hegenauer, editors, The biochemistry and
physiology of iron. Elsevier Science Publishing Co., Inc. p. 821-823.
Wessling-Resnick, M. 2010. Iron homeostasis and the inflammatory response. Annu.
Rev. Nutr. 30:105-122. doi: 10.1146/annurev.nutr.012809.104804.
Williams, H., J. Woodworth, J. M. DeRouchey, S. S. Dritz, M. D. Tokach, R. D.
Goodband, and A. Holtcamp. 2018b. Effects of Fe dosage in newborn pigs on
preweaning and subsequent nursery performance.”Kansas agricultural experiment
station research reports: Vol. 4: Iss. 9.

166
Yip, R., P. Dallman, E. Ziegler, and L. Filer. 1996. Present knowledge in nutrition. Iron,
7th ed.; Ziegler, EE, Filer, LJ, Eds:278-292.
167
VITA
Tyler B. Chevalier
Place of birth: Charleston, West Virginia
Education
M.S., Animal and Food Sciences, University of Kentucky (Expected 2019)
Concentration: Swine Nutrition
Thesis: Improved iron status in weanling pigs leads to improved growth
performance in the subsequent nursery period
Advisor: Merlin D. Lindemann, PhD, PAS
B.S., Animal and Food Science, University of Kentucky 2014-2017
Minor, Biology
Experience:
Graduate Research Assistant, 2018-Present
University of Kentucky Animal Science Department
Swine Nutrition Research
Supervisor: Dr. Merlin Lindemann
Smithfield Foods, Inc. Science and Technology Intern, May 2017-August
2017
Production Research for Hog Production Division
North Carolina
Undergraduate Research Assistant, 2015-2017
University of Kentucky Animal Science Department
Monogastric Nutrition Research
Supervisor: Dr. Sunday Adedokun
Student Farm Assistant, 2015-2017
University of Kentucky Swine Research Unit
Swine Nutrition and Management Research
168
Abstracts/Presentations:
ASAS Midwest Section Meeting 2020
788755- Effects of increasing iron dosage at birth on the hematological
profile and growth performance of piglets during the lactation period. T.B.
Chevalier*, H. J. Monegue, and M. D. Lindemann, University of Kentucky,
Lexington, KY
788771- Effects of increasing iron dosage at birth on hematological profile,
growth performance, and tissue mineral concentrations of nursery pigs. T.B.
Chevalier*, H. J. Monegue, and M. D. Lindemann, University of Kentucky,
Lexington, KY
ASAS-CSAS Annual Meeting 2019
660125- Effects of an additional iron injection administered to piglets
before weaning. T. B. Chevalier*, H. J. Monegue, and M. D. Lindemann,
University of Kentucky, Lexington.
University of Kentucky 9th Annual Poster Symposium
Effects of an additional iron injection administered to piglets before
weaning. T. B. Chevalier*, H. J. Monegue, and M. D. Lindemann, University of
Kentucky, Lexington.
University of Kentucky 8th Annual Poster Symposium
Assessment of the Iron Status of Young Pigs in a Confinement Herd. T. B.
Chevalier*, H. J. Monegue, and M. D. Lindemann, University of Kentucky,
Lexington.
ASAS Midwest Section Meeting 2018
514- Assessment of the Iron Status of Young Pigs in a Confinement Herd.
T. B. Chevalier*, H. J. Monegue, and M. D. Lindemann, University of Kentucky,
Lexington. Journal of Animal Science, Volume 96, Issue suppl_2, 10 April 2018,
Pages 274, https://doi.org/10.1093/jas/sky073.511
Awards:
2nd place MS student poster competition
ASAS-CSAS Annual Meeting 2019
1st place MS student poster competition
University of Kentucky 9th annual poster symposium 2019
Related Documents