Soil Biology & Biochemistry 40 (2008) 1390–1403 Importance of DNA quality in comparative soil microbial community structure analyses Dwipendra Thakuria , Olaf Schmidt, Ma´irtı´nMac Siu´ rta´in, Damien Egan, Fiona M. Doohan UCD School of Biology and Environmental Science, Agriculture and Food Science Centre, University College Dublin, Dublin 4, Ireland Received 19 September 2007; received in revised form 19 December 2007; accepted 22 December 2007 Available online 24 January 2008 Abstract This study assessed how different in-situ lysis soil DNA extraction methods influence the DNA yield, quality and hence the results obtained by bacterial and fungal automated ribosomal intergenic spacer analysis (ARISA). Of the methods tested in three soils, a modified hexadecyltrimethylammonium bromide-dithiotreitol (CTAB-DTT)-based method produced X3 times more DNA of higher quality than the other methods (260/230 nm ratios ¼ 1.64–1.82 and 260/280 nm ratios ¼ 1.82–1.89 and extracts were less inhibitory of PCR). DNA extracted by this method also yielded more reproducible ARISA ribotypes (89119 for bacteria and 4888 for fungi; Po0.05) than DNA extracted by other methods, and consequently produced more reliable estimates of bacterial and fungal diversity in all three test soils. The significant correlations observed between the numbers of reproducible ribotypes and DNA extract 260/230 nm ratios (r ¼ 0.88 and 0.72 for bacteria and fungi, respectively; Po0.001) reaffirmed the strong influence of DNA quality on the reliability of microbial diversity indices determined based on PCR-based DNA fingerprinting technique. Results of discriminant function analysis (DFA) and multivariate analysis of variances (MANOVA) performed on ARISA profiles (number and relative abundance of ribotype) revealed that the variability associated with DNA extraction methods did not exceed the biological variability among soil types; this supports the conclusion that high-quality DNA underpins DNA fingerprinting techniques. r 2008 Published by Elsevier Ltd. Keywords: Automated ribosomal intergenic spacer analysis; Discriminant function analysis; DNA extraction; DNA fingerprinting; DNA quality; DNA yield; CTAB-DTT; Microbial community structure; Simpson diversity (inverse) index; Soil type 1. Introduction Microorganisms are key components of the soil biota (Pace, 1997; Schimel, 2007). Determining the nature of any links between soil biota diversity and function is a key challenge for current research. A better understanding of the relationship between microbial diversity and soil funct- ion requires accurate taxonomic and functional character- ization of microbial DNA and RNA extracted from the soil matrix (Nannipieri et al., 2003). A range of molecular methods are contributing to our understanding of the diversity of both the culturable and unculturable microbes in soil. To date, most molecular methods have been based on the analysis of ribosomal RNA genes (rDNA). These and emerging DNA technologies (e.g. microarray analyses) have great potential to enhance our understanding of microbial populations in soil. Various nucleic acid extraction techniques have been developed or adapted for soil studies (Tsai and Olsen, 1991; More´ et al., 1994; Zhou et al., 1996; Yeates et al., 1998; Frostegard et al., 1999; Miller et al., 1999; Ogram, 2000; Bu¨ rgmann et al.,2001) and sodium dodecyl sulphate (SDS) is the extractant used in most of these techniques. The influence of extraction buffer and methodology on DNA yield, DNA quality and interpretations made from DNA- based microbial community analysis is critical. Previous studies have shown that variations in DNA extraction methods can significantly influence the microbial diversity and community structure information (e.g. ribotype number and abundance) obtained by DNA fingerprinting techniques such as denaturing gradient gel electrophoresis (DGGE), terminal restriction fragment length polymorph- ism (TRFLP), automated ribosomal intergenic spacer ARTICLE IN PRESS www.elsevier.com/locate/soilbio 0038-0717/$ - see front matter r 2008 Published by Elsevier Ltd. doi:10.1016/j.soilbio.2007.12.027 Corresponding author. Tel.: +353 1 7167110; fax: +353 1 7161102. E-mail address: [email protected] (D. Thakuria).

Welcome message from author
This document is posted to help you gain knowledge. Please leave a comment to let me know what you think about it! Share it to your friends and learn new things together.
Transcript

ARTICLE IN PRESS
0038-0717/$ - se
doi:10.1016/j.so
�CorrespondE-mail addr
Soil Biology & Biochemistry 40 (2008) 1390–1403
www.elsevier.com/locate/soilbio
Importance of DNA quality in comparative soil microbialcommunity structure analyses
Dwipendra Thakuria�, Olaf Schmidt, Mairtın Mac Siurtain, Damien Egan, Fiona M. Doohan
UCD School of Biology and Environmental Science, Agriculture and Food Science Centre, University College Dublin, Dublin 4, Ireland
Received 19 September 2007; received in revised form 19 December 2007; accepted 22 December 2007
Available online 24 January 2008
Abstract
This study assessed how different in-situ lysis soil DNA extraction methods influence the DNA yield, quality and hence the results
obtained by bacterial and fungal automated ribosomal intergenic spacer analysis (ARISA). Of the methods tested in three soils, a
modified hexadecyltrimethylammonium bromide-dithiotreitol (CTAB-DTT)-based method produced X3 times more DNA of higher
quality than the other methods (260/230 nm ratios ¼ 1.64–1.82 and 260/280 nm ratios ¼ 1.82–1.89 and extracts were less inhibitory of
PCR). DNA extracted by this method also yielded more reproducible ARISA ribotypes (89�119 for bacteria and 48�88 for fungi;
Po0.05) than DNA extracted by other methods, and consequently produced more reliable estimates of bacterial and fungal diversity in
all three test soils. The significant correlations observed between the numbers of reproducible ribotypes and DNA extract 260/230 nm
ratios (r ¼ 0.88 and 0.72 for bacteria and fungi, respectively; Po0.001) reaffirmed the strong influence of DNA quality on the reliability
of microbial diversity indices determined based on PCR-based DNA fingerprinting technique. Results of discriminant function analysis
(DFA) and multivariate analysis of variances (MANOVA) performed on ARISA profiles (number and relative abundance of ribotype)
revealed that the variability associated with DNA extraction methods did not exceed the biological variability among soil types; this
supports the conclusion that high-quality DNA underpins DNA fingerprinting techniques.
r 2008 Published by Elsevier Ltd.
Keywords: Automated ribosomal intergenic spacer analysis; Discriminant function analysis; DNA extraction; DNA fingerprinting; DNA quality; DNA
yield; CTAB-DTT; Microbial community structure; Simpson diversity (inverse) index; Soil type
1. Introduction
Microorganisms are key components of the soil biota(Pace, 1997; Schimel, 2007). Determining the nature of anylinks between soil biota diversity and function is a keychallenge for current research. A better understanding ofthe relationship between microbial diversity and soil funct-ion requires accurate taxonomic and functional character-ization of microbial DNA and RNA extracted from thesoil matrix (Nannipieri et al., 2003). A range of molecularmethods are contributing to our understanding of thediversity of both the culturable and unculturable microbesin soil. To date, most molecular methods have been basedon the analysis of ribosomal RNA genes (rDNA). Theseand emerging DNA technologies (e.g. microarray analyses)
e front matter r 2008 Published by Elsevier Ltd.
ilbio.2007.12.027
ing author. Tel.: +353 1 7167110; fax: +353 1 7161102.
ess: [email protected] (D. Thakuria).
have great potential to enhance our understanding ofmicrobial populations in soil.Various nucleic acid extraction techniques have been
developed or adapted for soil studies (Tsai and Olsen, 1991;More et al., 1994; Zhou et al., 1996; Yeates et al., 1998;Frostegard et al., 1999; Miller et al., 1999; Ogram, 2000;Burgmann et al., 2001) and sodium dodecyl sulphate (SDS)is the extractant used in most of these techniques. Theinfluence of extraction buffer and methodology on DNAyield, DNA quality and interpretations made from DNA-based microbial community analysis is critical. Previousstudies have shown that variations in DNA extractionmethods can significantly influence the microbial diversityand community structure information (e.g. ribotypenumber and abundance) obtained by DNA fingerprintingtechniques such as denaturing gradient gel electrophoresis(DGGE), terminal restriction fragment length polymorph-ism (TRFLP), automated ribosomal intergenic spacer
ARTICLE IN PRESSD. Thakuria et al. / Soil Biology & Biochemistry 40 (2008) 1390–1403 1391
analysis (ARISA) (de Lipthay et al., 2004; Martin-Laurentet al., 2001; Ranjard et al., 2001; Luna et al., 2006; Carrigget al., 2007). These studies all used SDS-based DNAextraction buffers. But, to our knowledge, no study hascompared SDS with other extractants (e.g. hexadecyltri-methylammonium bromide-dithiotreitol (CTAB-DTT)) interms of influence on soil DNA yield, quality andinterpretations made from DNA-based microbial commu-nity analysis.
The efficacy of DNA extraction method varies with soiltype (Zhou et al., 1996). Using a single DNA extractionmethod, Ranjard et al. (2001) demonstrated that variabilityin ARISA profiles obtained for replicate DNA samplesextracted from different sites was never high enough tomask biological variability within or between differentsites/soil types. Martin-Laurent et al. (2001) demonstratedthat, for a sandy soil, the biases associated with DNAextraction methods can distort the interpretation ofmicrobial community composition, richness and structure.So, for cross-site and cross-study comparisons, the ques-tion remains as to how much of inter-site biologicalvariability is accounted for by differences in DNAextraction efficacy from different soils. One method maynot efficiently extract DNA from different soil types. Onthe other hand, while different methods may be moresuitable for different soil types, inherent biases in theirefficacies may mask some of the inter-site biologicalvariability.
The objective of this study was to investigate how DNAextraction method-dependent bias influences DNA yieldand quality obtained from different soil types and how itimpacts on the inter-site/soil type biological variabilityinterpreted from ARISA analysis. DNA extraction meth-ods used were based on SDS or CTAB-DTT extractantsand three soil types were studied, i.e. a sandy pasture soil, asilty clay loam grass ley soil and a sandy loam soil underintensive tillage. DNA quantity and quality was assessedby spectrophotometry, gel electrophoresis and using a PCRinhibition assay. The influence of DNA extraction andpurification steps on the reproducibility of ARISA results(ribotype number and abundance) was determined.
Table 1
Origin, management history and physico-chemical propertiesa of the soils
Characteristic Johnstown soil L
Origin Johnstown Castle Estate, Wexford, Co.
Wexford
U
L
Location (latitude, longitude) 521170N, 061300W 5
Management history Pasture land G
Texture Fine loamy S
% sand 48.0 2
% silt 34.0 4
% clay 18.0 3
pH in H2O 6.4
Organic carbon (mg g�1) 21.0 3
aSources: Johnstown soil: Culleton and Diamond (in press), Lyons soil: La
Discriminant function analysis (DFA) of ARISA ribotypedata evaluated the impact of DNA extraction methodologyon interpretations regarding inter-site/soil type biologicalvariability.
2. Materials and methods
2.1. Soil sampling and preservation
Soil samples were collected from three Irish field sites inNovember 2005 (Table 1). Field sites included a pasture(Johnstown soil), a grazed grass ley (Lyons soil) and a fieldsubjected to intensive tillage (Oakpark soil); the physico-chemical properties of these soils were previously described(Lalor, 2004; Hooker, 2005; Culleton and Diamond, inpress). Five soil cores were sampled randomly from each ofthe three soil types. Each core (15� 15� 15 cm3) wasimmediately placed on ice, transferred to the laboratoryand sieved through a 1-mm mesh. Then, 50 g soil of eachcore was oven-dried in order to estimate the dry weight(dry wt.) and the remainder was stored at �20 1C prior toDNA extraction.
2.2. DNA extraction
The methods used to extract DNA from soil includedfour previously described bead-beating lysis methods andmodified versions of two such methods (for any givenmethod, DNA was extracted from five core samples(250mg each) per soil type). The four bead-beating lysismethods used were the CTAB-DTT-based method de-scribed by Burgmann et al. (2001), two SDS-based methodsdescribed by Yeates et al. (1998) and Egert et al. (2004),and the UltraCleanTM Soil DNA Isolation Kit (MoBio,Solana Beach, CA, USA). The CTAB-DTT-based extrac-tion buffer was composed of 0.2% CTAB, 1mM DTT,0.2M sodium phosphate buffer (pH 8.0), 0.1M NaCl and50mM EDTA (Cheung et al., 1994). The SDS-basedextraction buffers were composed of (a) 100mM Tris–HCl(pH 8.0), 100mM sodium EDTA (pH 8.0), 1.5M NaCl,2% SDS (Yeates et al., 1998) and, (b) 120mM sodium
yons soil Oakpark soil
niversity College Research Farm,
yons Estate, Celbridge, Co. Kildare
Teagasc, Oakpark Crops
Research Centre, Carlow
31180
N, 061330W 521510N, 061540W
rass ley (3 years) with grazing Intensive tillage for over
20 years
ilty clay loam Sandy loam
6.3 67.0
0.9 22.0
2.8 11.0
7.6 6.9
4.0 24.4
lor (2004), Oakpark soil: Hooker (2005).

ARTICLE IN PRESSD. Thakuria et al. / Soil Biology & Biochemistry 40 (2008) 1390–14031392
phosphate buffer (pH 8.0), SDS lysis mixture (10% SDS,0.5M Tris–HCl, pH 8.0), 0.1M NaCl (Egert et al., 2004).Bead-beating was carried out using silica beads (a 1:2 ratioof 1.0 and 0.1-mm-diameter silica beads, Biospec Products,USA). Beads (375mg), soil sample (250mg) and extractionbuffer (625 ml) were mixed and beaten for 45 s at a speed of5.0m s�1 (except when using the commercial kit where themanufacturer’s recommendations were followed). Thesebead-beating conditions were previously reported to yieldthe highest quantities of DNA with maximum fragmentsize distribution (MFSD) greater than 10 kb while extract-ing total microbial DNA from soils (Burgmann et al.,2001).
Modified versions of both the CTAB-DTT methoddescribed by Burgmann et al. (2001) and the SDS methoddescribed by Yeates et al. (1998), i.e. versions thatincorporated additional purification steps, were also usedto extract DNA from soil (hereafter referred to as modifiedBurgmann and modified Yeates). In the modified methods,the crude DNA aliquots resulting from the bead-beatingstep were passed through a polyvinylpolypyrrolidone(PVPP) spin column (Berthelet et al., 1996) and to theresulting supernatant (450 ml) a volume of 50 ml of 5Mpotassium acetate (final concentration 0.5M) was added.This solution was incubated on ice for 5min andcentrifuged (16,000� g for 30min, 4 1C). The pellet wasdiscarded and the DNA within the resulting supernatantwas precipitated by addition of an equal volume of 20%(w/v) polyethylene glycol 6000 in 2.5M NaCl andincubation at 37 1C for 1 h (Rowland and Nguyen, 1993).DNA was pelleted by centrifugation (16,000� g for 30minat room temperature). The resulting pellet was dissolved in400 ml TE buffer (50mM Tris–HCl and 10mM EDTA, pH8.0). This solution was then subjected to a phenol:chlor-oform:isoamyl alcohol (25:24:1, pH 6.8) followed by twochloroform:isoamyl alcohol (24:1) extraction steps. Then,the DNA was ethanol-precipitated, washed with 70%ethanol and finally dissolved in 50 ml TE buffer (10mMTris–HCl, 1mM EDTA, pH 8.0) and stored at �20 1C(as described by Sambrook et al., 1989).
2.3. Spectrophotometry
The absorption spectrum of DNA extracts (230–280 nm)was determined using a Nano-drops ND-1000 spectro-photometer (Labtech International, UK) according to themanufacturer’s instructions. DNA was quantified based onthe absorption at 260 nm and expressed as mg g�1 dry wt.A decrease in absorption ratios at 260/230 and 260/280 nmwas used as indicator of humic acid, polysaccharides andprotein impurities (Krsek and Wellington, 1999; Stachet al., 2001; Zipper et al., 2003).
2.4. Agarose gel electrophoresis
DNA was visualized by electrophoresis of 4-ml aliquotsof extracts through 1% (w/v) agarose gels containing
0.5 mgml�1 ethidium bromide. Gels were visualized andimages captured using Image Masters VDS and LISCAPsoftware (Pharmacia Biotech, USA). The intensity offluorescence of genomic DNA bands was determined usingImageMasters 1D Elite v.4.10 software (AmarshamPharmacia Biotech, Sweden). EcoRI/HindIII-cut bacter-iophage lambda DNA molecular size marker (250 ng)(Invitrogen, UK) was included on gels as a standard andthe amount of DNA in samples was determined bycomparing the fluorescence of genomic DNA bands tothat of lambda DNA and was expressed as mg g�1 dry wt.of soil (Zhou et al., 1996).
2.5. PCR inhibition assay
This assay determined whether PCR inhibitors werepresent in DNA extracts. PCR reactions contained 1 ml soilDNA extract (concentration 20 ng DNA), 50 ng of wheatgenomic DNA, 200 nM each of forward and reverseprimers specific to the wheat glyceraldehyde-3-phosphatedehydrogenase (GAPDH) gene (GAPDH_P1/GAPDH_M1)(Monnet et al., 2001), 1U Taq DNA polymerase, 1� PCRbuffer, 2.5mM MgCl2, 200 mM dNTPs (all reagents fromInvitrogen, UK) in a total volume of 25 ml. Controlreactions contained either only wheat DNA (positivecontrols) or soil but not wheat DNA (negative controls).Reaction conditions were as described by Monnet et al.(2001). Products were electrophoresed through 1.5% (w/v)agarose gels and bands were visualized and quantified, asdescribed earlier. The reduction in PCR product amplifica-tion in samples containing both wheat and soil DNA,relative to the amount of product generated in reactionsthat only contained wheat DNA, was used as a measure ofthe degree of PCR inhibition by components of the soilDNA extracts. Results are based on three replicatereactions per DNA sample.
2.6. Automated ribosomal intergenic spacer analysis
(ARISA)
Bacterial DNA was amplified from DNA extracts usingprimers that amplify the intergenic spacer region betweenthe small- and large-subunit rRNA genes (ITSF/ITSReub;Cardinale et al., 2004). Fungal DNA was amplified fromDNA extracts using primers specific to the internaltranscribed spacer ITS1-5.8S-ITS2 region (2234C/3126T;Sequerra et al., 1997; Anderson and Cairney, 2004). The 50
end of the ITSF and 2234C primers were labelled withphosphoramidite dye 6-FAM (6-carboxyfluorescein) andVIC fluorescent dye (Applied Biosystems, UK), respec-tively. Bacterial and fungal DNA amplification reactions(50 ml) contained 20 ng of soil DNA, 1U Taq DNApolymerase, 1� PCR buffer, 2.5mM MgCl2, 200 mMdNTPs (all reagents from Invitrogen, UK), 250 nM each ofthe relevant forward and reverse primers (Applied Biosys-tems, UK). To this reaction mixture, 100 ng ml�1 bovineserum albumin (New England Biolabs Inc., UK) was

ARTICLE IN PRESSD. Thakuria et al. / Soil Biology & Biochemistry 40 (2008) 1390–1403 1393
added (Cho et al., 1996). DNA was omitted from negativecontrol reactions. All amplifications were performed atleast twice for each DNA extract using a PTC-220 Peltierthermal cycler (M.J. Research, USA). PCR reactionconditions consisted of an initial denaturation step(94 1C, 3min) followed by 30 cycles of 94 1C for 45 s,62.5 1C (B-ARISA) or 60 1C (F-ARISA) for 45 s and 72 1Cfor 1min, followed by a terminal extension step at 72 1Cfor 7min.
PCR products were diluted (1:5 with PCR grade water;Gibco, UK) and 1 ml of the diluted DNA was mixed with0.2 ml of ROX 2500 internal size standard (AppliedBiosystems, UK) and 10 ml HiDi Formamide (AppliedBiosystems, UK). This mix was denatured at 94 1C for3min and immediately placed on ice for 2min. Sampleswere then analysed on an ABI 3130xl Genetic Analyzer(Applied Biosystems, USA) equipped with 16 channelscapillary tube (36 cm long) filled with POP7 polymer(Applied Biosystems, UK). The running conditionswere as follows: 60 1C oven temperature, 30 s injectiontime, 1.2 kV injection voltage and 12.2 kV run voltageand a 4000 s run duration for each batch of sixteensamples.
Peak size (bp), height and area were estimated bycomparison with the internal size standard ROX 2500fragments using the GeneMapper Software 4.0 (AppliedBiosystems, USA). The analysis range for peak detectionwas between 200 and 1740 bp leading to the maximumtheoretical number of ribotypes of 1026 (1740–200 bp/mini-mum distance between two consecutive peaks (1.5 bp)).Peaks that were less than 0.5 bp apart from larger peaks(i.e. shoulder peaks) were eliminated. Output files wereanalysed with RiboSort v.1.1 under the Comprehensive RArchive Network (CRAN) v.2.5.1. (http://cran.r-projec-t.org/src/contrib/Descriptions/RiboSort.html). Ribosortconverted absolute peak areas into proportional values(individual relative to total peak area within a given profile)and was used to determine the number of peaks that werereproduced for all DNA replicates of a soil type extractedby the same method (Scallan et al., 2008). Proportionalvalues were transferred to Excel worksheets 4.0 (MicrosoftOffice Excel 2003) where the cut-off value for thediscrimination of each peak from baseline noise wasset at 1/the maximum theoretical number of ribotypes(1026) ¼ 0.1%, according to the approach suggested byLuna et al. (2006). Hence, peaks that contributed X0.1%of the total fluorescence within an ARISA profile wereconsidered as ribotypes.
Ecological indices were computed using EstimateS v8.0software (Colwell, 2006); each ribotype was treated assingle species and relative peak area served as a measure ofthe relative abundance of each species (Fisher and Triplett,1999). Simpson’s diversity (inverse) index was determined(1=D ¼ 1=
Pp2
i , where pi is the ratio between the intensityof fluorescence of each ith peak and the total intensity offluorescence and D is the dominance Simpson index;Magurran, 2004).
2.7. Statistical analysis
All statistical analyses were performed using SPSS v.12.0(SPSS Inc., Chicago, IL, USA). Each parameter (DNAyield, absorbance ratio, percentage PCR inhibition andSimpson’s diversity (1/D) index) recorded for differentDNA extraction methods within a soil was normallydistributed as determined using the Kolmogorov–Smirnovtest. The different DNA extraction methods within a testsoil were analysed for differences among means (Po0.05),in terms of each of the above parameters, by performingone-way analysis of variances (ANOVA) (incorporatingthe Levene statistic to test for the equality of groupvariances, and the least significance difference (LSD)or Tukey’s honestly significant difference (HSD) testat Po0.05).DFA is an eigen analysis technique that separates a fixed
number of pre-defined groups where independent variablesare used as predictors of group membership. DFA has beenused in ecology for many purposes such as summarizingdifferences between groups, multivariate testing of groupdifferences for significance, determination of dimension-ality of group differences and checking misclassified items(McCune and Grace, 2002). Recently, DFA was success-fully used in classifying microbial communities based onhabitat type (Tiunov and Scheu, 2000; Egert et al., 2004).DFA was performed on relative abundances of bacterialand fungal ribotypes (considered as independent variables)to identify differences among ARISA profiles asso-ciated with either DNA extraction method or soil type(predefined groups). DNA extraction methods that yieldedno ARISA products (the commercial soil DNA isolationkit) or that was determined to be an outlier (Yeates et al.,1998) were not included in DFAs; outliers were determinedby comparison of the calculated value of Mahalanobisdistance for each ARISA profile against a critical chi-squared value at Po0.001 (Tabachnick and Fidell, 1989).Mahalanobis distance is most commonly used as a multi-variate outlier statistic, which takes into account thecovariance among the variables in calculating distancesbetween group centroids. DFA generated significantdiscriminant axes (generated by Wilks’ lambda tests;number of discriminant axes ¼ number of priori group-s�1) and the results of DFAs were graphically presentedon the first two discriminatory axes, based on thediscriminant scores measured from the standardizedcanonical discriminant axes coefficients of the significantribotypes. Mahalanobis distances between group (soil orDNA extraction method) centroid values were calculatedfrom the mean scores of each of the discriminant axes forpriori groups (three and two axes for DNA extractionmethod and soil type, respectively). The cross-validation ofgroup classification accuracy rate was determined based onby chance accuracy rate. The proportional by chanceaccuracy rate was computed by squaring and summing theproportion of cases in each group from the table of priorprobabilities for groups. Operationally, the cross-validated

ARTICLE IN PRESSD. Thakuria et al. / Soil Biology & Biochemistry 40 (2008) 1390–14031394
classification accuracy rate should be X25% higher thanthe proportional by chance accuracy rate. All priori groupsconsidered for DFA were correctly classified and passedthe test for cross-validation of classification. High cross-validated classification accuracy rate indicates morereliability in classifying groups.
Multivariate analysis of variance (MANOVA) wasperformed using the scores of discriminant axes withineach DFA. The estimated marginal means generated fromMANOVA analysis (incorporating Bonferroni adjustment;Po0.05) were used to make pairwise comparisons formean differences between either DNA extraction methodsor soils.
3. Results
3.1. A modified CTAB-DTT-based extraction method
yielded high quantity and quality of DNA from soil
The two CTAB-DTT-based and four SDS-based DNAextraction methods all yielded DNA from the three soilstested. The results obtained by spectrophotometric and gelelectrophoretic analysis of DNA were significantly corre-lated (r ¼ 0.84, n ¼ 54, Po0.001) and therefore only theresults obtained by the latter analysis are shown (Table 2).The CTAB-DTT-based method described by Burgmannet al. (2001) and the modified Burgmann method yieldedX3 times more DNA from the two of the three soils (i.e.the Johnstown and Lyons soils; 243.8–284.6 mg g�1 dry wt.of soil) than the other methods tested (Po0.05). In the caseof Oakpark soil, all methods (except the commercial soilDNA isolation kit) yielded comparable and relatively lowamounts of DNA (37.4–40.2 mg g�1 dry wt. of soil). Thecommercial soil DNA isolation kit yielded X5.5 times lessDNA from all three soils than any of the other methodstested.
The quality of the soil DNA extracts, as determinedby spectrophotometry (260/230 and 260/280 nm ratios),indicated that the modified Burgmann and the modified
Table 2
Effect of DNA extraction method used on the yield and quality of DNA obta
DNA extraction
protocol
Johnstown soil Lyons soi
DNA yield
(mg g�1 drywt.)
Absorbance ratio DNA yiel
(mg g�1 drwt.)260/280nm 260/230nm
Burgmann et al. (2001) 284.679.5 1.8470.01 1.6670.01 278.874.6
Modified Burgmann 243.8712.8 1.8270.04 1.8370.04 269.578.2
Yeates et al. (1998) 81.474.4 1.8170.02 1.6170.01 85.172.1
Modified Yeates 80.572.9 1.8570.04 1.7870.03 73.772.7
Egert et al. (2004) 61.273.8 1.7070.01 1.4870.02 63.471.9
Soil DNA isolation kit 11.170.3 1.5870.02 0.9670.01 5.070.2
LSD (Po0.05)b 28.00 0.06 0.05 16.60
aValues presented are the means7S.E.M. (n ¼ 5).bAs determined by one-way ANOVA performed in each soil separately.
Yeates methods yielded higher quality DNA from allthree soils than the other methods (Table 2). DNAextracts obtained by the two modified methods yielded260/230 nm ratios of 1.55–1.83 and 260/280 nm ratiosof 1.82–1.91. Pure DNA solution exhibits absorbanceratios of 260/230 and 260/280 nm more than 1.80(Sambrook et al., 1989). The 260/230 nm ratios obtainedby the modified Burgmann and the modified Yeateswere significantly better than those obtained for soilDNA extracted by the other methods (Po0.05; Table 2).Agarose gel electrophoresis results confirmed that all thetest DNA extraction methods yielded high molecularweight DNA (46.5 to 23.1 kb) from soils (Fig. 1). Mostmethods also yielded sheared DNA; electrophoretic resultssuggested that the Egert et al. (2004) method yielded thehighest amount of sheared relative to high molecularweight DNA.Results of the PCR inhibition assay (in which reactions
contained both soil DNA and wheat genomic DNA and awheat GAPDH gene fragment was amplified) indicatedthat all soil DNA extracts obtained by Burgmann et al.(2001) and the modified Burgmann methods were lessinhibitory of the amplification process than extractsobtained using other methods (Po0.05; Fig. 2). Further-more, the modified Burgmann method yielded DNA thatwas less inhibitory of PCR than the DNA obtained by theBurgmann et al. (2001) method (Po0.05; Fig. 2). For theLyons and Oakpark soils, all DNA extracts obtained bymethods other than Burgmann et al. (2001) or the modifiedBurgmann methods completely inhibited the PCR reaction.This result clearly indicated that contamination of soilDNA extract with PCR inhibitory substances is highlydependent on soil types, irrespective of DNA extractionmethods used.Therefore, in terms of both yield and quality, results
from spectrophotometry, gel electrophoresis and PCRinhibition assay analyses suggested that the modifiedBurgmann DNA extraction method performed best forthe three soils tested.
ined from soilsa
l Oakpark soil
d
y
Absorbance ratio DNA yield
(mg g�1 drywt.)
Absorbance ratio
260/280nm 260/230nm 260/280nm 260/230 nm
1.8670.02 1.2470.03 40.271.7 1.9170.03 1.4770.02
1.8970.02 1.7470.02 37.471.2 1.8670.04 1.6470.03
1.8270.03 1.1070.01 46.173.5 1.7970.02 1.2470.01
1.8270.01 1.5570.02 40.972.1 1.9170.04 1.6470.03
1.7670.04 1.3170.03 37.773.9 1.7770.03 1.4070.01
1.6970.04 0.6470.01 6.870.4 1.5470.04 0.9570.05
0.06 0.03 9.70 0.06 0.06
ARTICLE IN PRESS
23.16.5
kb
2.3
M 5
Johnstown soil Lyons soil
1 2 3 4 5 6 1 2 3 4 6 1 2 3 4 5 6
Oakpark soil
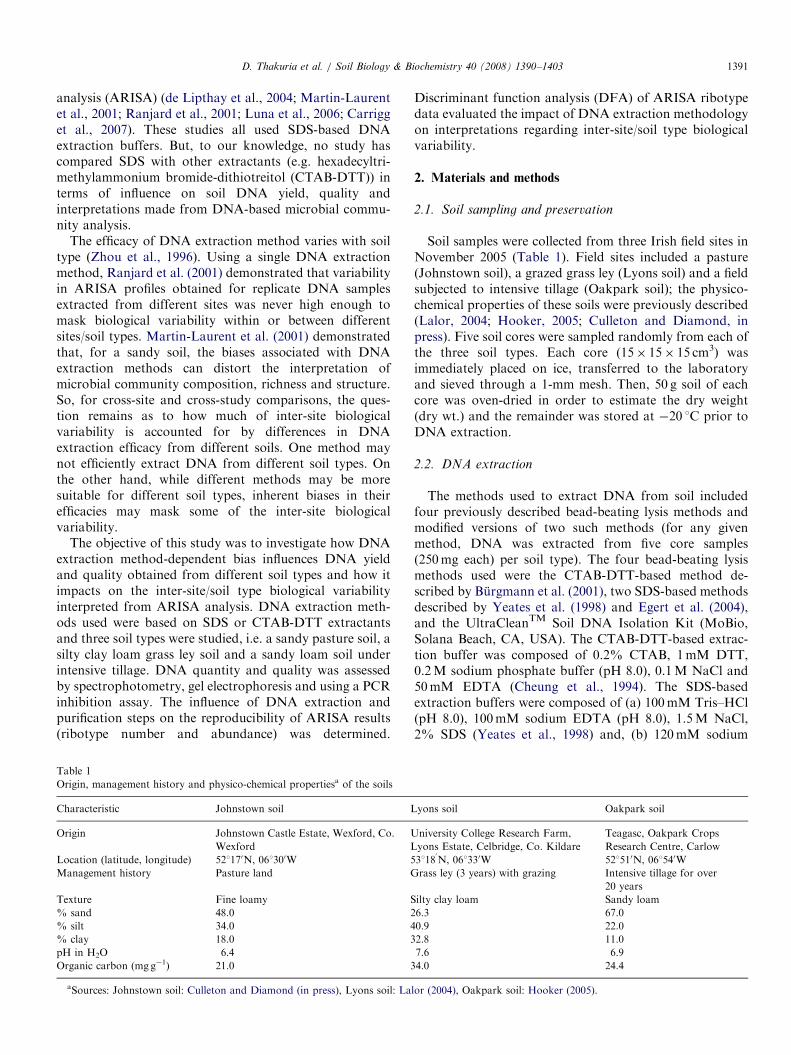
Fig. 1. Comparison of microbial genomic DNA yields and molecular weight ranges in 1% agarose gel, those obtained by using different DNA extraction
methods from three soils. Lane M, 245.6 ng of EcoRI/HindIII-cut bacteriophage lambda DNA molecular size marker; lane 1, Burgmann et al. (2001)
method; lane 2, modified Burgmann method; lane 3, Yeates et al. (1998) method; lane 4, modified Yeates method; lane 5, Egert et al. (2004) method and
lane 6, UltraCleanTM soil DNA kit. Four microlitres DNA extract per well.
bb
ba
a
a
dc
d
dc
c
c
c
e
dcf
0
20
40
60
80
100
Johnstown soil Lyons soil
Bürgmann et al. (2001) Modified Bürgmann
Yeates et al. (1998) Modified Yeates
Egert et al. (2004) UltraClean soil DNA isolation kit
Rel
ativ
e PC
R in
hibi
tion
(%)
Oakpark soil
Fig. 2. Influence of soil DNA extracts on efficacy of PCR amplification of the wheat glyceraldehyde phosphate dehydrogenase (GAPDH) gene from wheat
genomic DNA extracts. PCR amplification reactions included soil DNA extract plus wheat genomic DNA. The level of inhibition of GAPDH
amplification in test relative to positive control samples (that contained only wheat DNA) was determined (%). Within the same soil, values (columns)
with different letters were significantly different (�Po0.05). Results are based on three replicate reactions per DNA sample and three DNA samples for
each method.
D. Thakuria et al. / Soil Biology & Biochemistry 40 (2008) 1390–1403 1395
3.2. Soil DNA extracted by the modified CTAB-DTT-based
extraction method performed best in both B-ARISA and
F-ARISA
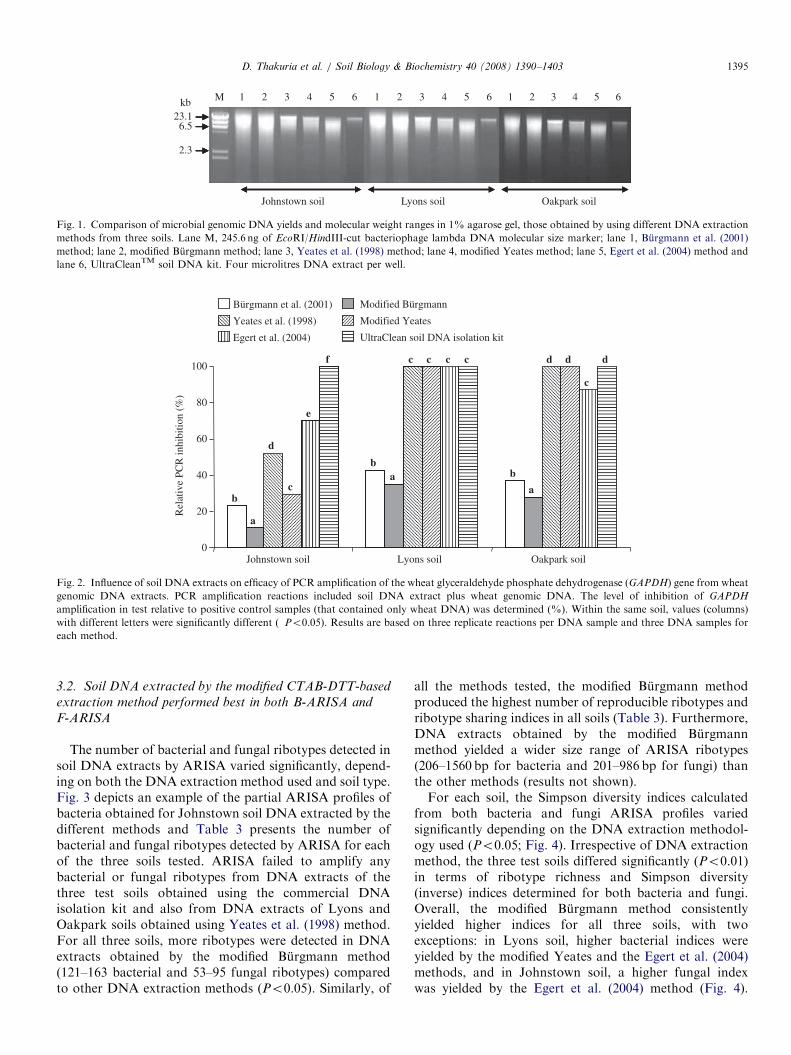
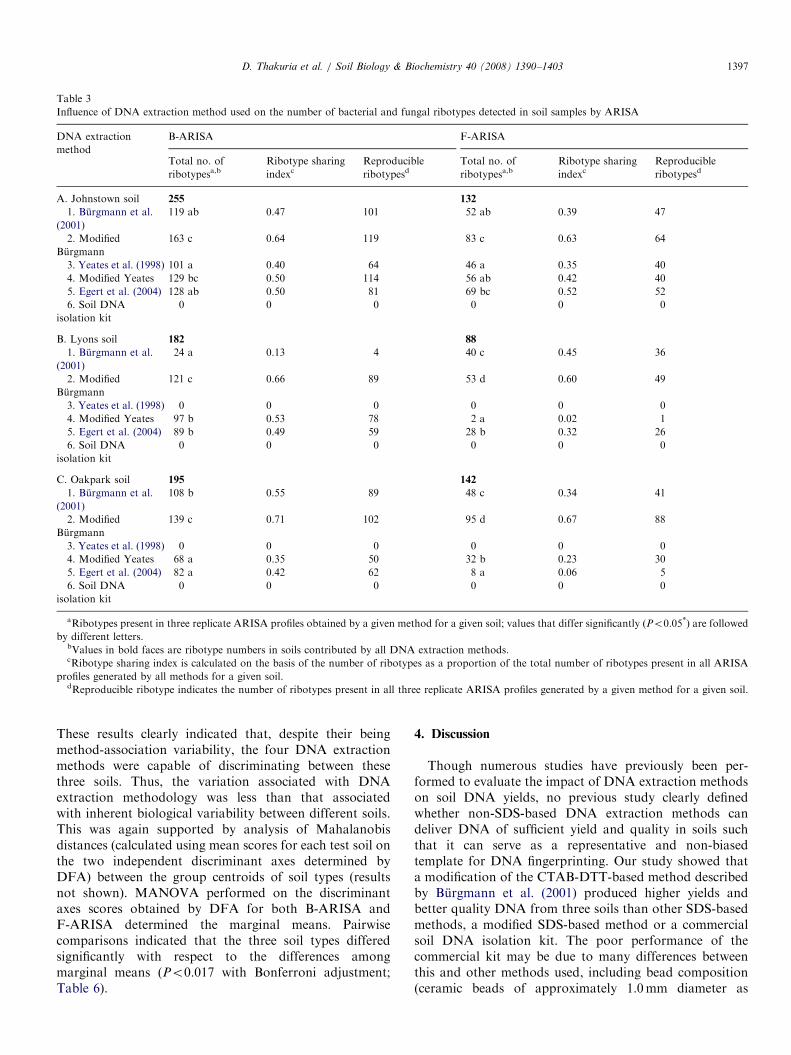
The number of bacterial and fungal ribotypes detected insoil DNA extracts by ARISA varied significantly, depend-ing on both the DNA extraction method used and soil type.Fig. 3 depicts an example of the partial ARISA profiles ofbacteria obtained for Johnstown soil DNA extracted by thedifferent methods and Table 3 presents the number ofbacterial and fungal ribotypes detected by ARISA for eachof the three soils tested. ARISA failed to amplify anybacterial or fungal ribotypes from DNA extracts of thethree test soils obtained using the commercial DNAisolation kit and also from DNA extracts of Lyons andOakpark soils obtained using Yeates et al. (1998) method.For all three soils, more ribotypes were detected in DNAextracts obtained by the modified Burgmann method(121–163 bacterial and 53–95 fungal ribotypes) comparedto other DNA extraction methods (Po0.05). Similarly, of
all the methods tested, the modified Burgmann methodproduced the highest number of reproducible ribotypes andribotype sharing indices in all soils (Table 3). Furthermore,DNA extracts obtained by the modified Burgmannmethod yielded a wider size range of ARISA ribotypes(206–1560 bp for bacteria and 201–986 bp for fungi) thanthe other methods (results not shown).For each soil, the Simpson diversity indices calculated
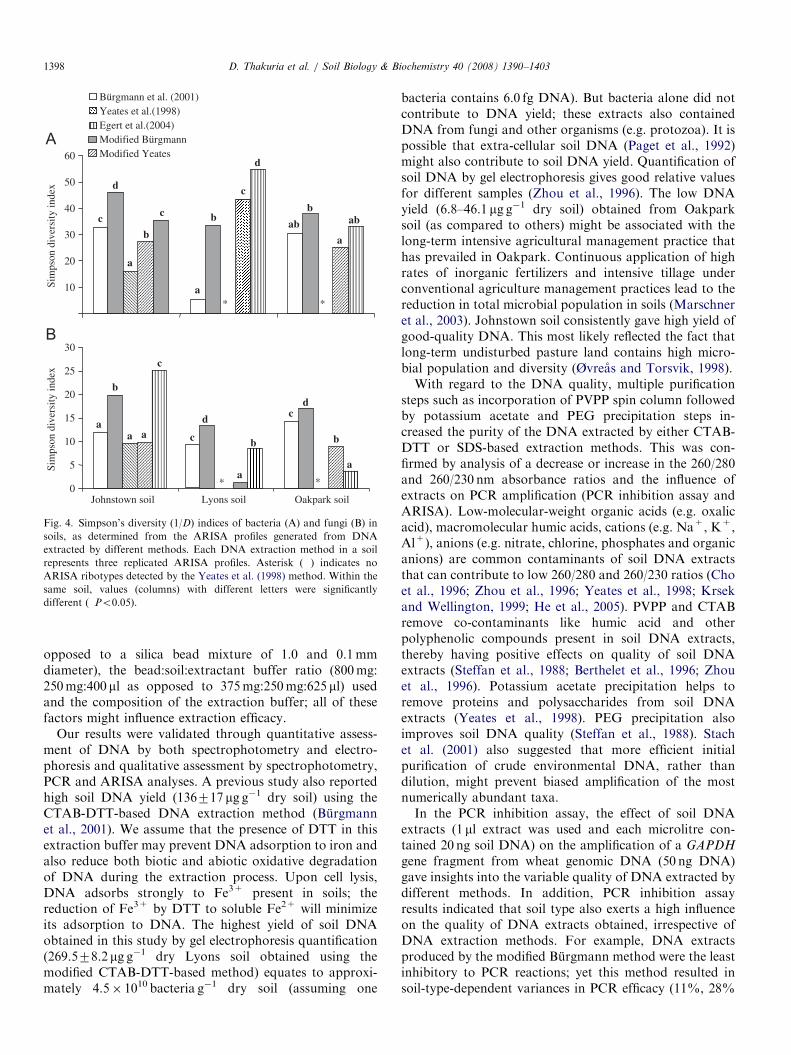
from both bacteria and fungi ARISA profiles variedsignificantly depending on the DNA extraction methodol-ogy used (Po0.05; Fig. 4). Irrespective of DNA extractionmethod, the three test soils differed significantly (Po0.01)in terms of ribotype richness and Simpson diversity(inverse) indices determined for both bacteria and fungi.Overall, the modified Burgmann method consistentlyyielded higher indices for all three soils, with twoexceptions: in Lyons soil, higher bacterial indices wereyielded by the modified Yeates and the Egert et al. (2004)methods, and in Johnstown soil, a higher fungal indexwas yielded by the Egert et al. (2004) method (Fig. 4).
ARTICLE IN PRESS
600
0600
0
600
600
0
0600
0
Flu
ore
scence U
nit
230 530 1429 1600
bp
Bürgmann et al. (2001)
Modified Bürgmann
Yeates et al. (2001)
Modified yeates
Egert et al. (2004)
UltraCleanTM Soil DNA Isolation Kit
0
Fig. 3. Exemplary bacterial Automated ribosomal intergenic spacer analysis (ARISA) profiles (partial view) obtained for Johnstown soil DNA extracted
by six different DNA extraction methods. ARISA was conducted using the IGS bacterial primers sets (6-FAM-labelled ITSF/ITSReub; Cardinale et al.,
2004) and products were analysed by capillary electrophoresis with fluorescent laser detection.
D. Thakuria et al. / Soil Biology & Biochemistry 40 (2008) 1390–14031396
DNA obtained by all extraction methods except thecommercial DNA isolation kit yielded 30–40% moreARISA bacterial and fungal ribotypes from the Johnstownas compared to the Lyons or Oakpark soils (Table 3).
3.3. Variability associated with B-ARISA and F-ARISA
profiles due to DNA extraction method and soil type
Only the B-ARISA and F-ARISA results obtained forDNA extracted by four methods (i.e. Burgmann et al.(2001), modified Burgmann, modified Yeates and Egertet al. (2004)) were included in DFA. Results obtained forDNA samples extracted by either the commercial soilDNA isolation kit or the Yeates et al. (1998) methodwere omitted because the former yielded no ARISAbands/ribotypes and the latter values obtained for Lyonsand Oakpark soils were outliers; outliers were determinedby comparison of the calculated value of Mahalanobisdistance for each ARISA profile against a critical value(w2ð15Þ ¼ 37:70, Po0.001).
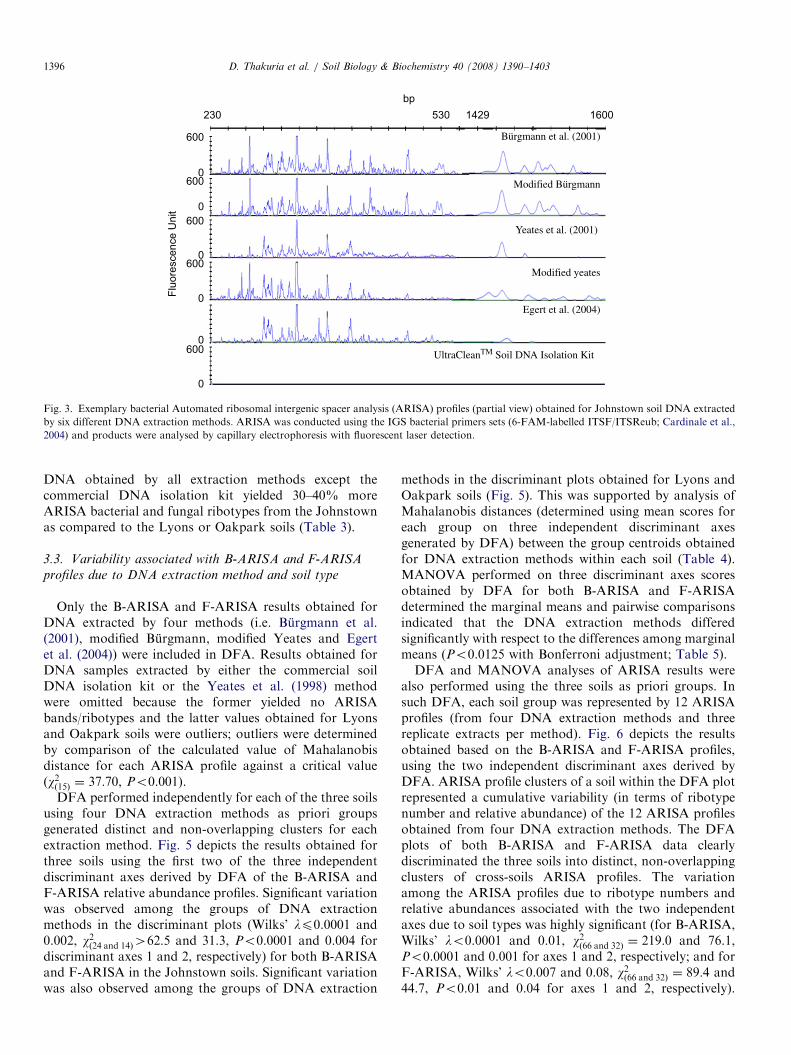
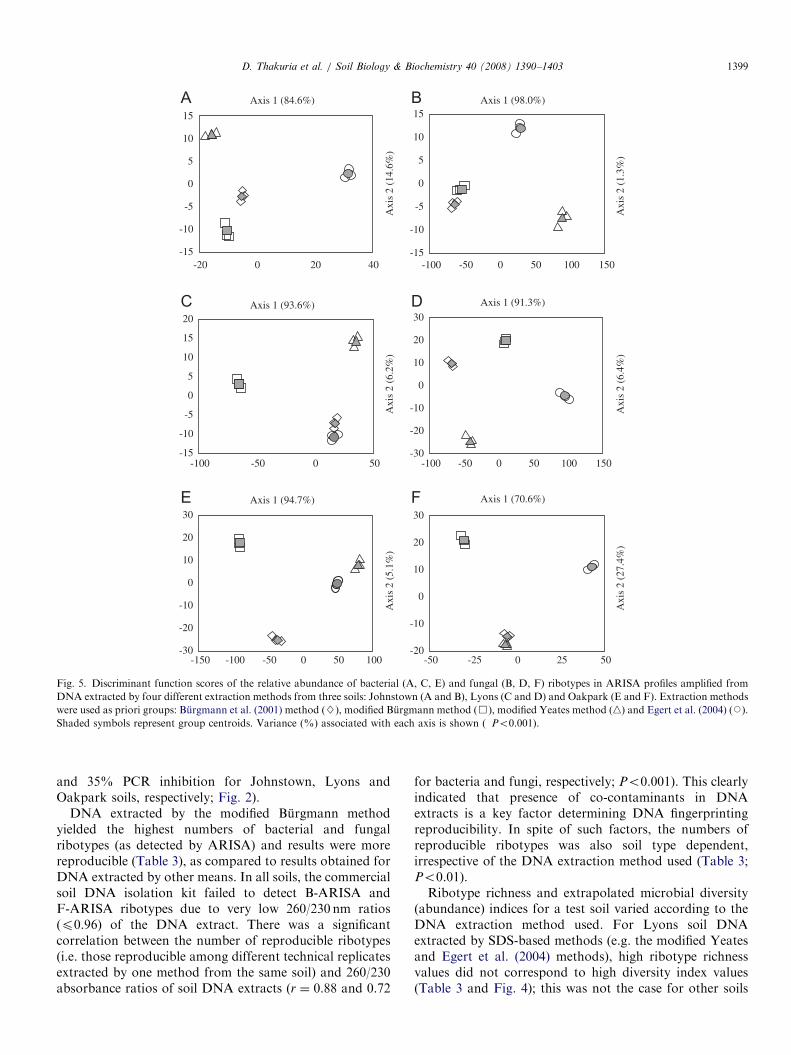
DFA performed independently for each of the three soilsusing four DNA extraction methods as priori groupsgenerated distinct and non-overlapping clusters for eachextraction method. Fig. 5 depicts the results obtained forthree soils using the first two of the three independentdiscriminant axes derived by DFA of the B-ARISA andF-ARISA relative abundance profiles. Significant variationwas observed among the groups of DNA extractionmethods in the discriminant plots (Wilks’ lp0.0001 and0.002, w2ð24 and 14Þ462:5 and 31.3, Po0.0001 and 0.004 fordiscriminant axes 1 and 2, respectively) for both B-ARISAand F-ARISA in the Johnstown soils. Significant variationwas also observed among the groups of DNA extraction
methods in the discriminant plots obtained for Lyons andOakpark soils (Fig. 5). This was supported by analysis ofMahalanobis distances (determined using mean scores foreach group on three independent discriminant axesgenerated by DFA) between the group centroids obtainedfor DNA extraction methods within each soil (Table 4).MANOVA performed on three discriminant axes scoresobtained by DFA for both B-ARISA and F-ARISAdetermined the marginal means and pairwise comparisonsindicated that the DNA extraction methods differedsignificantly with respect to the differences among marginalmeans (Po0.0125 with Bonferroni adjustment; Table 5).DFA and MANOVA analyses of ARISA results were
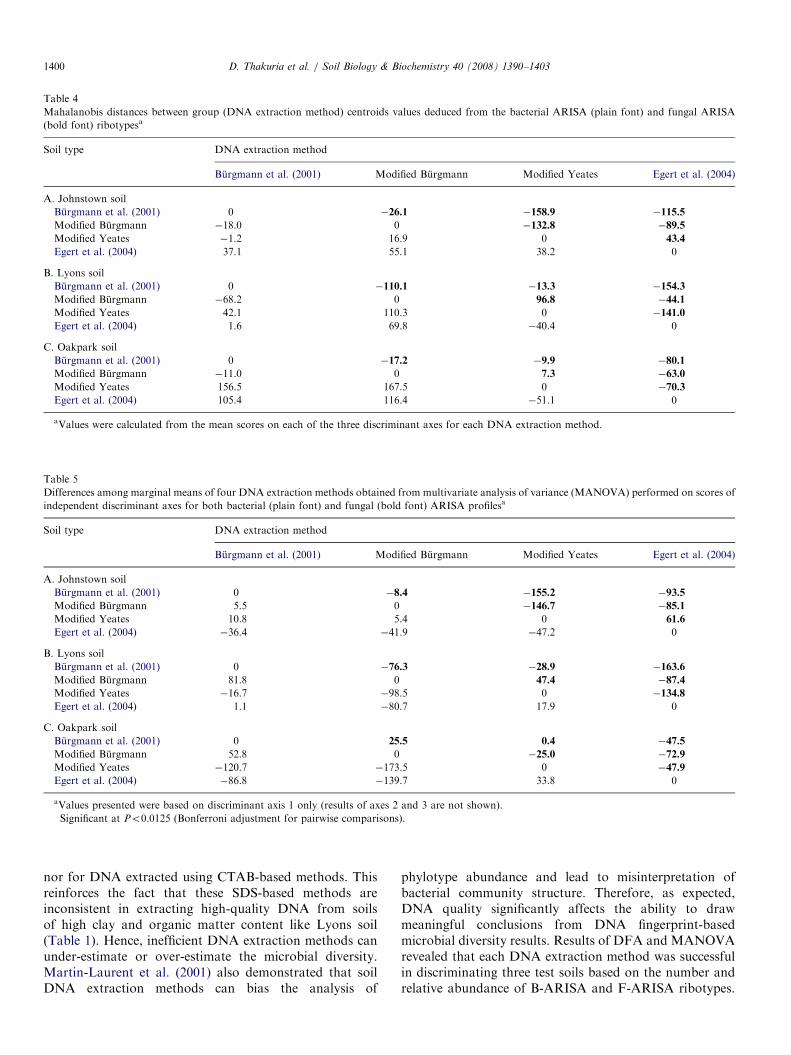
also performed using the three soils as priori groups. Insuch DFA, each soil group was represented by 12 ARISAprofiles (from four DNA extraction methods and threereplicate extracts per method). Fig. 6 depicts the resultsobtained based on the B-ARISA and F-ARISA profiles,using the two independent discriminant axes derived byDFA. ARISA profile clusters of a soil within the DFA plotrepresented a cumulative variability (in terms of ribotypenumber and relative abundance) of the 12 ARISA profilesobtained from four DNA extraction methods. The DFAplots of both B-ARISA and F-ARISA data clearlydiscriminated the three soils into distinct, non-overlappingclusters of cross-soils ARISA profiles. The variationamong the ARISA profiles due to ribotype numbers andrelative abundances associated with the two independentaxes due to soil types was highly significant (for B-ARISA,Wilks’ lo0.0001 and 0.01, w2ð66 and 32Þ ¼ 219:0 and 76.1,Po0.0001 and 0.001 for axes 1 and 2, respectively; and forF-ARISA, Wilks’ lo0.007 and 0.08, w2ð66 and 32Þ ¼ 89:4 and44.7, Po0.01 and 0.04 for axes 1 and 2, respectively).
ARTICLE IN PRESS
Table 3
Influence of DNA extraction method used on the number of bacterial and fungal ribotypes detected in soil samples by ARISA
DNA extraction
method
B-ARISA F-ARISA
Total no. of
ribotypesa,bRibotype sharing
indexcReproducible
ribotypesdTotal no. of
ribotypesa,bRibotype sharing
indexcReproducible
ribotypesd
A. Johnstown soil 255 132
1. Burgmann et al.
(2001)
119 ab 0.47 101 52 ab 0.39 47
2. Modified
Burgmann
163 c 0.64 119 83 c 0.63 64
3. Yeates et al. (1998) 101 a 0.40 64 46 a 0.35 40
4. Modified Yeates 129 bc 0.50 114 56 ab 0.42 40
5. Egert et al. (2004) 128 ab 0.50 81 69 bc 0.52 52
6. Soil DNA
isolation kit
0 0 0 0 0 0
B. Lyons soil 182 88
1. Burgmann et al.
(2001)
24 a 0.13 4 40 c 0.45 36
2. Modified
Burgmann
121 c 0.66 89 53 d 0.60 49
3. Yeates et al. (1998) 0 0 0 0 0 0
4. Modified Yeates 97 b 0.53 78 2 a 0.02 1
5. Egert et al. (2004) 89 b 0.49 59 28 b 0.32 26
6. Soil DNA
isolation kit
0 0 0 0 0 0
C. Oakpark soil 195 142
1. Burgmann et al.
(2001)
108 b 0.55 89 48 c 0.34 41
2. Modified
Burgmann
139 c 0.71 102 95 d 0.67 88
3. Yeates et al. (1998) 0 0 0 0 0 0
4. Modified Yeates 68 a 0.35 50 32 b 0.23 30
5. Egert et al. (2004) 82 a 0.42 62 8 a 0.06 5
6. Soil DNA
isolation kit
0 0 0 0 0 0
aRibotypes present in three replicate ARISA profiles obtained by a given method for a given soil; values that differ significantly (Po0.05*) are followed
by different letters.bValues in bold faces are ribotype numbers in soils contributed by all DNA extraction methods.cRibotype sharing index is calculated on the basis of the number of ribotypes as a proportion of the total number of ribotypes present in all ARISA
profiles generated by all methods for a given soil.dReproducible ribotype indicates the number of ribotypes present in all three replicate ARISA profiles generated by a given method for a given soil.
D. Thakuria et al. / Soil Biology & Biochemistry 40 (2008) 1390–1403 1397
These results clearly indicated that, despite their beingmethod-association variability, the four DNA extractionmethods were capable of discriminating between thesethree soils. Thus, the variation associated with DNAextraction methodology was less than that associatedwith inherent biological variability between different soils.This was again supported by analysis of Mahalanobisdistances (calculated using mean scores for each test soil onthe two independent discriminant axes determined byDFA) between the group centroids of soil types (resultsnot shown). MANOVA performed on the discriminantaxes scores obtained by DFA for both B-ARISA andF-ARISA determined the marginal means. Pairwisecomparisons indicated that the three soil types differedsignificantly with respect to the differences amongmarginal means (Po0.017 with Bonferroni adjustment;Table 6).
4. Discussion
Though numerous studies have previously been per-formed to evaluate the impact of DNA extraction methodson soil DNA yields, no previous study clearly definedwhether non-SDS-based DNA extraction methods candeliver DNA of sufficient yield and quality in soils suchthat it can serve as a representative and non-biasedtemplate for DNA fingerprinting. Our study showed thata modification of the CTAB-DTT-based method describedby Burgmann et al. (2001) produced higher yields andbetter quality DNA from three soils than other SDS-basedmethods, a modified SDS-based method or a commercialsoil DNA isolation kit. The poor performance of thecommercial kit may be due to many differences betweenthis and other methods used, including bead composition(ceramic beads of approximately 1.0mm diameter as
ARTICLE IN PRESS
0
Bürgmann et al. (2001)
Modified BürgmannModified Yeates
Egert et al.(2004)Yeates et al.(1998)
c
a
ab
d
bb
a
b
c
a
c
d
ab
10
20
30
40
50
60
**
c
ca
d
d
b
a b
a
a
a
b
c
0
5
10
15
20
25
30
Johnstown soil Lyons soil Oakpark soil
**
Sim
pson
div
ersi
ty in
dex
Sim
pson
div
ersi
ty in
dex
Fig. 4. Simpson’s diversity (1/D) indices of bacteria (A) and fungi (B) in
soils, as determined from the ARISA profiles generated from DNA
extracted by different methods. Each DNA extraction method in a soil
represents three replicated ARISA profiles. Asterisk (�) indicates no
ARISA ribotypes detected by the Yeates et al. (1998) method. Within the
same soil, values (columns) with different letters were significantly
different (�Po0.05).
D. Thakuria et al. / Soil Biology & Biochemistry 40 (2008) 1390–14031398
opposed to a silica bead mixture of 1.0 and 0.1mmdiameter), the bead:soil:extractant buffer ratio (800mg:250mg:400 ml as opposed to 375mg:250mg:625 ml) usedand the composition of the extraction buffer; all of thesefactors might influence extraction efficacy.
Our results were validated through quantitative assess-ment of DNA by both spectrophotometry and electro-phoresis and qualitative assessment by spectrophotometry,PCR and ARISA analyses. A previous study also reportedhigh soil DNA yield (136717 mg g�1 dry soil) using theCTAB-DTT-based DNA extraction method (Burgmannet al., 2001). We assume that the presence of DTT in thisextraction buffer may prevent DNA adsorption to iron andalso reduce both biotic and abiotic oxidative degradationof DNA during the extraction process. Upon cell lysis,DNA adsorbs strongly to Fe3+ present in soils; thereduction of Fe3+ by DTT to soluble Fe2+ will minimizeits adsorption to DNA. The highest yield of soil DNAobtained in this study by gel electrophoresis quantification(269.578.2 mg g�1 dry Lyons soil obtained using themodified CTAB-DTT-based method) equates to approxi-mately 4.5� 1010 bacteria g�1 dry soil (assuming one
bacteria contains 6.0 fg DNA). But bacteria alone did notcontribute to DNA yield; these extracts also containedDNA from fungi and other organisms (e.g. protozoa). It ispossible that extra-cellular soil DNA (Paget et al., 1992)might also contribute to soil DNA yield. Quantification ofsoil DNA by gel electrophoresis gives good relative valuesfor different samples (Zhou et al., 1996). The low DNAyield (6.8–46.1 mg g�1 dry soil) obtained from Oakparksoil (as compared to others) might be associated with thelong-term intensive agricultural management practice thathas prevailed in Oakpark. Continuous application of highrates of inorganic fertilizers and intensive tillage underconventional agriculture management practices lead to thereduction in total microbial population in soils (Marschneret al., 2003). Johnstown soil consistently gave high yield ofgood-quality DNA. This most likely reflected the fact thatlong-term undisturbed pasture land contains high micro-bial population and diversity (Øvreas and Torsvik, 1998).With regard to the DNA quality, multiple purification
steps such as incorporation of PVPP spin column followedby potassium acetate and PEG precipitation steps in-creased the purity of the DNA extracted by either CTAB-DTT or SDS-based extraction methods. This was con-firmed by analysis of a decrease or increase in the 260/280and 260/230 nm absorbance ratios and the influence ofextracts on PCR amplification (PCR inhibition assay andARISA). Low-molecular-weight organic acids (e.g. oxalicacid), macromolecular humic acids, cations (e.g. Na+, K+,Al+), anions (e.g. nitrate, chlorine, phosphates and organicanions) are common contaminants of soil DNA extractsthat can contribute to low 260/280 and 260/230 ratios (Choet al., 1996; Zhou et al., 1996; Yeates et al., 1998; Krsekand Wellington, 1999; He et al., 2005). PVPP and CTABremove co-contaminants like humic acid and otherpolyphenolic compounds present in soil DNA extracts,thereby having positive effects on quality of soil DNAextracts (Steffan et al., 1988; Berthelet et al., 1996; Zhouet al., 1996). Potassium acetate precipitation helps toremove proteins and polysaccharides from soil DNAextracts (Yeates et al., 1998). PEG precipitation alsoimproves soil DNA quality (Steffan et al., 1988). Stachet al. (2001) also suggested that more efficient initialpurification of crude environmental DNA, rather thandilution, might prevent biased amplification of the mostnumerically abundant taxa.In the PCR inhibition assay, the effect of soil DNA
extracts (1 ml extract was used and each microlitre con-tained 20 ng soil DNA) on the amplification of a GAPDH
gene fragment from wheat genomic DNA (50 ng DNA)gave insights into the variable quality of DNA extracted bydifferent methods. In addition, PCR inhibition assayresults indicated that soil type also exerts a high influenceon the quality of DNA extracts obtained, irrespective ofDNA extraction methods. For example, DNA extractsproduced by the modified Burgmann method were the leastinhibitory to PCR reactions; yet this method resulted insoil-type-dependent variances in PCR efficacy (11%, 28%
ARTICLE IN PRESS
-15
0
5
10
15
-20 0 20 40
Axis 1 (84.6%)
0
5
10
15
20
0 50
Axis 1 (93.6%)
0
10
20
30
0 50 100
Axis 1 (94.7%)
0
5
10
15
0 50 100 150
Axis 1 (98.0%)
0
10
20
30
0 50 100 150
Axis 1 (91.3%)
-20
0
10
20
30
0 25 50
Axis 1 (70.6%)
-10
-5
-5
-10
-15
-30
-20
-10
-15
-10
-5
-30
-20
-10
-10
Axi
s 2
(14.
6%)
Axi
s 2
(1.3
%)
Axi
s 2
(6.4
%)
Axi
s 2
(27.
4%)
Axi
s 2
(6.2
%)
Axi
s 2
(5.1
%)
-100 -50
-100 -50 -100 -50
-150 -100 -50 -50 -25
Fig. 5. Discriminant function scores of the relative abundance of bacterial (A, C, E) and fungal (B, D, F) ribotypes in ARISA profiles amplified from
DNA extracted by four different extraction methods from three soils: Johnstown (A and B), Lyons (C and D) and Oakpark (E and F). Extraction methods
were used as priori groups: Burgmann et al. (2001) method (}), modified Burgmann method (&), modified Yeates method (n) and Egert et al. (2004) (J).
Shaded symbols represent group centroids. Variance (%) associated with each axis is shown (�Po0.001).
D. Thakuria et al. / Soil Biology & Biochemistry 40 (2008) 1390–1403 1399
and 35% PCR inhibition for Johnstown, Lyons andOakpark soils, respectively; Fig. 2).
DNA extracted by the modified Burgmann methodyielded the highest numbers of bacterial and fungalribotypes (as detected by ARISA) and results were morereproducible (Table 3), as compared to results obtained forDNA extracted by other means. In all soils, the commercialsoil DNA isolation kit failed to detect B-ARISA andF-ARISA ribotypes due to very low 260/230 nm ratios(p0.96) of the DNA extract. There was a significantcorrelation between the number of reproducible ribotypes(i.e. those reproducible among different technical replicatesextracted by one method from the same soil) and 260/230absorbance ratios of soil DNA extracts (r ¼ 0.88 and 0.72
for bacteria and fungi, respectively; Po0.001). This clearlyindicated that presence of co-contaminants in DNAextracts is a key factor determining DNA fingerprintingreproducibility. In spite of such factors, the numbers ofreproducible ribotypes was also soil type dependent,irrespective of the DNA extraction method used (Table 3;Po0.01).Ribotype richness and extrapolated microbial diversity
(abundance) indices for a test soil varied according to theDNA extraction method used. For Lyons soil DNAextracted by SDS-based methods (e.g. the modified Yeatesand Egert et al. (2004) methods), high ribotype richnessvalues did not correspond to high diversity index values(Table 3 and Fig. 4); this was not the case for other soils
ARTICLE IN PRESS
Table 4
Mahalanobis distances between group (DNA extraction method) centroids values deduced from the bacterial ARISA (plain font) and fungal ARISA
(bold font) ribotypesa
Soil type DNA extraction method
Burgmann et al. (2001) Modified Burgmann Modified Yeates Egert et al. (2004)
A. Johnstown soil
Burgmann et al. (2001) 0 �26.1 �158.9 �115.5
Modified Burgmann �18.0 0 �132.8 �89.5
Modified Yeates �1.2 16.9 0 43.4
Egert et al. (2004) 37.1 55.1 38.2 0
B. Lyons soil
Burgmann et al. (2001) 0 �110.1 �13.3 �154.3
Modified Burgmann �68.2 0 96.8 �44.1
Modified Yeates 42.1 110.3 0 �141.0
Egert et al. (2004) 1.6 69.8 �40.4 0
C. Oakpark soil
Burgmann et al. (2001) 0 �17.2 �9.9 �80.1
Modified Burgmann �11.0 0 7.3 �63.0
Modified Yeates 156.5 167.5 0 �70.3
Egert et al. (2004) 105.4 116.4 �51.1 0
aValues were calculated from the mean scores on each of the three discriminant axes for each DNA extraction method.
Table 5
Differences among marginal means of four DNA extraction methods obtained from multivariate analysis of variance (MANOVA) performed on scores of
independent discriminant axes for both bacterial (plain font) and fungal (bold font) ARISA profilesa
Soil type DNA extraction method
Burgmann et al. (2001) Modified Burgmann Modified Yeates Egert et al. (2004)
A. Johnstown soil
Burgmann et al. (2001) 0 �8.4�
�155.2�
�93.5�
Modified Burgmann 5.5� 0 �146.7�
�85.1�
Modified Yeates 10.8� 5.4� 0 61.6�
Egert et al. (2004) �36.4� �41.9� �47.2� 0
B. Lyons soil
Burgmann et al. (2001) 0 �76.3�
�28.9�
�163.6�
Modified Burgmann 81.8� 0 47.4�
�87.4�
Modified Yeates �16.7� �98.5� 0 �134.8�
Egert et al. (2004) 1.1� �80.7� 17.9� 0
C. Oakpark soil
Burgmann et al. (2001) 0 25.5�
0.4 �47.5�
Modified Burgmann 52.8� 0 �25.0�
�72.9�
Modified Yeates �120.7� �173.5� 0 �47.9�
Egert et al. (2004) �86.8� �139.7� 33.8� 0
aValues presented were based on discriminant axis 1 only (results of axes 2 and 3 are not shown).�Significant at Po0.0125 (Bonferroni adjustment for pairwise comparisons).
D. Thakuria et al. / Soil Biology & Biochemistry 40 (2008) 1390–14031400
nor for DNA extracted using CTAB-based methods. Thisreinforces the fact that these SDS-based methods areinconsistent in extracting high-quality DNA from soilsof high clay and organic matter content like Lyons soil(Table 1). Hence, inefficient DNA extraction methods canunder-estimate or over-estimate the microbial diversity.Martin-Laurent et al. (2001) also demonstrated that soilDNA extraction methods can bias the analysis of
phylotype abundance and lead to misinterpretation ofbacterial community structure. Therefore, as expected,DNA quality significantly affects the ability to drawmeaningful conclusions from DNA fingerprint-basedmicrobial diversity results. Results of DFA and MANOVArevealed that each DNA extraction method was successfulin discriminating three test soils based on the number andrelative abundance of B-ARISA and F-ARISA ribotypes.

ARTICLE IN PRESS
-20
0
5
10
15
0 50 100
Axis 1 (98.0%)
0
2
4
0 2 4 6
Axis 1 (50.1%)
Axi
s 2
(1.8
%)
Axi
s 2
(49.
9%)
-15
-10
-5
-6
-4
-2
-100 -50 -6 -4 -2
Fig. 6. Discriminant function scores of the relative abundance of bacterial (A) and fungal (B) ribotypes in ARISA profiles amplified from DNA extracted
from three different soils using four different extraction methods. Soil types were used as priori groups and DNA extraction methods are not discriminated
in the figure. Soil types: Johnstown soil (}), Lyons soil (&), Oakpark soil (n). Shaded symbols represent group centroids. Variance (%) associated with
each axis is shown (�Po0.04).
Table 6
Differences among marginal means of three test soils obtained from
multivariate analysis of variance (MANOVA) performed on scores along
independent discriminant axes for both bacterial (plain font) and fungal
(bold font) ARISA profilesa
Johnstown soil Lyons soil Oakpark soil
Johnstown soil 0 (0) 5.3� (5.6�) 7.6� (�1.8�)Lyons soil �147.0� (�7.5�) 0 (0) 2.2� (�7.4�)Oakpark soil �120.0� (14.0�) 27.0� (21.5�) 0 (0)
aValues presented were based on discriminant scores on axis 1 and those
within parentheses were based on discriminant scores on axis 2.�Significant at Po0.017 (Bonferroni adjustment for pairwise compar-
isons).
D. Thakuria et al. / Soil Biology & Biochemistry 40 (2008) 1390–1403 1401
The discrimination of three test soils by the modifiedBurgmann method was more reliable as evident fromobserved cross-validation of classification accuracy rate(490%) for priori groups. Discrimination of the three soilsinto non-overlapping clusters of cross-soil ARISA profiles(by DFA analysis) clearly indicated that soil type morestrongly influenced differences in microbial communitystructure than DNA extraction method. Differences inbacterial and fungal community structures among the threetest soils presumably relate to differences in soil type,biogeography and management practices. Earlier studieshave shown that agricultural management practices signi-ficantly influence microbial community structures (Beeseet al., 1994; Øvreas and Torsvik, 1998; Steenwerth et al.,2002; Klamer and Hedlund, 2004; Clegg, 2006).
In conclusion, while CTAB-DTT extractant has not beenwidely used in the past for soil DNA extraction, ourfindings confirmed that the modified CTAB-DTT extrac-tion buffer based in-situ lysis DNA extraction methodperforms better in comparison to SDS-based methods, atleast for the soils we tested. This method should bevigorously exploited in future soil DNA fingerprinting
studies. Our results emphasize the importance of incorpor-ating multiple steps of DNA purification into extractionprotocols in order to optimize DNA quality. Our findingsstrongly reinforce the importance to ensure that high-quality DNA is extracted as it underpins DNA fingerprint-ing studies. Another important conclusion from this studyis the fact that methodological bias might mask, but didnot exceed biological variability among soil types. Theremay be no DNA extraction method that ‘fits all’ soil types,in terms of yielding high-quality DNA. However, placingquality assurance at the heart of methodological choice willenable more meaningful within and across-study compara-tive analysis of soil microbial community fingerprints.
Acknowledgements
This research and Dwipendra Thakuria are supportedby the Science Foundation Ireland Research FrontiersProgramme (05-RFP-EEB-0047). We thank Dr. AnnetteAnderson for help with using EstimateS v8.0 in analysingSimpson diversity indices.
References
Anderson, I.C., Cairney, J.W.G., 2004. Diversity and ecology of soil
fungal communities: increased understanding through the application
of molecular techniques. Environmental Microbiology 6, 769–779.
Beese, F., Hartmann, A., Bech, T., Rackwitz, R., Zelles, L., 1994.
Microbial community structure and activity in agricultural soils under
different management. Zeitschrift fur Pflanzenernahrung und Boden-
kunde 157, 187–195.
Berthelet, M., Whyte, L.G., Greer, C.W., 1996. Rapid, direct extractions
of DNA from soils for PCR analysis using polyvinylpolypyrrolidone
spin columns. FEMS Microbiology Letters 138, 17–22.
Burgmann, H., Pesaro, M., Widmer, F., Zeyer, J., 2001. A strategy for
optimising quality and quantity of DNA extracted from soil. Journal
of Microbiological Methods 45, 7–20.
Cardinale, M., Brusetti, L., Quatrini, P., Borin, S., Puglia, A.M., Rizzi, A.,
Zanardini, E., Sorlini, C., Corselli, C., Daffonchio, D., 2004.
ARTICLE IN PRESSD. Thakuria et al. / Soil Biology & Biochemistry 40 (2008) 1390–14031402
Comparison of different primer sets for use in automated ribosomal
intergenic spacer analysis of complex bacterial communities. Applied
and Environmental Microbiology 70, 6147–6156.
Carrigg, C., Rice, O., Kavanagh, S., Collins, G., O’Flaherty, V.,
2007. DNA extraction method affects microbial community profiles
from soils and sediment. Applied Microbial Biotechnology 77,
955–964.
Cheung, A.L., Eberhardt, K.J., Fischetti, V.A., 1994. A method to isolate
RNA from gram-positive bacteria and mycobacteria. Annals of
Biochemistry 222, 511–514.
Cho, J.C., Lee, D.H., Cho, Y.C., Cho, J.C., Kim, S.J., 1996. Direct
extraction of DNA from soil for amplification of 16S rRNA gene
sequences by polymerase chain reaction. Journal of Microbiology 34,
229–235.
Clegg, C.D., 2006. Impact of cattle grazing and inorganic fertilizer
additions to managed grasslands on the microbial community
composition of soils. Applied Soil Ecology 31, 73–82.
Colwell, R.K., 2006. EstimateS: statistical estimation of species richness
and shared species from samples. Version 8.0: user’s guide and
application. Available from: /http://purl.oclc.org/estimatesS.
Culleton, E., Diamond, S. Soils of Johnstown Castle Estate, Soil Survey
Bulletin. Teagasc, Johnstown Castle, Wexford (in press).
de Lipthay, J.R., Enginger, C., Johnsen, K., Aamand, J., Sørensen, S.,
2004. Impact of DNA extraction method on bacterial community
composition measured by denaturing gradient gel electrophoresis. Soil
Biology & Biochemistry 36, 1607–1614.
Egert, M., Marhan, S., Wagner, B., Scheu, S., Friedrich, M.W., 2004.
Molecular profiling of 16S rRNA genes reveals diet-related differences
of microbial communities in soil, gut and casts of Lumbricus terrestris
L. (Oligochaeta: Lumbricideae). FEMS Microbiology Ecology 48,
187–197.
Fisher, M.M., Triplett, E.W., 1999. Automated approach for ribosomal
intergenic spacer analysis of microbial diversity and its application to
freshwater bacterial communities. Applied and Environmental Micro-
biology 65, 4630–4636.
Frostegard, A., Courtois, S., Ramisse, V., Clerc, S., Bernillon, D., Gall,
F.L., Jeannin, P., Nesme, X., Simonet, P., 1999. Quantification of bias
related to the extraction of DNA directly from soils. Applied and
Environmental Microbiology 65, 5409–5420.
He, J., Xu, Z., Hughes, J., 2005. Pre-lysis washing improves DNA
extraction from a forest soil. Soil Biology & Biochemistry 37,
2337–2341.
Hooker, K., 2005. A field study of nitrate leaching from tillage land in
south east Ireland. Master’s Thesis, Trinity College Dublin, Ireland.
Klamer, M., Hedlund, K., 2004. Fungal diversity in set-aside agricultural
soil investigated using terminal-restriction fragment length polymorph-
ism. Soil Biology & Biochemistry 36, 983–988.
Krsek, M., Wellington, E.M.H., 1999. Comparison of different methods
for the isolation and purification of total community DNA from soil.
Journal of Microbiological Methods 39, 1–16.
Lalor, S.T.J., 2004. Soils of UCD Research Farm, Lyons Estate,
Celbridge, Co. Kildare. Master’s Thesis. University College Dublin,
Ireland.
Luna, G.M., Dell’Anno, A., Danovaro, R., 2006. DNA extraction
procedure: a critical issue for bacterial diversity assessment in marine
sediments. Environmental Microbiology 8, 308–320.
Magurran, A.E., 2004. Measuring Biological Diversity. Blackwell Publish-
ing, Oxford, UK, pp. 106–130.
Marschner, P., Kandeler, E., Marschner, B., 2003. Structure and function
of the soil microbial community in a long-term fertilizer experiment.
Soil Biology & Biochemistry 35, 453–461.
Martin-Laurent, F., Phillipot, L., Hallet, S., Chaussod, R., Germon, J.C.,
Soulas, G., Catroux, G., 2001. DNA extraction from soils: old bias for
new microbial diversity analysis methods. Applied and Environmental
Microbiology 67, 2354–2359.
McCune, B., Grace, J.B., 2002. Analysis of Ecological Communities,
second ed. MjM Software Design, Gleneden Beach, USA, pp. 205–210.
Available from: /http://www.pcord.comS.
Miller, D.N., Bryant, J.E., Madsen, E.L., Ghiorse, W.C., 1999. Evaluation
and optimisation of DNA extraction and purification procedures for
soil and sediment samples. Applied and Environmental Microbiology
65, 4715–4724.
Monnet, F.P., Dieryck, W., Boutrot, F., Joudrier, P., Gautier, M.F.,
2001. Purification, characterisation and cDNA cloning of a type 2
(7 kDa) lipid transfer protein from Triticum durum. Plant Science 161,
747–755.
More, M.I., Herrick, J.B., Silva, M.C., Ghiorse, W.C., Madsen, E.L.,
1994. Quantitative cell lysis of indigenous microorganisms and rapid
extraction of microbial DNA from sediments. Applied and Environ-
mental Microbiology 60, 1572–1580.
Nannipieri, P., Ascher, J., Ceccherini, M.T., Landi, L., Pietramellara, G.,
Renella, G., 2003. Microbial diversity and soil functions. European
Journal of Soil Science 54, 655–670.
Ogram, A., 2000. Soil molecular microbial ecology at age 20: methodo-
logical challenges for the future. Soil Biology & Biochemistry 32,
1499–1504.
Øvreas, L., Torsvik, V., 1998. Microbial diversity and community
structure in two different agricultural communities. Microbial Ecology
36, 303–315.
Pace, N.R., 1997. A molecular view of microbial diversity and the
biosphere. Science 276, 734–740.
Paget, E., Jocteur Monrozier, L., Simonet, P., 1992. Adsorption of DNA
on clay minerals: protection against DNaseI and influence on gene
transfer. FEMS Microbiology Letters 97, 31–40.
Ranjard, L., Poly, F., Lata, J.C., Mougel, C., Thioulouse, J., Nazaret, S.,
2001. Characterisation of bacterial and fungal soil communities by
automated ribosomal intergenic spacer analysis fingerprints: biological
and methodological variability. Applied and Environmental Micro-
biology 67, 4479–4487.
Rowland, L.J., Nguyen, B., 1993. Use of polyethylene-glycol for
purification of DNA from leaf tissue of woody plants. Biotechniques
14, 734–736.
Sambrook, J., Fritsch, E.F., Maniatis, T., 1989. Molecular Cloning:
A Laboratory Manual, second ed. Cold Spring Harbor Laboratory,
Cold Spring Harbor, NY.
Scallan, U., Liliensiek, A., Clipson, N., Connolly, J., 2008. RIBOSORT:
a program for automated data preparation and exploratory analysis
of microbial community fingerprints. Molecular Ecology Resources 8,
95–98.
Schimel, J., 2007. Soil microbiology, ecology and biochemistry for the 21st
century. In: Paul, E.A. (Ed.), Soil Microbiology, Ecology and
Biochemistry, third ed. Academic Press, Canada, pp. 503–512.
Sequerra, J., Marmeisse, R., Valla, G., Normand, P., Capellano, A.,
Moiround, A., 1997. Taxonomic position and intraspecific variability
of the nodule forming Penicillium nodositatum inferred from RFLP
analysis of the ribosomal intergenic spacer and random amplified
polymorphic DNA. Mycological Research 101, 465–472.
Stach, J.E.M., Bathe, S., Clapp, J.P., Burns, R.G., 2001. PCR-SSCP
comparison of 16S rDNA sequence diversity in soil DNA obtained
using different isolation and purification methods. FEMS Microbiol-
ogy Ecology 36, 139–151.
Steenwerth, K.L., Jackson, L.E., Calderon, F.J., Stromberg, M.R., Scow,
K.M., 2002. Soil microbial community composition and land use
history in cultivated and grassland ecosystem of costal California. Soil
Biology & Biochemistry 34, 1599–1611.
Steffan, R.J., Goksoyr, A.K., Bej, A.K., Atlas, R.M., 1988. Recovery of
DNA from soils and sediments. Applied and Environmental Micro-
biology 54, 2908–2915.
Tabachnick, B.G., Fidell, L.S., 1989. Using Multivariate Statistics, second
ed. Harper Collins Publishers Inc., New York, p. 67.
Tiunov, A.V., Scheu, S., 2000. Microfungal communities in soil, litter and
casts of Lumbricus terrestris L. (Lumbricidae): a laboratory experi-
ment. Applied Soil Ecology 14, 17–26.
Tsai, Y.L., Olsen, B.H., 1991. Rapid method for extraction of DNA from
soils and sediments. Applied and Environmental Microbiology 57,
1070–1074.
ARTICLE IN PRESSD. Thakuria et al. / Soil Biology & Biochemistry 40 (2008) 1390–1403 1403
Yeates, C., Gillings, M.R., Davison, A.D., Altavilla, N., Veal, D.A., 1998.
Methods for microbial DNA extraction from soil for PCR amplifica-
tion. Biological Procedures Online 1, 40–47.
Zhou, J., Bruns, M.A., Tiedje, J.M., 1996. DNA recovery from soils of diverse
composition. Applied and Environmental Microbiology 62, 316–322.
Zipper, H., Buta, C., Lammle, K., Brunner, H., Bernhagen, J.,
Vitzthum, F., 2003. Mechanisms underlying the impact of humic
acids on the DNA quantification by SYBR Green I and consequences
for the analysis of soils and aquatic sediments. Nucleic Acids Research
31, e39.
Related Documents