Implementing Agreement for Co-operation in the Research, Development, and Deployment of Wind Energy Systems Implementing Agreement for Co-operation in the Research, Development and Deployment of Wind Energy Systems Spanish Fork Wind Farm in Utah, U.S. Task 26 - Cost of Wind Energy: an Overview Wind Energy R&D Seminar M. Maureen Hand, Ph. D. May 26, 2014 Dublin, Ireland

Implementing Agreement for Co-operation in the Research, Development and Deployment of Wind Energy Systems - Maureen Hand, nrel
Jul 15, 2015
Welcome message from author
This document is posted to help you gain knowledge. Please leave a comment to let me know what you think about it! Share it to your friends and learn new things together.
Transcript

Implementing Agreement for Co-operation in the Research, Development, and Deployment of Wind Energy Systems
Implementing Agreement for Co-operation in the Research,
Development and Deployment of Wind Energy Systems
Spanish Fork Wind Farm in Utah, U.S.
Task 26 - Cost of Wind Energy: an Overview
Wind Energy R&D Seminar
M. Maureen Hand, Ph. D.
May 26, 2014
Dublin, Ireland
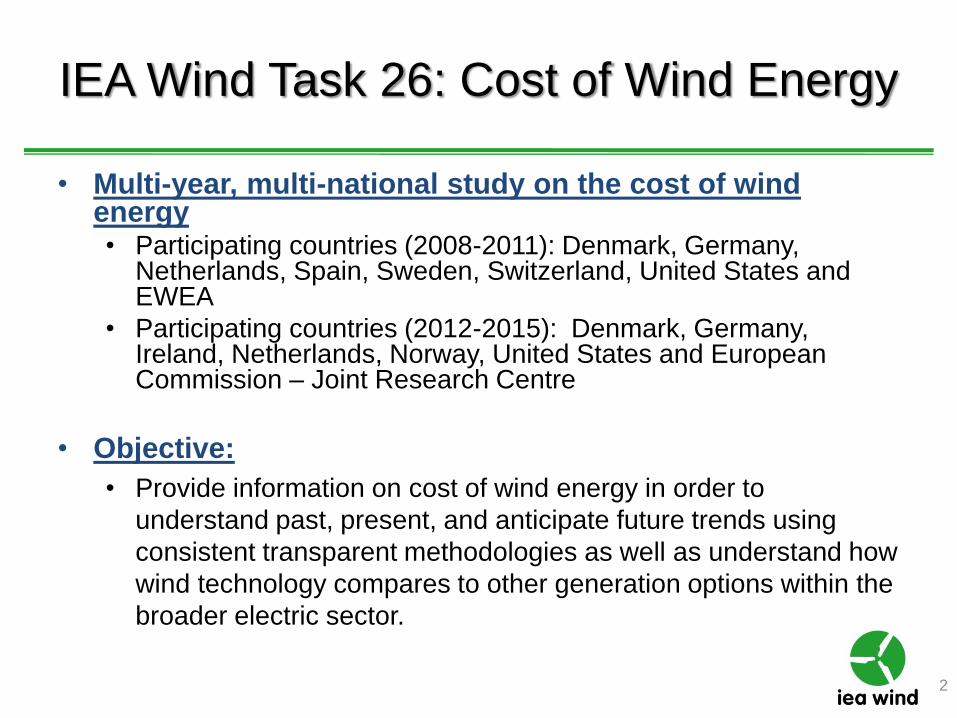
IEA Wind Task 26: Cost of Wind Energy
• Multi-year, multi-national study on the cost of wind energy • Participating countries (2008-2011): Denmark, Germany,
Netherlands, Spain, Sweden, Switzerland, United States and EWEA
• Participating countries (2012-2015): Denmark, Germany, Ireland, Netherlands, Norway, United States and European Commission – Joint Research Centre
• Objective:
• Provide information on cost of wind energy in order to
understand past, present, and anticipate future trends using
consistent transparent methodologies as well as understand how
wind technology compares to other generation options within the
broader electric sector.
2

Levelized Cost of Energy (LCOE)
• Four basic parameters
– Initial Capital Cost (ICC), Annual Operating Expenses (AOE), finance
parameters (Fixed Charge Rate (FCR)), and net Annual Energy
Production (AEP)
• Metric is useful to explore
– Long-term trends or projections
– Relative differences in resource quality, geographic locations, or technology options
netnet AEP
AOE
AEP
ICCFCRLCOE
Annual Energy Production
Operating Expense
Capital Investment
Financing
Source: Short et al. 1995
3

Multi-national Wind LCOE Comparison (2007-2008)
• Use of publicly available ECN
model to estimate wind LCOE
in seven countries
• Originally designed to set
Dutch feed-in tariff or feed-in
tariff premium levels
• Model customized for this
task; estimates unsubsidized
country LCOE
• Represents the perspective
of the project’s
investor/developer
Cash flow model for financial gap calculations
Wind: Netherlands 2008
Symbol INPUT PARAMETERS Unit
U Unit size kWe 15000
H Operational time / full load hours h/yr 2200
T b Economic life yr 20
C tot / U Investment costs €/kW 1325
Decommisioning costs €/kW 0
c f Maintenance costs fixed €/kW 31.39238321
c v Maintenance costs variable €/kWh 0.013363553
Other revenues €/kWh 0.080
Other costs €/kWh 0.0097
Upfront tax-based investment subsidy 20%
Upfront cash investment subsidy 0%
Feed-in tariff €/kWh 0.028
Production-based tax credit €/kWh 0.000
Production-based tax deduction €/kWh 0.000
R d Return on debt 5.0%
R e Required return on equity 15.0%
e Equity share (excluding EIA benefit) 20%
d Debt share (including EIA benefit) 80%
Corporate tax rate (Municipal/state) 0%
t Corporate tax rate (National/federal) 25.5%
T r Loan duration yr 15
T d Depreciation period yr 15
T p Economic life yr 20
FG Financial gap €/MWh -3
LC Levelized electricity generation cost €/MWh 94
Fixed or
average
value
Output
Costs
Project
features
Market
Project
financing
features
Time
horizons
p e
Policy
support
4

5
Country Data Collection: Onshore Wind
Reference Case weighted by project capacity
Representatives provided country-specific onshore wind energy cost estimates
including investment costs, energy production, O&M and other variables
Denmark Germany Netherlands Spain Sweden Switzerland
United
States
Reference
Case
Unit size (MW) 2.3 2.0 3.0 2.0 2.4 2.0 1.7 2.1
Number of
turbines 7 5 5 15 41 6 50 34
Full load hours 2,695 2,260 2,200 2,150 2,600 1,750 3,066 2,628
Investment
(€/kW) 1,250 1,373 1,325 1,250 1,591 1,790 1,377 1,449
Decommissioning
costs (€/kW) 0.0 1.5 0.0 0.0 1.6 0.0 0.0 0.6
Other costs
(€/MWh) 3 0 10 3 0 0 0 1
O&M costs fixed
(€/kW-yr) 0.00 46.33 31.39 0.00 0.01 0.00 8.60 6.29
O&M costs
variable (€/MWh) 12 0 13 20 11 31 5 11
Converted total
O&M costs
(€/MWh)
12 21 28 20 11 31 7 13
Reference Case
Weight 6.1% 3.8% 5.7% 11.4% 36.6% 4.6% 31.8% N/A
2008 “Typical” Wind Project Technical Parameters
Source: Schwabe et al. (2011). IEA Wind Task 26: Multi-national Case Study of the Financial Cost of Wind Energy.

6
Country Data Collection: Onshore Wind
Reference Case value based on median country parameter value
Denmark Germany Netherlands Spain Sweden Switzerland
United
States
Reference
Case
Return on debt
(%) 5.0 5.5 5.0 7.0 5.0 5.0 6.0 5.0
Return on
equity (%) 11.0 9.5 15.0 10.0 12.0 7.0 7.5 10.0
Debt share (%) 80 70 80 80 87 70 0 80
Equity share
(%) 20 30 20 20 13 30 100 20
Loan duration
(yrs) 13 13 15 15 20 20 15 15
National tax rate
(%) 25.0 29.8 25.5 30.0 28.0 21.0 38.9 28.0
WACC (%) 5.2 5.6 6.0 5.9 4.7 4.9 7.5 4.9
2008 “Typical” Wind Project Financial Parameters
The LCOE calculation was based on a predefined return on equity that was provided
by each country representative along with other financial input parameters
Source: Schwabe et al. (2011). IEA Wind Task 26: Multi-national Case Study of the Financial Cost of Wind Energy.

Results: Key Variable Comparisons
Across Countries – 2008 LCOE
0
28
56
83
111
139
167
195
0
20
40
60
80
100
120
140
Swit
zerl
and
Net
her
lan
ds
Ger
man
y
Spai
n
Swed
en
Un
ited
Sta
tes
Den
mar
k
LCO
E $
/MW
h
LCO
E €
/MW
h
Country Cost of Energy RC (Reference Case)
RC with Country Energy Production RC with Country Investment Cost
RC with Country O&M RC with Country Financing
Source: Schwabe et al. (2011). IEA Wind Task 26: Multi-national Case Study of the Financial Cost of Wind Energy.
7
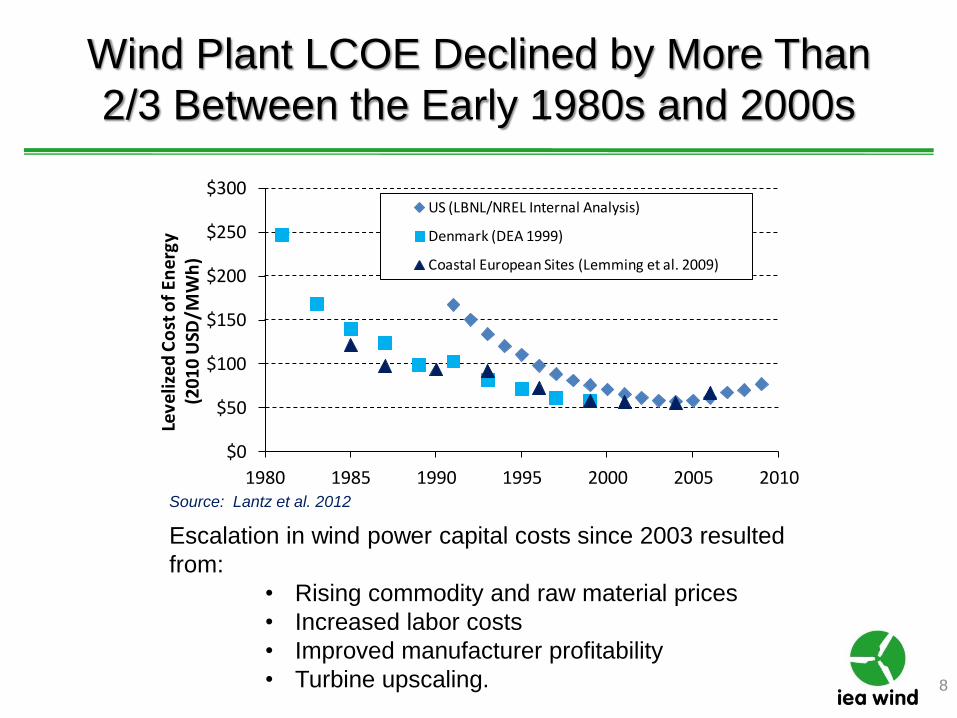
Wind Plant LCOE Declined by More Than
2/3 Between the Early 1980s and 2000s
$0
$50
$100
$150
$200
$250
$300
1980 1985 1990 1995 2000 2005 2010
Leve
lize
d C
ost
of
Ener
gy
(201
0 U
SD/M
Wh
) US (LBNL/NREL Internal Analysis)
Denmark (DEA 1999)
Coastal European Sites (Lemming et al. 2009)
Source: Lantz et al. 2012
Escalation in wind power capital costs since 2003 resulted
from:
• Rising commodity and raw material prices
• Increased labor costs
• Improved manufacturer profitability
• Turbine upscaling. 8

Lower Turbine Prices Since 2009 Along With Improved
Wind Turbine Performance May Yield a Return to
Historically Low LCOE Levels in 20122013
$50
$70
$90
$110
$130
$150
$170
5.5 6 6.5 7 7.5 8 8.5
Leve
lize
d C
ost
of
Ener
gy in
th
e U
nit
ed
Sta
tes
(201
0 U
SD/M
Wh
)
50 Meter Wind Speed (m/s)air density = 1.225 kg/m3
Class 2 Class 3 Class 4 Class 5 Class 6
Estimated LCOE:
2002-03
Estimated LCOE:2009-10
Estimated LCOE:
2012-13
$50
$70
$90
$110
$130
$150
$170
5.5 6 6.5 7 7.5 8 8.5
Leve
lize
d C
ost
of
Ene
rgy
in D
en
mar
k
(20
10
USD
/MW
h)
50 Meter Wind Speed (m/s)air density = 1.225 kg/m3
Class 2 Class 3 Class 4 Class 5 Class 6
Estimated LCOE: 2002
Estimated LCOE:2009
Estimated LCOE: 2012
Source: Lantz et al. 2012
• Estimated wind plant LCOE based on observed market variation
in capital investment and modeled wind plant performance
• Incentives or policies that reduce price of wind energy in
wholesale power markets (e.g., production tax credit) excluded. 9

New Technology Options Reduce Variability in LCOE
Across a Range of Wind Resource Sites
$44/MWh
$25/MWh
8 m/s
7 m/s
6 m/s
$0
$20
$40
$60
$80
$100
$120
2002-03 Current, 2012-13
Standard Technology Technology Choice
Leve
lize
d C
ost
of
Ene
rgy
($/M
Wh
)N
o In
cen
tive
s
• Low wind speed technology designed for International Electrotechnical
Commission Class III sites provides Technology Choice in 20122013
for annual average sea level equivalent wind speeds at 50 meters.
Source: Lantz et al. 2012
10

Future Forecasts: Variety of methods and
assumptions generally anticipate LCOE reduction
over next decades
Sources include: EREC/GPI 2010, Tidball et al. 2010, DOE 2008, AEO 2009,
Lemming et al. 2009, EWEA 2009, EPRI 2010, Peter and Lehmann 2008, GWEO
2010, IEA 2009, EC Primes 2007.
Methods include learning curves, engineering models, and expert
elicitation with varying levels of detail with respect to projected
technology advance
50%
60%
70%
80%
90%
100%
2010 2015 2020 2025 2030
Tren
ds
In W
ind
Po
wer
LC
OE
2011
= 1
00%
20th to 80thPercentile Range
Note: -Shaded area represents the full range of expectations in the literature
-Each individual line details the expected cost of energy pathway for a given study
11

Conclusions
• Focusing only on capital cost trends or energy production trends does not capture inter-relationship, but LCOE does. – Range of data about project required to assess trends
• Quantifying impact of technology trends, e.g., larger rotors and taller towers effect type of wind resource site to exploit, allows greater understanding of future trends.
• Variety of methods used to project future cost estimates with varying levels of detail; likely that greater insight attained through application of multiple methods
12

13
RE deployment increases in scenarios with lower
greenhouse gas concentration stabilization levels
Source: IPCC, 2011: Summary for Policymakers. In: IPCC Special Report on Renewable
Energy Sources and Climate Change Mitigation
Current and Future Work
• Update onshore cost of energy estimates
with more recent data and trends from 2007 -
2012
• Assess offshore wind cost of energy
similarities and differences among
participating countries
• Explore methods and approaches to quantify
value of wind energy and future cost of wind
energy by engaging international experts
14
IEA Wind Task 26: Cost of Wind Energy
• Publications
• Multi-national Case
Study of the Financial
Cost of Wind Energy
in 2008
• The Past and Future
Cost of Wind Energy
• www.ieawind.org/Task_26
15

Notice: The IEA Wind agreement, also known as the Implementing Agreement for Co-operation in the Research, Development, and Deployment
of Wind Energy Systems, functions within a framework created by the International Energy Agency (IEA). Views, findings and publications of IEA
Wind do not necessarily represent the views or policies of the IEA Secretariat or of all its individual member countries.
Thank you!
Maureen Hand
IEA Wind Task 26, Operating Agent
National Renewable Energy Laboratory
Phone: (303) 384-6933
E-mail: [email protected]
Web: www.ieawind.org/Task_26
Related Documents


