iMedPub Journals Our Site: http://www.imedpub.com/ © Copyright iMedPub 1 ARCHIVES OF MEDICINE 2014 Vol. 6 No. 1:2 doi: 10.3823/110 Impaired fasting glucose level and diabetes in kaoma and kasama rural districts of Zambia: prevalence and correlates in 2008- 2009 population based surveys 1 WHO Representative, World Health Organization, Lusaka, Zambia. 2 National Program Officer, Disease Prevention and Control, World Health Organization, Lusaka, Zambia. 3 Professor, Dean, Andrews University, Berrien Springs, Michigan, United States of America. 4 Associate Professor, College of Medicine, University of Malawi, Blantyre, Malawi. 5 Lecturer, Clinical Sciences Department, Copperbelt University, Ndola, Zambia. 6 Biomedical scientist, World Health Organisation, Lusaka, Zambia. 7 Biomedical scientist, World Health Organisation, Lusaka, Zambia. 8 National Program Office, Malaria, World Health Organization, Lusaka, Zambia. 9 Professor, Clinical Sciences Department, Copperbelt University, Ndola, Zambia. Correspondencia: [email protected] Prof Seter Siziya Public Health Unit, Clinical Sciences Department School of Medicine, Copperbelt University P O Box 71191 Ndola, Zambia Olusegun Babaniyi 1 FMCPH, Peter Songolo 2 MPH, Emmanuel Rudatsikira 3 DrPH, Adamson S Muula 4 PhD, David Mulenga 5 MPH, Mazyanga L Mazaba-Liwewe 6 MBA, Idah Ndumba 7 BSc, Freddie Masaninga 8 Ph.D, Seter Siziya 8* Ph.D. This article is available from: www.archivesofmedicine.com Abstract Background: Impaired fasting glucose level has been associated with increased incidence of Type 2 Diabetes mellitus, and diabetes is becoming a major public health problem in developing countries. The objective of the study was to deter- mine the prevalence and correlates for impaired fasting glucose level/diabetes in Kaoma and Kasama rural districts of Zambia. Methods and Findings: A cross sectional study using modified World Health Organization (WHO) global non communicable diseases (NCD) surveillance initiative NCD-STEP wise approach was used in the study. Proportions were compared using the Yates’ corrected Chi-square test, and a result yielding a p value of less than 5% was considered statistically significant. Bivariate and multivariate logistic regression analyses were conducted. Factors that were statistically significantly associated with the outcome in bivariate analyses were considered in a multivariate logistic regres- sion analysis using a backward variable selection method. Odds ratios (OR) and their 95% confidence intervals (CI) have been reported. Total of 895 participants from Kaoma and 1198 from Kasama took part in the surveys. Overall, 4.1% of the participants in Kaoma and 1.8% of the participants in Kasama (p=0.004) had impaired fasting glucose level/diabetes, with no significant differences between sex in both districts. Respondents who were aged less than 45 years were less likely to have impaired glucose level/diabetes compared to those who were aged 45 years or older (OR=0.56, 95% CI [0.39, 0.81] in Kaoma and OR=0.55, 95% CI [0.33, 0.89] in Kasama). Prevalence of impaired fasting glucose level/diabetes may have been underestimated because impaired glucose test was not conducted. Conclusions: The prevalence of impaired fasting glucose level/diabetes varied between the two rural districts studied. Impaired fasting glucose level/diabetes was associated with age. Interventions to control diabetes should be district specific and targeted at younger age groups in order to curtail the prevalence of diabetes in older age groups.

Welcome message from author
This document is posted to help you gain knowledge. Please leave a comment to let me know what you think about it! Share it to your friends and learn new things together.
Transcript
iMedPub JournalsOur Site: http://www.imedpub.com/
© Copyright iMedPub 1
ARCHIVES OF MEDICINE
2014Vol. 6 No. 1:2
doi: 10.3823/110
Impaired fasting glucose level and
diabetes in kaoma and kasama rural
districts of Zambia: prevalence and
correlates in 2008-2009 population
based surveys
1 WHO Representative, World Health Organization, Lusaka, Zambia.
2 National Program Officer, Disease Prevention and Control, World Health Organization, Lusaka, Zambia.
3 Professor, Dean, Andrews University, Berrien Springs, Michigan, United States of America.
4 Associate Professor, College of Medicine, University of Malawi, Blantyre, Malawi.
5 Lecturer, Clinical Sciences Department, Copperbelt University, Ndola, Zambia.
6 Biomedical scientist, World Health Organisation, Lusaka, Zambia.
7 Biomedical scientist, World Health Organisation, Lusaka, Zambia.
8 National Program Office, Malaria, World Health Organization, Lusaka, Zambia.
9 Professor, Clinical Sciences Department, Copperbelt University, Ndola, Zambia.
Correspondencia:
Prof Seter SiziyaPublic Health Unit, Clinical Sciences DepartmentSchool of Medicine, Copperbelt University
P O Box 71191Ndola, Zambia
Olusegun Babaniyi1 FMCPH, Peter Songolo2 MPH, Emmanuel Rudatsikira3 DrPH, Adamson S Muula4 PhD, David Mulenga5 MPH, Mazyanga L Mazaba-Liwewe6 MBA, Idah Ndumba7 BSc, Freddie Masaninga8Ph.D, Seter Siziya8* Ph.D.
This article is available from: www.archivesofmedicine.com
Abstract
Background: Impaired fasting glucose level has been associated with increased incidence of Type 2 Diabetes mellitus, and diabetes is becoming a major public health problem in developing countries. The objective of the study was to deter-mine the prevalence and correlates for impaired fasting glucose level/diabetes in Kaoma and Kasama rural districts of Zambia.
Methods and Findings: A cross sectional study using modified World Health Organization (WHO) global non communicable diseases (NCD) surveillance initiative NCD-STEP wise approach was used in the study. Proportions were compared using the Yates’ corrected Chi-square test, and a result yielding a p value of less than 5% was considered statistically significant. Bivariate and multivariate logistic regression analyses were conducted. Factors that were statistically significantly associated with the outcome in bivariate analyses were considered in a multivariate logistic regres-sion analysis using a backward variable selection method. Odds ratios (OR) and their 95% confidence intervals (CI) have been reported. Total of 895 participants from Kaoma and 1198 from Kasama took part in the surveys. Overall, 4.1% of the participants in Kaoma and 1.8% of the participants in Kasama (p=0.004) had impaired fasting glucose level/diabetes, with no significant differences between sex in both districts. Respondents who were aged less than 45 years were less likely to have impaired glucose level/diabetes compared to those who were aged 45 years or older (OR=0.56, 95% CI [0.39, 0.81] in Kaoma and OR=0.55, 95% CI [0.33, 0.89] in Kasama). Prevalence of impaired fasting glucose level/diabetes may have been underestimated because impaired glucose test was not conducted.
Conclusions: The prevalence of impaired fasting glucose level/diabetes varied between the two rural districts studied. Impaired fasting glucose level/diabetes was associated with age. Interventions to control diabetes should be district specific and targeted at younger age groups in order to curtail the prevalence of diabetes in older age groups.
iMedPub JournalsOur Site: http://www.imedpub.com/ ARCHIVES OF MEDICINE
2 © Copyright iMedPub
2014Vol. 6 No. 1:2
doi: 10.3823/110
Introduction
Impaired fasting glucose has been associated with increased incidence of Type 2 Diabetes mellitus [1]. Diabetes has been a major public health problem in developed countries and has become so in developing countries. Overall, 2.3% of to-tal deaths among females and 1.6% of total deaths among males worldwide were due to Diabetes mellitus in 2004, and it was the tenth cause of death in middle-income countries [2]. Shaw et al [3] estimated that between 2010 and 2030, there would be a 69% and 20% increase in the number of adults aged 20-79 years with diabetes in developing and de-veloped countries, respectively. Shaw et al [3] also estimated that in the same period in Africa the prevalence of diabetes would increase from 3.8% to 4.7% in the same age group. In Lusaka, capital city of Zambia, Nsakashalo-Senkwe et al [4] reported prevalence of impaired glucose level and diabetes of 1.3% and 2.7%, respectively.
Diabetes and impaired fasting glucose levels have been repor-ted to be risk factors for cardiovascular disease [5, 6]. It has also been observed to be a leading cause of visual impairment and blindness [7] and kidney failure [8] and has also been associated with stroke [9]. The risk of lower limb amputation [9] and tuberculosis [10] have been reported to be at least 10 times and three times more in people with diabetes than in non diabetic persons, respectively.
Although prevalence of diabetes in rural parts of low- and middle-income countries rose dramatically from 1.8% in
1985-1989 to 8.6% in 2005-2010 [11], there is no informa-tion on the extent of the problem of impaired fasting glucose level in rural areas of Zambia. The study in an urban setting in Zambia found that age and mild hypertension were associa-ted with diabetes. However, risk factors for diabetes may vary according to the socio-economic developmental stages of the population [12]. Hence, it is important that factors associated with impaired fasting glucose level are determined for each population to design appropriate interventions for control of diabetes. The objective of this study was to determine the prevalence and correlates of impaired fasting glucose level in Kaoma and Kasama rural districts of Zambia, with a view to contribute to the body of knowledge on diabetes in rural areas of low- and middle-income countries.
Methods
The research methods that were used in the current study are the same as those that have been described in the Lusaka and Kitwe studies [13, 14]. However, the methods that were used in the current study are highlighted below.
Study area
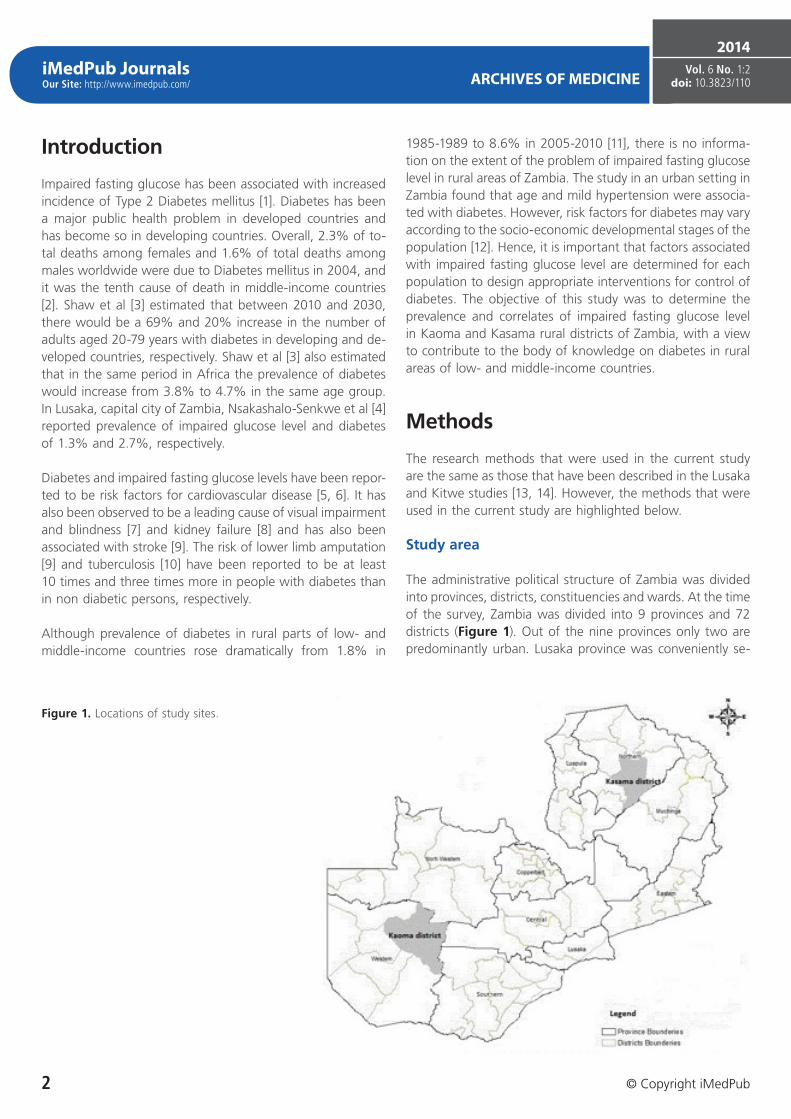
The administrative political structure of Zambia was divided into provinces, districts, constituencies and wards. At the time of the survey, Zambia was divided into 9 provinces and 72 districts (Figure 1). Out of the nine provinces only two are predominantly urban. Lusaka province was conveniently se-
Figure 1. Locations of study sites.
ARCHIVES OF MEDICINE
© Copyright iMedPub
2014Vol. 6 No. 1:2
doi: 10.3823/110
3
iMedPub JournalsOur Site: http://www.imedpub.com/
lected to represent the other urban province. Hence, only 8 provinces comprised the sampling frame.
Kaoma district was one of the 8 districts in Western provin-ce. Kaoma had 3 constituencies with a total of 20 wards. Meanwhile, Kasama district was one of the 12 districts in Northern province. It had 2 constituencies with a total of 15 wards. The population sizes for Kaoma and Kasama districts were 162,568 and 170,929, respectively [15]. In its Living Con-ditions Monitoring Survey Report, CSO [16] estimated the distribution of the population residing in rural areas in Wes-tern and Northern provinces at 87% and 89%, respectively. Meanwhile, the incidence of poverty in Western and Nor-thern provinces was estimated at 65% and 81%, respectively. School attendance rate for the primary school age population (7-13 years) was estimated at 64% in Western province and 73% in Northern province [16].
Study design, sample size and sampling
A cross sectional study using a modified World Health Or-ganization (WHO) global non communicable diseases (NCD) surveillance initiative NCD-STEP wise approach was used in the study [17].
A Statcal program in EPI INFO version 6.04 was used to es-timate the sample size. Upon considering a 50% prevalence rate (as no estimate existed) to be estimated within 5%, 8 provinces and a design effect of 2 (http://applications.emro.who.int/dsaf/EMPUB_2012_ 864.pdf), a sample size of 6128 was computed. After adjusting for 80% response rate, a sample size of 7660 was determined. The sample size was proportionally allocated to 8 provinces. The sample size was powered to produce estimates at the provincial level. Of the 7660 participants, 766 were to be selected from Kaoma and 843 from Kasama . These sample sizes were increased to 893 in Kaoma and 1196 in Kasama because extra reagent strips for glucose and cholesterol were soon to expire.
A multi-stage sampling technique was used to sample the participants in both Kaoma and Kasama districts. Firstly, wards were randomly selected from each constituency. In the second stage of sampling, standard enumeration areas (SEAs) were proportionally selected to the ward size. Finally from the selected SEAs, households were systematically sampled. All individuals (male or female) aged 25 years or older in a selected household were eligible to participate in the study. This was opposed to randomly selecting one individual from a selected household as recommended by the WHO STEP wise methodology [17].
The study protocol was reviewed and approved by the Uni-versity of Zambia Biomedical Research Ethics Committee. Per-
mission to conduct the survey was obtained from the Ministry of Health [Zambia]. Informed consent was obtained after the interviewer explained among others the purpose of the study, benefits and risks for taking part in the study to the eligible participants. Entry forms were viewed only by approved study personnel.
Data collection and definitions of variables Data collection. A modified WHO STEP wise questionnaire [17] comprising section on behavioral measurements (Step 1), physical measurements (Step 2) and biochemical measu-rements (Step 3) was used to collect data. Interviews were conducted at homesteads with some measurements being conducted in private areas of the homestead. Cards were shown to explain the meaning of some of the terms in ob-taining some of the behavioral measurements.
Education. Information on education was obtained by asking the question: What is the highest level of education you have completed? The responses were: No formal schooling, Less than primary school, Primary school completed, Secondary school completed, High school completed, College/University completed, Postgraduate degree, or Refused.
Alcohol. Information on alcohol consumption was obtained by asking the question: Have you consumed an alcoholic drink within the past 30 days? Responses were either Yes or No.
Sedentary behavior. Information on sedentary behavior was obtained by asking the question: How much time do you usually spend sitting or reclining on a typical day? The question excluded time spent sleeping. The variable was ob-tained in hours and minutes.
Blood pressure. Blood pressure readings were taken using the Omron Digital Automatic BP Monitor M4-1 (OMRON Healthcare Europe BV, The Netherlands). Three readings were obtained and an average of the three readings was conside-red the final reading for blood pressure. This was opposed to averaging the last two readings as recommended by the WHO STEP wise methodology [17]. Blood pressure readings were taken after the questionnaire was administered. This allowed participants to have rested before taking the first rea-ding. The subsequent readings were taken 3 minutes apart.
Height and weight. The Seca Brand 214 Portable Stadio-meter (Secagmbh & Co. kg Hamburg, German) was used to measure the height which was obtained in centimetres to one decimal point. Meanwhile, weight was measured in kilograms to one decimal point using the Heine Portable Professional Adult Scale 737 (Secagmbh & Co. kg Hamburg, German).
iMedPub JournalsOur Site: http://www.imedpub.com/ ARCHIVES OF MEDICINE
4 © Copyright iMedPub
2014Vol. 6 No. 1:2
doi: 10.3823/110
Heart rate. The heart rate was reported in beats per minute using the ORMRON digital automatic blood pressure moni-tor M4-1 (OMRON Healthcare Europe BV, The Netherlands). Three readings were taken spaced three minutes apart at the time blood pressure readings were taken.
Cholesterol and glucose. The Accutrend GCT (Glucose, Cholesterol and Triglycerides) Meter Three-in-One system was use to estimate total cholesterol and fasting glucose le-vels that were recorded in mmol/L. To determine if the par-ticipant had fasted, the participant was asked the question: During the past 12 hours have you had anything to eat or drink, other than water? If the participant responded yes, the participant was asked again the same question to double check that he/she had fasted just before taking the reading. The following questions were also asked to the participant to check if he/she was on treatment for blood glucose or total cholesterol: Today, have you taken insulin or other drugs (medication) that have been prescribed by a doctor or other health worker for raised blood glucose? The question relating to total cholesterol was: During the past two weeks, have you been treated for raised cholesterol with drugs (medication) prescribed by a doctor or other health worker?
Definitions. Education was categorized into: None, Primary, and Secondary or higher. Time spent sitting or reclining (sedentary behavior) was categorized into <3.5 and 3.5 or
more hours. Body mass Index (BMI) was computed by divi-ding weight (kg) by height squared (m2) and categorized as <18.5 (underweight), 18.5-24.9 (normal weight), 25.0-29.9 (overweight), and 30+ (obese) kg/m2; participants with blood pressure readings of more than 140/90 were considered to indicate hypertension [17]. Participants who were on antihy-pertensive medication were also included in the high blood pressure group. Total cholesterol was categorized into two groups: <5.2 (normal) and 5.2 or more (impaired) mmol/L. Participants who were on treatment for high cholesterol were also categorized as having impaired cholesterol levels despite their readings during the survey. Heart rate was categorized into <60 (low), 60-90 (normal), and >90 (high) beats/minu-te. Glucose level was categorized into: 3.3-5.5 (normal) and <3.3/>5.5 (impaired) fasting glucose level. Participants who were on treatment for raised blood glucose were also cate-gorised as having impaired fasting glucose levels despite their readings at the time of the survey.
Data management and analysis
Data management. The Epi Data software was used to en-ter data by two data entry clerks. The data entry screen had consistency and range checks embedded in it. Data were do-uble entered and validated. The validated data was exported to SPSS version 11.5 for analysis.
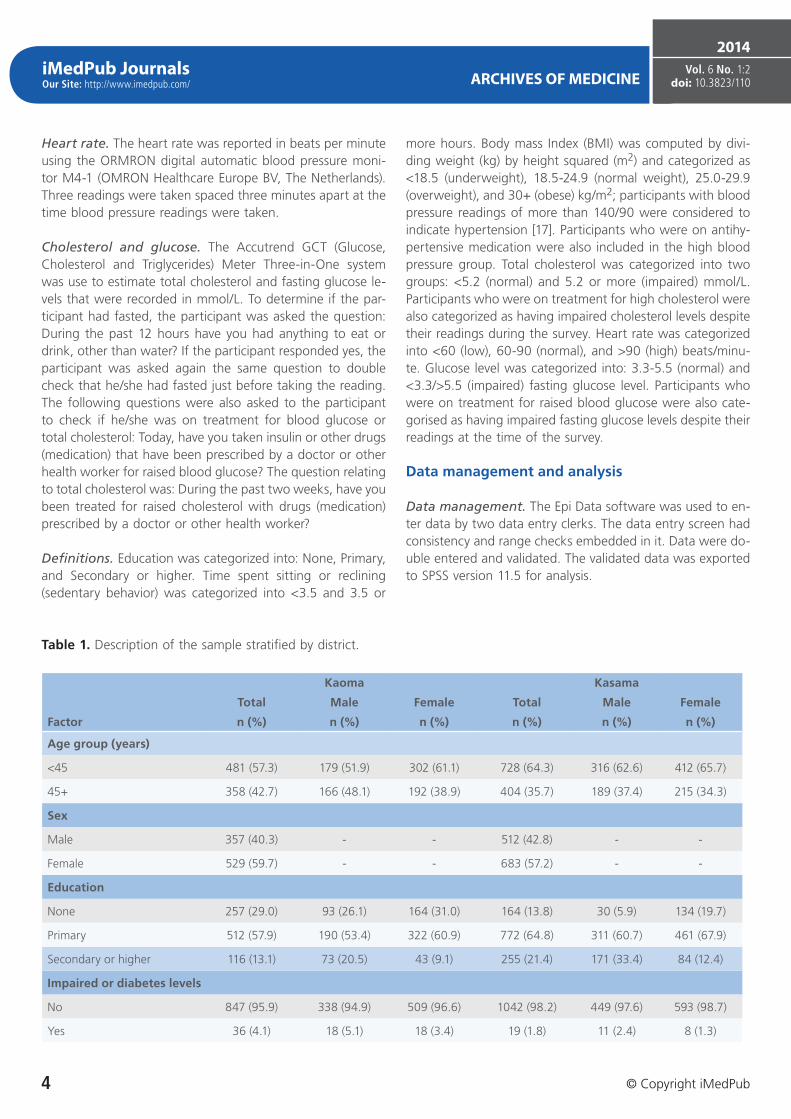
Table 1. Description of the sample stratified by district.
Kaoma Kasama
Total Male Female Total Male Female
Factor n (%) n (%) n (%) n (%) n (%) n (%)
Age group (years)
<45 481 (57.3) 179 (51.9) 302 (61.1) 728 (64.3) 316 (62.6) 412 (65.7)
45+ 358 (42.7) 166 (48.1) 192 (38.9) 404 (35.7) 189 (37.4) 215 (34.3)
Sex
Male 357 (40.3) - - 512 (42.8) - -
Female 529 (59.7) - - 683 (57.2) - -
Education
None 257 (29.0) 93 (26.1) 164 (31.0) 164 (13.8) 30 (5.9) 134 (19.7)
Primary 512 (57.9) 190 (53.4) 322 (60.9) 772 (64.8) 311 (60.7) 461 (67.9)
Secondary or higher 116 (13.1) 73 (20.5) 43 (9.1) 255 (21.4) 171 (33.4) 84 (12.4)
Impaired or diabetes levels
No 847 (95.9) 338 (94.9) 509 (96.6) 1042 (98.2) 449 (97.6) 593 (98.7)
Yes 36 (4.1) 18 (5.1) 18 (3.4) 19 (1.8) 11 (2.4) 8 (1.3)
ARCHIVES OF MEDICINE
© Copyright iMedPub
2014Vol. 6 No. 1:2
doi: 10.3823/110
5
iMedPub JournalsOur Site: http://www.imedpub.com/
Data Analysis. Proportions of the outcome variables and socio-demographic variables were calculated. Bivariate and multivariate logistic regression analyses were conducted. Proportions were compared using the Yates’ corrected Chi-square test, and a result yielding a p value of less than 5% was considered statistically significant. Factors that were sta-tistically significantly associated with the outcome in bivariate analyses were considered in a multivariate logistic regression analysis using a backward variable selection method. Odds ratios and their 95% confidence intervals are reported.
Results
A total of 2093 (895 from Kaoma and 1198 from Kasama) participants took part in the surveys. Table 1 presents a des-cription of the sample. The proportion of male participants was similar between the two districts (40.3% in Kaoma and 42.8% in Kasama, p=0.262).
Male participants in Kaoma tended to be older than those in Kasama (42.7% vs 35.7% were of age 45 years or older, respectively; p=0.007) but no significant difference in the distribution of age was observed among female participants between the two districts (p=0.238). While males (48.1% aged 45 years or older) were significantly older than females (38.9% aged 45 years or older) in Kaoma, no significant diffe-rence in the age distribution was observed between gender in Kasama (p=0.435).
Both males and females in Kasama tended to be more edu-cated than those in Kaoma (p<0.001). Altogether, 13.1% of participants in Kaoma and 21.4% of participants in Kasama had attained secondary or higher levels of education. In both districts, males tended to be more educated than females (20.5% vs 9.1%, respectively, p<0.001, in Kaoma; and 33.4 vs 12.4%, respectively, p<0.001, in Kasama).
Overall, 4.1% (5.1% of males and 3.4% of females; p=0.300) of the participants in Kaoma and 1.8% (2.4% of males and 1.3% of females; p=0.291) of the participants in Kasama had impaired fasting glucose level. The prevalence of impaired fasting glucose level was significantly higher in Kaoma than Kasama (p=0.004).
Only 9(16.4%) out of 55 participants who had impaired fas-ting glucose level or diabetes were ever told by a doctor or other health worker that they had raised blood sugar or diabetes. Of these 9 participants, 5 were on insulin, 7 took drugs for diabetes past two weeks prior to the survey, 7 were advised to lose weight, 6 were advised to stop smoking, and all nine participants were advised to be on special diet and to start or do more exercises.
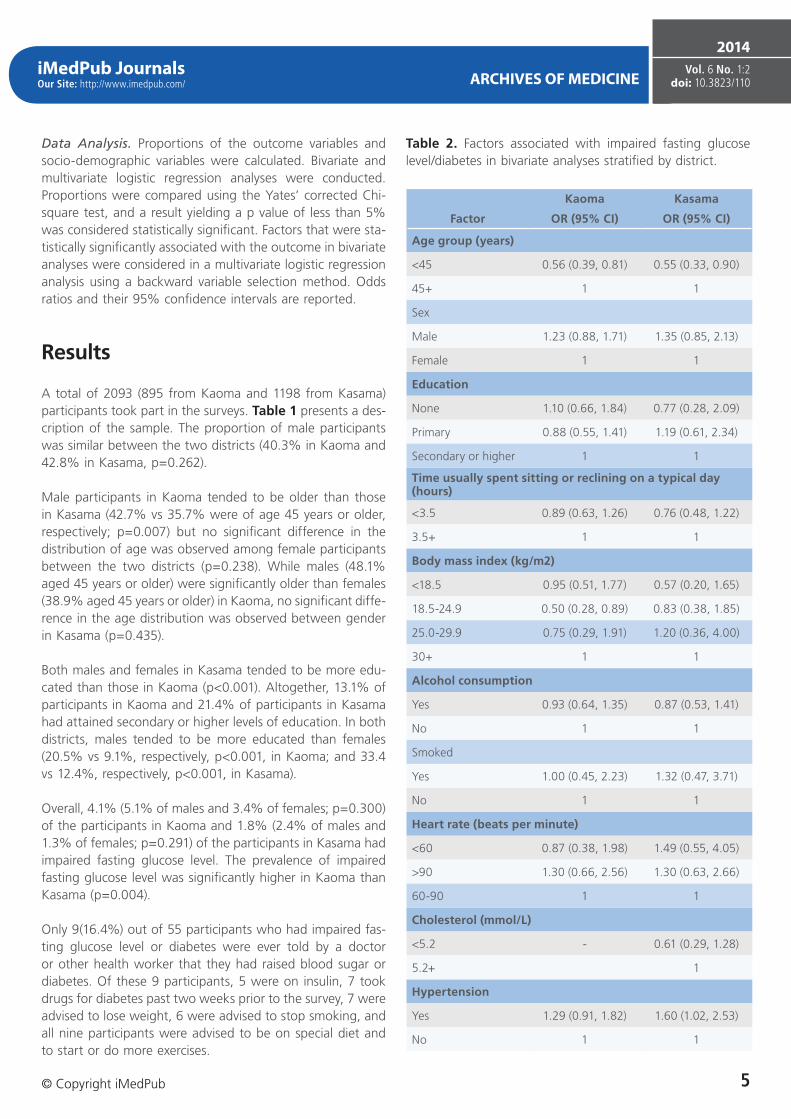
Table 2. Factors associated with impaired fasting glucose level/diabetes in bivariate analyses stratified by district.
Kaoma Kasama
Factor OR (95% CI) OR (95% CI)
Age group (years)
<45 0.56 (0.39, 0.81) 0.55 (0.33, 0.90)
45+ 1 1
Sex
Male 1.23 (0.88, 1.71) 1.35 (0.85, 2.13)
Female 1 1
Education
None 1.10 (0.66, 1.84) 0.77 (0.28, 2.09)
Primary 0.88 (0.55, 1.41) 1.19 (0.61, 2.34)
Secondary or higher 1 1
Time usually spent sitting or reclining on a typical day (hours)
<3.5 0.89 (0.63, 1.26) 0.76 (0.48, 1.22)
3.5+ 1 1
Body mass index (kg/m2)
<18.5 0.95 (0.51, 1.77) 0.57 (0.20, 1.65)
18.5-24.9 0.50 (0.28, 0.89) 0.83 (0.38, 1.85)
25.0-29.9 0.75 (0.29, 1.91) 1.20 (0.36, 4.00)
30+ 1 1
Alcohol consumption
Yes 0.93 (0.64, 1.35) 0.87 (0.53, 1.41)
No 1 1
Smoked
Yes 1.00 (0.45, 2.23) 1.32 (0.47, 3.71)
No 1 1
Heart rate (beats per minute)
<60 0.87 (0.38, 1.98) 1.49 (0.55, 4.05)
>90 1.30 (0.66, 2.56) 1.30 (0.63, 2.66)
60-90 1 1
Cholesterol (mmol/L)
<5.2 - 0.61 (0.29, 1.28)
5.2+ 1
Hypertension
Yes 1.29 (0.91, 1.82) 1.60 (1.02, 2.53)
No 1 1
iMedPub JournalsOur Site: http://www.imedpub.com/ ARCHIVES OF MEDICINE
6 © Copyright iMedPub
2014Vol. 6 No. 1:2
doi: 10.3823/110
In bivariate analyses (Table 2), age and BMI were significantly associated with impaired fasting glucose level in Kaoma. Meanwhile, age and hypertension were significantly associa-ted with impaired fasting glucose level in Kasama. However, in multivariate analysis, only age was significantly associa-ted with impaired fasting glucose level in both Kaoma and Kasama districts. Participants aged less than 45 years were less likely to have impaired fasting glucose level compared to those aged 45 years or older (OR=0.56, 95% CI [0.39, 0.81] in Kaoma, and OR=0.55, 95% CI [0.33, 0.89] in Kasama).
Discussion
In this population based survey, 4.1% (5.1% of males and 3.4% of females) of the participants in Kaoma and 1.8% (2.4% of males and 1.3% of females) of the participants in Kasama had impaired fasting glucose level. Age was indepen-dently significantly associated with impaired fasting level in both districts. The rate of 4.1% of impaired fasting glucose level observed in Kaoma compares with the rate found in Lu-saka of 4.0% [4]. Kaoma is located in Western province that had incidence of poverty estimated at 65%, while Lusaka had incidence of poverty estimated at 57%. Meanwhile, incidence of poverty for Northern province where Kasama district was located was estimated at 81% [16]. It was expected that the prevalence of impaired fasting glucose level to be higher in Kasama than in Kaoma and Lusaka. The observations in the current study and in Lusaka contradict the observation by Seligman et al [18] who observed that food insecurity was associated with diabetes. The difference in prevalence rates for diabetes in Kaoma and Kasama may partly be due to regionally-specific rural cultural norms that can undermine health [19, 20]. Higher prevalence of impaired fasting gluco-se level has also been reported in Northern Sudan of 9.9% among males and 7.5% among females [21].
In the current study, impaired fasting glucose level was as-sociated with older age groups. Similarly, Elbagir et al. [22] and Ramaiya et al. [23] reported that age was significantly associated with higher rates of diabetes. Development of dia-betes starts at younger ages [24], and control of diabetes in older age groups should be tailored at younger age groups.
Limitations
Despite that the study was highly powered given the lar-ge sample sizes, there are some limitations that should be highlighted. Firstly, as a cross sectional study, causation can-not be inferred to observed associations. More cases of dia-betes and individuals with impaired glucose levels might not
have been identified because impaired glucose test was not conducted. Hence, the observed prevalence of impaired fas-ting glucose level might have been underestimated. Lastly, it was not ascertained whether participants fasted before glu-cose readings were taken.
Conclusions
The prevalence of impaired fasting glucose level varied bet-ween the two rural districts in this study. Interventions to control diabetes should be district specific and targeted at younger age groups in order to prevent diabetes occurring in older age groups.
Acknowledgements
The research assistants are thanked for the successful surveys and to the participants are acknowledged for their coope-ration.
Funding
The World Health Organization Zambia Country office fun-ded the surveys.
Competing and Conflicting Interests
The authors declare that they have no conflict of interest.
ARCHIVES OF MEDICINE
© Copyright iMedPub
2014Vol. 6 No. 1:2
doi: 10.3823/110
7
iMedPub JournalsOur Site: http://www.imedpub.com/
References 1. Yeboah, J., Bertoni, AG., Herrington, DM., Post, WS., Burke, GL.
Impaired fasting glucose and the risk of incident diabetes mellitus and cardiovascular events in an adult population: MESA (Multi-Ethnic Study of Atherosclerosis). J Am Coll Cardiol. 2011; 58 (2): 140-6.
2. WHO. The global burden of disease. Geneva: World Health Organization; 2008.
3. Shaw, JE., Sicree, RA., Zimmet, PZ. Global estimates of the prevalence of diabetes for 2010 and 2030. Diabetes Res Clin Pract. 2010; 87 (1): 4-14.
4. Nsakashalo-Senkwe, M., Siziya, S., Goma, FM., Songolo, P., Mukonka, V., Babaniyi, O. Combined prevalence of impaired glucose level or diabetes and its correlates in Lusaka urban district, Zambia: A population based survey. Int Arch Med. 2011; 4 (1): 2.
5. Levitan, EB., Song, Y., Ford, ES., Liu, S. Is non-diabetic hyperglycaemia a risk factor for cardiovascular disease? A meta-analysis of prospective studies. Arch Intern Med. 2004; 164 (19): 2147-55.
6. Unwin, N., Shaw, NJ., Zimmet, P., Alberti, KG. Impaired glucose tolerance and impaired fasting glycaemia: The current status on definition and intervention. Diabetic Med. 2002; 19 (9): 708-23.
7. Resnikoff, S., Pascolini, D., Etya’ale, D., Kocur, I., Pararajasegaram, R., Pokharel, GP. et al. Global data on visual impairment in the year 2002. Bull World Health Organ. 2004; 82 (11): 844-51.
8. Icks, A., Haastert, B., Trautner, C., Giani, G., Glaeske, G., Hoffmann, F. Incidence of lower-limb amputations in the diabetic compared to the non-diabetic population. Findings from nationwide insurance data, Germany, 2005-2007. Exp Clin Endocrinol Diabetes. 2009; 117 (9): 500-4.
9. Boden-Albala, B., Cammack, S., Chong, J., Wang, C., Wright, C., Rundek, T. et al. Diabetes, fasting glucose levels, and risk of ischemic stroke and vascular events: Findings from the Northern Manhattan Study (NOMAS). Diabetes Care. 2008; 31 (6): 1132-7.
10. Jeon, CY., Murray, MB. Diabetes mellitus increases the risk of active tuberculosis: A systematic review of 13 observational studies. PLoS Med. 2008; 5 (7): e152.
11. Hwang, CK., Han, PV., Zabetian, A., Ali, MK., Narayan, KM. Rural diabetes prevalence quintuples over twenty-five years in low. and middle-income countries: A systematic review and meta-analysis. Diabetes Res Clin Pract. 2012; 96 (3): 271-85.
12. Al Zenki, S., Al Omirah, H., Al Hooti, S., Al Hamad, N., Jackson, RT., Rao, A. et al. High prevalence of metabolic syndrome among Kuwaiti adults — a wake-up call for public health intervention. Int J Environ Res Public Health. 2012; 9 (5): 1984-96.
13. Goma, FM., Nzala, SH., Babaniyi, O., Songolo, P., Zyaambo, C., Rudatsikira, E. et al. Prevalence of hypertension and its correlates in Lusaka urban district of Zambia: A population based survey. Int Arch Med. 2011; 4: 34.
14. Siziya, S., Rudatsikira, E., Babaniyi, O., Songolo, P., Mulenga, D., Muula, AS. Prevalence and correlates of hypertension among adults aged 25 years or older in a mining town of Kitwe, Zambia. J Hypertens. 2012; 1: 105.
15. CSO. Summary report for the 2000 census of population and housing. Lusaka: CSO; 2003.
16. CSO. Living conditions monitoring survey report 2002-2003. Lusaka: CSO, 2004.
17. WHO. WHO STEPS surveillance manual: The WHO STEP wise approach to chronic disease risk factor surveillance. Geneva: World Health organization; 2005.
18. Seligman, HK., Laraia, BA., Kushel, MB. Food insecurity is associated with chronic disease among low-income NHANES participants. J Nutr. 2010; 140 (2): 304-10.
19. Arcury, TA., Snively, BM., Bell, RA., Smith, SL., Stafford, JM., Wetmore-Arkader, LK. et al. Physical activity among rural older adults with diabetes. J Rural Health. 2006; 22 (2): 164-8.
20. Hartley, D. Rural health disparities, population health, and rural culture. Am J Public Health. 2004; 94 (10): 1675-8.
21. Elbagir, MN., Eltom, MA., Elmahadi, EM., Kadam, IM., Berne, C. A high prevalence of diabetes mellitus and impaired glucose in the Danagla community in northern Sudan. Diabetic Med. 1998; 15 (2): 164-9.
22. Elbagir, MN., Eltom, MA., Elmahadi, EM., Kadam, IM., Berne, C. A population based study of the prevalence of diabetes and impaired glucose tolerance in adults in northern Sudan. Diabetes Care. 1996; 19 (10): 1126-8.
23. Ramaiya, KL., Swai, AB., McLarty, DG., Alberti, KG. Impaired glucose tolerance and diabetes mellitus in Hindu Indian immigrants in Dar es Salaam. Diabetic Med. 1991; 8 (8): 738-44.
24. Danne, T., Aschemeier, B., Perfetti, R. SWEET group. SWEET – where are we heading with international type 1 diabetes registries? Pediatric Diabetes 2012; 13 (Suppl. 16): 1-4.
✓ Archives of Medicine encompasses all aspects of medical science and clinical practice and cooperates closely with
✓ Archivos de Medicina, a Spanish-language open access journal.
Submit your manuscript here:
Archives of Medicine http://www.archivesofmedicine.com
Archivos de Medicinahttp://www.archivosdemedicina.com
Publish with iMedPub
http://www.imedpub.com
Follow us:
Where Doctors exchange clinical experiences, review their cases and share clinical knowled-ge. You can also access lots of medical publi-cations for free. Join Now!
http://medicalia.ning.com/
Medicalia.org
Related Documents