IMPACT OF FOREIGN DIRECT INVESTMENT ON DOMESTIC INVESTMENT: EVIDENCE FROM SUB-SAHARAN AFRICA JESSIE WORAEWAA ACQUAH Bachelor of Arts, Kwame Nkrumah University of Science and Technology, 2013 A Thesis Submitted to the School of Graduate Studies of the University of Lethbridge in Partial Fulfilment of the Requirements for the Degree MASTER OF ARTS Department of Economics University of Lethbridge LETHBRIDGE, ALBERTA, CANADA © Jessie Woraewaa Acquah, 2017

Welcome message from author
This document is posted to help you gain knowledge. Please leave a comment to let me know what you think about it! Share it to your friends and learn new things together.
Transcript
IMPACT OF FOREIGN DIRECT INVESTMENT ON DOMESTIC
INVESTMENT:
EVIDENCE FROM SUB-SAHARAN AFRICA
JESSIE WORAEWAA ACQUAH
Bachelor of Arts, Kwame Nkrumah University of Science and Technology, 2013
A Thesis
Submitted to the School of Graduate Studies
of the University of Lethbridge
in Partial Fulfilment of the
Requirements for the Degree
MASTER OF ARTS
Department of Economics
University of Lethbridge
LETHBRIDGE, ALBERTA, CANADA
© Jessie Woraewaa Acquah, 2017
ii
IMPACT OF FOREIGN DIRECT INVESTMENT ON DOMESTIC INVESTMENT:
EVIDENCE FROM SUB-SAHARAN AFRICA
JESSIE WORAEWAA ACQUAH
Date of Defence: December 21, 2016
Dr. Pascal Ghazalian Associate Professor Ph.D.
Supervisor
Dr. Kien Tran Professor Ph.D.
Thesis Examination Committee Member
Dr. Stavroula Malla Associate Professor Ph.D.
Thesis Examination Committee Member
Dr. Richard Mueller Professor Ph.D.
Chair, Thesis Examination Committee

iii
DEDICATION
I dedicate this thesis to my family. My mother Rev. Elizabeth Geraldine Ansa Acquah,
and my brothers Bernard and Claus. And to all my extended family and friends on whose
shoulders I have come this far.
iv
ABSTRACT
This study examines the impact of Foreign Direct Investment (FDI) on domestic investment
for 36 countries in Sub-Saharan Africa (SSA) over the time period 1980–2014, and over
two time sub-periods, 1980–1994 and 1995–2014. We investigate whether increased efforts
in SSA to attract more FDI have resulted in positive implications of FDI on domestic
investment over the years. Our results from the System Generalized Method of Moments
(SYS-GMM) estimations suggest that FDI inflows have led to crowding-in of domestic
investment for the total time period, and particularly in the second time sub-period. Next,
we examine whether the positive effect of FDI on domestic investment occurs in the case
of smaller regional groups in SSA. Therefore, we implement the empirical analysis for five
selected Regional Economic Communities (RECs) in SSA, covering: Common Market for
Eastern and Southern Africa (COMESA), East African Community (EAC), Economic
Community of Central African States (ECCAS), Economic Community of West African
States (ECOWAS), and Southern African Development Community (SADC). The results
generally show positive impacts of FDI on domestic investment across these RECs, which
are consistent with the results obtained for the full sample. We find significant positive
effects for COMESA in the first time period, and for ECCAS, ECOWAS, and SADC in the
second time period. We extend the empirical analysis by investigating the role played by
three development variables (financial development, human capital, and export sector
development) in the effect of FDI on domestic investment in SSA. The results show that
financial development and human capital tend to lessen the crowding-in effect of FDI on
domestic investment in SSA, and could eventually lead to a crowding-out of domestic
investment after a certain threshold. In contrast, the results indicate that export sector

v
development tend to augment the crowding-in effect of FDI on domestic investment in
SSA.
vi
ACKNOWLEDGEMENTS
I would like to express my heartfelt gratitude and appreciation to everyone who assisted
me in completing this thesis. I thank the good Lord for providing this opportunity to pursue
this degree, and granting me strength and wisdom to accomplish it. I would like to
appreciate my supervisor Dr. Pascal Ghazalian for his guidance and contributions towards
this thesis.
I wish to express my deepest thanks to my supervisory committee members Dr.
Kien Tran and Dr. Stavroula Malla for their invaluable comments and suggestions. Also, I
wish to express my gratitude to Dr. Alexander Darku for his vital comments and
mentorship. My sincerest thanks goes to the faculty and staff of the Department of
Economics, especially Dr. Richard Mueller and Merle Christie. I am thankful to my
colleagues, friends, and newfound family Cosmas Dery, Prince Obeng, Richard Yeboah,
Solomon Akowuah, Kwaku Addo, Eric Agyemang, Adriana Appau, Elizabeth Sogah,
Andrew Aryee, Antonio Medah and family, Rev. Isaac Amokwandoh and family, Ekow
Botwe, Nana Esi Botwe, Myranda Price, Grace Devries, and everyone else who supported
me during my graduate studies.
I am immensely grateful for the love, support and prayers of my mother Rev.
Elizabeth Ansa Acquah and my entire family. I could not have done this without your
support. God bless you all.
vii
TABLE OF CONTENTS
Approval/ Signature Page ii
Dedication iii
Abstract iv
Acknowledgement vi
Table of Contents vii
List of Tables viii
List of Figures ix
List of Abbreviations x
1. INTRODUCTION ........................................................................................................ 1
1.1 Background ............................................................................................................ 3
1.3 FDI Trends – World and Developing Regions ..................................................... 15
1.3 Objectives ............................................................................................................. 16
1.4 Thesis Contribution .............................................................................................. 18
1.5 Thesis Organization .............................................................................................. 18
2. TRENDS IN FDI ........................................................................................................ 19
2.1 Inward FDI Trends in Africa and Regional Economic Communities ................. 19
2.2 Trends in Human Capital, Financial Development and Export in Africa ........... 27
3. LITERATURE REVIEW ......................................................................................... 31
4. METHODOLOGY AND MODEL SPECIFICATION ........................................... 40
4.1 Model Specification .............................................................................................. 40
4.2 Estimation Method ............................................................................................... 46
4.3 Data Description .................................................................................................. 49
5. EMPIRICAL ESTIMATION AND RESULTS ....................................................... 52
5.1 Impact of FDI on Domestic Investment for SSA ................................................. 52
5.2 Threshold Analysis ............................................................................................... 63
6. SUMMARY AND CONCLUSIONS .......................................................................... 69
6.1 Summary ............................................................................................................... 69
6.2 Policy Implications and Recommendations ......................................................... 72
REFERENCES ................................................................................................................. 76
APPENDIX ....................................................................................................................... 82
viii
LIST OF TABLES
5.1 Effect of FDI on Domestic Investment (SSA 1980-2014) .................................... 53
5.1 Effect of FDI on Domestic Investment (SSA 1980-2014) .................................... 55
5.2 Effect of FDI on Domestic Investment (SSA 1995-2014) .................................... 56
5.4 System GMM Estimation (SSA RECs 1980-1994) ............................................. 59
5.5 System GMM Estimation (SSA RECs 1995-2014) ............................................. 60
5.6 System GMM Estimation Results for Thresholds (1980-1994) ........................... 64
5.7 System GMM Estimation Results for Thresholds (1995-2014) ........................... 65

ix
LIST OF FIGURES
1.1 Inward FDI Flow – World and Developing Economies .......................................... 12
2.1 Inward FDI Flow to Sub-Saharan Africa ................................................................. 21
2.2 Evolution of FDI Flows to Five RECs in SSA ....................................................... 22
x
LIST OF ABBREVIATIONS
A-H: Anderson-Hsiao
AU: African Union
CACEU: Central African Customs and Economic Union
COMESA: Common Market for Eastern and Southern Africa
COPAX: Council of Peace and Security in Central Africa
DIFF-GMM: Difference Generalized Method of Moments
EAC: East African Community
ECCAS: Economic Community of Central African States
ECGLC: Economic Community of the Great Lakes Countries
ECOWAS: Economic Community of West African States
EPA: Economic Partnership Agreement
EU: European Union
FDI: Foreign Direct Investment
FE: Fixed Effects Estimation
GDP: Gross Domestic Product
GMM: Generalized Method of Moments
HRS: Hecht Razin Shinar Model
IFI: International Financial Institution
IV: Instrumental Variable Estimation
MENA: Middle East and North Africa
MDGs: Millennium Development Goals
MNC: Multi-national Corporation
NEPAD: New Partnership for African Development
OAU: Organization of African Unity
OECD: Organization for Economic Co-operation and Development
OLS: Ordinary Least Squares
RE: Random Effects Estimation
REC: Regional Economic Community
SADC: Southern African Development Community

xi
SAP: Structural Adjustment Program
SSA: Sub- Saharan Africa
SYS-GMM: System Generalized Method of Moments
UNCTAD: United Nations Conference on Trade and Development
1
CHAPTER ONE
1. INTRODUCTION
Due to the increasing globalization of the world economy and the liberalization of exchange
controls and market access, there is a large amount of capital that moves across borders.
Most economists encourage the free flow of capital across national borders mainly because
it allows capital to seek the highest return. According to Feldstein (2000), the free flow of
capital also assists in diversification of assets and reduction of the risks faced by capital
owners. Further, global capital mobility encourages the transfer of best practices of
corporate governance, accounting rules and legal traditions, especially to developing areas
such as Sub-Saharan Africa (SSA), where most of the economies are still in the process of
switching from primary production to industrial organization. Global capital mobility also
limits governments from pursuing bad policies.
Generally, international capital flows are either in the form of portfolio investments,
Foreign Direct Investment (FDI) or loans. FDI however makes up a large part of foreign
capital flows. Whereas other forms of private capital flows typically experience large
reversals during financial crises, FDI has proven to be remarkably stable and resilient
during global financial turmoil. FDI presents a more locked-in or secured investment, and
it is not likely to be reversed at the first sign of local or global financial crisis (Loungani
and Razin, 2001). FDI flows have also been noted to increase even when world trade flows
slow down (Moosa, 2002). Since the end of the Bretton Woods system, many studies have
investigated the contribution of inward FDI to the development of host countries. The
acclaimed benefits of FDI are needed most in developing regions such as SSA, where FDI
2
now serves as a vital means of private external finance. The increase in the volume of global
FDI flows could have occurred because of the fact that most developing countries have
accepted FDI as a key component in achieving economic development, and thus have
engaged in various efforts to attract the maximum possible portion of global FDI into their
economies. In principle, there are various channels through which FDI can contribute to
investment and growth in host economies, especially developing ones. The advantages that
FDI brings to host countries include the transfer of technology, mainly in the form of new
varieties of capital inputs that cannot be achieved through domestic capital mobilization.
FDI can also stimulate competition in the domestic input market. Host countries benefit
from human capital development through employee training in the course of operating the
new businesses. Profits from FDI also add to corporate tax revenue in the host countries
(Feldstein, 2000).
The level of investment of a country is one of the main determinants of economic
growth and development. However, in most developing economies, actual domestic
investment falls short of the desired volume required to cause a significant increase in Gross
Domestic Product (GDP) growth. FDI is therefore seen as a means to bridge the gap
between a country’s domestic investment and the optimal levels of investment. As
suggested by modern growth theories, FDI greatly improves the economic prospects of a
country, with linkage through channels like capital accumulation, transfer of technology,
transfer of skills and financing current account deficits. As a result, policies and programs
in developing regions like SSA have been geared towards attracting more foreign
investment. This is also in line with the proposition of most post World War II economists,
3
who encouraged outward-oriented policies as opposed to inward-oriented policies as a
means of achieving economic progress in developing countries1.
The SSA region has evolved in the policies that it has enforced over the years to
attract FDI and to ensure that the benefits of FDI are fully reflected in the continent’s
development. After gaining independence from various colonial regimes, regional
integration efforts in Africa have gradually intensified. The focus began with import-
substituting industrialization, but eventually the continent has opened up to International
Financial Institutions (IFIs) in order to receive economic assistance. Although some
regional economic communities (RECs; also referred to in this thesis as sub-regions or
regional economic blocs) were initiated in the post-independence era, it was the idea of an
African Economic Community under the Organization of African Unity (OAU) in the
1980s that cemented the establishment of RECs in Africa. These RECs struggled with
success in the beginning, but in recent years with the reshaping of the continent’s economic
focus, there has been a new approach to regional integration aimed at achieving better
economic success in Africa. Investment has been a core focus of these RECs from their
inception, and they have been very instrumental in attracting and directing the course of
FDI in SSA.
1.1 Background
Foreign direct investment is largely carried out by Multi-national Corporations (MNCs).
MNCs carry out net transfers of real capital from one country to another, and they represent
entry into a host economy by a business organization established in a foreign market. MNCs
1 The so-called “Financing Gap Model” as evidenced in early growth theories by Harrod (1939) and Domar
(1946).
4
are vital for carrying out important roles through direct investment. The FDI process occurs
when parent corporations carry out vertical or horizontal expansion of operations. FDI also
occurs when parent companies diversify conglomerates. By broadening their operations to
produce the same good abroad, international corporations take advantage of horizontal
expansions to profit from introducing some highly demanded commodity straight into
geographically segmented or tariff controlled markets (Brainard, 1997; Barba-Navaretti et
al., 2004). Vertical expansions are profitable to MNCs by providing cheaper markets within
which to produce intermediary goods (Caves, 1971). This is often the case with developing
regions like Africa, with favourable exchange rates and relative abundance of labour.
MNCs continue to employ an increasing share of labour in developing countries.
Although MNCs introduce new technologies and fill-in investment, managerial,
foreign exchange and tax revenue gaps, it is also argued that they mostly propagate high
tastes and style of living, and thus widen the existing divide between the rich and the poor
in developing countries. On the extreme end, some view FDI as a form of neocolonialism,
considering that former colonized areas like Africa had to agree to open up their economies
in the early 1980s in order to receive assistance from the World Bank and the International
Monetary Fund (IMF). Host countries sometimes have to forgo the benefit of corporate tax
revenue by cutting taxes in an attempt to attract FDI from other locations. There are also
instances where operations of MNCs rather reduce foreign exchange earnings. In some
cases, technologies introduced do not take into account local skills and thus stifle
indigenous entrepreneurship. MNCs may also lower domestic investment by using their
bargaining power to obtain exclusive production agreements that stifle local competition.
Investment to the local firms also suffers when MNCs raise capital in the developing
5
country, since MNCs’ profitability is often higher than that of domestic firms. All of these
could have a potentially negative impact on economic development. Overall, it is mostly
observed that these MNCs are mainly concerned with making profits and expanding their
market power, and not with the development goals of their host economies.
Since domestic investment is recognized as a vital determinant of economic
development, and FDI is being increasingly encouraged as a means to fill-in domestic
investment gaps in developing regions, it is important that FDI would have a
complementing (crowding-in) effect instead of crowding-out effect on domestic
investment. For example, Moosa (2002) argues that a crowding-out effect of FDI would
prove counter-productive to the economy. One may however argue in favour of a crowding-
out effect of domestic investment, since studies such as Borensztein et al. (1998) find that
FDI is more efficient than domestic investment in developing countries. This result is not
surprising, since in most developing countries, not only is domestic capital below optimal
levels, but technological constraints mean that domestic capital is less productive than
foreign capital, especially from more technologically advanced economies. However, if
foreign investment crowds out domestic investment, especially in a developing region like
SSA, it would eventually create unstable economies that are solely dependent on foreign
capital inflows. Overall, a crowding-in effect of FDI on domestic investment is most
desirable because this generates spillovers to the domestic economy that make it possible
to accomplish sustainable economic development. These include complementarity to
domestic production, higher domestic capital efficiency, and many more benefits to the
host country such as those outlined earlier in our study.
6
Africa, the world’s most resource-rich continent continues to struggle with
achieving significant economic development, and thus remains the world’s poorest
continent. All African countries are developing countries according to the IMF, and more
than fifty percent of least developed countries in the world are in Africa. There appears to
be a lapse in the continent’s ability to capitalize on its rich resources to stimulate economic
development and guarantee a better standard of living for its inhabitants. In the face of this
challenge, the region has made efforts to increase investment in the continent, and much of
it has been geared toward attracting FDI. Most African countries have improved the climate
for business operation within their economies by increasing political and economic
stability, and by implementing policies designed to attract more FDI. The African Union
(AU) formed the Private Sector Development, Investment and Resource Mobilization
Division, and all the regional economic blocs have investment initiatives. As a whole, the
continent has also launched the New Partnership for African Development (NEPAD),
which, according to Funke and Nsouli (2003), has the intensification of FDI flow towards
the region as one of its key objectives.
One of the channels through which FDI improves the economic prospects of an
economy is by making it more attractive to foreign investors. If FDI complements domestic
investment, this increases economic activity and therefore increases the location advantages
which attract FDI into the economy. Therefore, domestic investment has a key role to play
here, since capital formation occurs when there is a functioning domestic cycle of
production, income and savings. The capacity for domestic capital formation thus indicates
the presence of a stable environment and profitable opportunities for investors, including
foreign ones. Consequently, if foreign investment augments domestic investment it could
7
lay the foundation for a virtuous cycle of increased production that would bring about the
kind of rapid and sustainable development much needed in developing regions such as
SSA.
The potential of FDI to impact domestic investment and economic development
makes it an area of extensive research. Many empirical studies have been conducted to
explore the effect of FDI on domestic investment. Whether FDI complements or substitutes
domestic investment remains an ongoing debate among economists and policy makers.
Results of empirical research on this subject are mixed. This is mainly due to how broadly
or narrowly the key variables are measured and the varying judgments of appropriate
econometric models and tests of sensitivity. There are also differences due to the quality
and detail of the actual data analyzed. A study by Ullah et al. (2014) considers the
interaction between FDI, domestic investment and growth. The results in this study show
that FDI is able to supplement domestic investment and vice versa. A study by Acar (2012)
on the effect of foreign investment on domestic investment for countries located in the
Middle East and North Africa (MENA) region shows, however, that FDI crowds out
domestic investment in the region. A regional study by Fry (1993) for five Pacific Basin
countries and a control group of eleven other developing countries finds that FDI causes
domestic investment to fall for the total sample. Meanwhile, for the five Pacific Basin
countries, FDI increases domestic investment by the full amount of the FDI flow. The study
concludes that the impact of FDI on domestic investment differs significantly by location.
Agosin and Mayer (2000) also conduct a study on developing countries, to explore the
direction in which FDI affects domestic investment for countries in the developing regions
of Africa, Asia and Latin America. The results in this study show strong crowding-in effect
8
in Asia, but less in Africa. In Latin America however, this study finds evidence of strong
crowding-out effect.
Evidence from existing research therefore shows that the effect of FDI on domestic
investment differs not only by country/region, but also depends on the existing economic
conditions and policy of the country/region. These conditions encompass the absorptive
capacity of a country’s institutions and organizations, and are important factors in attracting
FDI, and in determining a country’s ability to derive positive spillover effects from FDI. It
is believed that to succeed in the global market, MNCs must have some competitive
advantages. These firm-specific advantages are often technological in nature. Host
economies therefore need to be able to identify these advantages, and have the appropriate
structures to adapt and develop them to fit domestic needs. According to Narula (2004),
technology flows from FDI may have little or no effect on economic development without
absorptive capacity, and also, different stages of development require different levels of
absorptive capacity, and this relationship is not always in the same direction. There are
numerous factors that can be considered to enhance FDI’s effect on development,
depending on how broadly we define the absorptive capacity of an economy. Some of these
factors that make up a country’s absorptive capacity include infrastructure, which consists
of knowledge infrastructure (Smith, 1997) such as public research institutes, universities,
organizations for standards, and intellectual property protection agencies. Again, according
to Globerman and Shapiro (2002), the political, institutional and legal environment that
make up the government infrastructure of a country is crucial to FDI inflows as well as
outflows. The level of government infrastructure does not only draw in foreign capital, but
also forms a constructive environment within which domestic industries can grow and also
9
emerge as MNCs. Subsequently, we consider three key factors – human capital, financial
sector development and export sector development – that influence the effect of FDI on
domestic investment for developing regions such as Africa.
First, we look at human capital level, which in itself is an indicator of economic
development. The level of human capital in developing areas like Africa is known to be
low. However, human capital is considered one of the most important determinants in
attracting inward FDI, and affects the geographical distribution of FDI even within a
country (Noorbakhsh et al., 2001). Human capital is also one of the channels through which
FDI impacts a country’s domestic investment and is therefore key in determining whether
this effect is positive or negative. Human capital levels determine how knowledge from
FDI technological innovations are diffused and consequently utilized in an efficient
manner. A substantial level of human capital will aid in the adaptation of the superior
managerial and organizational techniques that are part of MNCs’ competitive advantage.
As these get transferred to local industries, it improves the efficiency of domestic capital
formation. Results in Borensztein et al. (1998) further show that the contribution of FDI to
economic growth is enhanced by the interaction between FDI and the level of human capital
in the host country.
There is also evidence showing that countries with developed financial markets gain
more from FDI inflows. With or without the presence of FDI, financial development is
needed for domestic capital formation. Among other things, the financial sector facilitates
the conversion of a nation’s savings into investment and local business financing. Financial
development also creates a friendly business environment and makes an economy more
attractive to foreign investors. Well-developed financial systems would make it easier for
10
local industries in SSA to finance technological advancements adopted from foreign firms.
Therefore a complementary effect between FDI and financial development creates forward
and backward linkages that produce an overall positive effect of FDI on domestic
investment. Results in Chee and Nair (2010) reveal a complementarity between FDI and
financial development especially for least developed countries in the Asia and Oceania
region.
Trade openness forms the basis for free movement of financial capital. Openness
indicators like the size of a country’s export sector contribute in depicting how attractive a
country is to foreign investors. The Bhagwati hypothesis proposes that following an export
promotion strategy increases the amount of FDI attracted by an economy and also promotes
a more efficient use of FDI to benefit the economy. A highly-developed export market
represents a functioning domestic economy. It is important to note that, although it is
possible for MNCs to go into production in industries where local firms are restricted due
to lack of capital or technical know-how, foreign firms often prefer to mimic the investment
decisions of local firms, because local businesses have the best knowledge of the market.
This creates competition, which could serve as an incentive for local firms to increase their
efficiency. Nevertheless, it has been noted that MNCs have a competitive advantage even
in the global market, and this edge often means that once they operate in the same markets
as local firms, they drive domestic firms out of the market. In this case, it is essential to
analyse whether MNCs produce for export destinations, or for the local market. With the
existence of a thriving export sector, MNCs can produce for the global market, and also
create spillovers for domestic firms to venture into the global market. This concentration
of FDI in the tradable sector would therefore leave little room for FDI to crowd out
11
domestic investment. It also has the added advantage of improving the host economy’s
balance of payment situation and increasing foreign exchange reserves. Studies such as
Balasubramanyam et al. (1996) conclude that developing countries following an export
promotion (EP) strategy have a higher positive impact of FDI on growth as compared to
countries that follow an import substitution (IS) strategy. The study further shows that EP
strategy has neutral policies which allow for (i) free play of market forces and competition,
(ii) promotion of investment in human capital and research and development, and (iii)
specialization and economies of scale.
1.2 FDI Trends - World and Developing Regions
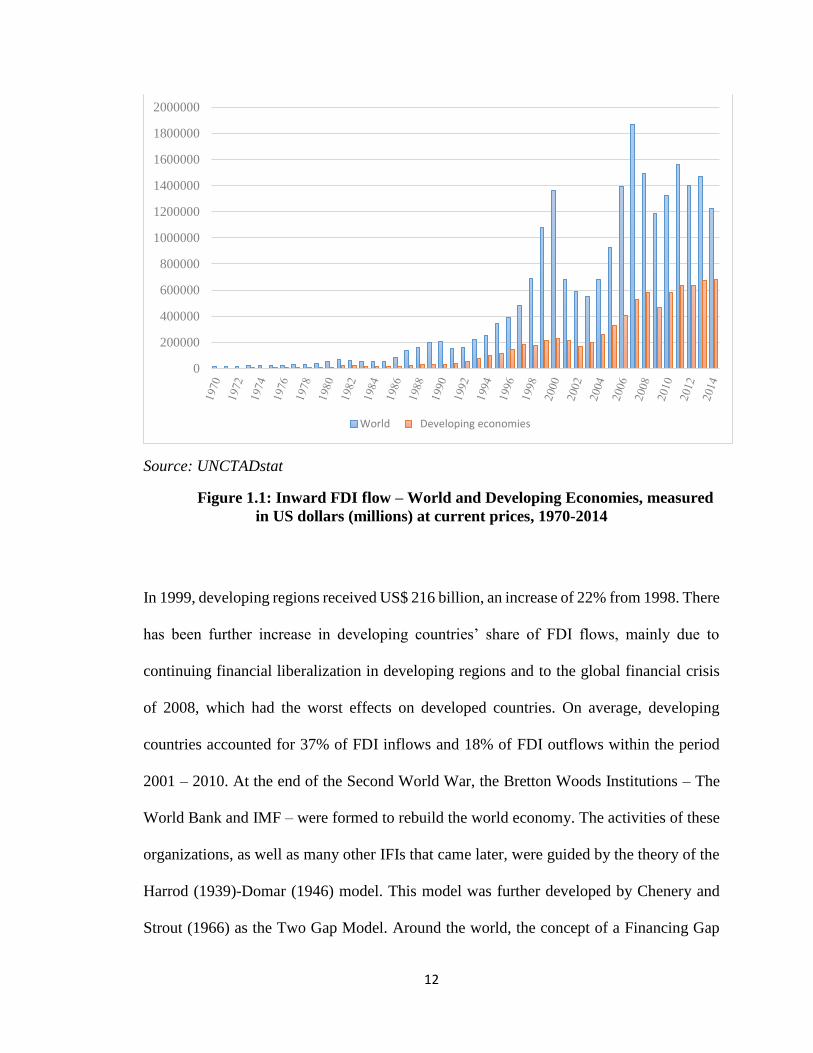
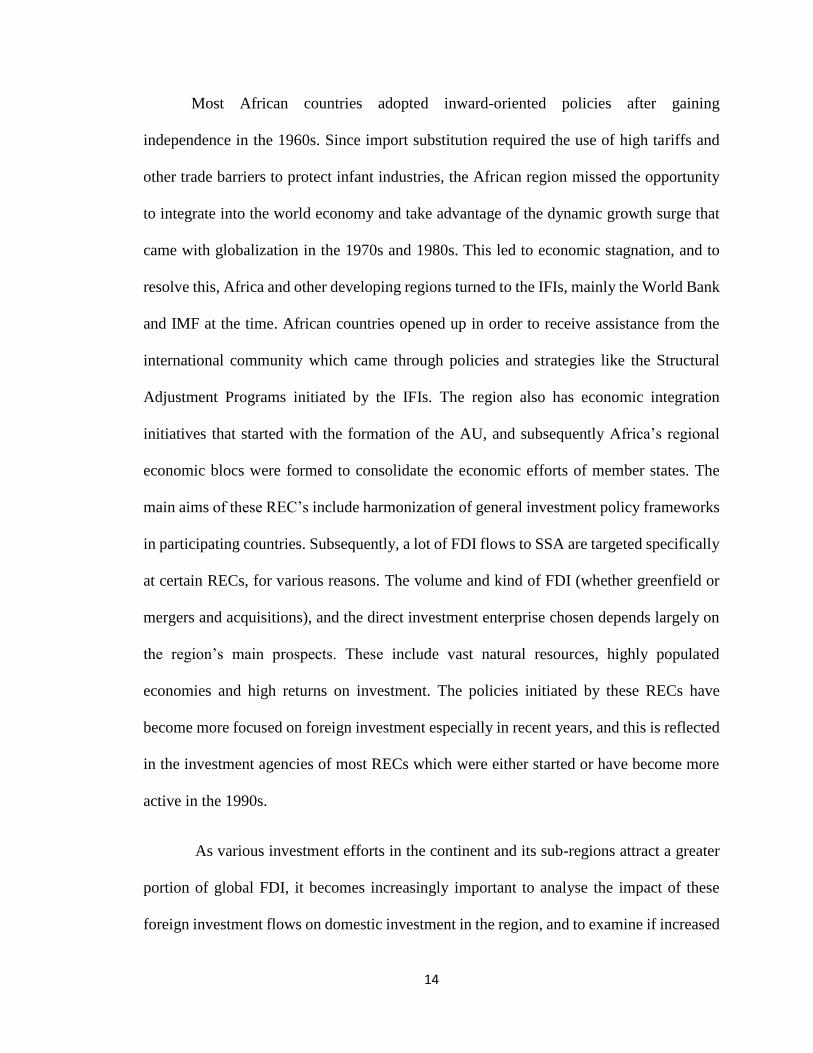
Over the past thirty years, global inward FDI flows have increased from US$ 54 billion in
1980 to US$ 1.2 trillion in 2014, with FDI flows growing faster than the growth rate of
international trade. From 1970 to 1990, FDI flows averaged about US$ 70 billion. Using
data from the United Nations Conference on Trade and Development Statistics
(UNCTADstat), developed countries accounted for 96% of FDI outflows and about 75%
of FDI inflows. There was a short-lived boom of FDI flows between 1978 and 1982, led
by the major oil producing countries. In the 1980s, developing countries received only 19%
of FDI inflows. The late 1990s saw a rapid increase in FDI flows with average annual
increases of 43% from 1998 to 2000. This brought world FDI inflows to a record level of
US$ 692 billion in 1998, in spite of unfavourable economic conditions in regions like Asia.
12
Source: UNCTADstat
Figure 1.1: Inward FDI flow – World and Developing Economies, measured
in US dollars (millions) at current prices, 1970-2014
In 1999, developing regions received US$ 216 billion, an increase of 22% from 1998. There
has been further increase in developing countries’ share of FDI flows, mainly due to
continuing financial liberalization in developing regions and to the global financial crisis
of 2008, which had the worst effects on developed countries. On average, developing
countries accounted for 37% of FDI inflows and 18% of FDI outflows within the period
2001 – 2010. At the end of the Second World War, the Bretton Woods Institutions – The
World Bank and IMF – were formed to rebuild the world economy. The activities of these
organizations, as well as many other IFIs that came later, were guided by the theory of the
Harrod (1939)-Domar (1946) model. This model was further developed by Chenery and
Strout (1966) as the Two Gap Model. Around the world, the concept of a Financing Gap
0
200000
400000
600000
800000
1000000
1200000
1400000
1600000
1800000
2000000
World Developing economies
13
became a significant economic issue. This gap refers to the difference between a country’s
investment requirements and the actual financing available from domestic private financing
and saving. The major policy suggestion of this model was that this gap would be filled
with foreign aid.
We earlier mentioned how one of the benefits of FDI is to prevent governments
from pursuing bad policies. The issue of governance is very important to the developing
world. In developing regions such as Africa, bad governance and lack of accountability
continues to be a problem. Over the years, developing countries have received increasing
amounts of development finance from governments of developed nations as well as from
international organizations, aimed at filling the investment gap and promoting economic
growth. However, it has been argued that pumping more aid to these economies encourages
corruption and gives the opportunity for elected officials to neglect their core responsibility
to manage their countries’ resources to ensure sustainable development. This view is
supported by economists such as Peter Bauer who defined foreign aid as “a transfer of
resources from the taxpayer of a donor country to the government of a recipient country”
(Bauer 1975). Also, the publication entitled “Dead Aid” by Dambisa Moyo (2009) draws
on evidence from the World Bank and the IMF to support this view. This notion, coupled
with the fungibility of aid, has resulted in the increasing substitution of FDI for foreign aid
to fill the investment gap in developing countries. This is not to say that the inflow of FDI
into developing countries does not bring along its own disadvantages. Some of the demerits
have been mentioned earlier in this study, and a significant drawback of FDI is the
possibility to stifle domestic investment.
14
Most African countries adopted inward-oriented policies after gaining
independence in the 1960s. Since import substitution required the use of high tariffs and
other trade barriers to protect infant industries, the African region missed the opportunity
to integrate into the world economy and take advantage of the dynamic growth surge that
came with globalization in the 1970s and 1980s. This led to economic stagnation, and to
resolve this, Africa and other developing regions turned to the IFIs, mainly the World Bank
and IMF at the time. African countries opened up in order to receive assistance from the
international community which came through policies and strategies like the Structural
Adjustment Programs initiated by the IFIs. The region also has economic integration
initiatives that started with the formation of the AU, and subsequently Africa’s regional
economic blocs were formed to consolidate the economic efforts of member states. The
main aims of these REC’s include harmonization of general investment policy frameworks
in participating countries. Subsequently, a lot of FDI flows to SSA are targeted specifically
at certain RECs, for various reasons. The volume and kind of FDI (whether greenfield or
mergers and acquisitions), and the direct investment enterprise chosen depends largely on
the region’s main prospects. These include vast natural resources, highly populated
economies and high returns on investment. The policies initiated by these RECs have
become more focused on foreign investment especially in recent years, and this is reflected
in the investment agencies of most RECs which were either started or have become more
active in the 1990s.
As various investment efforts in the continent and its sub-regions attract a greater
portion of global FDI, it becomes increasingly important to analyse the impact of these
foreign investment flows on domestic investment in the region, and to examine if increased
15
efforts in host regions have made any difference in the effect over time. Empirical studies
such as Borensztein et al. (1998) and De Mello (1999) show that a positive effect of FDI
through technology transfer and spillovers leads to development in the host country, but
the level of development does in turn affect how much FDI is subsequently attracted.
Looking at FDI’s impact on domestic investment is one way to closely examine the
development influence of FDI. This question has been investigated for developing regions
in general and for specific geographic regions in studies such as, Agosin and Mayer (2000),
Agosin and Machado (2005), and Bosworth and Collins (1999). By evaluating whether FDI
crowds in or crowds out domestic investment in SSA, this thesis reveals insights into the
region’s progress in increasing its capital formation in order to achieve sustained economic
development. Although most SSA economies have greatly improved in the conditions that
attract FDI such as economic reforms, privatization and ensuring peace and political
stability, there is still more that can be done. Most FDI to SSA still goes to resource rich
economies, and RECs have struggled to streamline their policies towards investment. In
order to ensure increased flows and more even distribution of foreign investment in SSA,
it is critical to capitalize on the fact that the possible viable economic environment created
by FDI plays a key role in attracting more foreign investment.
1.3 Objectives
This paper seeks to assess the relationship between FDI and domestic investment for the
SSA region over time, to determine whether FDI causes crowding-in or crowding-out of
domestic investment in SSA. In particular, the study seeks to:
16
1. Investigate the overall impact of FDI on domestic investment in SSA, whether it
complements or substitutes the region’s existing domestic capital over the chosen
sample period. We investigate whether Africa’s increased efforts over the years to attract
and benefit from FDI reflects in FDI’s impact on domestic investment. We estimate a
dynamic fixed effects model using an annual panel dataset that covers a sample of 36
African countries from 1980 to 2014. The sample period is then broken down into two
sub-periods, from 1980 to 1994, and from 1995 to 2014, to investigate changes in the
effects of FDI on domestic investment in SSA over time.
2. Conduct a detailed analysis on five of SSA’s regional economic blocs: Southern
African Development Community (SADC), Common Market for Eastern and Southern
Africa (COMESA), Economic Community of Central African States (ECCAS), East
African Community (EAC), and Economic Community of West African States
(ECOWAS) for the two sample periods. Hence, this study aims at examining the
differences that may exist in the impact of FDI on domestic investment among SSA’s
economic sub-regions.
3. Conduct an analysis for both periods to evaluate the role of selected development
variables (human capital, financial development, and exports) in the impact of FDI on
domestic investment in SSA over time.
1.4 Thesis Contribution
Most of the existing research papers that investigate the effect of FDI on domestic
investment employ different econometric approaches, cover different choices of sample
regions, and span over various time periods. Also, there are varying conclusions from
17
existing research on the topic, owing to the fact that each studied region has different
prevailing economic conditions. This thesis therefore seeks to contribute to the existing
literature by investigating the impact of FDI on domestic investment for the SSA region
based on evidence of increased efforts to attract greater FDI flows, and the promotion of
policies that lead to a positive effect of FDI on the continent’s development. The choice
of the study period is also important, and begins from the 1980s when most SSA
economies opened up to the world. By implementing the empirical analysis for the full
sample period and then for the two sub-periods, we investigate the possibility of structural
breaks through the effect of FDI on domestic investment in SSA. As mentioned earlier,
we direct our focus into the earlier opening up time period (1980-1994) and the following
time period (1995-2014), when the continent really intensified its FDI efforts.
Second, numerous previous studies on the topic that cover Africa either focus on
the continent as a whole, particular economic region, or a particular country. This thesis
thus contributes to the existing literature by further breaking down the analysis to the
sub-regional level. We analyze the existing economic and political conditions of five
sample regional economic blocs, and most importantly each sub-region’s investment
initiatives. The results from the sub-regional estimation breaks down the overall results,
and information from this empirical analysis of the sub-regions helps creates linkages
that make it easy to interpret the results from our estimations.
Lastly, it is widely accepted in the discussed literature that there are certain
economic conditions that must prevail within a host country in order to ensure the
maximum benefit of inward FDI on domestic investment. However, existing studies that
investigate the impact of FDI on domestic investment do not generally consider these
conditions. Studies such as Borensztein et al. (1998) that examine the impact of these
18
mediating factors are also not region specific. Therefore with the extended analysis for the
two periods, this study seeks to find out how human capital, financial development and
export development levels affect the impact of FDI on domestic investment in SSA, and
to derive policy implications for the region.
1.5 Thesis Organization
The rest of the thesis is organized as follows: Chapter Two gives a background of FDI
flows into SSA, and takes a look at the existing economic and political environment, as
well as investment trends in the five RECs chosen for the study. We also discuss the trends
in human capital formation, financial development, and export development for SSA.
Chapter Three examines the existing literature on the impact of FDI on domestic
investment. Chapter Four discusses the empirical specification, the econometric issues
encountered through the estimation of the empirical model, and the source and
characteristics of our dataset. Chapter Five presents and discusses the econometric results.
Chapter Six provides the summary of results and conclusions.
19
CHAPTER TWO
2. TRENDS IN FDI
This chapter discusses the trends in FDI for our sample region. Since this study looks at the
impact of inward FDI on domestic investment, we describe the historical trend of inward
FDI to Africa. We also present a brief analysis of each of the African regional economic
blocs chosen for the study. This is done by taking note of the investment initiatives of the
sub-regions over the sample period, the types of FDI inflows attracted by each region, as
well as various economic and political conditions. This chapter also analyzes trends in
human capital building, financial sector development, and export sector growth in SSA,
considering the respective complementarities they have with inward FDI’s impact on
domestic capital formation.
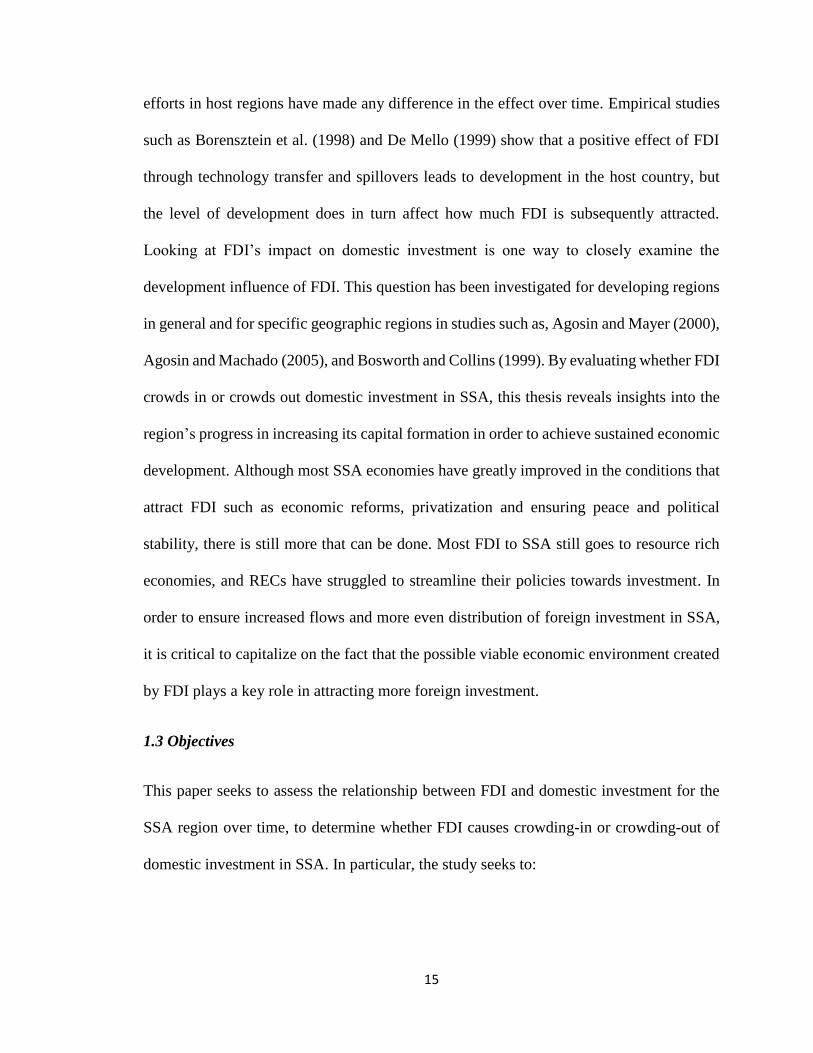
2.1 Inward FDI Trends in Africa and Regional Economic Communities
The average of FDI flows to Africa from 1970-1974 was US$24.4 million but fell to $22.6
million by the end of the decade, owing to the oil crises of the 1970s. Since the 1980s, FDI
flows to the continent have recovered and keep increasing steadily, although there was an
accelerated increase at the end of the 1990s, when the continent recorded average FDI
inflows of more than US$170 million. This can be attributed to the increase in political
stability and the resulting surge in economic performance experienced by Africa in the mid-
1990s. Actual FDI inflows to Africa increased from US$2.4 billion in 1985 to US$36
billion in 2006.
The AU set up the NEPAD in 2001. One of the main aims of the Economic and
Corporate Governance Agency of NEPAD is promoting an enabling environment for
20
business, and effective regulatory framework for economic activities. Some of the early
investment initiatives by NEPAD include the Africa Investment Initiative in collaboration
with the Organization for Economic Cooperation and Development (OECD). There are also
programs like the Program for Infrastructure Development in Africa (PIDA), Move Africa,
E-Africa and Power Africa initiatives aimed at improving infrastructure in order to
facilitate trade and investment in Africa. A look at recent trends of FDI flow into Africa
shows that there has been a steady increase in the flow of foreign investment into the region.
In 2006, about forty African countries adopted fifty-seven new policies affecting FDI, of
which forty-nine encouraged inward FDI (UNCTAD, 2007). The resulting increase in
global FDI inflows into Africa largely reflected relatively high economic growth and strong
corporate performance in many parts of the world (UNCTAD, 2008). According to an
attractiveness survey by Ernst and Young, since 2011, Africa has moved from the eighth
to the second position in terms of most attractive investment destinations in the world. In
2012, there was a five percent increase in FDI flows to Africa in spite of the eighteen
percent fall in global FDI (UNCTAD World Investment Report 2013). However, just
fifteen countries accounted for over eighty percent of total FDI flows into Africa in 2012.
Further, the largest inflows were either in sectors in which the region has a comparative
advantage (such as natural resources and agriculture) or where there are high returns and
there is a greater need for investment, such as construction. In 2013, global FDI increased
by eleven percent. FDI directed towards developing countries altogether accounted for
fifty-two percent of global flows in 2013, with flows to Sub-Saharan Africa experiencing
a growth rate of ten percent between 2012 and 2013 (UNCTAD Global Investment Trends
Monitor, 2014). Africa’s share in global FDI increased to a high of 5.7 percent in 2013.
Sub-Saharan Africa’s share in African FDI also reached an all-time high of eighty-three
21
percent in 2013 (EY’s Attractiveness Survey: Africa 2014). In 2014, Africa ranked second
only to North America in terms of investment attractiveness.
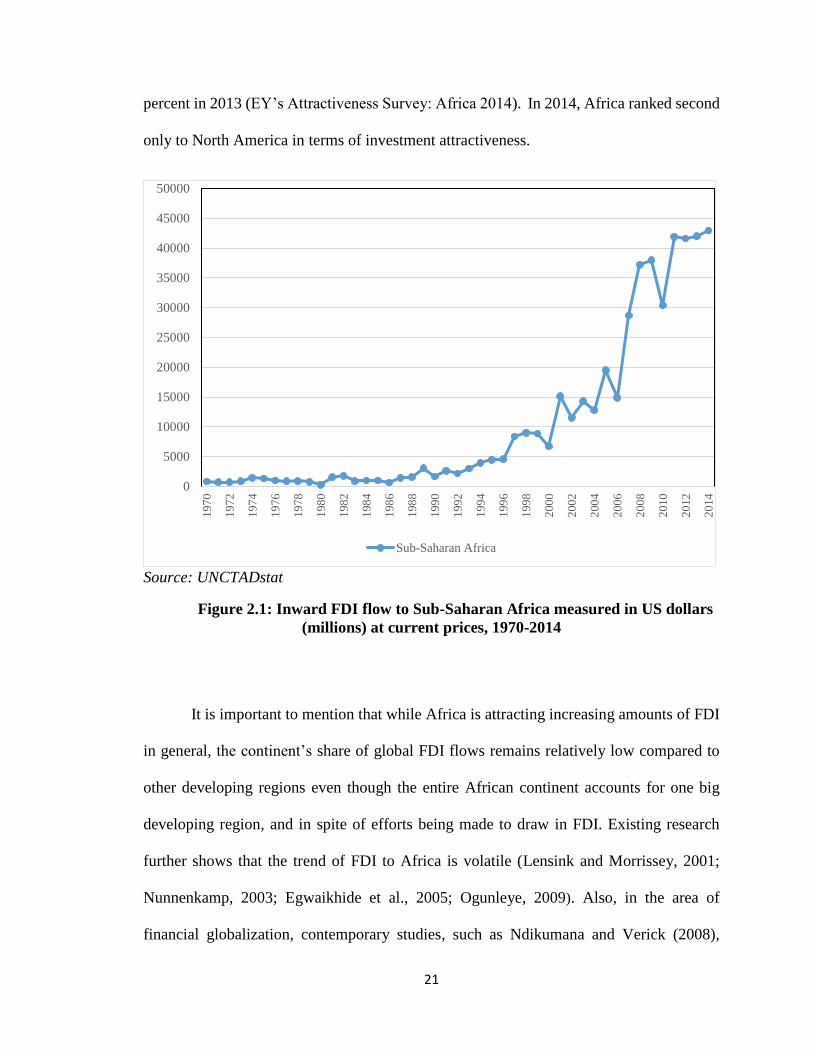
Source: UNCTADstat
Figure 2.1: Inward FDI flow to Sub-Saharan Africa measured in US dollars
(millions) at current prices, 1970-2014
It is important to mention that while Africa is attracting increasing amounts of FDI
in general, the continent’s share of global FDI flows remains relatively low compared to
other developing regions even though the entire African continent accounts for one big
developing region, and in spite of efforts being made to draw in FDI. Existing research
further shows that the trend of FDI to Africa is volatile (Lensink and Morrissey, 2001;
Nunnenkamp, 2003; Egwaikhide et al., 2005; Ogunleye, 2009). Also, in the area of
financial globalization, contemporary studies, such as Ndikumana and Verick (2008),
0
5000
10000
15000
20000
25000
30000
35000
40000
45000
50000
197
0
197
2
197
4
197
6
197
8
198
0
198
2
198
4
198
6
198
8
199
0
199
2
199
4
199
6
199
8
200
0
200
2
200
4
200
6
200
8
201
0
201
2
201
4
Sub-Saharan Africa
22
concluded that the continent is sidelined. The impact of inward FDI on the region’s capital
formation and resultant economic development may explain why the region attracts less
FDI compared to other developing regions. As earlier noted, economic potentials play a
key role in attracting FDI. However, if earlier foreign investment has not had the best effect
on Africa’s economy, this will explain why the continent is unable to continue to secure a
significant portion of global capital flows. Again, most of the factors that contribute to
economic well-being also form the absorptive capacity that facilitates how SSA economies
benefit from FDI spillovers.
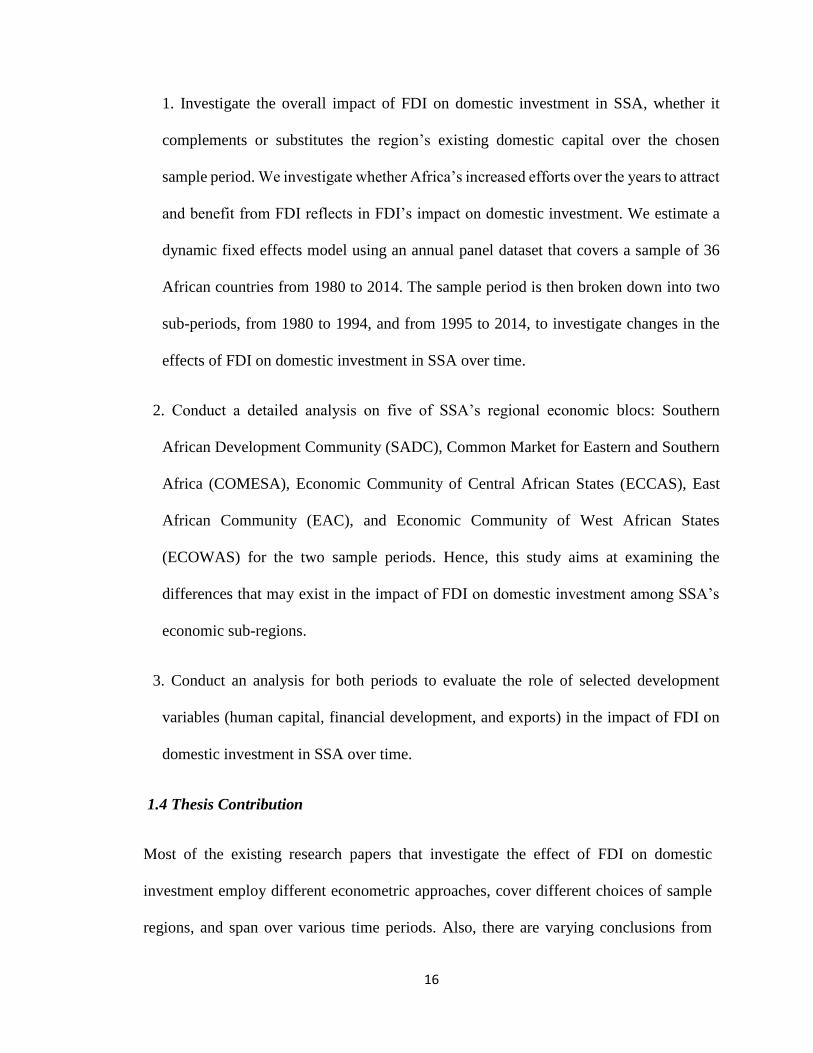
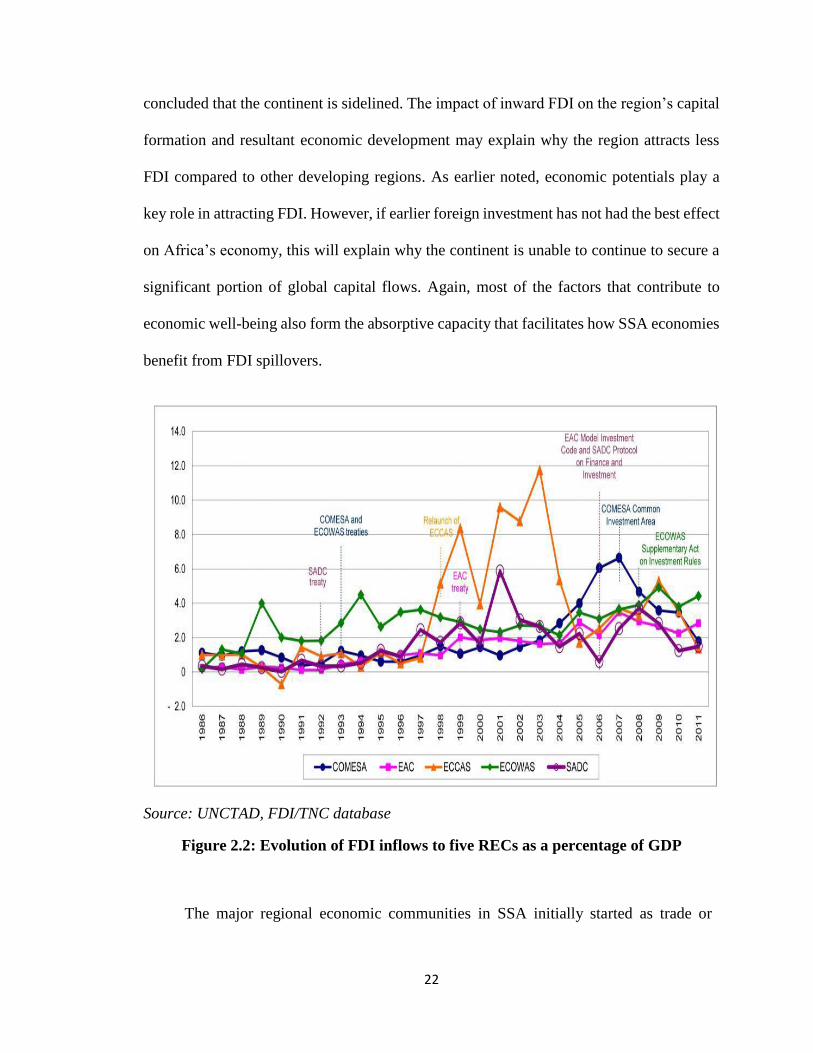
Source: UNCTAD, FDI/TNC database
Figure 2.2: Evolution of FDI inflows to five RECs as a percentage of GDP
The major regional economic communities in SSA initially started as trade or
23
economic partnerships among geographically proximate countries. However, under the
Abuja Treaty of 1991, all the RECs were incorporated into the African Economic
Community. Sub-regional economic integration contributes to the continent’s
development agenda by streamlining key policies. Also, the common markets and free
trade areas enjoyed by RECs provide a larger market that serves as a major locational
advantage to attract foreign investment. All the RECs that have been formed out of the
OAU (now African Union) have investment initiatives incorporated into their agendas,
and each region has its strengths (and weaknesses) for attracting FDI. Regional
integration efforts in Africa have been intensified since the 1990s, and these are reflected
in the policies pursued by the RECs in recent years. We take a look at some key facts as
well as at inward FDI trends in the five economic sub-regions chosen for this study.
The SADC was established in 1992 and currently comprises fifteen member states
(Angola, Botswana, Democratic Republic of the Congo, Lesotho, Madagascar, Malawi,
Mauritius, Mozambique, Namibia, Seychelles, South Africa, Swaziland, Tanzania,
Zambia, and Zimbabwe). The community’s main objective is to achieve regional
economic integration and poverty eradication by promoting economic development and
by sustaining peace and security. The SADC generally practiced import substitution
policies for much of the late 1980s and early 1990s. There was however a major surge of
economic liberalization and privatization that led to a review of FDI regulations in the
late 1990s. This has resulted in the initiation of the SADC’s Protocol on Finance and
Investment (SADC, 2006). According to Mahembe and Odhiambo (2013), the region’s
FDI inflows have increased by almost fifty times of its initial values in the preceding
three decades from US$372 million to US$7 billion in 2008. The SADC has also
started negotiations to form an Economic Partnership Agreement (EPA) with
24
the European Union (EU). Some of the SADC’s strongest performing countries in
terms of attracting inward FDI include Angola and Botswana. The latter has had stellar
economic growth performance since its independence in 1966. South Africa, which has
a vibrant economy in the SADC bloc and enjoys a wealth of resources in minerals and
synthetic fuels, is the third largest recipient of FDI in Africa.
The ECOWAS was established in 1975 with fifteen member states (Benin,
Burkina Faso, Côte d’Ivoire, Gambia, Ghana, Guinea, Guinea-Bissau, Liberia, Mali,
Nigeria, Niger, Cabo Verde, Senegal, Sierra Leone, and Togo). This community seeks to
promote economic integration in activities of its members in terms of industry,
infrastructure, commerce, among other areas. It has institutions set up to spearhead the
achievement of its goals. These institutions include its Parliament, Court of Justice,
Specialized Technical Committees, as well as the ECOWAS Bank for Investment and
Development. The ECOWAS has evolved from a Free Trade Area and i s shaping
up into an Economic Union, since its establishment. This high level of economic
integration is definitely advantageous in attracting FDI to the entire regional bloc.
One of the community’s aims is to harmonize national investment codes, leading to the
adoption of a single investment code for the economic community. The West African
region has also initiated an EPA with the EU in 2002, to foster trade and development co-
operations. Nigeria attracts the largest share of FDI in the West African sub-region
and in SSA due to its oil resources and large population that naturally make it a hub for
business. Ghana is also one of the countries in the region with a relatively high level
of inward FDI, with net value above US$3 billion recorded in 2014 (UNCTAD, 2014).
The ECCAS evolved from the combination of the Central African Customs and
Economic Union (CACEU) and the Economic Community of the Great Lakes Countries
25
(ECGLC) in 1983. The regional bloc remained inactive from 1992 to 1998 mainly due to
non-payment of membership dues by member states. A summit was organized to relaunch
the ECCAS in 1998. The Central African sub-region has also suffered political and
economic turbulences over the past three decades, particularly in seven of the eleven
member states (Angola, Burundi, Cameroon, Central African Republic, Chad, Congo,
Democratic Republic of the Congo, Equatorial Guinea, Gabon, Rwanda, and Sao Tome
and Principe). Heads of states of the region therefore concentrated on the recent
restoration of peace with the initiation of the Central African Council for Peace and
Security (COPAX), which is set up in 1991. The ECCAS has also adopted a self-financing
mechanism – the Community Integration Contribution – among member states (African
Development Bank, 2009). Reconstruction activities in the region provided opportunities
for governments to establish a partnership with foreign firms. One of the core aims of the
ECCAS is to establish large regional transportation industries, especially in the airline and
marine industries. A look at the effect of FDI on domestic investment in this region will
therefore give valuable insights on the success of the region’s economic integration
process.
The Common Market for Eastern and Southern Africa (COMESA) is Africa’s
largest trade and investment area, and it comprises the following countries: Burundi,
Comoros, Democratic Republic of the Congo, Djibouti, Egypt, Eritrea, Ethiopia, Kenya,
Libya, Madagascar, Malawi, Mauritius, Rwanda, Seychelles, Sudan, Swaziland, Uganda,
Zambia, and Zimbabwe. According to the World Bank (2007), the COMESA sub-region
includes thirteen of the nineteen countries listed as the poorest in the world. Economic
theory suggests that returns on investment in such regions should be high since the need
for capital is high and, therefore, this should attract more investment. The main focus for
26
COMESA’s establishment was to form a large economic and trading unit that is capable
of overcoming some of the barriers faced by individual states. However, the region faces
challenges in achieving higher economic integration, mainly posed by the fact that eight
of its member states are also part of the SADC, an economic sub-region that has a similar
agenda. As part of the region’s Regional Investment Agency, COMESA has a
Competition Commission that gives guidelines for mergers and acquisitions, competition
regulations and that also protects consumers in the COMESA region against false or
misleading presentation of goods and services, unconscionable conduct, poor safety
standards and unsafe goods. The Commission’s standards are essential in ensuring that
inward FDI in the form of mergers and acquisitions do not become exploitative of the
region’s economy. COMESA has also started negotiations with the EU to form an EPA.
Egypt is the largest recipient of FDI in the region with an average inflow of US$1.7
billion between 1980 and 2007. Sudan, Zambia, and Libya also attract large amounts of
FDI, although this shows that FDI inflow to COMESA goes to the oil-rich countries
(Egypt, Sudan, and Libya) and the mineral-rich countries (Zambia).
The East African Community (EAC) was relaunched in 1999 after the original
EAC collapsed in 1977, and currently has six partner states (Burundi, Kenya, Rwanda,
South Sudan, Tanzania, and Uganda). The community’s economic integration has been,
however, slowed down by disputes among member states over foreign investment
liberalization in the community. The EAC still remains one of the largest, and also the
fastest growing region in Sub-Saharan Africa in the past decade, with average GDP
growth of 5.8%. It is also the second fastest growing economic bloc in the world. The
region’s well integrated market is a Common Market. Total FDI inflow to the region
tripled from US$1.3 billion in 2005 to US$3.8 billion in 2012. The story seems to be
27
different in this SSA sub-region compared to other SSA sub-regions. Economic growth
is less sharply skewed toward the resource-rich countries, and even the relatively small
economies of the region like Burundi and Rwanda are undergoing significant
restructuring. Also, the major proportions of FDI inflows go to the manufacturing and
construction sectors in Uganda, and to the construction, manufacturing, and tourism
sectors in Tanzania. Due to high political uncertainties, Kenya has been unsuccessful in
attracting FDI despite its huge potential for investment in the manufacturing and service
sectors (EAC, 2013). The EAC’s Investment Promotion and Private Sector Development
Agenda spans the region’s industrialization, trade agreements and privatization reforms,
and all these initiatives are key in increasing FDI inflows and ensuring a positive effect
on the region’s development.
2.2 Human Capital, Financial Development, and Export trends in Africa
Africa is the second most populous continent, with a population of more than 1.1 billion
people. The African continent also has the youngest population in the world. While high
population growth is leading to expansion of the labour force in Africa, education is needed
to ensure that the continent builds a decent human capital base. Human capital refers to the
knowledge and skills that the population possesses, and building human capital requires
investing in education. Research shows that increasing the level and quality of education
of Africa’s population has the potential of reducing poverty and infant/child mortality rates,
thereby positively impacting the development process of the region. Other regions such as
Europe have already reached a population peak, and this creates the opportunity for Africa
to draw in investments in labour intensive industries. However, the labour force needs to
possess some degree of skills to attract all types of investments and not just labour intensive
28
ones, in order not to leave the region’s economy susceptible to a few industries.
Historically, education in Africa has been marked by lack of access, low enrollment rates,
low quality, and lack of equity in terms of female education. Over fifteen years have passed
since the establishment of the Millennium Development Goals (MDGs), and the continent’s
leaders remain focused on meeting these goals in terms of universal primary education.
According to the 2015 Africa MDGs Report, most African countries have experienced
impressive increases in net enrolment rates. Also, there has been an increase in government
spending on education, as well as an increase in the adoption of holistic education policies
in the region. Also, according to a report on human capital and labour trends by Knowledge
Resources, which is a South African based business and management consultancy, the
African region is making strides in literacy rates, mean schooling years, percentage of
trained teachers, quality of education, enrolment at each educational level, and also
enrolment in science and engineering fields. These developments would increase the
innovation capacity and the absorptive capacity of the continent.
An efficient and dynamic financial system is critical in any economy to stimulate
investment and drive economic development. The African region is increasingly
integrating into the global economy through foreign capital inflows and direct investment
in the financial sector. However, trends in Africa’s FDI inflows show that continent is still
sidelined in terms of financial globalization compared to other developing regions
(Ndikumana and Verick, 2008). According to a World Bank report by Beck et al. (2009),
African financial systems are included in the smallest across the globe. This leads to low
productivity, and prevents financial institutions from enjoying economies of scale or
technological expansion. Only one third of countries in the continent have stock markets,
and the attempts at creating regional financial markets have not succeeded. Also, financial
29
systems in Africa have a limited scope, with less than one in five households having access
to basic banking. In Africa, banking remains expensive with a wide margin between deposit
and lending rates, creating disincentives to saving and lending. In pursuing financial sector
development, African countries have initiated several reforms such as privatizing failing
government banks, as well as making it easier for foreign banks to break into financial
markets. International capital flows have contributed greatly to financial deepening and
broadening in most African countries. There have been improvements in the financial
institutional framework with the establishment of commercial courts, improvement of
collateral registries, and the establishment of credit reference bureaus. There has been an
upturn in statistical indicators such as liquid liabilities to GDP, bank deposits to GDP, and
private credit to GDP. Policymakers in the region are increasing efforts to improve the
financial infrastructure and developing the capital market. There have been advances in
increasing banking sector scope. Increase in mobile telephone technology in Africa make
it possible for banks to expand their services. All these improvements have been reflected
in the steady increase of capital inflows into Africa.
In most developing regions, exports are largely made up of primary products,
mostly raw goods and goods that require low levels of processing. This is the case in Africa
where the majority of the continent’s products to the world market are primary
commodities. According to the World Trade Organization, Africa has a comparative
advantage in agriculture, but has not been able to fully use this advantage to capture its full
share of global trade. Also, Africa’s manufactures have the lowest revealed comparative
advantage of any export category. Furthermore, the competitiveness of agricultural exports
appears to be eroding over time. The continent’s main trading partners have been the
OECD countries. What Africa needs is to gain sustainability in export revenues by
30
achieving greater integration in value chains, resulting in an increase in the share of value-
added goods in its exports. Trends also show that there are increasing trade levels within
Africa, which are largely attributable to rising value-added exports within the region. The
continent is therefore pursuing trade related economic development by tapping into
booming markets in Asia, Latin America, and within Africa itself. However, Africa’s
exports to Asia are still mostly primary products. Increasing domestic labour costs in
countries like China have led to relocation of some production activities to Africa, which
offers abundant and inexpensive labour and geographical proximity to Europe. As a result,
the percentage of goods produced by Chinese firms in SSA for export to Western markets
is significant. In this case, direct investment to the region is being focused in the export
oriented production industry. This study contributes in analyzing how SSA’s trade within
and with the world will help to increase FDI inflows but not adversely affect domestic
industries, leading to overall economic development for the region.
31
CHAPTER THREE
3. LITERATURE REVIEW
Evidence from the growth accounting theory shows that investment plays a key role in
propelling a country’s development. There are many notable empirical studies that
investigate the dynamic relationships between FDI, domestic investment and economic
growth. Paolino (2009) uses data from China for the period 1977 to 2007, and the results
from the Ordinary Least Squares (OLS) estimation show that domestic investment has the
highest level of positive effect on FDI inflow. Nair-Reichert and Weinhold (2001)
investigate the possibility of a heterogeneous effect of FDI on growth using a panel
covering twenty-four developing countries over twenty-five years. A causality test shows
a heterogeneous causal relationship between both foreign and domestic investment, and
growth. There is also evidence that the effect of FDI on growth is more efficient in more
open economies. De Mello (1999) considers the impact of FDI on capital accumulation,
output and total factor productivity growth in the host country. He analyses both time-series
and panel data for a sample of OECD and non-OECD countries from 1970-1990. He finds
that the degree of complementarity and substitution between FDI and domestic investment
determines the extent to which FDI enhances economic growth. Apergis et al. (2008)
consider the dynamic linkages between FDI inflows, domestic investment and growth using
panel cointegration and causality techniques for twenty-seven transition economies. They
find that the presence of FDI induces more capital intensive investment in host countries
that have high income levels and that have implemented successful privatization programs.
It appears therefore that FDI’s effect on domestic investment depends on prevailing
conditions within the host country. A study by Deok-Ki Kim and Jung-Soo (2003) for
32
Korea uses vector autoregression to investigate the dynamic relationship between inward
FDI, domestic investment and economic growth for the period 1985-1999. The study finds
that FDI is strongly dependent on domestic macroeconomic conditions. FDI has some
positive effects on economic growth, though insignificant. In contrast, economic growth is
found to have statistically significant influence on future FDI levels2. In these empirical
studies there are several angles through which the relationships between FDI, domestic
investment and growth are examined. In this study, the impact of FDI on economic growth
is examined through the impact of foreign investment on domestic investment.
Specifically, on the relationship between FDI and domestic investment, there have
been varying conclusions from the existing empirical literature. Empirical results either
show a positive or increasing effect, or a negative or decreasing effect of inward FDI on
domestic investment. Fry (1993) investigates the effect of FDI on domestic investment for
five Pacific Basin countries and a control group of eleven other developing countries.
Results show that FDI causes domestic investment to fall for the total sample. However,
for the five Pacific Basin countries, FDI increases domestic investment by the full amount
of the FDI flow. Thus, Fry (1993) concludes that the impact of FDI on domestic investment
differs significantly by location. Bosworth and Collins (1999) consider the effects of inward
capital flows on domestic investment using data on developing countries for the period
1978-1995. They consider three main types of capital inflows: FDI, portfolio investment,
and other financial flows (mainly bank loans). They find that an increase of one dollar in
capital inflows is associated with an increase in domestic investment of about fifty cents,
2 There is a large empirical literature that examined the implications of FDI (and multinational activities) for
international trade, and that analyzed whether FDI and international trade are complements of substitutes (for
example, Brainard, 1997; Barba-Navaretti et al., 2004; Head and Ries, 2004; Ghazalian and Furtan, 2008,
2009).
33
with both capital inflows and domestic investment expressed as percentages of GDP. The
study further analyzed the significant differences in the impact of various capital flows on
domestic investment. Among the various types of capital flows, FDI has the highest impact
on domestic investment (almost a one for one). This is followed by the effect of loans,
while there is no obvious effect of portfolio investment on domestic investment.
Evidence from Agosin and Mayer (2000) shows varying FDI effects on domestic
investment for three developing regions: Asia, Latin America and Africa. These variations
seem to be caused by many factors such as the division of the sample period for certain
regions and the implementation of the analysis for each country separately. The study uses
panel data from thirty-two developing countries for the period 1970-1996. Overall, the
results suggest that FDI tends to substitute domestic investment in Latin America, while it
tends to complement domestic investment in Asia. The results for African countries were
inconclusive. As in Agosin and Mayer (2000), Agosin and Machado (2005) develop a
model for investment that incorporates FDI. However, they use Generalized Method of
Moments (GMM) estimation instead of seemingly unrelated regressions in the panel data
analysis of thirty-six developing countries for the period 1971-2000. The results show
crowding-out effect of FDI on domestic investment in Latin America over the full sample
period, and a neutral effect of FDI on domestic investment in Africa and Asia. Breaking
down the sample into various decades reveals the presence of crowding-out effect in Latin
America in the 1970s, and in Africa in the 1990s. Although the main results stay the same
for both studies, the two studies indicate how the analysis of various regions shows different
effects of inward FDI on domestic investment. The two studies also highlight how the effect
of FDI on domestic investment evolves over time. Agosin and Machado (2005) underline
34
some of the factors that lead to variations in the results across regions. These factors include
the regulations laid out by various economies to control the effects of FDI inflow, and the
existing economic conditions such as levels of industrialization. A study by Al-Sadig
(2013) examines the impact of FDI on private domestic investment for ninety-one
developing countries for the period 1970-2000. Using system GMM to control for the
simultaneity between FDI and domestic investment, the results show that a one percentage
point increase in FDI flows increases domestic private investment as a percentage of GDP
by about nine percent. Also, the study finds that for middle and high income countries, FDI
positively affects private domestic investment. However, for lower income countries, the
positive impact of FDI on domestic private investment depends on human capital
availability.
A panel data study by Wang (2010) assesses the impact of FDI on domestic
investment in developed and less developed countries. The study looks at long-term and
short-term effects, and it also compares developed countries to less developed countries.
Using a sample of fifty countries from 1970-2004, the results show that in the short-term,
FDI crowds out domestic investment in developed countries, but has a neutral effect in less
developed countries. However, in developed countries, the long-term effect is neutral,
while FDI crowds in domestic investment in less developed counties. Kamaly (2014)
investigates the dynamic effect of FDI on total investment by estimating the effect of FDI
on domestic investment using a dataset covering sixteen emerging economies over the time
period 1978–2010. This study uses Three-Stage Least Squares (3SLS) method to estimate
a system of equations that represents individual countries. The results generally reveal
country-specific effects of FDI on domestic investment. It is important to note that these
35
cross-regional studies reveal the differing results that arise when the relationship is
examined in different regions. This necessitates region-specific studies that take into
consideration the regional policies, predominant types of FDI inflows, and the response of
domestic industries, and that reveal deeper insights into the existing relationship between
FDI and domestic investment in specific regions.
A study conducted by Ndikumana and Verick (2008) focuses on the linkages
between FDI and domestic factor markets in Africa. The question is whether domestic
investment impacted FDI inflows, and whether domestic investment was in turn
influenced by FDI. Results in this study show that the impact runs both ways, with the
impact of domestic private investment on FDI inflows proving stronger and more robust
than the reverse relation. Evidence from this study supports the idea that FDI can have a
positive effect on economic growth by improving domestic capital accumulation. Thus,
from this study, FDI does not appear to boost domestic investment as much as domestic
investment boosts FDI in Africa. Therefore, this study concludes that the continent will
benefit from boosting domestic capital formation, since this will have a positive effect on
development both directly and through the attraction of FDI. A study by Adams (2009)
examines the relationship between FDI, domestic investment and economic growth for a
panel of forty-two countries in SSA for the period 1990-2003. Using OLS and fixed
effects estimation, the study finds a significant negative effect of current period FDI, but
a significant positive effect of lagged FDI on domestic investment with both estimation
methods. Thus, the results in this study show that FDI has an initial crowding-out effect
on domestic investment, and a subsequent crowding-in effect in later periods. This study
concludes that there is the need for the continent to have a guided approach to FDI. This
36
requires increasing the absorption capacity of local firms and intensifying cooperation
between governments and MNCs. Eregha (2011) implements a panel cointegration
analysis to determine the dynamic linkages between FDI and domestic investment in ten
ECOWAS countries from 1970 to 2008. Although foreign investment inflows increased
during the 1990s, this study shows that, the increase of foreign investment inflows in
Africa was less than that of other developing regions. The results also affirm that there is
a simultaneous relationship between inward FDI and domestic investment. The
estimations reveal that FDI inflow substitutes domestic investment in the region. This
study concludes that there is the need to attract different types of foreign investment, and
also to introduce regulations for foreign investment activities.
In investigating the relationship between FDI, domestic investment and economic
development, empirical analysis can be implemented to highlight the factors/linkages
through which FDI affects domestic investment. Borensztein et al. (1998) consider the
role of FDI in technology diffusion and economic growth in developing countries. This
study posits that FDI contributes to economic growth either by crowding-in domestic
capital, or by being more efficient than domestic capital, and therefore increasing total
factor productivity. This study uses data on FDI flows from industrial countries to 69
developing countries over the period 1970 to 1989. It examines the complementary effect
between human capital and the two types of investments (FDI and domestic investment).
The interaction between FDI and human capital is positive and statistically significant,
while the interaction between human capital and domestic investment is not statistically
significant. The results show that at a threshold of 0.52 level of human capital (measured
by the level of average years of male secondary schooling), FDI has a positive effect on
37
economic growth. This study concludes that any impact of FDI on economic growth is
mostly realized by efficiency gains rather than by an overall increase in domestic
investment. Chee (2010) investigates the importance of financial sector development in
the ability of FDI to enhance economic growth in forty-four Asian and Oceanian countries
for the period 1996 to 2005, taking into consideration the level of economic development.
This study implements fixed effects and random effects estimation using the panel data.
The results show that FDI and financial sector development are complementary in
facilitating economic growth, regardless of the stage of development. However, the
complementary effect is higher in least developed countries than in developing and
developed countries. A study by Jyun-Yi and Chih-Chiang (2008) for sixty-two countries
over the period 1975 to 2000 uses endogenous threshold analysis to explore the thresholds
of three absorptive capacities – initial GDP, human capital, and trade. The study finds that
FDI has a significant positive effect on economic growth when the host country has a high
level of initial GDP and human capital, whereas the effect of trade is inconclusive.
The role played by absorptive capacity in FDI’s impact on the economy has also
been explored at the firm level. Girma (2005) investigates the absorptive capacity
threshold for which the productivity spillovers from FDI are beneficial, and below which
they are negligible or even negative. Using firm-level data from the United Kingdom’s
manufacturing industry from 1989-1999, this study finds a number of factors which
determine FDI’s spillover effects. In the case of technology-exploiting FDI, there exist
non-linear threshold effects. The productivity benefit of FDI increases as absorptive
capacity increases, until some threshold level beyond which it is less pronounced. Also,
at some minimum level of absorptive capacity, FDI’s productivity spillovers are negligible
or even negative. However, in the case of technology-sourcing FDI, there is no evidence
38
of productivity spillovers. Barrios et al. (2005) analyze the impact of FDI on the
development of local firms. They investigate the likelihood of a competition effect stifling
domestic enterprises or fostering the development of local industry. Using plant-level data
covering Irish firms from 1972 to 2000, they find that the effect of FDI on domestic firms
is U-shaped, where competition effect dominates initially, but beyond a certain threshold,
it is gradually outweighed by positive externalities. Also, alternative semi-parametric
regression techniques leads to equivalent findings. The conclusions from this study
suggests that for a greater positive effect of FDI on domestic industry, there is the need
for larger quantity of foreign capital inflow as well as higher efficiency of local firms.
Conditions in host countries that impact the effect FDI on domestic investment
include the existing social environment and institutional factors. A study by Kolstad and
Villanger (2004) assesses the impact of social development variables on FDI and domestic
investment, with a panel dataset covering seventy-five countries over the time period
1989-2000. The variables considered are political stability, religious freedom and socio-
economic conditions. Using OLS and random effects estimation models, the results show
that the variables have different effects on domestic investment and FDI. Political stability
has a positive effect on FDI but negative effect on domestic investment. Religious tensions
reduce FDI but have no effect on domestic investment. Lastly, though socio-economic
conditions have no effect on FDI, they affect domestic investment positively. The effect
of governance on the relationship between FDI and domestic investment is investigated
in Morrissey and Udomkerdmongkol (2012). Their analysis uses data from forty-six
developing countries covering the time period 1996-2009. The governance indicators
considered in this study are corruption and political stability, where the latter emerges as
39
the most significant facet of governance with respect to the relationship between FDI and
domestic investment. Results from this study show that, while good governance has an
increasing effect on total investment (FDI and domestic private investment), there is
evidence of FDI crowding-out domestic investment. Also, the degree of crowding-out
effect is positively correlated with good governance, as measured by political stability.
Farla et al. (2014) implement various robustness checks of the results in Morrissey and
Udomkerdmongkol (2012) including, the choice of the proxy for domestic investment,
and the choice of estimation method. This study compares the results when using gross
fixed capital formation and when using domestic private investment. It also estimates an
alternative method of the system GMM. The results show a crowding-in effect of FDI on
domestic investment, with good governance reducing the positive effect of FDI on
domestic investment.
In conclusion, studies on the impact of FDI on domestic investment have varying
results, mostly due to differences in the geographic regions covered, existing economic
conditions and policies, the types of FDI inflow, and the econometric methods used. Most
studies do agree, however, that the existing economic conditions play a key role in
harnessing the spillovers of inward foreign investments. Also, in the case of existing
economic conditions, there will be different effect of FDI on domestic investment over
time, as economic conditions change in host countries/regions.
40
CHAPTER FOUR
4. METHODOLOGY
Investment has been identified by economic growth theorists as one of the key determinants
of an economy’s development. As earlier noted in this study, the economic state of a
country has an impact on the flow of FDI into its economy. Also, FDI inflow has an effect
on domestic investment and overall development. Therefore, there is evidence of a dynamic
relationship between FDI, domestic investment, and economic growth, with both forward
and backward linkages between FDI and domestic investment. In this chapter we discuss
the model for our study. We also discuss some econometric challenges related to the
estimation of the model, and how the choice of the estimation technique tackles the
econometric issues. Lastly, we discuss the data for our study, and the basis for our choice
of sample period, variables, and countries.
4.1 Model Specification
As outlined in the background to this study, the Harrod-Domar and Chenery-Strout models
consider foreign capital flows as a means to achieve the targeted domestic investment
needed to reach a given level of economic growth. Obtsfeld (1998) argues that this
approach will only increase consumption, as capital flows often end up being used to carry
out investments that government would have made. It is also argued that foreign capital
flows introduce expensive consumption preferences, thereby increasing consumption and
decreasing savings further. Obtsfeld (1998) outlines a method of empirical estimation based
on intertemporal utility maximization of foreign resource flows in an economy with limited
access to international markets. Foreign resource inflows are considered in terms of an
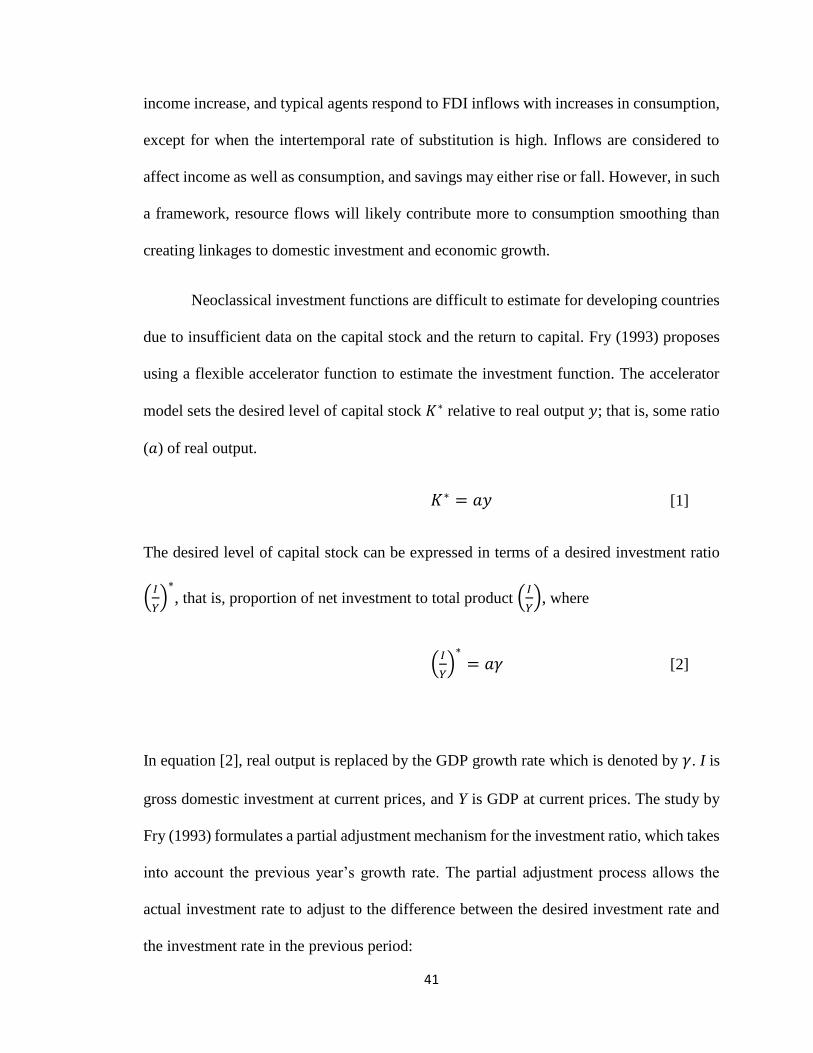
41
income increase, and typical agents respond to FDI inflows with increases in consumption,
except for when the intertemporal rate of substitution is high. Inflows are considered to
affect income as well as consumption, and savings may either rise or fall. However, in such
a framework, resource flows will likely contribute more to consumption smoothing than
creating linkages to domestic investment and economic growth.
Neoclassical investment functions are difficult to estimate for developing countries
due to insufficient data on the capital stock and the return to capital. Fry (1993) proposes
using a flexible accelerator function to estimate the investment function. The accelerator
model sets the desired level of capital stock 𝐾∗ relative to real output 𝑦; that is, some ratio
(𝑎) of real output.
𝐾∗ = 𝑎𝑦 [1]
The desired level of capital stock can be expressed in terms of a desired investment ratio
(𝐼
𝑌)
∗
, that is, proportion of net investment to total product (𝐼
𝑌), where
(𝐼
𝑌)
∗
= 𝑎𝛾 [2]
In equation [2], real output is replaced by the GDP growth rate which is denoted by 𝛾. I is
gross domestic investment at current prices, and Y is GDP at current prices. The study by
Fry (1993) formulates a partial adjustment mechanism for the investment ratio, which takes
into account the previous year’s growth rate. The partial adjustment process allows the
actual investment rate to adjust to the difference between the desired investment rate and
the investment rate in the previous period:
42
∆ (𝐼
𝑌) = 𝜆[(
𝐼
𝑌)
∗
− (𝐼
𝑌)𝑡−1]
or (𝐼
𝑌) = 𝜆(
𝐼
𝑌)∗ + (1 − 𝜆)(
𝐼
𝑌)𝑡−1 [3]
The coefficient of adjustment is denoted by 𝜆. The flexible accelerator model allows the
coefficient of adjustment to be influenced by economic conditions. We have
𝜆 = 𝜔0 + [𝜔1𝑍1+𝜔2𝑍2+𝜔3𝑍3+⋯+𝜔𝑘𝑍𝑘
(𝐼
𝑌)∗−(𝐼/𝑌)𝑡−1
] [4]
The variables (𝑍1, ⋯ , 𝑍𝑘) are those that affect the adjustment coefficient 𝜆, with
corresponding parameters (𝜔1, ⋯ , 𝜔𝑘). We may consider one of these explanatory
variables as the intercept term for the depreciation rate, so that the flexible accelerator
model can be estimated for the gross rather than for the net investment ratio. Since actual
investment is influenced by the coefficient of adjustment in any given time period, it
follows that actual investment is affected by economic conditions. Then, a dynamic fixed
effect equation can be developed where current level of domestic capital formation depends
on past level of domestic capital formation, FDI, previous year GDP growth rate, real
interest rate, and domestic credit availability. In our study, we consider gross foreign and
domestic investment, since we are interested in the spillover effects of FDI. The 𝑍 variables
considered include GDP growth rate, real interest rate, and domestic credit availability.
Our study employs a dynamic fixed effects model for the empirical estimation,
considering determinants of current investment level based on the existing economic
literature. Panel data analysis allows us to control for time-invariant country-specific
characteristics by acknowledging and incorporating country fixed effects. Also, a lagged
43
dependent variable in our model is able to control for omitted variables to a large extent. In
assessing the impact of inward FDI on domestic investment for SSA, we assume a dynamic
deterministic relationship between domestic investment and FDI, controlling for other
variables such as GDP growth rate, real interest rate, and domestic credit availability, all of
which have an effect on the gross capital formation of an economy. The equation specified
for our study is adapted from the Hecht, Razin and Shinar (HRS) model3. This model is a
four-equation system that was used in their research to capture the interactions between
international capital flows and domestic investment. The dependent variables in the HRS
model are domestic investment, GDP growth, foreign direct investment, portfolio
investment and loans. The HRS model uses a lag of domestic investment as a dependent
variable because the level of existing capital is relevant for capital formation in current and
later periods. This lag also guards against omitted variable bias. For this study, only the
equation for domestic investment will be used out of the four-system model, with some
modification. We include more explanatory variables – domestic credit availability and real
interest rate – in the original Domestic Investment (DI) equation of the four-system HRS
model, and we also specifically consider FDI and not all international capital flows. The
effect of FDI on domestic investment is the question of this study, and the coefficient of
FDI from our estimation will reveal this impact. Thus from equation [4] above, we estimate
domestic investment dependent on previous year level of domestic investment, current FDI,
past year economic growth, real interest rate, and domestic credit availability. Assuming a
dynamic linear form with fixed effects, we specify our regression equation as:
3 Hecht et al. (2002)
44
𝐼𝑁𝑉𝑖𝑡 = 𝛽0 + 𝛽1𝐼𝑁𝑉𝑖,𝑡−1 + 𝛽2𝐹𝐷𝐼𝑖𝑡 + 𝛽3𝐺𝑖,𝑡−1 + 𝛽4𝐼𝑁𝑇𝑖𝑡 + 𝛽5𝐶𝑅𝐸𝐷𝑖𝑡 + 𝛿𝑖 + 휀𝑖𝑡 [5]
(For i = 1, 2, 3... N; t = 1, 2, 3... T)
where domestic investment as a share of GDP (INV) is regressed on its lag (INVi,t-1), FDI
as a share of GDP (FDIit), one period lag of GDP growth rate (Git-1), real interest rate at
time t (INTit), domestic credit availability (CREDit), the country-specific effect δi and the
error term (εit). From the model stated above, domestic investment as a share of GDP for
the previous time period is assumed to have a positive relationship with domestic
investment in the current time period. This follows from the theory that indicates that the
amount of existing capital is positively related to current and future capital formation. That
is, a high level of capital formation leads to higher output, and all things being equal, higher
savings and higher capital formation in subsequent years. FDI is considered an endogenous
variable within the model. We assume a positive impact of inward FDI as a percentage of
GDP on domestic investment, which is an ideal scenario. Yet, the results of our empirical
estimation will show the true relationship for the regions being studied. We also assume
that one period lag GDP growth has a positive relation with current period capital
formation. Although we are considering a one period lag, including growth as a regressor
poses an endogeneity problem that our estimation method must take into consideration. The
interest rate is the “cost of borrowing” to engage in capital formation. We therefore assume
an inverse relationship between capital formation and its cost. Domestic credit availability
in the model refers to domestic credit provided by the financial sector, and we assume that
this is negatively related to the current level of domestic investment. We assume that the
lesser the stock of credit available in the domestic lending market, the higher the current
level of domestic investment. This is because the borrowing done to invest domestically
45
will reduce the domestic credit stock. This is consistent with FDI policies in certain
countries aiming at restricting MNCs ability to borrow in the domestic credit market.
It is important to note that the country effect in the model above are unobservable
and potentially correlated with the error term. Also the forward and backward linkages
between FDI and domestic investment, and the inclusion of the lag of domestic investment
pose an endogeneity problem. The existence of these problems may lead to biased and
inconsistent estimates, and calls for a careful choice of the estimation method.
In order to present an in-depth analysis of the impact of FDI inflows on domestic
investment in SSA, we consider the contribution of selected development variables –
human capital, financial development and export sector development – to the desired
impact of FDI on domestic investment in our sample region. To estimate these effects we
include the variable of interest, as well as an interaction of the variables of interest with
FDI. The following three regressions are estimated:
𝐼𝑁𝑉𝑖𝑡 = 𝛽0 + 𝛽1𝐼𝑁𝑉𝑖,𝑡−1 + 𝛽2𝐹𝐷𝐼𝑖𝑡 + 𝛽3𝐺𝑖,𝑡−1 + 𝛽4𝐼𝑁𝑇𝑖𝑡 + 𝛽5𝐶𝑅𝐸𝐷𝑖𝑡 +
𝛽6𝐹𝐼𝑁𝐷𝐸𝑉𝑖𝑡 + 𝛽7𝐹𝐷𝐼𝑖𝑡 × 𝐹𝐼𝑁𝐷𝐸𝑉𝑖𝑡 + 𝛿𝑖 + 휀𝑖𝑡 [6]
𝐼𝑁𝑉𝑖𝑡 = 𝛽0 + 𝛽1𝐼𝑁𝑉𝑖,𝑡−1 + 𝛽2𝐹𝐷𝐼𝑖𝑡 + 𝛽3𝐺𝑖,𝑡−1 + 𝛽4𝐼𝑁𝑇𝑖𝑡 + 𝛽5𝐶𝑅𝐸𝐷𝑖𝑡 +
𝛽6𝐻𝑈𝑀𝐶𝐴𝑃𝑖𝑡 + 𝛽7𝐹𝐷𝐼𝑖𝑡 × 𝐻𝑈𝑀𝐶𝐴𝑃𝑖𝑡 + 𝛿𝑖 + 휀𝑖𝑡 [7]
𝐼𝑁𝑉𝑖𝑡 = 𝛽0 + 𝛽1𝐼𝑁𝑉𝑖,𝑡−1 + 𝛽2𝐹𝐷𝐼𝑖𝑡 + 𝛽3𝐺𝑖,𝑡−1 + 𝛽4𝐼𝑁𝑇𝑖𝑡 + 𝛽5𝐶𝑅𝐸𝐷𝑖𝑡 +
𝛽6𝐸𝑋𝑃𝑂𝑅𝑇𝑖𝑡 + 𝛽7𝐹𝐷𝐼𝑖𝑡 × 𝐸𝑋𝑃𝑂𝑅𝑇𝑖𝑡 + 𝛿𝑖 + 휀𝑖𝑡 [8]
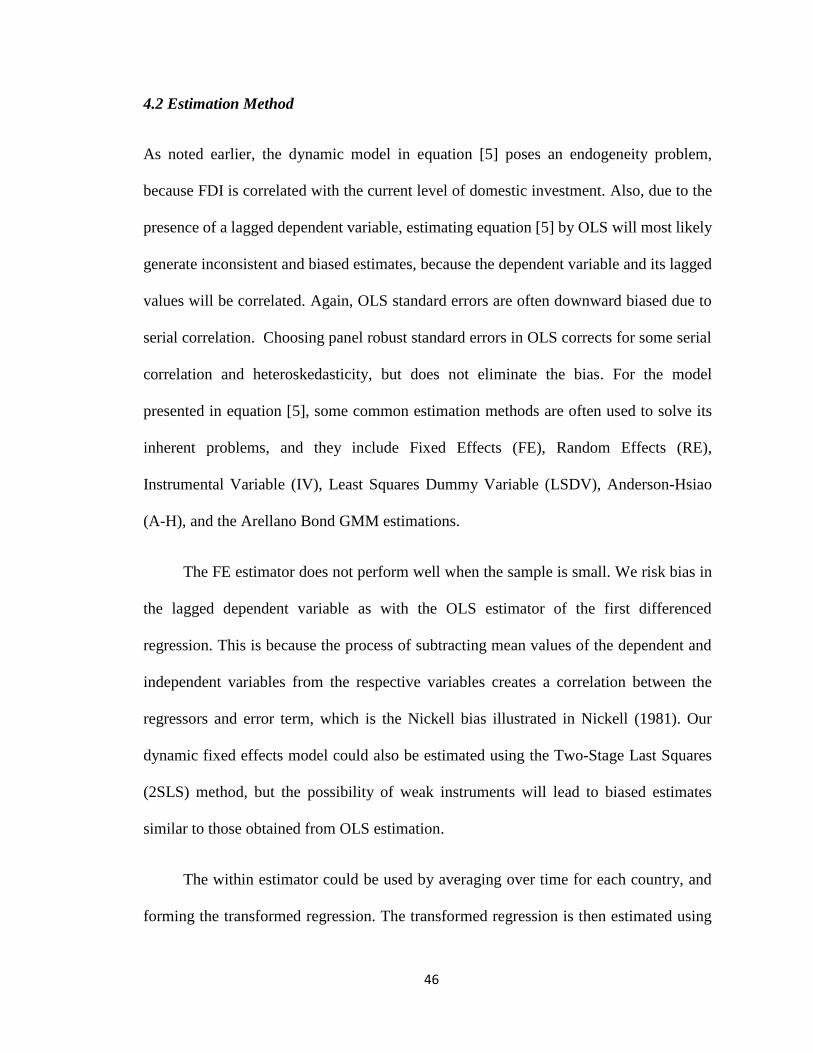
46
4.2 Estimation Method
As noted earlier, the dynamic model in equation [5] poses an endogeneity problem,
because FDI is correlated with the current level of domestic investment. Also, due to the
presence of a lagged dependent variable, estimating equation [5] by OLS will most likely
generate inconsistent and biased estimates, because the dependent variable and its lagged
values will be correlated. Again, OLS standard errors are often downward biased due to
serial correlation. Choosing panel robust standard errors in OLS corrects for some serial
correlation and heteroskedasticity, but does not eliminate the bias. For the model
presented in equation [5], some common estimation methods are often used to solve its
inherent problems, and they include Fixed Effects (FE), Random Effects (RE),
Instrumental Variable (IV), Least Squares Dummy Variable (LSDV), Anderson-Hsiao
(A-H), and the Arellano Bond GMM estimations.
The FE estimator does not perform well when the sample is small. We risk bias in
the lagged dependent variable as with the OLS estimator of the first differenced
regression. This is because the process of subtracting mean values of the dependent and
independent variables from the respective variables creates a correlation between the
regressors and error term, which is the Nickell bias illustrated in Nickell (1981). Our
dynamic fixed effects model could also be estimated using the Two-Stage Last Squares
(2SLS) method, but the possibility of weak instruments will lead to biased estimates
similar to those obtained from OLS estimation.
The within estimator could be used by averaging over time for each country, and
forming the transformed regression. The transformed regression is then estimated using
47
pooled OLS. Similarly, first difference estimation and dummy variable estimation can be
also used, and estimated by pooled OLS. First differencing the original model removes
both the constant term and the individual effect. Considering this, equation [5] becomes
∆𝐼𝑁𝑉𝑖𝑡 = 𝛽1∆𝐼𝑁𝑉𝑖,𝑡−1 + 𝛽2∆𝐹𝐷𝐼𝑖𝑡 + 𝛽3∆𝐺𝑖,𝑡−1 + 𝛽4∆𝐼𝑁𝑇𝑖𝑡 + 𝛽5∆𝐶𝑅𝐸𝐷𝑖𝑡 + ∆휀𝑖𝑡 [9]
However, in the above specification, ∆𝐼𝑁𝑉𝑖,𝑡−1 still contains 𝐼𝑁𝑉𝑖,𝑡−1, and ∆휀𝑖𝑡 now
contains ∆휀𝑖𝑡−1, leading to correlation between the differenced lagged dependent variable
and the differenced error term.
The instrumental variable approach implemented by the Anderson-Hsiao method
considers instrumenting with second, third and further lags of the dependent variable to
deal with the correlation between the differenced lagged dependent variable and the
differenced error term. Assuming the error term to be independently and identically
distributed, we have
(𝐸(∆휀𝑖𝑡|𝐼𝑁𝑉𝑖,𝑡−2, 𝐼𝑁𝑉𝑖,𝑡−3, … ) = 0
The GMM estimator, as developed by Arellano and Bond (1991), builds on the Dynamic
Panel Data (DPD) approach developed in the earlier work of Holtz-Eakin, Newey and
Rosen (1988). The DPD approach considers the instrumental variable with lags method
to be insufficient, and builds on this approach in the GMM context to form more efficient
estimates of the dynamic panel estimator. The ensuing works of Arellano and Bover
(1995) and Blundell and Bond (1998), helped to further expand this method. There are
two approaches – difference GMM and system GMM. The difference GMM estimator
solves the problem of fixed effects by differencing the regression equation. System GMM
approach instruments the identified endogenous variables with variables that are not
48
correlated with the fixed effects. Additionally, it simultaneously deals with the correlation
between the lagged dependent variable and the error term.
The GMM estimation methods are designed for panels with small time periods
compared to the number of observations (small T and large N), linear functional
relationships with a dynamic dependent variable and endogenous explanatory variables.
The difference and system GMM methods also deal with the presence of fixed effects,
heteroskedasticity and serial correlation within observations. The GMM estimator is much
preferred over the OLS and other approaches, especially in dynamic panel data models.
An important revision in Agosin and Machado (2005), which follows Agosin and Mayer
(2000), is the use of one-step GMM instead of the seemingly unrelated regressions
approach employed in the earlier work. The Arellano-Bond approach, much like the
Anderson-Hsiao approach, considers the best instruments to be internal; that is, based on
deeper lags of the endogenous variables. However, Arellano and Bond (1991) discuss that
the Anderson-Hsiao approach fails to consider all of the potential orthogonality
conditions. Both estimators allow the inclusion of strictly exogenous instruments. In the
situation where T is large or relatively close to N, the GMM estimations may not be the
most efficient estimation method. However, estimating two sub-periods leaves T
relatively smaller than N in our estimations. This study will therefore employ the A-H as
well as GMM estimation methods for the full sample estimations, but it will rely on the
System GMM in the extended analysis, because it shows improved efficiency (Roodman,
2006). In the GMM model used for this study, the basic set of external instrumental
variables include export as a percentage of GDP, financial intermediation, and human
capital.
49
We will estimate equation [5] for the full sample for both periods, and then for the
RECs for both periods. This will help us to assess whether the impact of FDI on domestic
investment differs between the two time periods in the case of SSA as a whole, and in the
cases of economic sub-regions as well. This is because, as noted earlier, Africa’s biggest
advantages for attracting FDI include its vast natural resources and high returns on
investment; and for each of the economic sub-regions these factors are among the
prominent reasons for FDI inflows. Also, a lot of initiatives have been implemented across
the continent and its sub-regions especially in the 1990s, in efforts to attract and benefit
positively from foreign investment. Therefore testing separately for each period and each
region will give more insight on whether increased investment efforts in SSA are yielding
the desired results in terms of FDI’s impact on domestic investment. This deliberate sub-
sampling enables us to link our knowledge of the existing political and economic
conditions, which include (but are not limited to) resource endowments and the RECs’
investment policies, to the results from our estimation.
The extended empirical analysis will be implemented for the two sample periods
to reveal the effect of selected development variables on FDI’s impact on domestic
investment in SSA. We use the System GMM technique to estimate the three equations,
which include FDI interacted with human capital, financial development and export.
4.3 Data Description
This study uses a panel dataset from thirty-six selected SSA countries over the time period
1980-2014. The SSA region is selected mainly because it contains a large percentage of
developing countries where domestic investment and economic development are expected
50
to be significantly impacted by FDI. The choice of countries from the SSA region is
dependent on data availability of key explanatory variables.
To ensure an accurate representation of each of the SSA countries in the sample,
five of the eight regional economic blocs in Africa are selected for the comparative analysis
across regional blocs. The selected regional economic blocs are SADC, ECOWAS,
ECCAS, EAC and COMESA. The non-random sub-sample selection would serve as a
robustness check, and would also give us the opportunity to implement a more in-depth
analysis of the relationship between FDI and domestic investment in Africa’s sub-regions,
taking into consideration the existing conditions and the various investment policies in each
economic sub-region.
The impact of FDI on domestic investment has been an important area of research
interest over the years. In order to contribute to the existing literature on the topic, the
sample period is chosen to give a more recent view on the progression of trends in attracting
FDI to the SSA region. Also, by considering two continuous sub-periods, we seek to
highlight the prevailing impact of FDI flows on domestic investment in the SSA region.
This is because during the chosen sample period, many changes have occurred in the SSA
region, allowing it to attract a higher level of inward FDI. These changes include massive
privatization, improvement of political conditions, and creation of favorable economic
atmosphere in many SSA countries.
The data used for our study is taken from two main sources; the World Bank
Development Indicators database and UNCTAD FDI Statistics database. The FDI measure
for our sample is expressed as a percentage of GDP, and the data is taken from UNCTAD.

51
Data for gross capital formation as a percentage of GDP (domestic investment), GDP
growth, real interest rate, domestic credit availability, secondary school enrollment rate
(human capital), broad money as a percentage of GDP (financial development), and export
as a percentage of GDP are taken from the World Bank’s World Development Indicators
database.
52
CHAPTER FIVE
5. EMPIRICAL ESTIMATION AND RESULTS
This chapter presents and discusses the econometric results of this study. The summary
statistics and correlation matrix (presented in Appendix B) offer an initial insight into the
data used for the study. We then go through the process of estimating our dynamic fixed
effects model for the full sample and for the economic sub-regions, taking into
consideration all the challenges associated with the empirical model. For dynamic panel
models like the one presented in equation [5], the Anderson-Hsiao and GMM estimation
methods are commonly used to cater for the problems presented in the empirical model.
Therefore, the empirical analysis for the full sample will cover the different estimation
methods. As discussed earlier, we will rely on the System GMM technique to carry out the
analysis for the two sub-periods and to investigate the influence of human capital, financial
development and export on the effect of inward FDI on domestic investment for our sample.
5.1 Impact of FDI on Domestic Investment for SSA
We first estimate the impact of FDI on domestic investment for the total sample period.
Estimating the dynamic fixed effects model set out in Chapter Four of this study requires
taking into account the fixed effects and endogeneity present. Therefore, the Anderson-
Hsiao (A-H), Difference GMM (DIFF-GMM) and System GMM (SYS-GMM) methods
are used for the total sample estimation. In the results presented in Table 5.1, the Arellano-
Bond AR (2) test shows that we cannot reject the null hypothesis of no second order
autocorrelation for both the SYS-GMM and DIFF-GMM results. Also, the Sargan test
concludes that our estimation is not biased by too many instruments. The results show that
FDI crowds-in domestic investment in SSA for the full sample period, evidenced by
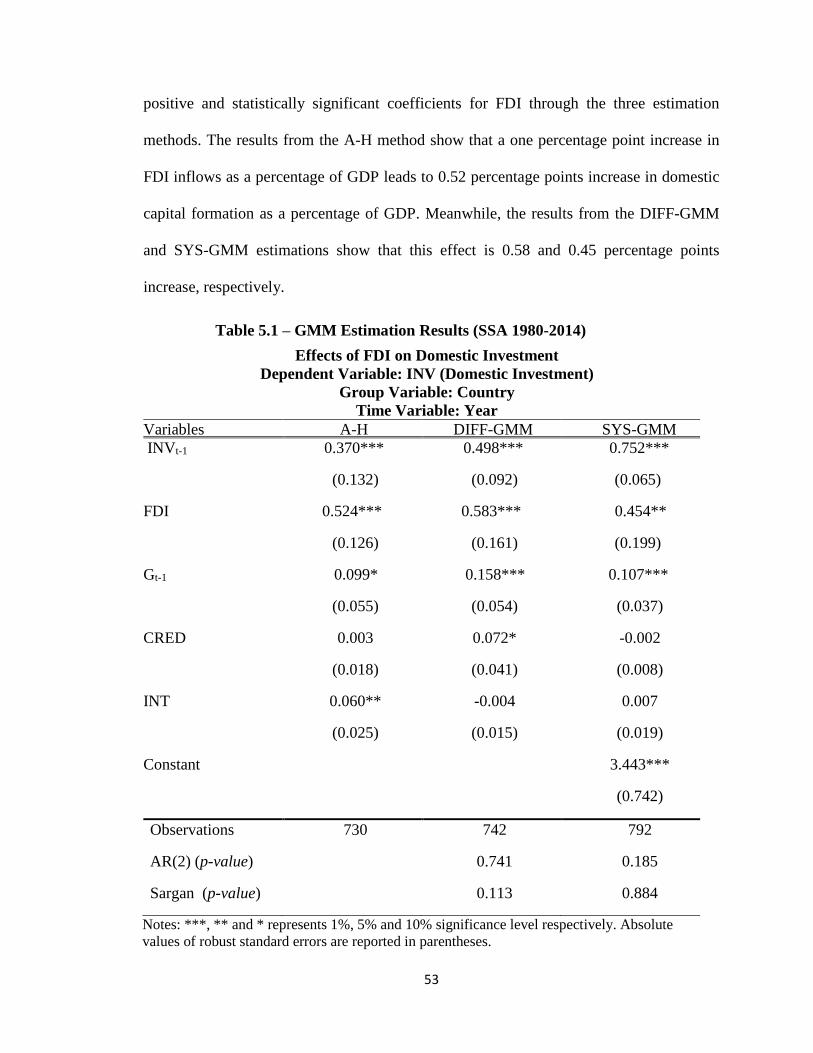
53
positive and statistically significant coefficients for FDI through the three estimation
methods. The results from the A-H method show that a one percentage point increase in
FDI inflows as a percentage of GDP leads to 0.52 percentage points increase in domestic
capital formation as a percentage of GDP. Meanwhile, the results from the DIFF-GMM
and SYS-GMM estimations show that this effect is 0.58 and 0.45 percentage points
increase, respectively.
Table 5.1 – GMM Estimation Results (SSA 1980-2014)
Effects of FDI on Domestic Investment
Dependent Variable: INV (Domestic Investment)
Group Variable: Country
Time Variable: Year
Variables A-H DIFF-GMM SYS-GMM
INVt-1 0.370*** 0.498*** 0.752***
(0.132) (0.092) (0.065)
FDI 0.524*** 0.583*** 0.454**
(0.126) (0.161) (0.199)
Gt-1 0.099* 0.158*** 0.107***
(0.055) (0.054) (0.037)
CRED 0.003 0.072* -0.002
(0.018) (0.041) (0.008)
INT 0.060** -0.004 0.007
(0.025) (0.015) (0.019)
Constant 3.443***
(0.742)
Observations 730 742 792
AR(2) (p-value) 0.741 0.185
Sargan (p-value) 0.113 0.884
Notes: ***, ** and * represents 1%, 5% and 10% significance level respectively. Absolute
values of robust standard errors are reported in parentheses.
54
The results from the three estimation methods for the two sub-periods 1980-
1994 and 1995-2014 are presented in Table 5.2 and Table 5.3, respectively. They show a
crowding-in effect of inward FDI for SSA, though the results are only statistically
significant in the second period. In the second period, the A-H estimation gives a coefficient
of 0.607, indicating that a one percentage point increase in FDI inflows as a percentage of
GDP leads to an increase in domestic investment as a percentage of GDP by 0.60
percentage points. Also, in the second time period, the DIFF-GMM estimation produces an
estimated coefficient of 0.672, which indicates that a one percentage point increase in FDI
inflows as a percentage of GDP generates 0.67 percentage points increase in domestic
investment as a percentage of GDP for SSA as a whole. The SYS-GMM estimation
generates a significant positive effect of FDI on domestic investment in SSA, indicating
that a one percentage point increase in FDI inflows as a percentage of GDP is associated
with 0.53 percentage points increase in domestic investment as a percentage of GDP.
These estimates are consistent with the results presented in many empirical studies
that find a crowding-in effect of FDI on domestic investment for Africa (e.g., Ndikumana
and Verick, 2008), and for other regions (e.g., Borensztein et al., 1998; Bosworth and
Collins, 1999; and Agosin and Mayer, 2000). This is also partly similar to the results in
Adams (2009) that conclude a varying effect – initial crowding-out effect, and positive
effect in later periods. Overall, the results support the conclusions of the existing literature
(De Mello, 1999; Agosin and Mayer, 2000) that the effect of FDI on domestic investment
differs based on the region studied, the period considered, as well as the econometric
method used. The observation of a significant positive effect of FDI on domestic
investment in the full sample period and in the second sub-period implies that SSA’s more
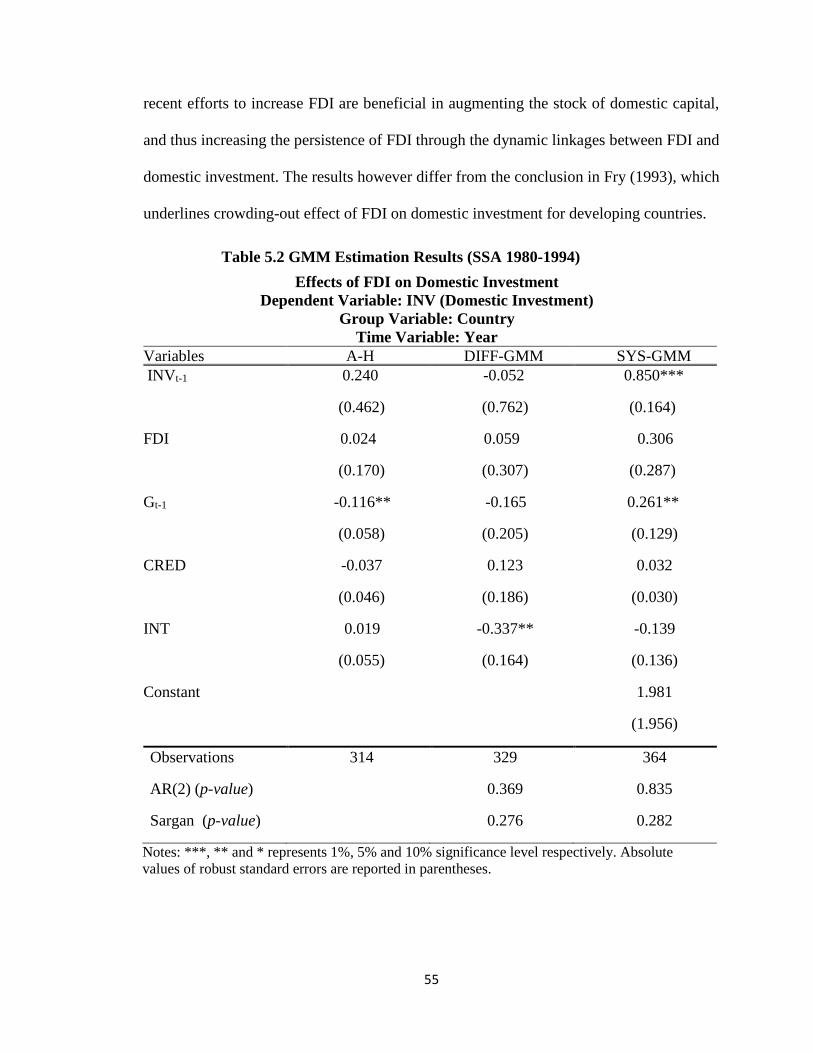
55
recent efforts to increase FDI are beneficial in augmenting the stock of domestic capital,
and thus increasing the persistence of FDI through the dynamic linkages between FDI and
domestic investment. The results however differ from the conclusion in Fry (1993), which
underlines crowding-out effect of FDI on domestic investment for developing countries.
Table 5.2 GMM Estimation Results (SSA 1980-1994)
Effects of FDI on Domestic Investment
Dependent Variable: INV (Domestic Investment)
Group Variable: Country
Time Variable: Year
Variables A-H DIFF-GMM SYS-GMM
INVt-1 0.240 -0.052 0.850***
(0.462) (0.762) (0.164)
FDI 0.024 0.059 0.306
(0.170) (0.307) (0.287)
Gt-1 -0.116** -0.165 0.261**
(0.058) (0.205) (0.129)
CRED -0.037 0.123 0.032
(0.046) (0.186) (0.030)
INT 0.019 -0.337** -0.139
(0.055) (0.164) (0.136)
Constant 1.981
(1.956)
Observations 314 329 364
AR(2) (p-value) 0.369 0.835
Sargan (p-value) 0.276 0.282
Notes: ***, ** and * represents 1%, 5% and 10% significance level respectively. Absolute
values of robust standard errors are reported in parentheses.
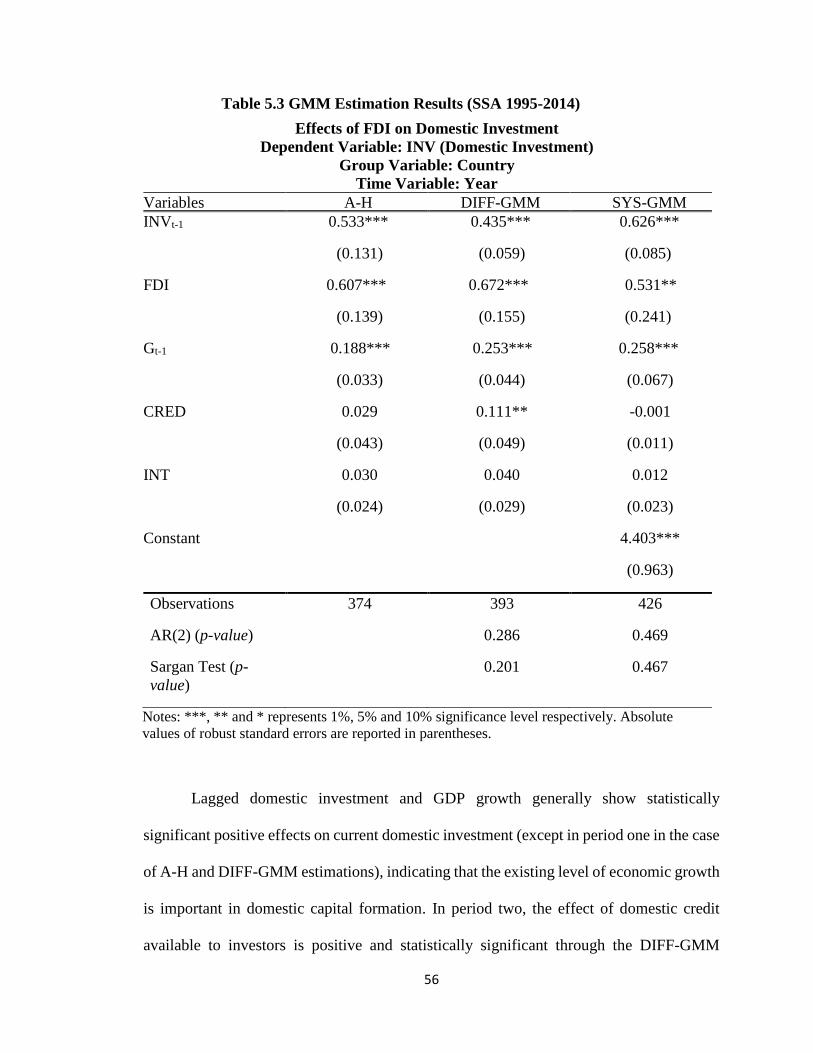
56
Table 5.3 GMM Estimation Results (SSA 1995-2014)
Effects of FDI on Domestic Investment
Dependent Variable: INV (Domestic Investment)
Group Variable: Country
Time Variable: Year
Variables A-H DIFF-GMM SYS-GMM
INVt-1 0.533*** 0.435*** 0.626***
(0.131) (0.059) (0.085)
FDI 0.607*** 0.672*** 0.531**
(0.139) (0.155) (0.241)
Gt-1 0.188*** 0.253*** 0.258***
(0.033) (0.044) (0.067)
CRED 0.029 0.111** -0.001
(0.043) (0.049) (0.011)
INT 0.030 0.040 0.012
(0.024) (0.029) (0.023)
Constant 4.403***
(0.963)
Observations 374 393 426
AR(2) (p-value) 0.286 0.469
Sargan Test (p-
value)
0.201 0.467
Notes: ***, ** and * represents 1%, 5% and 10% significance level respectively. Absolute
values of robust standard errors are reported in parentheses.
Lagged domestic investment and GDP growth generally show statistically
significant positive effects on current domestic investment (except in period one in the case
of A-H and DIFF-GMM estimations), indicating that the existing level of economic growth
is important in domestic capital formation. In period two, the effect of domestic credit
available to investors is positive and statistically significant through the DIFF-GMM
57
estimation. However, this effect is negative and not statistically significant when
implementing the SYS-GMM estimation. A decrease in domestic credit availability could
signify an increase in domestic investment (because domestic investors borrow out of
domestic credit). This could explain the negative relationship in the SYS-GMM results.
However, a more expected situation is that increased availability of credit signifies financial
deepening, and therefore has a positive effect on domestic investment. This is consistent
with the positive and statistically significant DIFF-GMM results in the full sample period
and in the second sub-period. For the full sample period, the A-H results show a positive
and statistically significant effect of real interest rate on domestic investment. Real interest
rate shows varying effects across the three estimation methods in period one, although only
statistically significant for the DIFF-GMM. However, in period two, we find estimates that
are positive but not statistically significant across all estimation methods. This varying
effect could be explained as follows. The interest rate depicts the cost of capital and,
therefore, is expected to affect domestic capital formation negatively. Meanwhile,
increased interest rates would also indicate increased return on investments, and this could
have a positive effect on domestic capital.
Over the long term, the results show that FDI has a positive effect on domestic
investment in SSA. For the full sample period, the statistically significant positive long-run
effect of FDI on domestic investment, determined as 𝛽2 (1 − 𝛽1)⁄ , ranges from 0.83 (A-H
estimation) to 1.83 (SYS-GMM). The results for the sub-periods only show statistically
significant estimates for the second period, and the long-run effect ranges from 1.19 (DIFF-
GMM) to 1.42 (SYS-GMM).
58
As discussed earlier, the Anderson-Hsiao estimator and the Arellano-Bond GMM
estimators are well-suited to solve the problems related to endogeneity, fixed effects and
autocorrelation inherent in our dynamic fixed effects model. The simple A-H estimator uses
differences to estimate, and instruments with lags. The DIFF-GMM estimator transforms
equation [5] using first differences. This removes the fixed effects, and also makes it
possible to instrument with further lags of the dependent variable that are not considered to
be related with the differenced error term. The SYS-GMM estimator uses the original
equation to obtain a system of two equations: one in levels and one in differences. This
makes it possible to use more instruments than in the DIFF-GMM estimator. In the SYS-
GMM model, the variables in the level equations are instrumented with their own first
differences. The increase in the number of instruments is believed to increase efficiency.
Extra caution is required here though, because if the number of instruments is greater than
the number of countries (groups), this causes a poor Sargan test outcome. The latter
indicates that the results from the estimation are weakened by too many instruments. We
rely on the SYS-GMM estimator when carrying out the empirical analysis for the two sub-
periods because it gives greater efficiency in estimation.4 The inclusion of a lagged
dependent variable makes it better to use the SYS-GMM estimator, which yields more
reasonable parameter estimates due to a more efficient instrument set.
4 It is worth noting that many empirical studies on this topic have used the SYS-GMM method to carry out
the estimations (e.g., Agosin and Machado, 2005; Al-Sadig, 2013; and Morrissey and Udomkerdmongkol,
2012).
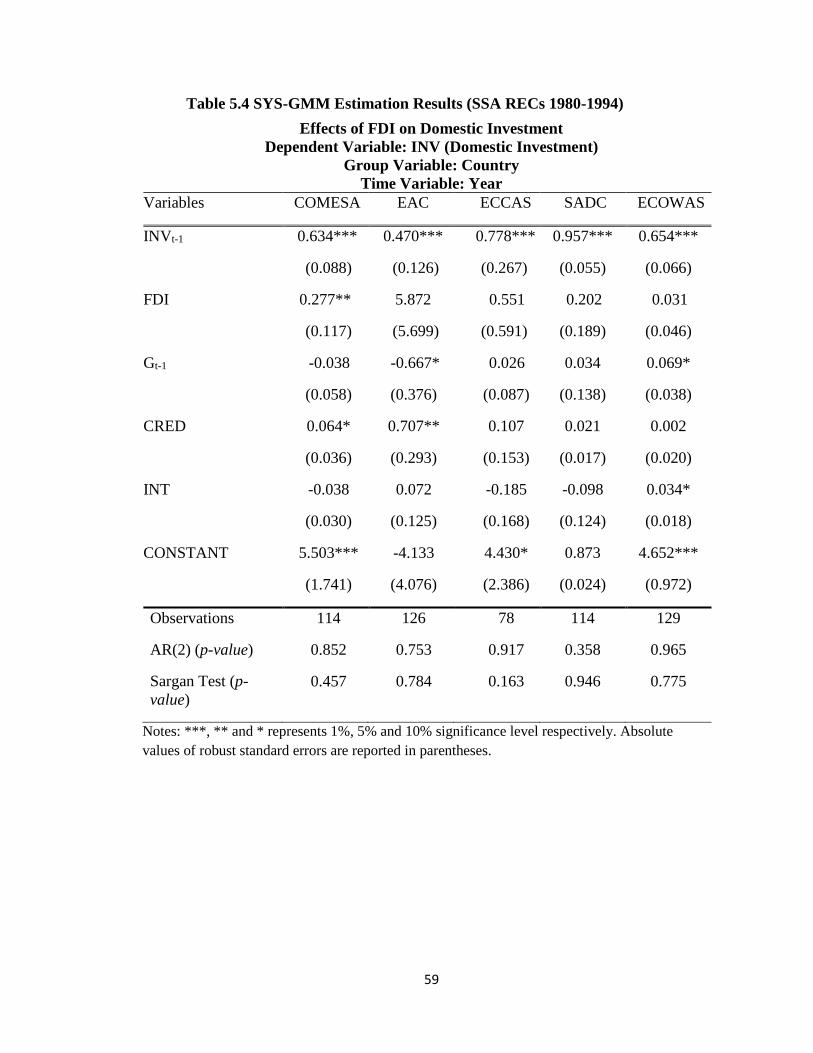
59
Table 5.4 SYS-GMM Estimation Results (SSA RECs 1980-1994)
Effects of FDI on Domestic Investment
Dependent Variable: INV (Domestic Investment)
Group Variable: Country
Time Variable: Year
Variables COMESA EAC ECCAS SADC ECOWAS
INVt-1 0.634*** 0.470*** 0.778*** 0.957*** 0.654***
(0.088) (0.126) (0.267) (0.055) (0.066)
FDI 0.277** 5.872 0.551 0.202 0.031
(0.117) (5.699) (0.591) (0.189) (0.046)
Gt-1 -0.038 -0.667* 0.026 0.034 0.069*
(0.058) (0.376) (0.087) (0.138) (0.038)
CRED 0.064* 0.707** 0.107 0.021 0.002
(0.036) (0.293) (0.153) (0.017) (0.020)
INT -0.038 0.072 -0.185 -0.098 0.034*
(0.030) (0.125) (0.168) (0.124) (0.018)
CONSTANT 5.503*** -4.133 4.430* 0.873 4.652***
(1.741) (4.076) (2.386) (0.024) (0.972)
Observations 114 126 78 114 129
AR(2) (p-value) 0.852 0.753 0.917 0.358 0.965
Sargan Test (p-
value)
0.457 0.784 0.163 0.946 0.775
Notes: ***, ** and * represents 1%, 5% and 10% significance level respectively. Absolute
values of robust standard errors are reported in parentheses.
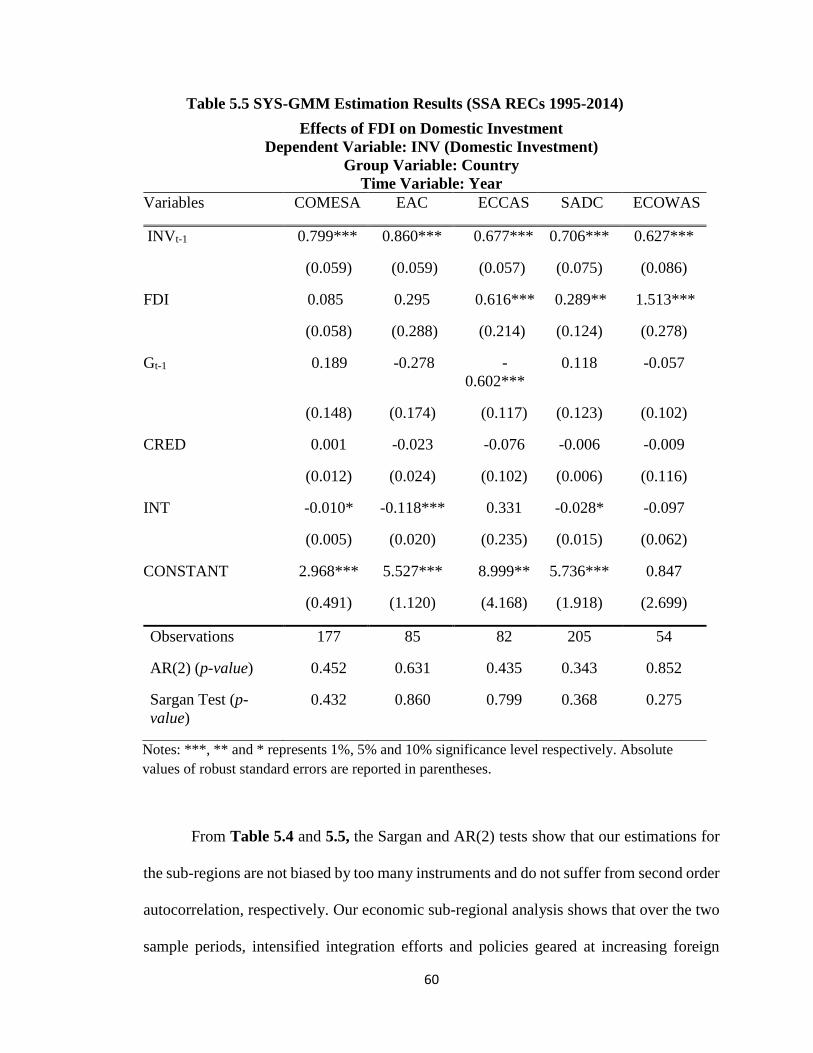
60
Table 5.5 SYS-GMM Estimation Results (SSA RECs 1995-2014)
Effects of FDI on Domestic Investment
Dependent Variable: INV (Domestic Investment)
Group Variable: Country
Time Variable: Year
Variables COMESA EAC ECCAS SADC ECOWAS
INVt-1 0.799*** 0.860*** 0.677*** 0.706*** 0.627***
(0.059) (0.059) (0.057) (0.075) (0.086)
FDI 0.085 0.295 0.616*** 0.289** 1.513***
(0.058) (0.288) (0.214) (0.124) (0.278)
Gt-1 0.189 -0.278 -
0.602***
0.118 -0.057
(0.148) (0.174) (0.117) (0.123) (0.102)
CRED 0.001 -0.023 -0.076 -0.006 -0.009
(0.012) (0.024) (0.102) (0.006) (0.116)
INT -0.010* -0.118*** 0.331 -0.028* -0.097
(0.005) (0.020) (0.235) (0.015) (0.062)
CONSTANT 2.968*** 5.527*** 8.999** 5.736*** 0.847
(0.491) (1.120) (4.168) (1.918) (2.699)
Observations 177 85 82 205 54
AR(2) (p-value) 0.452 0.631 0.435 0.343 0.852
Sargan Test (p-
value)
0.432 0.860 0.799 0.368 0.275
Notes: ***, ** and * represents 1%, 5% and 10% significance level respectively. Absolute
values of robust standard errors are reported in parentheses.
From Table 5.4 and 5.5, the Sargan and AR(2) tests show that our estimations for
the sub-regions are not biased by too many instruments and do not suffer from second order
autocorrelation, respectively. Our economic sub-regional analysis shows that over the two
sample periods, intensified integration efforts and policies geared at increasing foreign
61
investments to RECs have not always led to significantly positive effects of FDI on
domestic investment for many RECs across the time periods. Table 5.4 shows that only
COMESA has a statistically significant crowding-in effect in the first sub-period. However,
Table 5.5 indicates that the positive effect of FDI on domestic investment for COMESA
does not remain statistically significant in the second sub-period. Table 5.5 also shows
significant crowding-in effects in ECCAS, SADC and ECOWAS. The magnitude of this
crowding-in effect differs from region to region, with a one point increase in FDI inflows
as a percentage of GDP leading to 0.61, 0.29, and 1.59 increases in domestic investment as
a ratio of GDP for ECCAS, SADC and ECOWAS, respectively. The estimated coefficients
for COMESA and EAC are positive but they are not statistically significant. The findings
of crowding-in effects of FDI on domestic investment through RECs confirm our results
for SSA as a whole, and they are consistent with the results in earlier works such as
Bosworth and Collins (1999), Ndikumana and Verick (2008), and Apergis et al. (2008).
These studies find a positive effect of FDI on domestic investment for developing and
transitioning regions. Our results differ from Eregha (2011), however, which does not find
a positive effect of FDI on domestic investment for ECOWAS. Over the two sub-periods,
the results show that the crowding-in effect of FDI on domestic investment is strongly
evident in central and western SSA regions. However, the effect appears to be more
dispersed in eastern and southern SSA regions.
Our earlier discussion of SSA’s sub-regions indicates that all the regional economic
blocs used in our study have set up investment agencies, and have generally improved the
investment climate in their regions. Evidence used through our discussions also shows that
there are measures put in place to ensure the attraction of the appropriate kind of foreign
62
investment enterprise, and the maximum benefit of FDI inflows to these regional
economies. The ECOWAS region, which shows the highest positive effect in the second
period from our estimation, is observed to have a high level of economic integration that
has evolved over the years. The region has Nigeria as a member state, which is the country
with the highest FDI inflows in SSA. ECOWAS has also harmonized its investment
approach, and this may explain the highest significant positive impact of FDI on domestic
capital formation for this region in the second time period. Our earlier discussion of SSA’s
regional economic blocs indicates that the ECCAS region has made tremendous effort to
increase peace and political stability, as well as undergoing continuous economic
reconstruction after years of political unrest in some member states. There are significant
opportunities for growth in this region, and this may be the reason why the ECCAS region
has the second highest positive effect of FDI on domestic investment. The results for the
SADC region are also positive and statistically significant in the second period. There is
evidence that FDI inflow into this region has increased since the major economic
liberalization that took place in the late 1990s. The region initiated its Trade Protocol in the
1990s, and this has further liberalized intra-regional trade, and improved investment in the
region. South Africa is a major economic player in this region, and has initiated a lot of
investment throughout the entire SADC region. The COMESA region is the largest trade
and investment area in SSA, and was mainly formed to overcome the economic problems
faced by individual states through economic integration. Although there is a positive effect
of foreign investment on domestic investment in this region, this is not reflective of the
economic size-related capacity that this region has to benefit from FDI spillovers. This may
be due to the fact that this region has had problems with its economic integration efforts.
FDI in this region has been also concentrated in mostly mineral and oil rich countries.
63
However, the COMESA region may still be on the right course, and the establishment of
institutions, such as the Competition Commission, has produced guidelines for mergers and
acquisitions, and has regulated market competition and consumer protection. Such policies
could streamline incoming FDI, and enhance its positive effect on domestic investment in
the COMESA region. Lastly, the estimated parameter of FDI is positive but not statistically
significant in the case of the EAC region. From our earlier discussion on the SSA’s sub-
regions, we indicated that the EAC bloc is the fastest growing economic region in Africa,
where growth is less sharply skewed towards resource rich countries. The crowding-in
effect is however not statistically significant, and this result may be due to conflicts among
member states on the extent of foreign investment liberalization. Also, FDI inflows to this
region largely go to the manufacturing, construction and tourism sectors, and may require
more diversification.
5.2 Selected Development Variables
For our analysis of the selected development variables, we use the SYS-GMM estimation
to tackle endogeneity in the model. Summary statistics for the development variables can
be found in Appendix B. The variable for financial sector development is represented by
broad money as a percentage of GDP, and it is denoted by FINDEV. The human capital
variable is a measure of secondary school enrolment as a ratio of the secondary school aged
population, and it is denoted by HUMCAP. Export sector development is also measured by
exports as a percentage of GDP, and it is denoted by EXPORT. Table 5.6 shows the results
for the first time period, and Table 5.7 shows the results for the second time period.
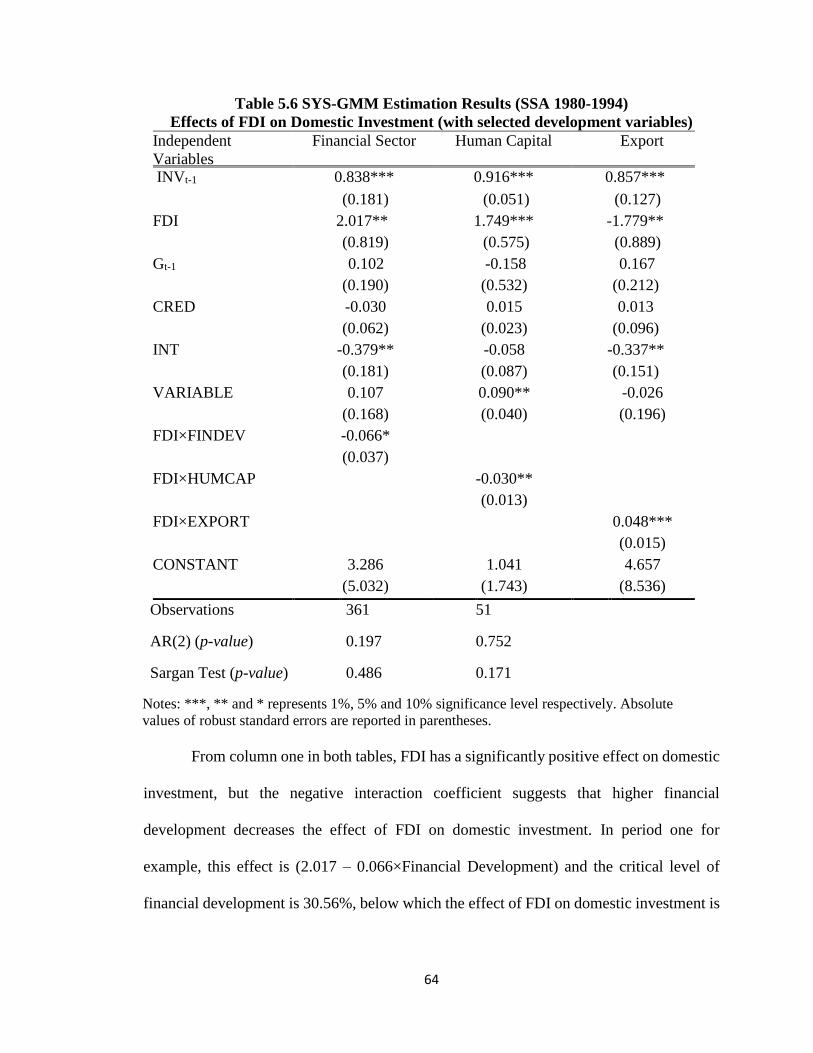
64
Table 5.6 SYS-GMM Estimation Results (SSA 1980-1994)
Effects of FDI on Domestic Investment (with selected development variables)
Independent
Variables
Financial Sector Human Capital Export
INVt-1 0.838*** 0.916*** 0.857***
(0.181) (0.051) (0.127)
FDI 2.017** 1.749*** -1.779**
(0.819) (0.575) (0.889)
Gt-1 0.102 -0.158 0.167
(0.190) (0.532) (0.212)
CRED -0.030 0.015 0.013
(0.062) (0.023) (0.096)
INT -0.379** -0.058 -0.337**
(0.181) (0.087) (0.151)
VARIABLE 0.107 0.090** -0.026
(0.168) (0.040) (0.196)
FDI×FINDEV -0.066*
(0.037)
FDI×HUMCAP -0.030**
(0.013)
FDI×EXPORT 0.048***
(0.015)
CONSTANT 3.286 1.041 4.657
(5.032) (1.743) (8.536)
Observations 361 51
AR(2) (p-value) 0.197 0.752
Sargan Test (p-value) 0.486 0.171
Notes: ***, ** and * represents 1%, 5% and 10% significance level respectively. Absolute
values of robust standard errors are reported in parentheses.
From column one in both tables, FDI has a significantly positive effect on domestic
investment, but the negative interaction coefficient suggests that higher financial
development decreases the effect of FDI on domestic investment. In period one for
example, this effect is (2.017 – 0.066×Financial Development) and the critical level of
financial development is 30.56%, below which the effect of FDI on domestic investment is
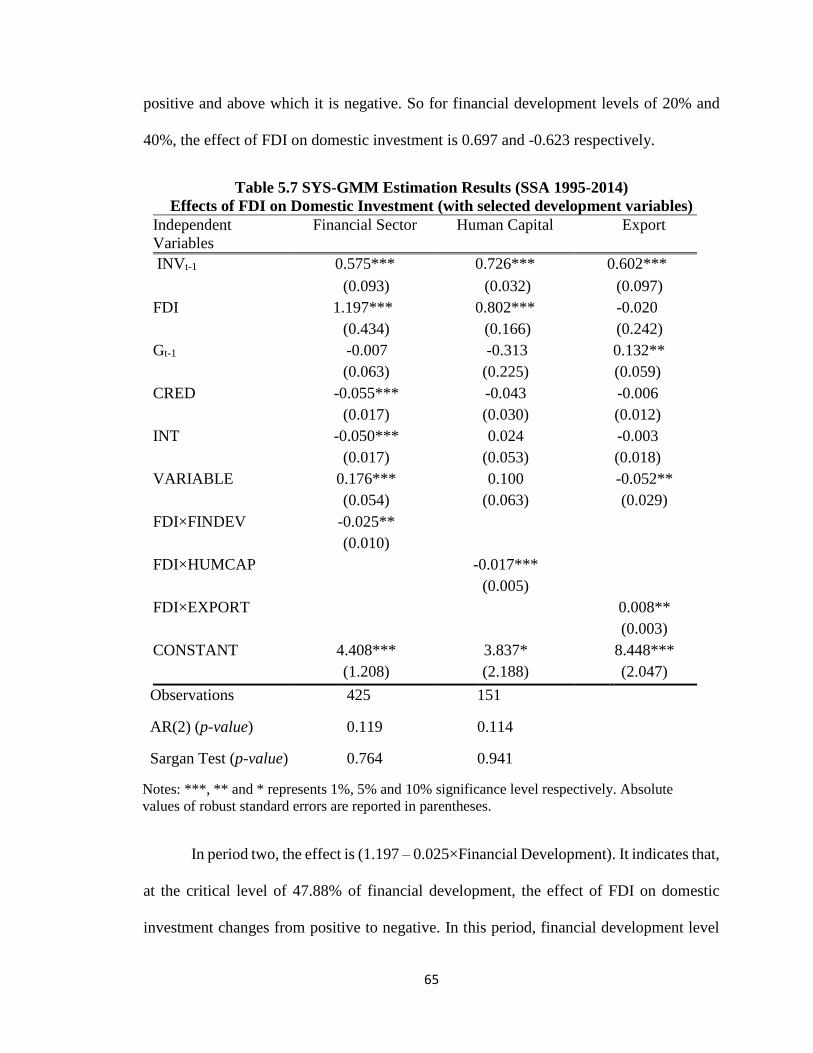
65
positive and above which it is negative. So for financial development levels of 20% and
40%, the effect of FDI on domestic investment is 0.697 and -0.623 respectively.
Table 5.7 SYS-GMM Estimation Results (SSA 1995-2014)
Effects of FDI on Domestic Investment (with selected development variables)
Independent
Variables
Financial Sector Human Capital Export
INVt-1 0.575*** 0.726*** 0.602***
(0.093) (0.032) (0.097)
FDI 1.197*** 0.802*** -0.020
(0.434) (0.166) (0.242)
Gt-1 -0.007 -0.313 0.132**
(0.063) (0.225) (0.059)
CRED -0.055*** -0.043 -0.006
(0.017) (0.030) (0.012)
INT -0.050*** 0.024 -0.003
(0.017) (0.053) (0.018)
VARIABLE 0.176*** 0.100 -0.052**
(0.054) (0.063) (0.029)
FDI×FINDEV -0.025**
(0.010)
FDI×HUMCAP -0.017***
(0.005)
FDI×EXPORT 0.008**
(0.003)
CONSTANT 4.408*** 3.837* 8.448***
(1.208) (2.188) (2.047)
Observations 425 151
AR(2) (p-value) 0.119 0.114
Sargan Test (p-value) 0.764 0.941
Notes: ***, ** and * represents 1%, 5% and 10% significance level respectively. Absolute
values of robust standard errors are reported in parentheses.
In period two, the effect is (1.197 – 0.025×Financial Development). It indicates that,
at the critical level of 47.88% of financial development, the effect of FDI on domestic
investment changes from positive to negative. In this period, financial development level
66
of 20% will lead to 0.697 percentage points increase in the impact of FDI on domestic
investment, while a financial development level of 70% will lead to 0.553 percentage points
decrease in the impact of FDI on domestic investment. This result can be attributed to the
fact that as financial development occurs, it may have a positive effect on domestic
investment as shown by the positive coefficient of financial development in both periods:
0.107 in period one (which is not statistically significant) and 0.176 in period two (which
is statistically significant at the 1% level). However, increasing financial development
could attract more FDI at the expense of domestic investment, eventually resulting in
crowding-out of domestic investment by foreign investment. The results for the role of
financial development in FDI’s impact on domestic investment in SSA could be the case
when foreign investors engage in heavy borrowing from local banks, instead of fully
transferring capital from abroad. In this case greater financial development benefits foreign
investors, at the detriment of domestic investors. This result differs from the findings in
Alfaro et al. (2004, 2009) which indicate that financial development complements the effect
of FDI on economic growth in cross country studies.
From the results in the second column of Table 5.6 and Table 5.7, it can be seen
that the estimation for human capital in both periods is restricted in terms of number of
observations by limited data for human capital in SSA. For the first period, the estimated
coefficient of FDI is positive and statistically significant at the 1% level. The interaction
variable is negative and it is also statistically significant at the 5% level. The effect of FDI
on domestic investment in the presence of the interaction term is (1.749 – 0.030×Human
Capital). The critical level of human capital beyond which FDI crowds out domestic
investment is 58.3%. For human capital levels of 30% and 70%, the impact of FDI on
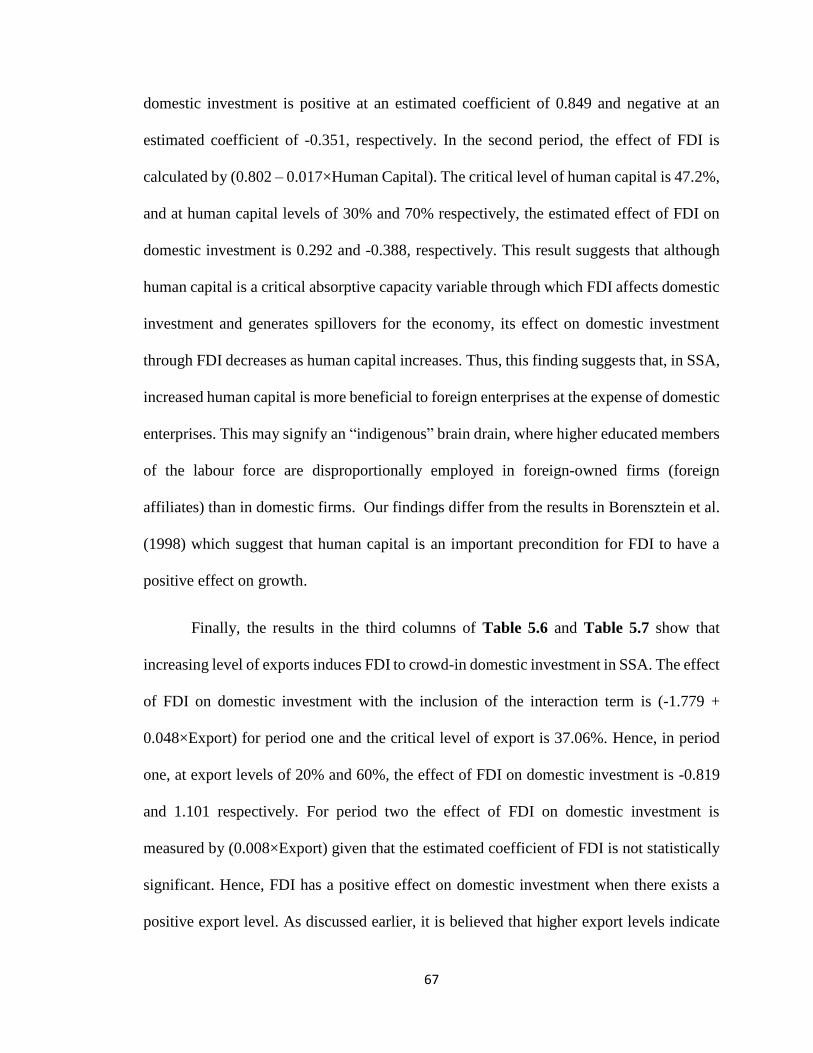
67
domestic investment is positive at an estimated coefficient of 0.849 and negative at an
estimated coefficient of -0.351, respectively. In the second period, the effect of FDI is
calculated by (0.802 – 0.017×Human Capital). The critical level of human capital is 47.2%,
and at human capital levels of 30% and 70% respectively, the estimated effect of FDI on
domestic investment is 0.292 and -0.388, respectively. This result suggests that although
human capital is a critical absorptive capacity variable through which FDI affects domestic
investment and generates spillovers for the economy, its effect on domestic investment
through FDI decreases as human capital increases. Thus, this finding suggests that, in SSA,
increased human capital is more beneficial to foreign enterprises at the expense of domestic
enterprises. This may signify an “indigenous” brain drain, where higher educated members
of the labour force are disproportionally employed in foreign-owned firms (foreign
affiliates) than in domestic firms. Our findings differ from the results in Borensztein et al.
(1998) which suggest that human capital is an important precondition for FDI to have a
positive effect on growth.
Finally, the results in the third columns of Table 5.6 and Table 5.7 show that
increasing level of exports induces FDI to crowd-in domestic investment in SSA. The effect
of FDI on domestic investment with the inclusion of the interaction term is (-1.779 +
0.048×Export) for period one and the critical level of export is 37.06%. Hence, in period
one, at export levels of 20% and 60%, the effect of FDI on domestic investment is -0.819
and 1.101 respectively. For period two the effect of FDI on domestic investment is
measured by (0.008×Export) given that the estimated coefficient of FDI is not statistically
significant. Hence, FDI has a positive effect on domestic investment when there exists a
positive export level. As discussed earlier, it is believed that higher export levels indicate
68
access to larger markets, which creates room for both foreign and domestic firms to grow.
This is evidenced through the emphasizing implications of exports for FDI’s effect on
domestic investment in both periods. These results are consistent with those reported in
Eregha (2011) that reveal that export openness positively affects the accumulation of
domestic investment. Also, the results are consistent with the findings in Balasubramanyam
et al. (1996) which conclude that the policies consistent with export promotion strategy
leads to free markets, and increases domestic investment through specialization and
investment in research and development. This result signifies that export orientation
policies are needed in SSA economies to ensure optimal benefits from inward FDI.
69
CHAPTER SIX
SUMMARY AND CONCLUSION
6.1 Summary
FDI is often considered as a main contributing factor to economic development in most
developing regions due to its positive spillover effects, and its ability to fill investment,
managerial and foreign exchange gaps. These FDI characteristics have promoted several
policies in developing countries aimed at improving the business climate to attract more
FDI. In the early 1980s, several economies in SSA and other developing regions embarked
on export promotion and open-economy strategies, particularly through the Structural
Adjustment Programs (SAPs) introduced by the IMF. These strategies served in creating
incentives to attract FDI. In the 1990s, SSA countries embarked on privatization schemes,
as well as improvement of political and economic climate in order to draw more foreign
investment into their economies. RECs in SSA have also intensified their efforts to attract
FDI, and have instituted several policies aimed at improving investment and ensuring the
productivity of foreign investments. However, the true impact of FDI on domestic
investment remains inconclusive. Many empirical studies have investigated this effect for
various regions and using different econometric techniques. This thesis contributes to this
empirical literature by examining the impact of FDI on domestic investment in SSA as a
whole, and in five selected regional economic blocs in SSA.
This study implements the econometric analysis by using a dynamic fixed effects
model to account for the linkages between FDI and domestic investment in SSA as a whole,
and in selected SSA sub-regions. The estimation is executed for the total sample period,
and for two sub-periods to determine if the efforts to attract FDI in SSA have yielded the
desired results in terms of domestic investment. We use the A-H, DIFF-GMM and SYS-
70
GMM approach to estimate the relationship between FDI and domestic investment with a
panel dataset covering thirty-six SSA countries for the time period from 1980 to 1994, and
then for the time period from 1995 to 2014. Existing studies that apply SYS-GMM in
estimating dynamic panel models conclude that this econometric approach provides more
efficient estimates than the OLS or fixed effects methods which are prone to estimation
bias. The SYS-GMM is also more efficient than the alternative DIFF-GMM.
This study further considers the effect of FDI on five of SSA’s RECs, namely the
EAC, ECCAS, SADC, ECOWAS and COMESA. This breakdown of the sample by RECs
provides a robustness check, and it gives us the opportunity to relate the economic
conditions and policies in these sub-regions to the impact of FDI on domestic investment.
Estimation over two distinct time allows us to investigate whether economic integration
and investment awareness in Africa’s RECs have affected FDI’s impact on domestic
investment in these economic regions. Again, most of the existing literature concludes that
there is a need for absorptive capacity to maximize the spillover effects of FDI on the
domestic economy. Therefore, this thesis explores the complementarity between FDI and
three indicators: financial development, human capital and export when examining the
impact of FDI on domestic investment in SSA. It also investigates whether this relationship
has changed over the two selected time periods.
The GMM estimation of our dynamic fixed effects model reveals that FDI crowds-
in domestic investment for the whole SSA sample in both time periods. However the results
are only statistically significant in the second period. Further examination of the results
reveals that the existing domestic capital has a positive effect on domestic investment, as
shown by a statistically significant positive coefficient of the lagged dependent variable.
71
The level of economic growth positively affects domestic investment in the second period.
The positive effect of FDI on domestic investment especially in the second time period
(1995-2014) could be attributed to the effectiveness of the policies and initiatives adopted
by the AU, and by the various RECs and individual countries to attract inward FDI. The
results are generally consistent with earlier empirical studies pertaining to the SSA region,
and with the ideas that FDI is beneficial to recipient countries, especially in the case of
developing regions.
Results from the sub-regional analysis show crowding-in effect in varying degrees,
and affirm positive results of FDI on domestic investment for the entire SSA. Statistically
significant crowding-in effects are observed for the ECCAS, SADC and ECOWAS regions.
The crowding-in effect of FDI on domestic investment appears to be more concentrated in
the central and western Africa, but is more dispersed in the south and much more in the
east. Nevertheless, follow-up investigations of the impact of FDI on domestic investment
for individual countries within each region could reveal a more specific relationship
between FDI and domestic investment. The positive impact of FDI on domestic investment
in SSA’s RECs can be attributed to the implementation of various investment initiatives in
these sub-regions. The increasing levels of economic integration in these RECs make it
easier to harmonize investment policies across several countries. These policies would
ensure a steady flow of FDI into these economies, and would help developing the ability to
realize the positive spillover effects from FDI activities to augment domestic capital
formation. For instance, policies, such as SADC’s Trade Protocol, focus on increasing
investment and improving productivity throughout the region. Agencies, such as the EAC’s
Investment Promotion and Private Sector Development Agenda, span the region’s
72
industrialization, trade agreements and privatization reforms. Also, the COMESA’s
Competition Commission acts as a regulatory body for foreign investors. These policies
and agencies are deemed to be key factors in increasing FDI inflows, and in ensuring
positive effects on regional development.
Our estimation of the role played by selected development variables in the effect of
FDI on domestic investment shows statistically significant impacts of financial
development and export in both time periods, and of human capital in the second period.
Higher levels of financial development and human capital appear to cause FDI to crowd
out domestic investment. However, higher export levels lead to crowding-in effect of FDI
on domestic investment. This reveals that greater financial development and increasing
human capital in SSA benefits foreign investors at the expense of domestic investors. When
foreign firms choose to engage in heavy borrowing from domestic banks, this could lead to
the crowding-out of domestic investors. This is because foreign firms are often more
competitive. Also, as human capital levels increase in the developing economies of SSA, it
is more likely that higher educated members of the labour force would be employed in
MNCs and other foreign ventures, causing the crowding-out of domestic firms. On the other
hand, increasing export levels could be crowding-in domestic investment, by establishing
a larger international market for the output of both foreign and domestic firms.
6.2 Policy Implications and Recommendations
Our empirical results suggest that FDI has led to crowding-in of domestic investment in
SSA, especially in recent time periods. This is also reaffirmed by the positive effects of
FDI on domestic investment in many SSA’s RECs. Therefore, the results of this thesis
indicate that SSA (and perhaps other developing regions) should not exclusively target the
73
amount of inward FDI to the region, but there should be policies intended to restructure the
existing economic conditions in order to maximize FDI spillover effects on domestic
investment. The African continent has taken important steps to improve the investment
climate. The NEPAD institution and the increased economic integration among the RECs
have helped in attracting inward FDI. This thesis recommends a greater focus on the
structure and levels of key development variables that will ensure optimal positive effect
of FDI on domestic investment.
From our results, an improvement in the financial development in Africa negatively
impacts the effect of FDI on domestic investment. Policies that could turn this into a
positive impact would include improving the functions of entities that provide various
financial services such as credit, insurance, accountancy, consumer finance, as well as stock
and investment brokerage. These services are fundamental to the attraction of domestic
capital formation, and also form a vital framework within which FDI operates to improve
domestic investment and, ultimately, economic development. SSA countries that do not
have these institutions need to build them up. Meanwhile, SSA countries that do have these
institutions need to strengthen them up and protect them, in order to allow them to carry
out more efficiently their various roles in the domestic economy. More importantly, there
should be financial policies tailored and intended to build domestic industries.
The empirical results also show that high levels of human capital reduce the impact
of FDI on domestic investment. Existing empirical studies suggest that managerial and
technical spillovers from FDI require that the existing labour force possesses the skills
needed to apply the new information and technology in domestic enterprises. Therefore,
the key policy implications for Africa include providing universal access to education. The
74
Millennium Development Goals advocate free basic education, and it is important that SSA
accelerates its efforts in improving access and quality of education, to ensure that the labour
force enjoys not only basic literacy but also technical know-how skills to fully exploit
positive spillovers from FDI. However, the caveat here is that entrepreneurship must be
highly encouraged alongside education, to ensure that increased human capital fully
benefits the domestic economy. For example, graduates from tertiary institutions would
utilize entrepreneurial skills to employ themselves, leading to expansion of the domestic
economy.
Policies intended to expand the export sector in Africa would provide greater access
to international markets, and would expand the capacity of domestic industries. This can
be achieved when SSA countries follow an export promotion strategy, as outlined in
Balasubramanyam et al. (1996). One suitable policy is to capitalize on the inflow of FDI to
expand highly profitable sectors in which the domestic country enjoys comparative
advantage. Production in these sectors should be geared towards export, since domestic
demand alone will not generate enough revenue. Over time, the export sector would turn
out to be a major contributor to economic development. This leads to a positive trade
balance and a larger economy compared to an alternative economy based on an import
substitution policy. SSA governments could introduce policies aiming at consolidating
production and export activities in key sectors such as, agriculture and minerals. An export-
oriented policy would also promote market competition in international markets, leading
to the expansion of competitive domestic industries through FDI spillover effects, research
and development, and specialization. Hence, such policy would promote the economic
development and the competitiveness of the SSA region.

75
76
REFERENCES
Acar, Sevil, Bilge Eris, and Mahmut Tekce. "The effect of foreign direct investment
on domestic investment: Evidence from MENA countries." European Trade Study Group
(ETSG) 14th Annual Conference, September, Leuven. 2012.
Adams, Samuel. "Can foreign direct investment (FDI) help to promote growth in
Africa?" African Journal of Business Management 3.5 (2009): 178-183.
Adams, Samuel. "Foreign direct investment, domestic investment, and economic
growth in Sub-Saharan Africa." Journal of Policy Modeling 31.6 (2009): 939-949.
African Development Bank, African Development Fund. "Economic Community
of Central African States Regional Integration Assistance Strategy Paper." 2005-2009.
Retrieved from http://www.afdb.org/fileadmin/uploads/afdb/Documents/Project-and-
Operations/ADB-BD-WP-2005-84-EN-ECCAS-RIASP-2005-09.PDF
Agosin, M., and Ricardo Mayer. "Foreign investment in developing countries: does
it crowd in domestic investment?" UNCTAD Discussion Papers No. 146. (2000).
Alege, Philip O., and Adeyemi Adefioye Ogundipe. "Foreign Direct Investment and
Economic Growth in ECOWAS: A System-GMM Approach." Covenant Journal of
Business and Social Sciences 5.2 (2014).
Alfaro, Laura, et al. "FDI and economic growth: the role of local financial markets."
Journal of international economics 64.1 (2004): 89-112.
Alfaro, Laura, Sebnem Kalemli‐Ozcan, and Selin Sayek. "FDI, productivity and
financial development." The World Economy 32.1 (2009): 111-135.
Al-Sadig, Ali. "The effects of foreign direct investment on private domestic
investment: evidence from developing countries." Empirical Economics 44.3 (2013): 1267-
1275.
Apergis, Nicholas, Katerina Lyroudi, and Athanasios Vamvakidis. "The
relationship between foreign direct investment and economic growth: evidence from
transition countries." Transition Studies Review 15.1 (2008): 37-51.
Arellano, Manuel, and Olympia Bover. "Another look at the instrumental variable
estimation of error-components models." Journal of econometrics 68.1 (1995): 29-51.
Arellano, Manuel, and Stephen Bond. "Some tests of specification for panel data:
Monte Carlo evidence and an application to employment equations." The review of
economic studies 58.2 (1991): 277-297.
Barba-Navaretti, Giorgio, Anthony Venables, and Frank Barry. Multinational firms
in the world economy. Princeton University Press, 2004.
77
Barrios, Salvador, Holger Görg, and Eric Strobl. "Foreign direct investment,
competition and industrial development in the host country." European Economic
Review 49.7 (2005): 1761-1784.
Bauer, Peter T. "NH Stern on substance and method in development economics."
Journal of Development Economics 2.4 (1975): 387-405.
Beck, Thorsten, Michael J. Fuchs, and Marilou Uy. "Finance in Africa-
achievements and challenges." World Bank Policy Research Working Paper Series, Vol
(2009).
Blundell, Richard, and Stephen Bond. "Initial conditions and moment restrictions
in dynamic panel data models." Journal of econometrics 87.1 (1998): 115-143.
Borensztein, Eduardo, Jose De Gregorio, and Jong-Wha Lee. "How does foreign
direct investment affect economic growth?" Journal of international Economics 45.1
(1998): 115-135.
Bosworth, Barry P., Susan M. Collins, and Carmen M. Reinhart. "Capital flows to
developing economies: implications for saving and investment." Brookings papers on
economic activity (1999): 143-180.
Brainard, S. Lael. "An Empirical Assessment of the Proximity-Concentration
Trade-off between Multinational Sales and Trade." American Economic Review 87, no. 4
(1997): 520-544.
Caner, Mehmet, and Bruce E. Hansen. "Instrumental variable estimation of a
threshold model." Econometric Theory 20.05 (2004): 813-843.
Caner, Mehmet. "A note on least absolute deviation estimation of a threshold
model." Econometric Theory 18.03 (2002): 800-814.
Caves, Richard E. "International corporations: The industrial economics of foreign
investment." Economica 38.149 (1971): 1-27.
Chee, Yen Li, and Mahendhiran Nair. "The impact of FDI and financial sector
development on economic growth: Empirical evidence from Asia and Oceania."
International Journal of Economics and Finance 2.2 (2010): 107.
De Mello, Luiz R. "Foreign direct investment-led growth: evidence from time series
and panel data." Oxford economic papers 51.1 (1999): 133-151.
Deok-Ki Kim, David, and Jung-Soo Seo. "Does FDI inflow crowd out domestic
investment in Korea?" Journal of Economic Studies 30.6 (2003): 605-622.
Domar, Evsey D. "Capital expansion, rate of growth, and employment."
Econometrica, Journal of the Econometric Society (1946): 137-147.
78
Dunning, John H. "Explaining changing patterns of international production: in
defence of the eclectic theory." Oxford bulletin of economics and statistics 41.4 (1979):
269-295.
Egwaikhide, D. O., U Do, E., Obiora, I. K. E., and Ogunleye, E. K. "Foreign direct
investment in the West African monetary zone: An assessment of flows, volatility and
growth." West African Journal of Monetary and economic integration (2005): 5(2), 137-
150.
Eregha, Perekunah Bright. "The dynamic linkages between foreign direct
investment and domestic investment in ECOWAS countries: A panel cointegration
analysis." African Development Review 24.3 (2012): 208-220.
Feldstein, Martin S. "Aspects of Global Economic Integration: Outlook for the
Future." NBER Working Paper w7899 (2000).
Fry, Maxwell J. "Foreign direct investment in a macroeconomic framework:
finance, efficiency, incentives and distortions." Vol. 1141. World Bank Publications, 1993.
Funke, Norbert, and Saleh M. Nsouli. "The New Partnership for Africa's
Development (NEPAD): opportunities and challenges." (2003): 1-35.
Ghazalian, Pascal L., and W. Hartley Furtan. "The effects of multinational activities
on the measurement of home bias." Journal of the Japanese and International Economies
22, no. 3 (2008): 401-416.
Ghazalian, Pascal L., and W. Hartley Furtan. "CUSFTA effects: A joint
consideration of trade and multinational activities." The Journal of International Trade &
Economic Development 18, no. 4 (2009): 487-504.
Girma, Sourafel. "Absorptive capacity and productivity spillovers from FDI: A
threshold regression analysis." Oxford bulletin of Economics and Statistics 67.3 (2005):
281-306.
Globerman, Steven, and Daniel Shapiro. "Global foreign direct investment flows:
The role of governance infrastructure." World development 30.11 (2002): 1899-1919.
Hansen, Bruce E. "Inference when a nuisance parameter is not identified under the
null hypothesis." Econometrica: Journal of the econometric society (1996): 413-430.
Hansen, Bruce E. "Sample splitting and threshold estimation." Econometrica
(2000): 575-603.
Hansen, Bruce E. "Threshold effects in non-dynamic panels: Estimation, testing,
and inference." Journal of econometrics 93.2 (1999): 345-368.
Harrod, Roy F. "An essay in dynamic theory." The Economic Journal (1939): 14-
33.
79
Head, Keith, and John Ries. "Exporting and FDI as alternative strategies." Oxford
Review of Economic Policy 20, no. 3 (2004): 409-423.
Hecht, Yoel, Assaf Razin, and Nitzan Gad Shinar. "Interactions between capital
inflows and domestic investment: international panel data." Economics Department, Tel-
Aviv University (2002).
Holtz-Eakin, Douglas, Whitney Newey, and Harvey S. Rosen. "Estimating vector
autoregressions with panel data." Econometrica: Journal of the Econometric Society
(1988): 1371-1395.
Jyun-Yi, Wu, and Hsu Chih-Chiang. "Does foreign direct investment promote
economic growth? Evidence from a threshold regression analysis." Economics Bulletin
15.12 (2008): 1-10.
Kamaly, Ahmed. "Does FDI Crowd in or out Domestic Investment? New Evidence
from Emerging Economies." Modern Economy 2014 (2014).
Kolstad, Ivar, and Espen Villanger. "How does social development affect FDI and
domestic investment?" Chr. Michelsen Institute, (2004).
Lensink, Robert, and Oliver Morrissey. "Foreign direct investment: Flows,
volatility and growth in developing countries." University of Groningen, (2001).
Loungani, Prakash, and Assaf Razin. "How beneficial is foreign direct investment
for developing countries?" Finance and Development 38.2 (2001): 6-9.
Mijiyawa, Abdoul’Ganiou. "What Drives Foreign Direct Investment in Africa? An
Empirical Investigation with Panel Data." African Development Review 27.4 (2015): 392-
402.
Moosa, Imad. "Foreign Direct Investment: Theory, Evidence and Practice." (2002).
Morrissey, Oliver, and Manop Udomkerdmongkol. "Governance, private
investment and foreign direct investment in developing countries." World development
40.3 (2012): 437-445.
Moyo, Dambisa. Dead Aid: Why Aid Is Not Working And How There Is A Better
Way For Africa. Vancouver: Douglas & Mcintyre, (2009). Print.
Nair‐Reichert, Usha, and Diana Weinhold. "Causality Tests for Cross‐Country
Panels: a New Look at FDI and Economic Growth in Developing Countries." Oxford
bulletin of economics and statistics 63.2 (2001): 153-171.
Narula, Rajneesh. "Understanding absorptive capacities in an" innovation systems"
context: consequences for economic and employment growth." (2004).
Ndikumana, Leonce, and Sher Verick. "The linkages between FDI and domestic
investment: Unravelling the developmental impact of foreign investment in Sub‐Saharan
Africa." Development Policy Review 26.6 (2008): 713-726.
80
Ngare, Everlyne, Esman Morekwa Nyamongo, and Roseline N. Misati. "Stock
market development and economic growth in Africa." Journal of Economics and Business
74 (2014): 24-39.
Nickell, Stephen. "Biases in dynamic models with fixed effects." Econometrica:
Journal of the Econometric Society (1981): 1417-1426.
Noorbakhsh, Farhad, Alberto Paloni, and Ali Youssef. "Human capital and FDI
inflows to developing countries: New empirical evidence." World development 29.9
(2001): 1593-1610.
Nunnenkamp, P. "FDI as a Source of Finance for Development." CUTS, Centre for
International Trade, Economics & Environment (2003).
Ogunleye, E. R. "Exchange Rate Volatility and Foreign Direct Investment in Sub-
Saharan Africa: Evidence from Nigeria and South Africa." Applied Econometrics and
Macroeconometric Modelling in Nigeria, Ibadan University Press, Ibadan (2009).
Paolino, Michael. "The Effect of Domestic Investment, Economic Growth and
Human Development on Foreign Direct Investment into China." Bryant Economic
Research Paper 2.11 (2009).
Roodman, David. "How to do xtabond2: An introduction to difference and system
GMM in Stata." Center for Global Development working paper 103 (2006).
Smith, Keith. "Economic infrastructures and innovation systems." Systems of
innovation: Technologies, institutions and organisations (1997): 86-106.
Tanggapan, Derrick, et al. "The relationship between economic growth and foreign
direct investment in Malaysia: analysis based on location advantage theory." Management
1.2 (2011): 24-31.
Ullah, Irfan, Mahmood Shah, and Farid Ullah Khan. "Domestic Investment, Foreign
Direct Investment, and Economic Growth Nexus: A Case of Pakistan." Economics
Research International 2014 (2014).
United Nations Conference on Trade and Development (UNCTAD). (2007).
Transnational Corporations, Extractive Industries and Development. World Investment
Report 2007. Retrieved from http://unctad.org/en/docs/wir2007_en.pdf
United Nations Conference on Trade and Development (UNCTAD). (2008).
Transnational Corporations and the Infrastructure Challenge. World Investment Report
2008. Retrieved from http://unctad.org/en/Docs/wir2008_en.pdf
United Nations Conference on Trade and Development (UNCTAD). (2013). Global
Value Chains: Investment and Trade for Development. World Investment Report 2013.
Retrieved from http://unctad.org/en/PublicationsLibrary/wir2013_en.pdf
81
United Nations Conference on Trade and Development (UNCTAD). (2014). Investing
in the SDG’s: An Action Plan. World Investment Report 2014. Retrieved from
http://unctad.org/en/PublicationChapters/wir2014ch2_en.pdf
Wang, Miao. "Foreign direct investment and domestic investment in the host
country: evidence from panel study." Applied Economics 42.29 (2010): 3711-3721.
World Bank. "The East Asian miracle: Economic growth and public policy."
Oxford University Press, (1993).
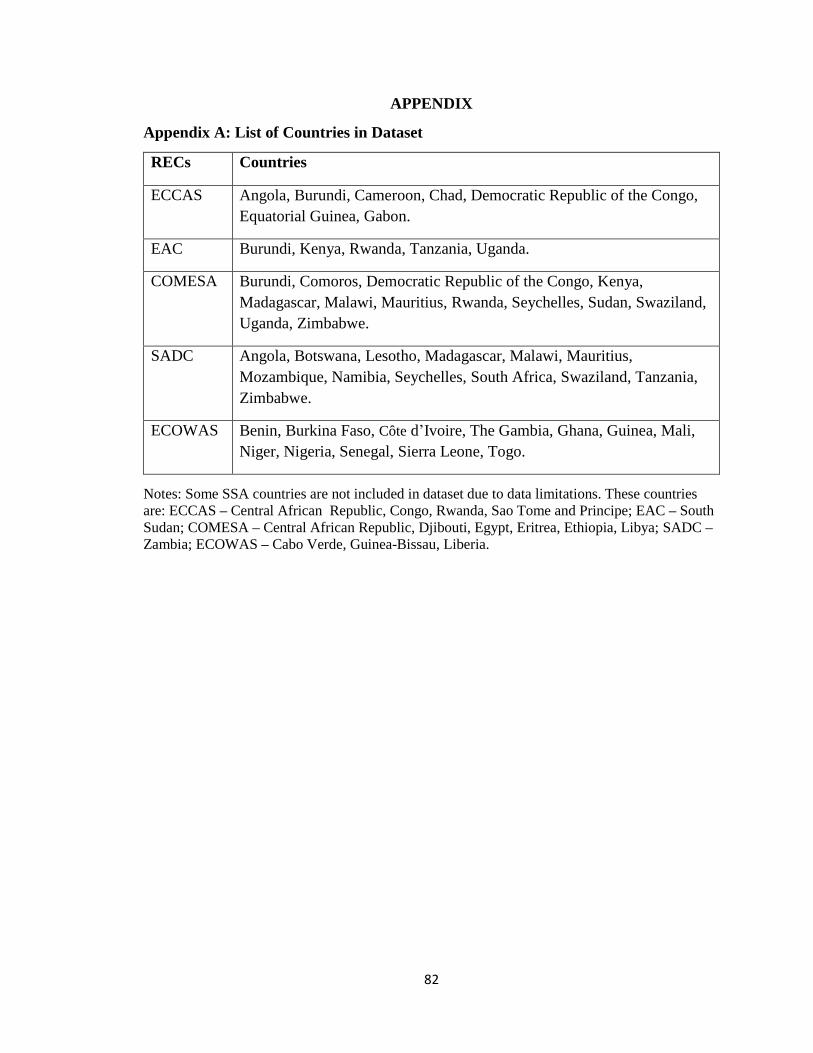
82
APPENDIX
Appendix A: List of Countries in Dataset
RECs Countries
ECCAS Angola, Burundi, Cameroon, Chad, Democratic Republic of the Congo,
Equatorial Guinea, Gabon.
EAC Burundi, Kenya, Rwanda, Tanzania, Uganda.
COMESA Burundi, Comoros, Democratic Republic of the Congo, Kenya,
Madagascar, Malawi, Mauritius, Rwanda, Seychelles, Sudan, Swaziland,
Uganda, Zimbabwe.
SADC Angola, Botswana, Lesotho, Madagascar, Malawi, Mauritius,
Mozambique, Namibia, Seychelles, South Africa, Swaziland, Tanzania,
Zimbabwe.
ECOWAS Benin, Burkina Faso, Côte d’Ivoire, The Gambia, Ghana, Guinea, Mali,
Niger, Nigeria, Senegal, Sierra Leone, Togo.
Notes: Some SSA countries are not included in dataset due to data limitations. These countries
are: ECCAS – Central African Republic, Congo, Rwanda, Sao Tome and Principe; EAC – South
Sudan; COMESA – Central African Republic, Djibouti, Egypt, Eritrea, Ethiopia, Libya; SADC –
Zambia; ECOWAS – Cabo Verde, Guinea-Bissau, Liberia.
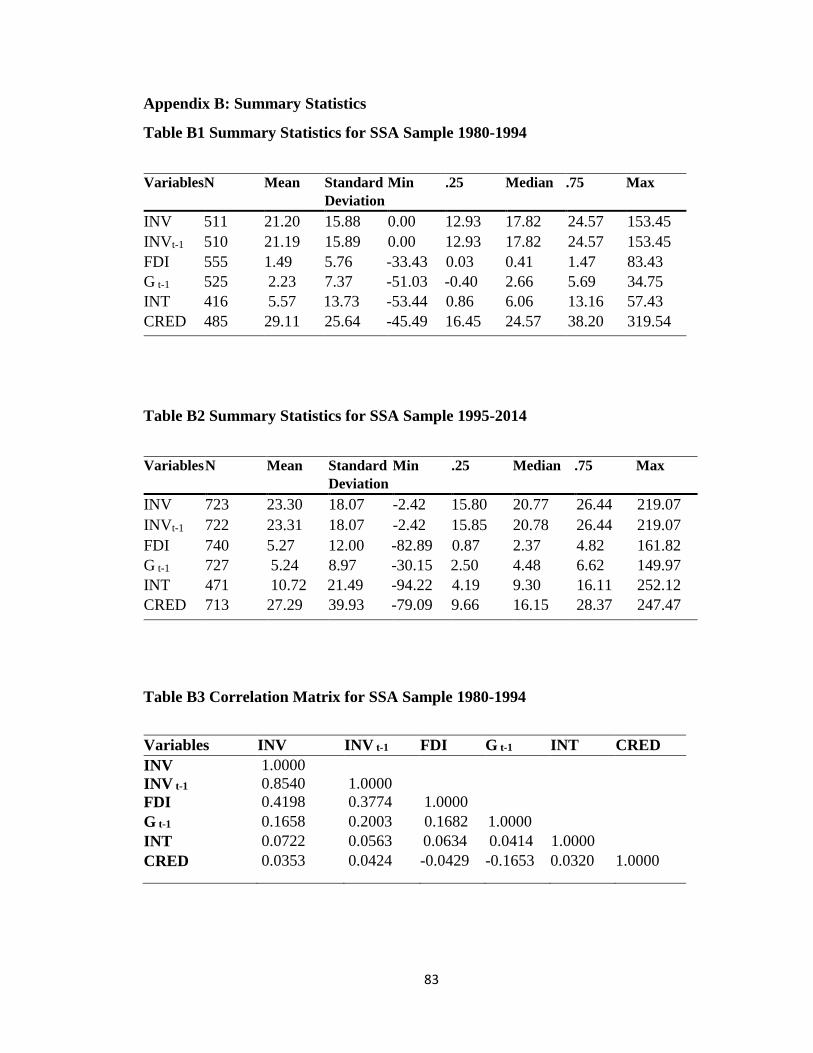
83
Appendix B: Summary Statistics
Table B1 Summary Statistics for SSA Sample 1980-1994
Variables N Mean Standard
Deviation
Min .25 Median .75 Max
INV 511 21.20 15.88 0.00 12.93 17.82 24.57 153.45
INVt-1 510 21.19 15.89 0.00 12.93 17.82 24.57 153.45
FDI 555 1.49 5.76 -33.43 0.03 0.41 1.47 83.43
G t-1 525 2.23 7.37 -51.03 -0.40 2.66 5.69 34.75
INT 416 5.57 13.73 -53.44 0.86 6.06 13.16 57.43
CRED 485 29.11 25.64 -45.49 16.45 24.57 38.20 319.54
Table B2 Summary Statistics for SSA Sample 1995-2014
Variables N Mean Standard
Deviation
Min .25 Median .75 Max
INV 723 23.30 18.07 -2.42 15.80 20.77 26.44 219.07
INVt-1 722 23.31 18.07 -2.42 15.85 20.78 26.44 219.07
FDI 740 5.27 12.00 -82.89 0.87 2.37 4.82 161.82
G t-1 727 5.24 8.97 -30.15 2.50 4.48 6.62 149.97
INT 471 10.72 21.49 -94.22 4.19 9.30 16.11 252.12
CRED 713 27.29 39.93 -79.09 9.66 16.15 28.37 247.47
Table B3 Correlation Matrix for SSA Sample 1980-1994
Variables INV INV t-1 FDI G t-1 INT CRED
INV 1.0000
INV t-1 0.8540 1.0000
FDI 0.4198 0.3774 1.0000
G t-1 0.1658 0.2003 0.1682 1.0000
INT 0.0722 0.0563 0.0634 0.0414 1.0000
CRED 0.0353 0.0424 -0.0429 -0.1653 0.0320 1.0000
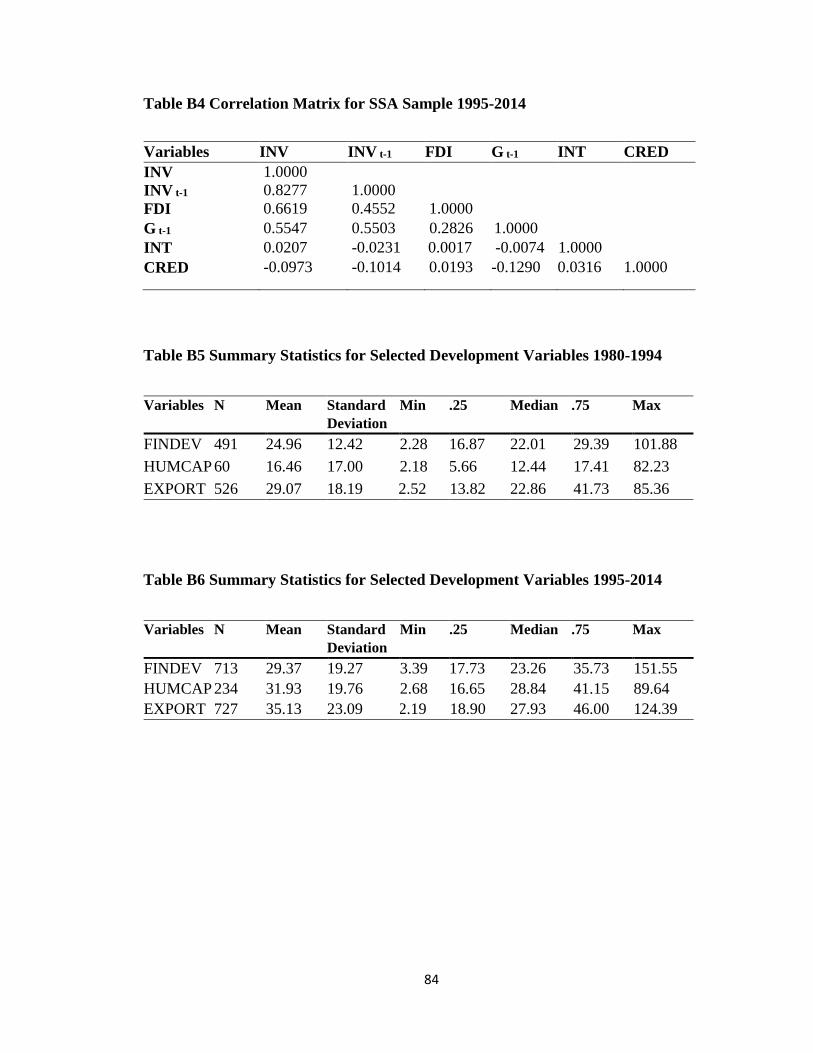
84
Table B4 Correlation Matrix for SSA Sample 1995-2014
Variables INV INV t-1 FDI G t-1 INT CRED
INV 1.0000
INV t-1 0.8277 1.0000
FDI 0.6619 0.4552 1.0000
G t-1 0.5547 0.5503 0.2826 1.0000
INT 0.0207 -0.0231 0.0017 -0.0074 1.0000
CRED -0.0973 -0.1014 0.0193 -0.1290 0.0316 1.0000
Table B5 Summary Statistics for Selected Development Variables 1980-1994
Variables N Mean Standard
Deviation
Min .25 Median .75 Max
FINDEV 491 24.96 12.42 2.28 16.87 22.01 29.39 101.88
HUMCAP 60 16.46 17.00 2.18 5.66 12.44 17.41 82.23
EXPORT 526 29.07 18.19 2.52 13.82 22.86 41.73 85.36
Table B6 Summary Statistics for Selected Development Variables 1995-2014
Variables N Mean Standard
Deviation
Min .25 Median .75 Max
FINDEV 713 29.37 19.27 3.39 17.73 23.26 35.73 151.55
HUMCAP 234 31.93 19.76 2.68 16.65 28.84 41.15 89.64
EXPORT 727 35.13 23.09 2.19 18.90 27.93 46.00 124.39
Related Documents