Indonesia Investment Coordinating Board DOMESTIC AND FOREIGN DIRECT INVESTMENT REALIZATION IN QUARTER II AND JANUARY – JUNE 2017 Jakarta, July 26 th 2017

Welcome message from author
This document is posted to help you gain knowledge. Please leave a comment to let me know what you think about it! Share it to your friends and learn new things together.
Transcript

Indonesia Investment Coordinating Board
DOMESTIC AND FOREIGN DIRECT INVESTMENT REALIZATION IN QUARTER II AND JANUARY – JUNE 2017
Jakarta, July 26th 2017
The Investment Coordinating Board of the Republic of Indonesia2
TABLE OF CONTENTS
I. QUARTER II AND JANUARY – JUNE 2017: In Comparison with 2016
II. QUARTER II 2017: Sector, Location, and Country of Origin
III. JANUARY – JUNE 2017: Sector, Location, Country of Origin, and Region
IV. INDONESIAN LABOR ABSORPTION
V. PROGRESS OF INVESTMENT REALIZATION 2012 – JUNE 2017

The Investment Coordinating Board of the Republic of Indonesia3
I. Quarter II and January - June 2017 : In Comparison with 2016

The Investment Coordinating Board of the Republic of Indonesia4
*) Revised 2017 Investment Target, BKPM’s Strategic Planning 2015 - 2019**) Achievements January - June 2017 towards 2017 target
Investment Realization in Quarter II 2017
Investment value in Quarter II 2017 is the investment realization during three consequtivemonths of reporting period (April- June 2017) based on the investment realization reportfrom DDI and FDI companies in Indonesia
Oil and Gas, Banking, Non-Bank Financial Institution, Insurance, Leasing, and HomeIndustry are excluded
The investment value is in Rp Trillion (T) and the currency rate of US$ 1 = Rp 13,300 basedon National Budget 2017 for Quarter I and Quarter II 2017.
Investment Realization in Quarter II 2017: Rp 170.9 T, increases around 3.1% from QuarterI 2017 (Rp 165.8 T) or increases around 12.7% from Quarter II 2016 (Rp 151.6 T)
Investment realization in January – June 2017: Rp 336.7 T, increases around 12.9% fromthat in January – June 2016 (Rp 298.1 T)
DDI: Domestic Direct InvestmentFDI: Foreign Direct Investment
Quarter II and January - June 2017 : In Comparison With 2016
Quarter II 2017 y-o-y q-o-q
DDI 16.9% -11.3%
FDI 10.6% 13.3%
TOTAL 12.7% 3.1%
Jan-June 2017 y-o-y
DDI 26.5%
FDI 5.8%
TOTAL 12.9%
QI2016
QII2016
Jan-June2016
QI2017
QII2017
Jan-June2017 Target 2017*) Achievements
**)TOTAL 146,5 151,6 298,1 165,8 170,9 336,7 678,8 49,6%FDI 96,1 99,4 195,5 97,0 109,9 206,9 429,0 48,2%DDI 50,4 52,2 102,6 68,8 61,0 129,8 249,8 52,0%
050
100150200250300350400450500550
Rp T
rillio
n

The Investment Coordinating Board of the Republic of Indonesia5
DDI Rp 52.2 T
(34.4%)
FDIRp 99.4 T
(65.6%)
Total : Rp 151.6 T
Investment Realization in Quarter II and January - June 2017 Compared to The Same Period in 2016 : DDI and FDI
Quarter II 2016 Quarter II 2017
Jan-June 2016 Jan-June 2017
1. Quarter II 2016 and Quarter II 2017 : DDI dan FDI
2. Jan-June 2016 and Jan-June 2017 : DDI and FDI
T= Trillion
Realization y-o-y
DDI 26.5%
FDI 5.8%
TOTAL 12.9%
Realization y-o-y
DDI 16.9%
FDI 10.5%
TOTAL 12.7%
Quarter II and January - June 2017 : In Comparison With 2016
DDIRp 61.0 T(35.7%)
FDIRp 109.9 T
(64.3%)
Total : Rp 170.9 T
DDIRp 102.6 T
(34.4%)
FDIRp 195.5 T
(65.6%)
Total : Rp 298.1 TDDI
Rp 129.8 T(38.6%)
FDIRp 206.9 T
(61.4%)
Total : Rp 336.7 T

The Investment Coordinating Board of the Republic of Indonesia6
JavaRp 82.0 T(54.1%)
Outside JavaRp 69.6 T(45.9%)
Total : Rp 151.6 T
Investment Realization in Quarter IV and January – December 2017 Compared to The Same Period in 2016: Java and Outside Java
Quarter II 2016 Quarter II 2017
Jan-June 2016 Jan-June 2017
1. Quarter II 2016 and Quarter II 2017 : Java and Outside Java
2. Jan-Jun 2016 and Jan-Jun 2017 : Java and Outside Java
T= Trillion
Realization y-o-y
Java 11.7%
Outside Java 14.4%
TOTAL 12.9%
Realization y-o-y
Java 11.2%
Outside Java 14.5%
TOTAL 12.7%
Quarter II and January - June 2017 : In Comparison With 2016
JavaRp 91.2 T(53.4%)
Outside JavaRp 79.7 T(46.6%)
Total : Rp 170.9 T
JavaRp 162.6 T
(54.5%)Outside Java
Rp 135.5 T(45.5%)
Total : Rp 298.1 TJava
Rp 181.7 T(54.0%)
Outside JavaRp 155.0 T
(46.0%)
Total : Rp 336.7 T
The Investment Coordinating Board of the Republic of Indonesia7
II. Quarter II 2017 : Sector, Location, and Country Of Origin

The Investment Coordinating Board of the Republic of Indonesia8
FDI
DDI DDI + FDI
T= TrillionB= Billion
Quarter II 2017 : Sector, Location, and Country of OriginInvestment Realization in Quarter II 2017: Based on Sector
Metal, Machinery,
and Electronic IndustryUS$ 1.1 B(13.7%)
MiningUS$ 1.0 B (12.2%)
Electricity, Gas, and Water
SupplyUS$ 1.0 B(12.0%)
Chemical and Pharmaceutica
l Industry US$ 0.8 B
(9.7%)
Food IndustryUS$ 0.7 B
(8.5%)
OthersUS$ 3.6 B (43.9%)
ConstructionRp 10.0 T(16.3%)
Food IndustryRp 9.5 T(15.6%)
MiningRp 7.4 T(12.1%)
Electricity, Gas, and Water Supply
Rp 5.8 T(9.6%)
Transportation, Warehouse, and
TelecommunicationRp 4.6 T(7.5%)
OthersRp 23.7 T(38.9%)
MiningRp 20.8 T(12.2%)
Electricity, Gas, and Water
Supply Rp 19.0 T (11.1%)
Food IndustryRp 18.9 T(11.1%)Metal,
Machinery and Electronic IndustryRp 17.5 T(10.2%)
Chemical and Pharmaceutical
Industry Rp 12.8 T
(7.5%)
OthersRp 81.9 T(47.9%)

The Investment Coordinating Board of the Republic of Indonesia9
NO SECTOR INVESTMENT(US$ Million) PROJECT
1 Metal. Machinery. and Electronic Industry
1,131.2 944
2 Mining 1,006.3 353
3 Electricity. Gas. and Water Supply 989.6 2854 Chemical and Pharmaceutical
Industry798.9 560
5 Food Industry 705.3 7876 Other Services 493.7 1,9567 Transport Equipment and Other
Transport Industry438.0 418
8 Trade and Reparation 437.1 3,3569 Food Crops and Plantation 401.9 273
10 Real Estate. Industrial Estate. and Office Building
393.7 417
11 Hotel and Restaurant 301.5 1,01912 Paper and Printing Industry 283.9 13213 Transportation. Warehouse and
Telecommunication236.4 347
14 Rubber and Plastic Industry 137.3 35015 Wood Industry 100.6 13016 Textile Industry 76.1 41117 Construction 74.9 23218 Livestock 68.4 7119 Non Metallic Mineral Industry 62.7 14320 Other Industries 54.4 28321 Leather Goods and Footwear
Industry40.5 136
22 Forestry 22.1 3623 Fishery 3.6 5824 Medical Instrument. Precision.
Optic. and Watch Industry1.7 13
TOTAL 8,259.7 12,710
FDIDDIInvestment Realization in Quarter II 2017: Based on Sector
NO SECTOR INVESTMENT(Rp Billion) PROJECT
1 Construction 9,965.7 1352 Food Industry 9,523.7 5993 Mining 7,450.8 694 Electricity. Gas. and Water Supply 5,830.1 2055 Transportation. Warehouse and
Telecommunication4,563.9 143
6 Paper and Printing Industry 3,826.1 1037 Food Crops and Plantation 3,640.6 1978 Textile Industry 3,074.5 1209 Real Estate. Industrial Estate. and
Office Building2,656.3 227
10 Metal, Machinery. and Electronic Industry
2,441.7 274
11 Chemical and Pharmaceutical Industry
2,129.9 241
12 Non Metallic Mineral Industry 1,901.0 9113 Trade and Reparation 839.7 49914 Rubber and Plastic Industry 803.3 21515 Hotel and Restaurant 617.6 18516 Transport Equipment and Other
Transport Industry513.8 53
17 Other Industries 314.4 6418 Other Services 314.3 15819 Wood Industry 292.6 8420 Livestock 188.3 5721 Leather Goods and Footwear
Industry86.4 13
22 Fishery 22.6 923 Forestry 8.0 324 Medical Instrument. Precision. Optic.
and Watch Industry0.0 3
TOTAL 61,005.4 3,747
Quarter II 2017 : Sector, Location, Country of Origin, and Region
The Investment Coordinating Board of the Republic of Indonesia10
FDI
DDI
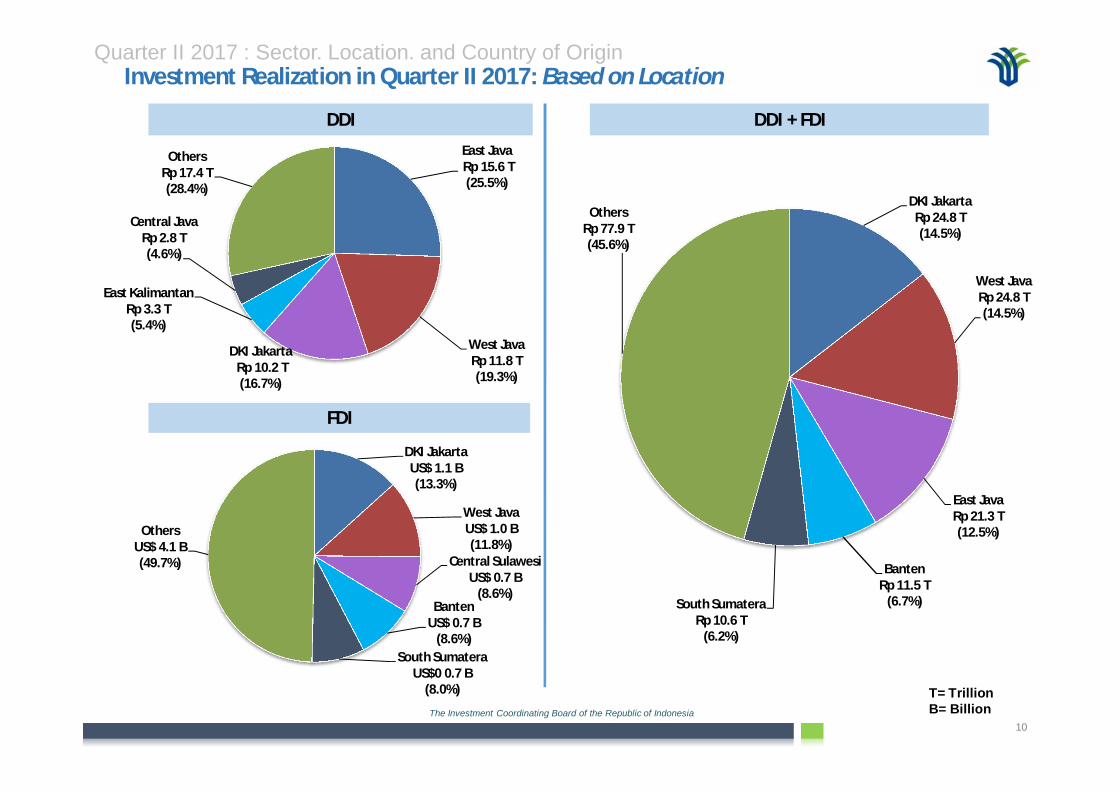
Investment Realization in Quarter II 2017: Based on LocationQuarter II 2017 : Sector. Location. and Country of Origin
DDI + FDI
T= TrillionB= Billion
DKI JakartaUS$ 1.1 B(13.3%)
West JavaUS$ 1.0 B (11.8%)
Central SulawesiUS$ 0.7 B
(8.6%)Banten
US$ 0.7 B(8.6%)
South SumateraUS$0 0.7 B
(8.0%)
OthersUS$ 4.1 B(49.7%)
East JavaRp 15.6 T(25.5%)
West JavaRp 11.8 T(19.3%)
DKI JakartaRp 10.2 T (16.7%)
East KalimantanRp 3.3 T(5.4%)
Central JavaRp 2.8 T(4.6%)
OthersRp 17.4 T (28.4%)
DKI JakartaRp 24.8 T(14.5%)
West JavaRp 24.8 T(14.5%)
East JavaRp 21.3 T(12.5%)
BantenRp 11.5 T
(6.7%)South SumateraRp 10.6 T
(6.2%)
OthersRp 77.9 T(45.6%)

The Investment Coordinating Board of the Republic of Indonesia11
FDIDDIInvestment Realization in Quarter II 2017 : Based on Location
Quarter II 2017: Sector. Location. and Country of Origin
NO LOCATION INVESTMENT(US$ Million) PROJECT
1 Special Territory of Jakarta 1,098.8 4,6442 West Java 977.2 2,2733 Central Sulawesi 709.8 894 Banten 708.8 1,1575 South Sumatera 664.2 996 Bali 467.6 6637 East Kalimantan 447.7 1708 Central Java 432.0 4999 East Java 431.7 830
10 North Sumatera 397.3 31311 South Sulawesi 289.1 10912 Papua 274.1 6513 Riau Islands 217.4 31114 Riau 192.6 17315 West Kalimantan 167.7 18516 Southeast Sulawesi 167.4 5017 Central Kalimantan 128.2 11018 North Maluku 82.8 2019 South Kalimantan 71.1 6020 Bengkulu 62.9 1521 North Kalimantan 45.5 3622 North Sulawesi 39.6 5223 East Nusa Tenggara 34.3 8224 Gorontalo 32.9 2425 Maluku 29.1 1726 West Papua 25.2 3027 West Nusa Tenggara 20.7 28928 Lampung 11.6 5129 Special Region of Yogyakarta 10.8 11330 West Sumatera 7.1 6331 Aceh 5.5 3932 Bangka Belitung Islands 5.1 3633 Jambi 3.9 3334 West Sulawesi 0 10
TOTAL 8,259.7 12,710
NO LOCATION INVESTMENT(Rp Billion) PROJECT
1 East Java 15,561.4 7302 West Java 11,797.4 4783 Special Territory of Jakarta 10,181.8 3554 East Kalimantan 3,292.8 1095 Central Java 2,816.5 5446 Banten 2,035.6 2827 Lampung 1,800.4 258 South Sumatera 1,734.7 839 Central Kalimantan 1,462.9 57
10 North Sumatera 1,440.3 14511 West Nusa Tenggara 1,244.2 2712 Riau 1,227.1 11713 West Kalimantan 1,124.2 11114 Southeast Sulawesi 1,063.1 3815 Central Sulawesi 982.5 3316 South Sulawesi 805.1 9117 Gorontalo 358.7 518 South Kalimantan 279.4 7719 West Sulawesi 270.9 520 Bangka Belitung Islands 255.3 2921 West Sumatera 237.7 10222 Jambi 226.9 2923 Riau Islands 183.2 5324 East Nusa Tenggara 168.5 1725 Special Region of Yogyakarta 131.2 4726 North Kalimantan 83.0 4527 North Sulawesi 61.5 2628 Aceh 61.1 1129 Bali 54.8 4130 Papua 31.8 1231 Bengkulu 22.7 1032 Maluku 8.6 233 North Maluku 0 234 West Papua 0 9
TOTAL 61,005.4 3,747

The Investment Coordinating Board of the Republic of Indonesia12
Investment Realization in Quarter II 2017 : Based on Country of OriginQuarter II 2017: Sector, Location, and Country of Origin
B= Billion
SingaporeUS$ 1.6 B
(19.5%)
JapanUS$ 1.4 B(17.5%)
China US$ 1.3 B
(16.4%)Hongkong, China
US$ 0.6 B(7.5%)
South KoreaUS$ 0.5 B
(5.8%)
OthersUS$ 2.8 B
(33.4%)
The Investment Coordinating Board of the Republic of Indonesia13
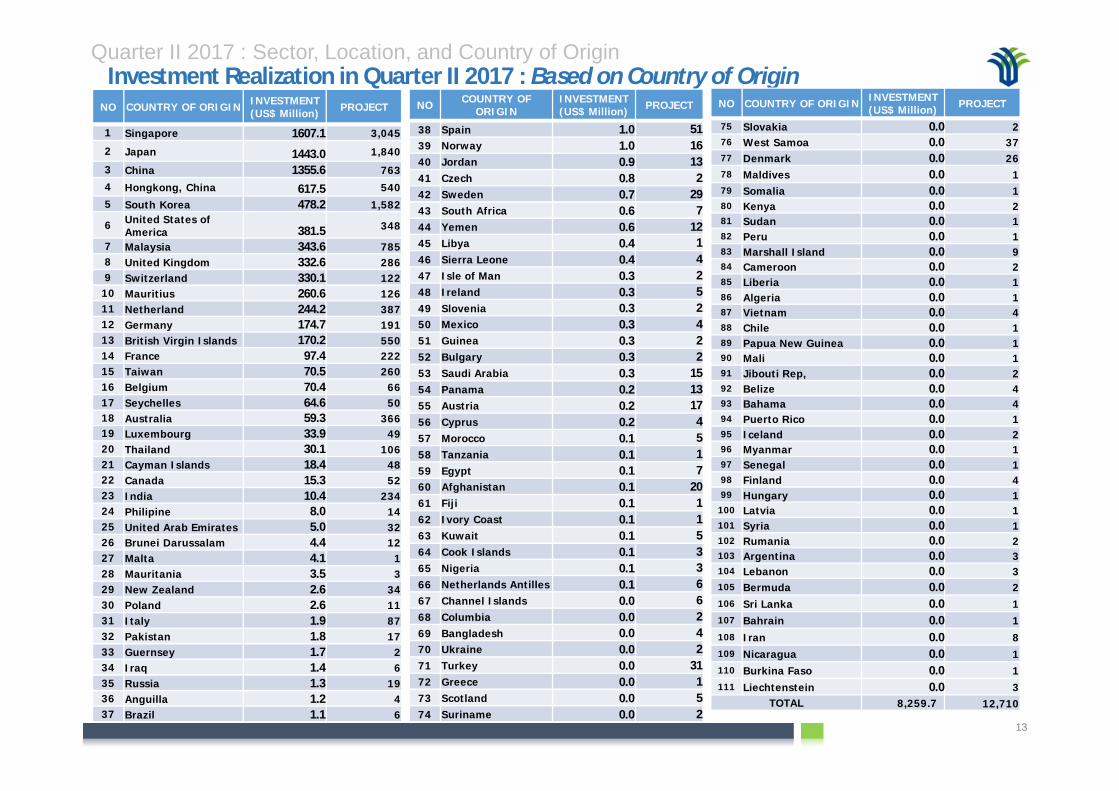
Investment Realization in Quarter II 2017 : Based on Country of OriginNO COUNTRY OF ORIGIN INVESTMENT
(US$ Million) PROJECT
1 Singapore 1607.1 3,045
2 Japan 1443.0 1,840
3 China 1355.6 7634 Hongkong, China 617.5 5405 South Korea 478.2 1,582
6 United States of America 381.5 348
7 Malaysia 343.6 7858 United Kingdom 332.6 2869 Switzerland 330.1 122
10 Mauritius 260.6 12611 Netherland 244.2 38712 Germany 174.7 19113 British Virgin Islands 170.2 55014 France 97.4 22215 Taiwan 70.5 26016 Belgium 70.4 6617 Seychelles 64.6 5018 Australia 59.3 36619 Luxembourg 33.9 4920 Thailand 30.1 10621 Cayman Islands 18.4 4822 Canada 15.3 5223 India 10.4 23424 Philipine 8.0 1425 United Arab Emirates 5.0 3226 Brunei Darussalam 4.4 1227 Malta 4.1 128 Mauritania 3.5 329 New Zealand 2.6 3430 Poland 2.6 1131 Italy 1.9 8732 Pakistan 1.8 1733 Guernsey 1.7 234 Iraq 1.4 635 Russia 1.3 1936 Anguilla 1.2 437 Brazil 1.1 6
NO COUNTRY OF ORIGIN INVESTMENT(US$ Million) PROJECT
75 Slovakia 0.0 276 West Samoa 0.0 3777 Denmark 0.0 2678 Maldives 0.0 179 Somalia 0.0 180 Kenya 0.0 281 Sudan 0.0 182 Peru 0.0 183 Marshall Island 0.0 984 Cameroon 0.0 285 Liberia 0.0 186 Algeria 0.0 187 Vietnam 0.0 488 Chile 0.0 189 Papua New Guinea 0.0 190 Mali 0.0 191 Jibouti Rep, 0.0 292 Belize 0.0 493 Bahama 0.0 494 Puerto Rico 0.0 195 Iceland 0.0 296 Myanmar 0.0 197 Senegal 0.0 198 Finland 0.0 499 Hungary 0.0 1
100 Latvia 0.0 1101 Syria 0.0 1102 Rumania 0.0 2103 Argentina 0.0 3104 Lebanon 0.0 3105 Bermuda 0.0 2106 Sri Lanka 0.0 1107 Bahrain 0.0 1108 Iran 0.0 8109 Nicaragua 0.0 1110 Burkina Faso 0.0 1111 Liechtenstein 0.0 3
TOTAL 8,259.7 12,710
Quarter II 2017 : Sector, Location, and Country of Origin
NO COUNTRY OF ORIGIN
INVESTMENT(US$ Million) PROJECT
38 Spain 1.0 5139 Norway 1.0 1640 Jordan 0.9 1341 Czech 0.8 242 Sweden 0.7 2943 South Africa 0.6 744 Yemen 0.6 1245 Libya 0.4 146 Sierra Leone 0.4 447 Isle of Man 0.3 248 Ireland 0.3 549 Slovenia 0.3 250 Mexico 0.3 451 Guinea 0.3 252 Bulgary 0.3 253 Saudi Arabia 0.3 1554 Panama 0.2 1355 Austria 0.2 1756 Cyprus 0.2 457 Morocco 0.1 558 Tanzania 0.1 159 Egypt 0.1 760 Afghanistan 0.1 2061 Fiji 0.1 162 Ivory Coast 0.1 163 Kuwait 0.1 564 Cook Islands 0.1 365 Nigeria 0.1 366 Netherlands Antilles 0.1 667 Channel Islands 0.0 668 Columbia 0.0 269 Bangladesh 0.0 470 Ukraine 0.0 271 Turkey 0.0 3172 Greece 0.0 173 Scotland 0.0 574 Suriname 0.0 2
The Investment Coordinating Board of the Republic of Indonesia14
III. January – June 2017 : Sector, Location, Country of Origin, and Region

The Investment Coordinating Board of the Republic of Indonesia15
FDI
DDI DDI + FDI
Investment Realization in January – June 2017: Based on SectorJanuary – June 2017 : Sector, Location, Country of Origin, and Region
T= TrilionB= Billion
MiningUS$ 2.2 B(14.0%) Metal,
Machinery. and Electronic Industry
US$ 2.0 B(12.7%)
Electricity, gas, and waterUS$ 1.7 B(10.9%)
Chemical and Pharmaceutical
Industry US$ 1.3 B
(8.3%)
Food IndustryUS$ 1.2 B
(7.6%)
OthersUS$ 7.3 B(46.6%)
Food IndustryRp 21.6 T(16.7%)
Transportation, warehouse and
telecomminicationRp 20.5 T(15.8%)
MiningRp 15.5 T(12.0%)
Electricity, gas and water
Rp 13.1 T(10.1%)
ConstructionRp 11.0 T
(8.5%)
OthersRp 47.9 T(36.9%)
MiningRp 44,4 T (13,2%) Food Industry
Rp 37,4 T (11,1%)
Electricity, Gas, and WaterRp 35,7 T (10,6%)Basic Chemical
Industries, Chemical Goods,
and Pharmaceuticals
Rp 32,7 T (9,7%)
Transportation, Warehouse, and Telecommunicati
onRp 26,1 T
(7,8%)
OthersRp 160,4 T
(48%)
The Investment Coordinating Board of the Republic of Indonesia16
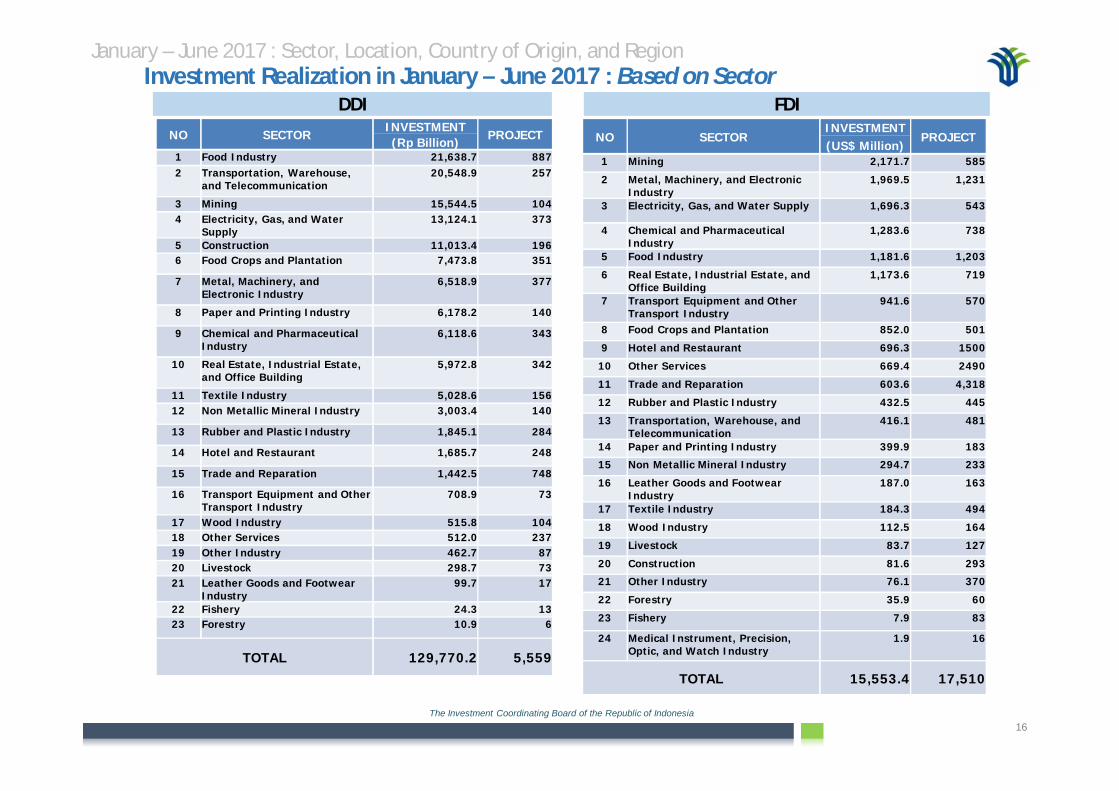
FDIDDIInvestment Realization in January – June 2017 : Based on Sector
January – June 2017 : Sector, Location, Country of Origin, and Region
NO SECTORINVESTMENT
PROJECT(US$ Million)
1 Mining 2,171.7 585
2 Metal, Machinery, and Electronic Industry
1,969.5 1,231
3 Electricity, Gas, and Water Supply 1,696.3 543
4 Chemical and Pharmaceutical Industry
1,283.6 738
5 Food Industry 1,181.6 1,203
6 Real Estate, Industrial Estate, and Office Building
1,173.6 719
7 Transport Equipment and Other Transport Industry
941.6 570
8 Food Crops and Plantation 852.0 501
9 Hotel and Restaurant 696.3 1500
10 Other Services 669.4 2490
11 Trade and Reparation 603.6 4,318
12 Rubber and Plastic Industry 432.5 445
13 Transportation, Warehouse, and Telecommunication
416.1 481
14 Paper and Printing Industry 399.9 183
15 Non Metallic Mineral Industry 294.7 233
16 Leather Goods and Footwear Industry
187.0 163
17 Textile Industry 184.3 494
18 Wood Industry 112.5 164
19 Livestock 83.7 127
20 Construction 81.6 293
21 Other Industry 76.1 370
22 Forestry 35.9 60
23 Fishery 7.9 83
24 Medical Instrument, Precision, Optic, and Watch Industry
1.9 16
TOTAL 15,553.4 17,510
NO SECTORINVESTMENT
PROJECT(Rp Billion)1 Food Industry 21,638.7 8872 Transportation, Warehouse,
and Telecommunication 20,548.9 257
3 Mining 15,544.5 1044 Electricity, Gas, and Water
Supply13,124.1 373
5 Construction 11,013.4 1966 Food Crops and Plantation 7,473.8 351
7 Metal, Machinery, and Electronic Industry
6,518.9 377
8 Paper and Printing Industry 6,178.2 140
9 Chemical and Pharmaceutical Industry
6,118.6 343
10 Real Estate, Industrial Estate, and Office Building
5,972.8 342
11 Textile Industry 5,028.6 15612 Non Metallic Mineral Industry 3,003.4 140
13 Rubber and Plastic Industry 1,845.1 284
14 Hotel and Restaurant 1,685.7 248
15 Trade and Reparation 1,442.5 748
16 Transport Equipment and Other Transport Industry
708.9 73
17 Wood Industry 515.8 10418 Other Services 512.0 23719 Other Industry 462.7 8720 Livestock 298.7 7321 Leather Goods and Footwear
Industry 99.7 17
22 Fishery 24.3 1323 Forestry 10.9 6
TOTAL 129,770.2 5,559
The Investment Coordinating Board of the Republic of Indonesia17
DDI + FDIDDI
FDI
T= TrillionB= Billion
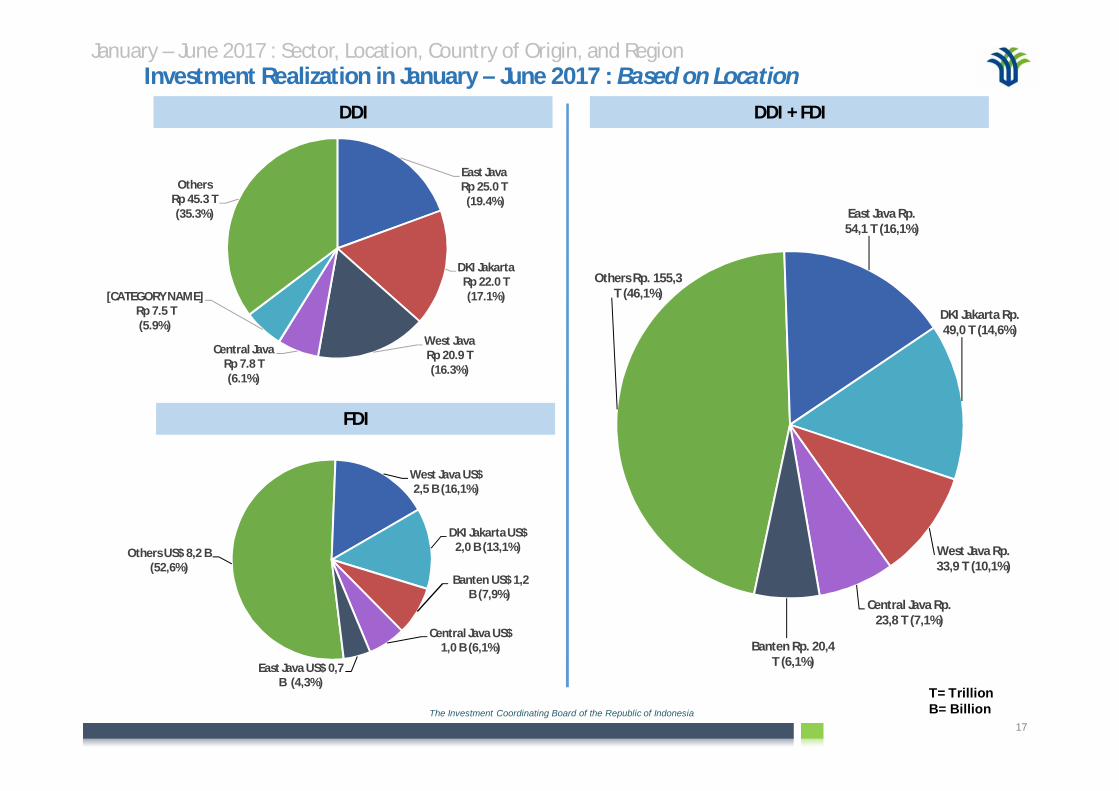
January – June 2017 : Sector, Location, Country of Origin, and RegionInvestment Realization in January – June 2017 : Based on Location
East Java Rp 25.0 T(19.4%)
DKI Jakarta Rp 22.0 T (17.1%)
West Java Rp 20.9 T (16.3%)
Central JavaRp 7.8 T (6.1%)
[CATEGORY NAME]Rp 7.5 T(5.9%)
OthersRp 45.3 T(35.3%)
Others Rp. 155,3 T (46,1%)
East Java Rp. 54,1 T (16,1%)
DKI Jakarta Rp. 49,0 T (14,6%)
West Java Rp. 33,9 T (10,1%)
Central Java Rp. 23,8 T (7,1%)
Banten Rp. 20,4T (6,1%)
Others US$ 8,2 B (52,6%)
West Java US$2,5 B (16,1%)
DKI Jakarta US$ 2,0 B (13,1%)
Banten US$ 1,2B (7,9%)
Central Java US$1,0 B (6,1%)
East Java US$ 0,7B (4,3%)

The Investment Coordinating Board of the Republic of Indonesia18
FDIDDI
January - June 2017 : Sector, Location, Country of Origin, and RegionInvestment Realization in January - June 2017 : Based on Location
NO LOCATION INVESTMENT PROJECT(Rp Billion)1 East Java 24,952.0 1,0232 Special Territory of Jakarta 21,989.3 4873 West Java 20,899.7 6584 Central Java 7,790.2 7685 Banten 7,524.1 3936 East Kalimantan 6,490.0 1627 North Sumatera 5,751.8 2098 South Sumatera 4,366.2 1589 Riau 4,228.7 191
10 West Kalimantan 3,563.5 18711 West Nusa Tenggara 3,444.2 4812 Lampung 3,390.3 3413 Southeast Sulawesi 2,469.3 6314 South Kalimantan 2,130.0 10515 Central Kalimantan 1,779.0 8316 Bangka Belitung Islands 1,514.0 4417 Central Sulawesi 1,239.7 6018 South Sulawesi 1,056.8 15119 West Sumatera 808.3 16920 Jambi 612.1 6121 Aceh 564.5 5422 East Nusa Tenggara 531.3 4123 Gorontalo 441.1 1124 Papua 384.9 2925 West Sulawesi 375.8 826 North Maluku 344.1 427 North Sulawesi 319.1 4628 Riau Islands 286.7 9829 Special Region of Yogyakarta 203.5 7130 North Kalimantan 145.0 5531 Bali 133.9 5832 Bengkulu 22.7 1633 Maluku 18.6 534 West Papua 0.0 9
TOTAL 129,770.2 5,559
NO LOCATION INVESTMENT PROJECT(US$ Million)
1 West Java 2,497.4 2,9242 Special Territory of Jakarta 2,033.6 6,0223 Banten 1,224.0 1,5254 Central Sulawesi 979.1 1465 Central Java 950.9 6676 South Sumatera 867.8 1827 Papua 863.8 1228 East Kalimantan 747.8 2759 East Java 674.1 1,128
10 Bali 602.9 96411 North Sumatera 592.6 46512 Riau Islands 493.1 47013 South Sulawesi 490.9 17714 Southeast Sulawesi 439.6 8815 West Kalimantan 358.3 33216 Central Kalimantan 337.1 19717 Riau 306.7 24418 North Sulawesi 191.1 10619 South Kalimantan 146.5 8420 Maluku 121.0 2721 North Maluku 115.0 3522 Bengkulu 76.6 3023 North Kalimantan 69.9 6324 East Nusa Tenggara 63.2 13625 Bangka Belitung Islands 53.4 6526 West Nusa Tenggara 51.2 48627 West Papua 49.7 5528 Lampung 46.6 8529 Gorontalo 35.0 3830 Jambi 31.8 5431 Special Region of Yogyakarta 14.6 13932 West Sumatera 12.7 9833 West Sulawesi 8.8 1934 Aceh 6.5 62
TOTAL 15,553.4 17,510
The Investment Coordinating Board of the Republic of Indonesia19
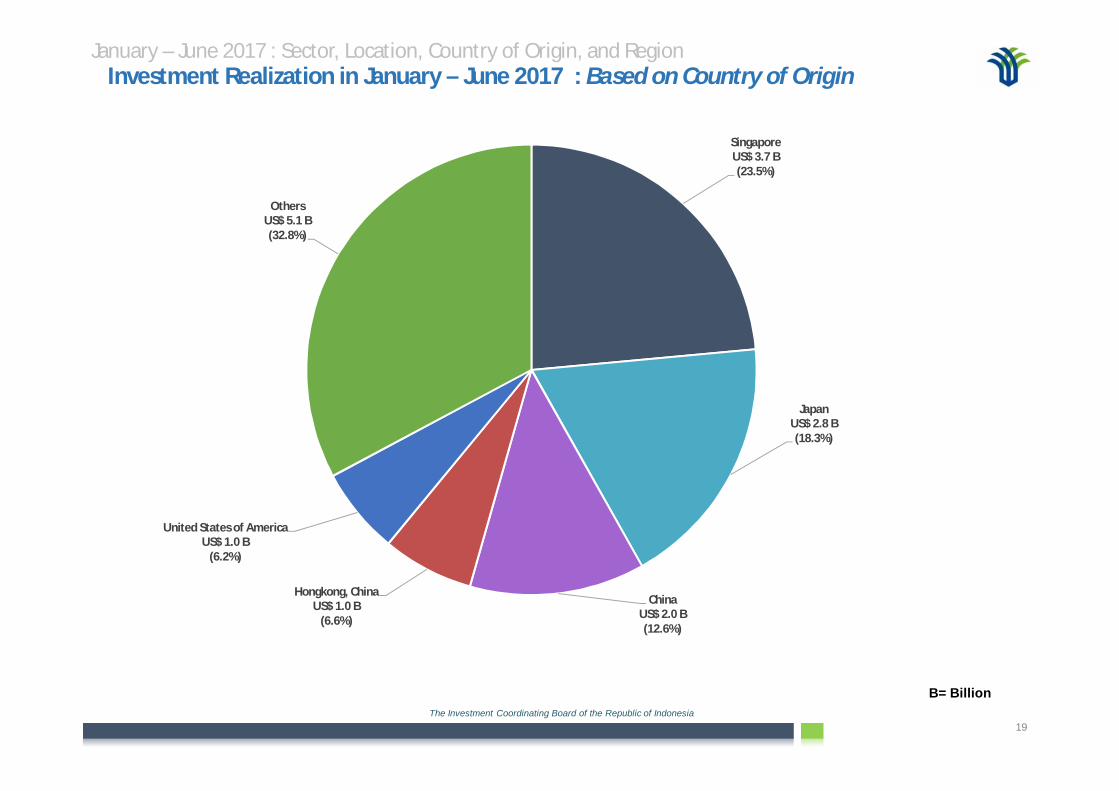
January – June 2017 : Sector, Location, Country of Origin, and RegionInvestment Realization in January – June 2017 : Based on Country of Origin
B= Billion
Singapore US$ 3.7 B(23.5%)
Japan US$ 2.8 B(18.3%)
ChinaUS$ 2.0 B(12.6%)
Hongkong, ChinaUS$ 1.0 B
(6.6%)
United States of AmericaUS$ 1.0 B
(6.2%)
Others US$ 5.1 B(32.8%)

The Investment Coordinating Board of the Republic of Indonesia20
January – June 2017 : Sector, Location, Country of Origin, and RegionInvestment Realization in January – June 2017 : Based on Country of Origin
NO COUNTRY OF ORIGIN
INVESTMENTPROJECT
(US$ Million)1 Singapura 3,661.4 4,3592 Japan 2,845.6 2,2543 China 1,955.1 1,2434 Hongkong, China 1,019.5 8125 United States of
America968.8 442
6 South Korea 901.3 19847 Malaysia 559.0 1,1178 Mauritius 516.9 1759 Netherland 490.2 527
10 United Kingdom 448.8 40511 Switzerland 375.9 14712 British Virgin
Islands362.5 740
13 Taiwan 294.8 33014 Australia 206.0 52415 Germany 182.3 23416 France 131.8 31917 Seychelles 122.7 8618 Belgium 105.8 9019 Thailand 70.7 16920 Luxembourg 59.8 6921 Cayman Islands 55.3 6822 Canada 30.5 8223 Philipine 22.0 2624 India 19.2 32425 Channel Islands 14.8 726 Brazil 14.3 1327 Italy 13.2 14528 Iran 11.3 1729 Sweden 9.4 4030 Unied Arab Emirate 8.1 4331 Pakistan 7.1 2432 New Zealand 6.8 4433 Malta 5.0 234 Russia 4.8 2935 Brunei Darussalam 4.5 18
36 Anguilla 4.3 537 Guernsey 4.0 438 Panama 3.9 1439 Spain 3.8 7040 Mauritania 3.5 3
NO COUNTRY OF ORIGIN
INVESTMENTPROJECT
(US$ Million)41 Sri Lanka 3.4 442 Poland 3.3 1543 South Afrika 1.7 10
44 Ireland 1.6 945 Guinea 1.5 5
46 Iraq 1.5 747 Yordan 1.5 1948 Yemen 1.4 2249 Czech 1.3 350 Marshall Island 1.1 1351 Norway 1.1 2352 West Samoa 0.8 50
53 Austria 0.7 2254 Saudi Arabia 0.7 2455 Bahrain 0.6 356 Myanmar 0.5 257 Libya 0.4 1
58 Bulgaria 0.4 659 Macao 0.4 160 Siera Leone 0.4 461 Isle of Man 0.3 2
62 Lithuania 0.3 163 Meksiko 0.3 764 Slovenia 0.3 565 Senegal 0.3 2
66 Egypt 0.2 1067 Kuwait 0.2 668 Syria 0.2 469 Cyprus 0.2 570 Cook Islands 0.2 571 Afghanistan 0.2 2272 Morocco 0.1 573 Tanzania 0.1 174 Ukraine 0.1 375 Turkey 0.1 4076 Colombia 0.1 477 Netherlands
Antilles0.1 8
78 Fiji 0.1 179 Ivory Coast 0.1 180 Cameroon 0.1 10
NO COUNTRY OF ORIGININVESTMENT
PROJECT(US$ Million)
81 Nigeria 0.1 782 Lebanon 0.1 483 Latvia 0.1 3
84 Hungary 0.1 3
85 Vietnam 0.0 5
86 Bangladesh 0.0 6
87 Denmark 0.0 3088 Burkina Faso 0.0 289 Argentina 0.0 590 Greece 0.0 191 Venezuela 0.0 292 Scotland 0.0 693 Slovakia 0.0 394 Suriname 0.0 295 Maldives 0.0 1
96 Somalia 0.0 197 Kenya 0.0 3
98 Sudan 0.0 199 Peru 0.0 1
100 Liberia 0.0 1
101 Algeria 0.0 2
102 Chile 0.0 2103 Papua New Guinea 0.0 1104 Mali 0.0 2105 Jibouti Rep. 0.0 2
106 Belize 0.0 7107 Bahamas 0.0 4108 Puerto Rico 0.0 1109 Iceland 0.0 2110 Finland 0.0 4
111 Romania 0.0 3112 Niger 0.0 1
113 Bermuda 0.0 3114 Nicaragua 0.0 1115 Maldives 0.0 1116 Liechtenstein 0.0 3
TOTAL 15,553.4 17,510

The Investment Coordinating Board of the Republic of Indonesia21
DDI
DDI and FDI
Investment Realization in January – June 2017 : Based on Region
T= Trillion
January – June 2017 : Sector, Location, Country of Origin, and Region
Realization based on region in January – June 2017period, the highest realization of DDI and FDI is located inJava island. The further ranks of realization of the DDI is inSumatera, Kalimantan, Sulawesi, Bali and Nusa Tenggara,and also Maluku and Papua regions. The further ranks ofrealization of the FDI is in Sumatera, Sulawesi, Kalimantan,Maluku and Papua as well as Bali and Nusa Tenggararegions.
JavaRp.181.7 T
(54.0%)
SumateraRp 54.6 T(16.2%)
KalimantanRp 36.2 T(10.7%)
SulawesiRp 34.4 T(10.2%)
Maluku and Papua
Rp 16.0 T(4.8%)
Bali and Nusa Tenggara Rp 13.7 T
(4.1%)
FDI
83,358.8
21,545.214,107.5
5,901.7 4,109.3 747.60
10.00020.000
30.00040.000
50.00060.000
70.00080.000
90.000
Java Sumatera Kalimantan Sulawesi Bali andNusa
Tenggara
Maluku andPapua
RpBi
llion
7.394,6
2.487,82.144,5
1.659,61.149,5
717,3
0
1.000
2.000
3.000
4.000
5.000
6.000
7.000
8.000
Java Sumatera Sulawesi Kalimantan Maluku andPapua
Bali andNusa
Tenggara
US$
.Mill
ion

The Investment Coordinating Board of the Republic of Indonesia22
IV. Indonesian Labor Absorption

The Investment Coordinating Board of the Republic of Indonesia23
Indonesian Labor Absorption Progress 2012 – June 2017 : Per QuarterIndonesian Labor Absorption : 2012 – June 2017
Person
Q I Q II Q III Q IV Q I Q II Q III Q IV Q I Q II Q III Q IV Q I Q II Q III Q IV Q I Q II Q III Q IV Q I Q II
2012 2013 2014 2015 2016 2017
DDI 107.674 141.625 144.784 149.617 148.521 239.810 150.016 159.315 67.697 82.250 84.550 180.626 113.342 147.868 132.595 111.006 136.560 87.039 92.017 124.843 67.807 104.255
FDI 250.711 209.888 126.864 158.343 213.403 386.566 261.527 270.792 192.459 268.553 264.827 289.884 201.887 223.077 240.965 264.976 190.610 267.700 184.006 309.623 126.327 241.068
Total 358.385 351.513 271.648 307.960 361.924 626.376 411.543 430.107 260.156 350.803 349.377 470.510 315.229 370.945 373.560 375.982 327.170 354.739 276.023 434.466 194.134 345.323
0
100.000
200.000
300.000
400.000
500.000
600.000
700.000
Note:Since Quarter II Year 2016 Indonesian Labor Data is an additional labor absorption data.

The Investment Coordinating Board of the Republic of Indonesia24
V. Progress of Investment Realization 2012 – June 2017
The Investment Coordinating Board of the Republic of Indonesia25
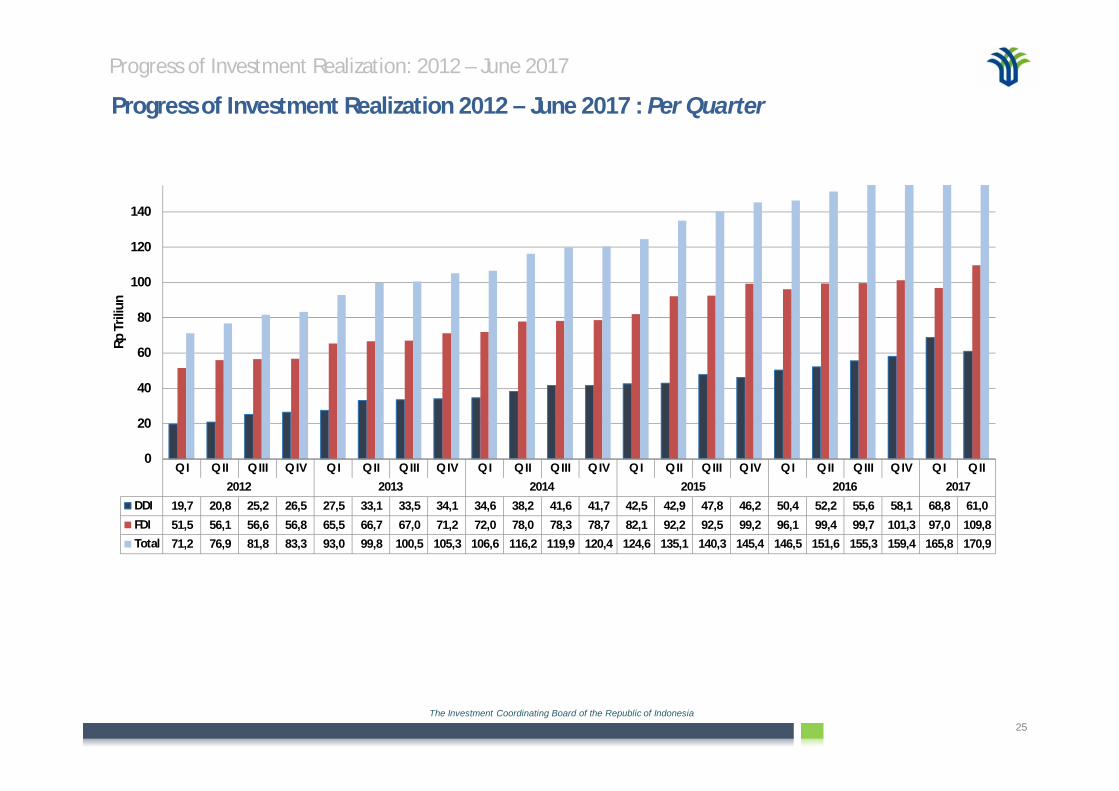
Progress of Investment Realization 2012 – June 2017 : Per Quarter
Progress of Investment Realization: 2012 – June 2017
Q I Q II Q III Q IV Q I Q II Q III Q IV Q I Q II Q III Q IV Q I Q II Q III Q IV Q I Q II Q III Q IV Q I Q II2012 2013 2014 2015 2016 2017
DDI 19,7 20,8 25,2 26,5 27,5 33,1 33,5 34,1 34,6 38,2 41,6 41,7 42,5 42,9 47,8 46,2 50,4 52,2 55,6 58,1 68,8 61,0FDI 51,5 56,1 56,6 56,8 65,5 66,7 67,0 71,2 72,0 78,0 78,3 78,7 82,1 92,2 92,5 99,2 96,1 99,4 99,7 101,3 97,0 109,8Total 71,2 76,9 81,8 83,3 93,0 99,8 100,5 105,3 106,6 116,2 119,9 120,4 124,6 135,1 140,3 145,4 146,5 151,6 155,3 159,4 165,8 170,9
0
20
40
60
80
100
120
140
Rp T
riliu
n

The Investment Coordinating Board of the Republic of Indonesia26
Progress of Investment Realization of FDI 2012 – June 2017 in US Dollar: Per Quarter
Notes:- 2010, 2011 and 2012, exchange rate US$ 1 = Rp 9,000- 2013 (Q I and Q II), exchange rate US$ 1 = Rp 9,300 (based on State Budget 2013)- 2013 (Q III and Q IV), exchange rate US$ 1 = Rp 9,600 (based on Revised State Budget 2013)- 2014 (Q I, Q II and Q III) exchange rate US$ 1 = Rp 10,500 (based on State Budget 2014)- 2014 (Q IV) exchange rate s US$ 1 = Rp 11,600 (based on Revised State Budget 2014)- 2015 (Q I, Q II, Q III and Q IV) exchange rate US$ 1 = Rp 12,500 (based on Revised State Budget 2015)- 2016 (Q I and Q II) exchange rate US$ 1 = Rp 13,900 (based on State Budget 2016)- 2016 (Q III and Q IV) exchange rate US$ 1 = Rp 13,500 (based on Revised State Budget 2016)- 2017 (Q I and Q II), exchange rate US$ = Rp 13,300 (based on State Budget 2017)
Progress of Investment Realization 2012 - June 2017
Q 1 Q 2 Q 3 Q 4 Q 1 Q 2 Q 3 Q 4 Q 1 Q 2 Q 3 Q 4 Q 1 Q 2 Q 3 Q 4 Q 1 Q 2 Q 3 Q 4 Q 1 Q 22012 2013 2014 2015 2016 2017
FDI 5,7 6,2 6,3 6,3 7,0 7,2 7,0 7,4 6,9 7,4 7,4 6,8 6,6 7,4 7,4 7,9 6,9 7,1 7,4 7,5 7,3 8,2
0,0
1,0
2,0
3,0
4,0
5,0
6,0
7,0
8,0
9,0U
S$ B
illio
nFDI
The Investment Coordinating Board of the Republic of Indonesia27
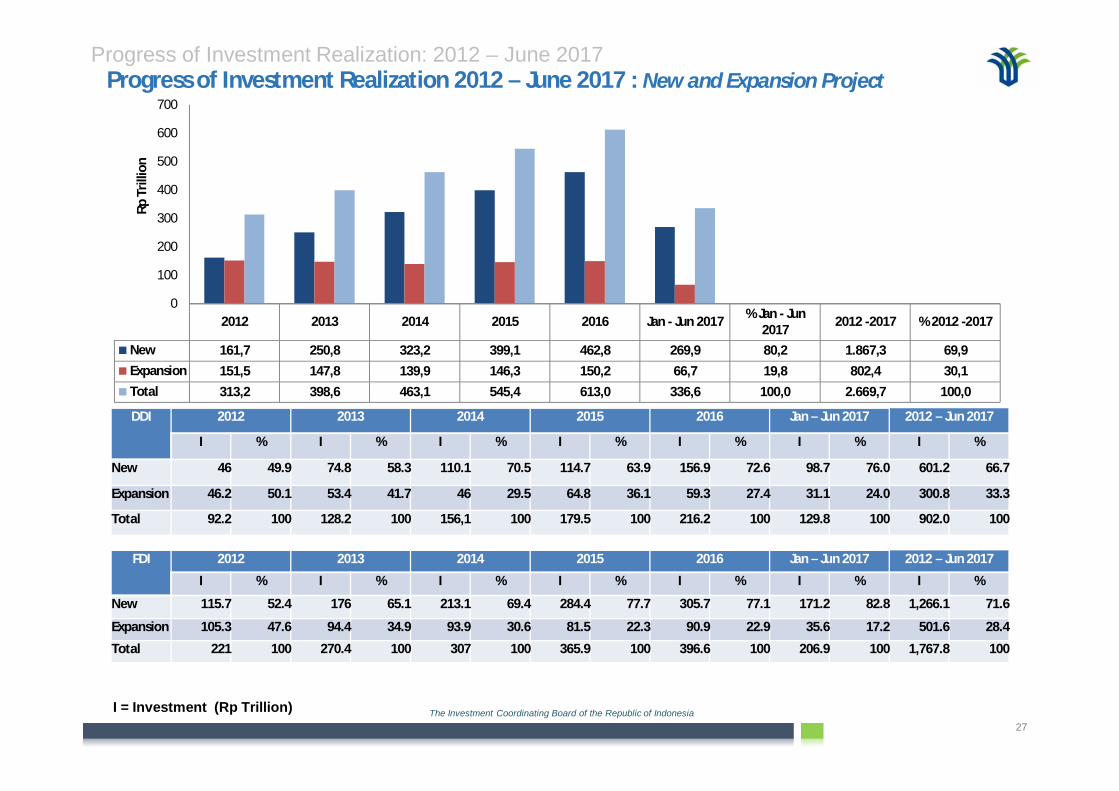
I = Investment (Rp Trillion)
Progress of Investment Realization 2012 – June 2017 : New and Expansion ProjectProgress of Investment Realization: 2012 – June 2017
2012 2013 2014 2015 2016 Jan - Jun 2017 % Jan - Jun2017 2012 -2017 % 2012 -2017
New 161,7 250,8 323,2 399,1 462,8 269,9 80,2 1.867,3 69,9Expansion 151,5 147,8 139,9 146,3 150,2 66,7 19,8 802,4 30,1Total 313,2 398,6 463,1 545,4 613,0 336,6 100,0 2.669,7 100,0
0
100
200
300
400
500
600
700
Rp T
rillio
n
DDI 2012 2013 2014 2015 2016 Jan – Jun 2017 2012 – Jun 2017
I % I % I % I % I % I % I %
New 46 49.9 74.8 58.3 110.1 70.5 114.7 63.9 156.9 72.6 98.7 76.0 601.2 66.7
Expansion 46.2 50.1 53.4 41.7 46 29.5 64.8 36.1 59.3 27.4 31.1 24.0 300.8 33.3
Total 92.2 100 128.2 100 156,1 100 179.5 100 216.2 100 129.8 100 902.0 100
FDI 2012 2013 2014 2015 2016 Jan – Jun 2017 2012 – Jun 2017
I % I % I % I % I % I % I %
New 115.7 52.4 176 65.1 213.1 69.4 284.4 77.7 305.7 77.1 171.2 82.8 1,266.1 71.6
Expansion 105.3 47.6 94.4 34.9 93.9 30.6 81.5 22.3 90.9 22.9 35.6 17.2 501.6 28.4
Total 221 100 270.4 100 307 100 365.9 100 396.6 100 206.9 100 1,767.8 100
The Investment Coordinating Board of the Republic of Indonesia28
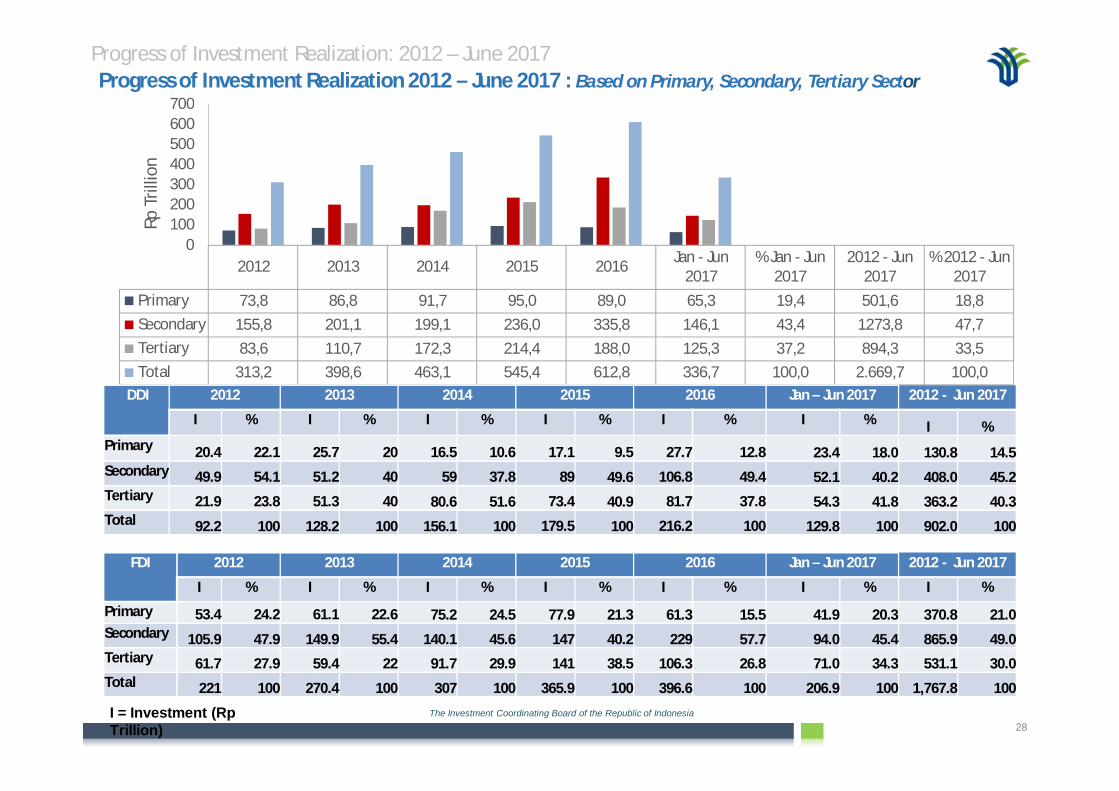
I = Investment (Rp Trillion)
Progress of Investment Realization 2012 – June 2017 : Based on Primary, Secondary, Tertiary SectorProgress of Investment Realization: 2012 – June 2017
2012 2013 2014 2015 2016 Jan - Jun2017
% Jan - Jun2017
2012 - Jun2017
% 2012 - Jun2017
Primary 73,8 86,8 91,7 95,0 89,0 65,3 19,4 501,6 18,8Secondary 155,8 201,1 199,1 236,0 335,8 146,1 43,4 1273,8 47,7Tertiary 83,6 110,7 172,3 214,4 188,0 125,3 37,2 894,3 33,5Total 313,2 398,6 463,1 545,4 612,8 336,7 100,0 2.669,7 100,0
0100200300400500600700
Rp T
rillio
n
DDI 2012 2013 2014 2015 2016 Jan – Jun 2017 2012 - Jun 2017
I % I % I % I % I % I % I % Primary 20.4 22.1 25.7 20 16.5 10.6 17.1 9.5 27.7 12.8 23.4 18.0 130.8 14.5Secondary 49.9 54.1 51.2 40 59 37.8 89 49.6 106.8 49.4 52.1 40.2 408.0 45.2Tertiary 21.9 23.8 51.3 40 80.6 51.6 73.4 40.9 81.7 37.8 54.3 41.8 363.2 40.3Total 92.2 100 128.2 100 156.1 100 179.5 100 216.2 100 129.8 100 902.0 100
FDI 2012 2013 2014 2015 2016 Jan – Jun 2017 2012 - Jun 2017
I % I % I % I % I % I % I %
Primary 53.4 24.2 61.1 22.6 75.2 24.5 77.9 21.3 61.3 15.5 41.9 20.3 370.8 21.0Secondary 105.9 47.9 149.9 55.4 140.1 45.6 147 40.2 229 57.7 94.0 45.4 865.9 49.0Tertiary 61.7 27.9 59.4 22 91.7 29.9 141 38.5 106.3 26.8 71.0 34.3 531.1 30.0Total 221 100 270.4 100 307 100 365.9 100 396.6 100 206.9 100 1,767.8 100

The Investment Coordinating Board of the Republic of Indonesia29
ManufacturingRp 89.0 T(49.6%)
ServicesRp 73.4 T(40.9%)
Food Crops and PlantationsRp 12.0 T
(6.7%)
MiningRp 4.0 T(2.2%)
LivestockRp 0.3 T(0.2%) Fishery
Rp 0.3 T(0.1%)
ForestryRp 0.5 T(0.3%)
2015
ServicesRp 80.6 T(51.6%)
ManufacturingRp 59.0 T(37.8%)
Food Crops and PlantationsRp 12.7 T
(8.1%)
MiningRp 3.1 T(2.0%)
LivestockRp 0.7 T(0.4%)
FisheryRp 0.02 T
(0.0%)
ForestryRp 0.0003 T
(0.0%)
2014
ManufacturingRp 49.9 T(54.1%)
ServicesRp 21.9 T(23.8%)
MiningRp 10.5 T(11.4%)
Food Crops and Plantations
Rp 9.6 T(10.4%)
ForestryRp 0.1 T(0.2%)
LivestockRp 0.1 T(0.1%)
FisheryRp 0.01 T
(0.0%)
2012
ServicesRp 51.3 T(40.0%)
ManufacturingRp 51.2 T(40.0%)
MiningRp 18.8 T(14.6%)
Food Crops and Plantations
Rp 6.6 T(5.1%)
LivestockRp 0.3 T (0.3%)
2013
DDI Trends Sector: 2012 – June 2017
T = Trillion
Progress of Investment Realization: 2012 – June 2017
ServicesRp 54.3 T(41.9%)
ManufacturingRp 52.1 T(40.2%)
MiningRp 15.5 T(11.9%)
Food Crops and Plantations
Rp 7.5 T(5.8%)
LivestockRp 0.3 T(0.2%)
FisheryRp 0.02 T
(0.0%) ForestryRp0.01T(0.0%)
Jan-June 2017
ManufacturingRp 335.8 T
(54.8%)
ServicesRp [VALUE].0 T
(30.7%)
MIningRp 43.6 T
(7.0%)
Food Crops and Plantations
Rp 42.8 T(7.0%)
ForestryRp 1.3 T(0.2%)
LivestockRp 1.1 T(0.2%)
FisheryRp 0.6 T(0.1%)
2016

The Investment Coordinating Board of the Republic of Indonesia30
FDI Trends Sector: 2012 – June 2017
B = Billion
ManufacturingUS$ 11.8 B
(47.9%)Services
US$ 6.9 B(28.0%)
MiningUS$ 4.2 B(17.3%)
Food Crops and PlantationUS$ 1.6 B
(6.5%) FisheryUS$ 0.03 B
(0.1%)
ForestryUS$ 0.03 B
(0.1%)
LivestockUS$ 0.02 B
(0.1%)
2012
ManufacturingUS$ 15.8 B
(55.4%)
ServicesUS$ 6.3 B(22.0%)
MiningUS$ 4.8 B
(16.8%)
Food Crops and
PlantationsUS$ 1.6 B
(5.6%)
ForestryUS$ 0.03 B
(0.1%)
LivestockUS$ 0.01 B
(0.1%)Fishery
US$ 0.01 B(0.0%)
2013
ManufacturingUS$ 11.8 B
(40.2%)
ServicesUS$ 11.3 B
(38.5%)
MiningUS$ 4.0 B
(13.7%)
Food Crops and PlantationUS$ 2.0 B
(7.0%)
LivestockUS$ 0.1 B
(0.3%)
FIsheryUS$ 0.0 B
(0.2%)
ForestryUS$ 0.0 B
(0.1%)
2015
ManufacturingUS$ 13.0 B
(45.6%)Services
US$ 8.5 B(29.9%)
MiningUS$ 4.7 B
(16.4%)
Food Crops and PlantationUS$ 2.2 B
(7.7%)
ForestryUS$ 0.05 B
(0.2%)Fishery
US$ 0.04 B(0.1%) Livestock
US$ 0.03 B(0.1%)
2014
Progress of Investment Realization: 2012 – June 2017
Manufacturing US$ 16.7 B
(57.6%)
ServicesUS$ 7.8 B(26.8%)
Food Crops and PlantationUS$ 1.6 B
(5.5%)
LivestockUS$ 0.05 B
(0.2%)
ForestryUS$ 0.08 B
(0.3%)Fishery
US$ 0.04 B(0.1%) Mining
US$ 2.7 B(9.5%)
2016
Manufacturing US$ 7,1 B(45.4%)
ServicesUS$ 5.3 B(34.3%)
MiningUS$ 2.2 B(14.0%)
PlantationsUS$ 0.9 B
(5.5%)
LivestockUS$ 0.1 B
(0.5%)
ForestryUS$ 0.04 B
(0.2%)Fishery
US$ 0.08 B(0.1%)
Jan-June 2017

The Investment Coordinating Board of the Republic of Indonesia31
T = Trillion
ManufacturingRp 155.8 T
(49.7%)
ServicesRp 83.6 T (26.7%)
MiningRp 48.8 T (15.6%)
Food Crops and
PlantationsRp 24.0 T
(7.7%)
ForestryRp 0.4 T (0.1%)
LivestockRp 0.3 T (0.1%)
FisheryRp 0.2 T(0.1%)
2012
ManufacturingRp 201.1 T
(50.5%)
ServicesRp 110.7 T
(27.7%)
MiningRp 64.3 T(16.1%)
Food Cropsand Plantations
Rp 21.8 T(5.5%)
LivestockRp 0.6 T(0.2%)
FisheryRp 0.1 T(0.0%)
ForestryRp 0.1 T(0.0%)
2013
DDI and FDI Trends Sector : 2012 – June 2017
Manufacturing
Rp 199.1 T(43.0%)
ServicesRp 172.3 T
(37.2%)
MiningRp 53.3 T(11.5%)
Food Crops and
PlantationsRp 36.4 T
(7.9%)
LivestockRp 1.0 T(0.2%)
ForestryRp 0.6 T(0.1%)
FisheryRp 0.4 T(0.1%)
2014
ManufacturingRp 236.0 T
(43.3%)
ServicesRp 214.4 T
(39.3%)
MiningRp 54.2 T
(9.9%)
Food Cropsand
PlantationsRp 37.9 T
(7.0%)
LivestockRp 1.3 T(0.2%)
ForestryRp 0.9 T(0.2%)
FisheryRp 0.7 T(0.1%)
2015
Progress of Investment Realization: 2012 – June 2017
Manufacturing Rp 335.8 T
(54.8%)
ServicesRp 188.0 T
(30.7%)
Food Cropsand Plantations
Rp 42.8 T(7.0%)
ForestryRp 1.3 T(0.2%)
Fishery Rp 0.6 T(0.1%)
LivestockRp 1.1 T(0.2%)
Mining Rp 43.6 T
(7.0%)
2016
Manufacturing Rp 146.1 T
(43.4%)
ServicesRp 125.3 T
(37.2%)
MiningRp 44.4 T(13.2%)
Food Crops and PlantationsRp 18.8 T
(5.6%)
Forestry Rp 0.5 T(0.1%)
LivestockRp 1.4 T(0.4%)
FisheryRp 0.1 T(0.0%)
Jan-June 2017

The Investment Coordinating Board of the Republic of Indonesia32
East JavaRp 34.8 T(27.1%)
East KalimantanRp 15.8 T(12.3%)
Central Java
Rp 12.6 T(9.8%)
West JavaRp 9.0 T(7.0%)
South Kalimantan
Rp 8.3 T(6.5%)
OthersRp 47.7 T(37.1%)
2013
Trend of DDI Location: 2012 – June 2017
T= Trillion
East JavaRp 21.5 T(23.3%)
West JavaRp 11.4 T(12.3%)
Special Territory of
JakartaRp 8.5 T(9.3%)East
KalimantanRp 5.9 T(6.4%)
Central Java
Rp 5.8 T(6.3%)
OthersRp 39.1 T(42.4%)
2012East JavaRp 38.1 T(24.4%)
West JavaRp 18.7 T(12.0%)
Special Territory of
JakartaRp 17.8 T(11.4%)
Central Java
Rp 13.6 T(8.7%)
East KalimantanRp 12.9 T
(8.2%)
OthersRp 55.0 T(35.3%)
2014
East JavaRp 35.5 T (19.8%)
West Java Rp 26.3 T (14.6%)
Special Territory of JakartaRp 15.5 T
(8.6%)Central Java
Rp 15.4 T (8.6%)
South Sumatera Rp 10.9 T
(6.1%)
OthersRp 75.9 T (42.3%)
2015
Progress of Investment Realization: 2012 – June 2017
East JavaRp 46.3 T(21.4%)
West JavaRp 30.4 T(14.0%)
Central JavaRp 24.1 T(11.1%)
BantenRp 12.4 T
(5.7%)
Special Territory of
JakartaRp 12.2 T
(5.6%)
Others Rp 90.8 T(42.0%)
2016East JavaRp 24.9 T (19.2%)
Special Territory of JakartaRp 21.9 T (16.9%)
West JavaRp 20.9 T (16.1%)Central
JavaRp 7.8 T (6.0%)
BantenRp 7.5 T (5.8%)
OthersRp 46.6 T (36.0%)
Jan-June 2017

The Investment Coordinating Board of the Republic of Indonesia33
Trend of FDI Location : 2012 – June 2017
B = Billion
West JavaUS$ 4.2 B(17.1%)
Special Territory of
JakartaUS$ 4.1 B(16.7%)
BantenUS$ 2.7 B(11.1%)East Java
US$ 2.3 B(9.4%)
East Kalimantan US$ 2.0 B
(8.2%)
OthersUS$ 9.2 B(37.5%)
2012
West Java US$ 7.1 B(24.9%)
BantenUS$ 3.7 B(13.0%)East Java
US$ 3.4 B(11.9%)
Special Territory of
JakartaUS$ 2.6 B
(9.1%)
PapuaUS$ 2.4 B
(8.2%)
OthersUS$ 9.4 B(32.9%)
2013West JavaUS$ 6.6 B(23.0%)
Special Territory of
JakartaUS$ 4.5 B(15.8%)
East KalimantanUS$ 2.1 B
(7.5%)
BantenUS$ 2.0 B
(7.1%)
East JavaUS$ 1.8 B
(6.3%)
OthersUS$ 11.5 B
(40.3%)
2014
West JavaUS$ 5.7 B (19.6%)
Special Territory of JakartaUS$ 3.6 B (12.4%)
East JavaUS$ 2.6 B
(8.9%)BantenUS$ 2.5 B
(8.7%)
East Kalimanta
nUS$ 2.4 B
(8.1%)
OthersUS$ 12.4 B
(42.3%)
2015
Progress of Investment Realization: 2012 – June 2017
West JavaUS$ 5.5 B
(18.9%)
Special Territory of
JakartaUS$ 3.4 B
(11.7%)
BantenUS$ 2.9 B
(10.1%)South SumateraUS$ 2.8 B
(9.6%)
East JavaUS$ 1.9 B
(6.7%)
Others US$ 12.4 B
(43.0%)
2016
Lainnya7,9
50,6%
West Java2,5
16,1%Special Territory
of Jakarta2,0
13,1%
Banten1,2
7,9%
Central Sulawesi1,0
6,3%
Central Java1,0
6,1%
Jan - June 2017

The Investment Coordinating Board of the Republic of Indonesia34
DDI and FDI Trends by Location : 2012 – June 2017
West JavaRp 76.5 T(19.2%)
East JavaRp 67.0 T(16.8%)
BantenRp 39.0 T
(9.8%)Special
Territory of Jakarta
Rp 30.2 T(7.6%)
East Kalimantan
Rp 28.3 T(7.1%)
OthersRp 157.5 T
(39.5%)
2013
T = Trillion
West JavaRp 49.3 T(15.7%)
Special Territoryof JakartaRp 45.5 T(14.5%)
East JavaRp 42.2 T(13.5%)
BantenRp 29.6 T
(9.4%)
East Kalimantan Rp 23.1 T
(7.4%)
OthersRp 123.6 T
(39.5%)
2012
West JavaRp 89.3 T(19.3%)
Special Territory of
JakartaRp 66.3 T(14.3%)
East JavaRp 57.5 T(12.4%)East
KalimantanRp 36.0 T
(7.8%)
BantenRp 30.0 T
(6.5%)
OthersRp 184.0 T
(39.7%)
2014
West JavaRp 98.0 T (18.0%)
East JavaRp 67.9 T (12.5%)
Special Territory of
JakartaRp 60.7 T (11.1%)
BantenRp 42.5 T
(7.8%)
East Kalimantan Rp 39.4 T
(7.2%)
OthersRp 236.9 T
(43.4%)
2015
Progress of Investment Realization: 2012 – June 2017
2016 Jan-Jun 2017
West Java Rp 54.1 T (16.1%)
Special Territory of
Jakarta Rp 49.0 T (14,6%)
East Java Rp33.9 T (10.1%)
Banten Rp 23.8 T
(7.1%)
Central Java Rp 20.4 T
(6.1%)
OthersRp 155.3 T
(46.1%)
West JavaRp 105.3 T
(17.2%)
East JavaRp 72.9 T (11.9%)
Special Territory of JakartaRp 58.8 T
(9.6%)Banten
Rp 52.3 T (8.5%)
South SumateraRp 46.8 T
(7.6%)
OthersRp 276.8 T
(45.2%)

The Investment Coordinating Board of the Republic of Indonesia35
FDI Trends by Top 5 : 2012 - June 2017
B = Billion
SingaporeUS$4.9 B(19.8%)
JapanUS$ 2.5 B(10.0%)
South KoreaUS$ 1.9 B
(7.9%)United States of
AmericaUS$ 1.2 B
(5.1%)
MauritiusUS$ 1.1 B
(4.3%)
OthersUS$ 13.0 B
(52.9%)
2012Japan
US$ 4.7 B(16.5%)
SingaporeUS$ 4.7 B(16.3%)
United States of AmericaUS$ 2.4 B
(8.5%)South Korea
US$ 2.2 B(7.7%)
UK US$ 1.1 B
(3.8%)
OthersUS$ 13.5 B
(47.2%)
2013SingaporeUS$ 5.8 B(20.4%)
JapanUS$ 2.7 B
(9.5%)
MalaysiaUS$ 1.8 B
(6.2%)
Netherlands
US$ 1.7 B(6.1%)UK
US$ 1.6 B(5.6%)
OthersUS$ 14.9 B
(52.2%)
2014
Progress of Investment Realization: 2012 – June 2016
2016SingaporeUS$ 9.2 B(31.7%)
JapanUS$ 5.4 B (18.6%)
China US$ 2.7 B
(9.2%)
Hongkong,ChinaUS$ 2.2 B
(7.8%)
NetherlandsUS$ 1.5 B
(5.1%)
OthersUS$ 8.0 B (27.6%)
SingaporeUS$ 5.9 B (20.2%)
MalaysiaUS$ 3.0 B(10.5%)
JapanUS$ 2.9 B
(9.8%)
NetherlandsUS$ 1.3 B
(4.5%)South Korea
US$ 1.2 B(4.1%)
OthersUS$ 14.9 B
(50.9%)
2015SingaporeUS$ 3.7 B(23.5%)
JapanUS$ 2.8 B (18.3%)
China US$ 2.0 B(12.6%)
Hongkong, China
US$ 1.0 B (6.6%)
United States of AmericaUS$ 1.0 B
(6.2%)
OthersUS$ 5.1 B(32.8%)
Jan - June 2017

Thank you
Badan Koordinasi Penanaman Modal (BKPM)Indonesia Investment Coordinating BoardJln. Jend. Gatot Subroto No. 44Jakarta 12190 - Indonesiat .+62 21 5292 1334f .+62 21 5264 211e [email protected]
www.bkpm.go.id Thank you
Related Documents