IMPACT OF EFFLUENT FROM FERTILIZER FACTORIES ON THE LAKHYARIVER WATER QUALITY Submitted by Mohammad Hafizul Islam In partial fulfillment of the requirement for the degree of Master of Science in Civil Engineering (Environmental) 1111111111111111111111111111111111 #10~9~5# Department of Civil Engineering Bangladesh University ofEngineering and Technology Dhaka, Bangladesh August, 2008

Welcome message from author
This document is posted to help you gain knowledge. Please leave a comment to let me know what you think about it! Share it to your friends and learn new things together.
Transcript

IMPACT OF EFFLUENT FROM FERTILIZER FACTORIESON THE LAKHYARIVER WATER QUALITY
Submitted by
Mohammad Hafizul Islam
In partial fulfillment of the requirement for the degree ofMaster of Science in Civil Engineering (Environmental)
1111111111111111111111111111111111#10~9~5#
Department of Civil EngineeringBangladesh University of Engineering and Technology
Dhaka, Bangladesh
August, 2008

Certificate of Research
This is to certify that this thesis work has been done by me and neither this thesis nor any partthereof has been s~bmitted elsewhere for the award of any degree or diploma.
August, 2008 Mohammad Hafizul Islam

The thesis titled "IMPACT OF EFFLUENT FROM FERTILIZER FACTORIES ONTHE LAKHY A RIVER WATER QUALITY" submitted by MOHAMMAD HAFIZULISLAM, Roll No 0404045l9F, Session: April 2004 has been accepted as satisfactory inpartial fulfillment of the requirement for the degree of Master of Science in Civil Engineering
(Environmental) on 1alit August, 2008
BOARD OF EXAMINERS
Dr. Md. Mafizur RahmanProfessorDepartment of Civil EngineeringBUET, Dhaka-l 000, Bangladesh
,Dr. Muhammad ZakariaProfessor and HeadDepartment of Civil EngineeringBUET, Dhaka-l 000, Bangladesh
Dr. M. Habibur RahmanProfessorDepartment of Civil EngineeringBUET, Dhaka-l 000, Bangladesh
Dr. Md. Jahir Bin AlamAssociate Professor and HeadDepartment of Civil and Environmental EngineeringShahjalal University of Science and TechnologySylher-3ll4, Bangladesh
Chairman(Supervisor)
Member(Ex-officio)
Member
Member(External)

DEDICATEDTo
:My 6efoved parents, :MusFifik,

ACKNOWLEDGEMENT
The author wishes to express his deepest gratitude and indebtedness to his supervisor Dr. Md.Mafizur Rahman, Professor, Department of Civil Engineering, BUET for his persistentguidance and encouragement in all stages of this research work .The author consider it a greatopportunity to have a share of his knowledge and expertise in the field of industrial effluentand water quality.
The author is greatful to Dr.Muhammad Zakaria, Professor and Head, Department of CivilEngineering, BUET, Dr. M. Habibur Rahman, Professor, Department of Civil Engineering,BUET, and Dr. Md. Jahir Bin Alam, Associate Professor and Head, Department of Civil andEnvironmental Engineering, Shahjalal University of Science and Technology, Sylhet for theirvaluable suggestions for the improvement of the organization and contents of this thesis.
The author is indebted to Institute of Water Modelling (IWM), which organization incrediblyhelped providing Lakhya River flow data, library facilities and computer facilities to carryout the research work. Sincerest gratitude is expressed to Mr. Abu Saleh Khan, ExecutiveEngineer, BWDB. and Head, Flood Management Division, Institute of Water Modelling; Mr.Tarun Kanti Magumdar, Associate Specialist, Institute of Water Modelling. They have giventheir valuable suggestions to the author frequently to accomplish the research.
The author profoundly acknowledges the continuous support of his family, especiallyYaameem, Protik, Juthi and Tithi during the course of study. Very special thanks to Essa-Ruhullah and Shamima easmin for their cordial assistance, understanding and loving concernat every stage ofthe thesis.
Finally, the author greatly acknowledges the continuous inspiration, constructive criticismand kind co-operation of his friend, Engineer Wasiqur Rahman, at every stages of the study.Without his cordial assistance, it would not be possible to complete this study in time.
Above all, the author prays to Almighty Allah for being in good health and condition, and forthe successfully completion of the study.
Mohanunad Hafizul IslamAugust, 2008

ABSTRACT
Industrialization has become essential for economic growth and employment generation inBangladesh. But the speeding up of the process of industrialization without adequate wastemanagement facilities has become the cause of degradation of environment and quality oflife. Indiscriminate disposal of polluting wastes beyond assimilation capacity of the waterbodies has become the cause of deterioration of water quality and aquatic ecosystem. TheBuriganga, the Dhaleswari, the Lakhya, and the Baht rivers have become highlycontaminated around the industrial clusters. For instance, The Urea Fertilizer Factories(Polash and Ghorasal) produce around 1,400 tons urea per day. The industry has an effluenttreatment plant with inadequate capacity. Most of the untreated effluent is being dischargedinto the Lakhya River through pump. A study was carried out in Polash and Ghorasal UreaFertilizer Factories to assess the impact of effluent on the Lakhya River water quality.Comprehensive waste water sampling by grab sampling method and flow measurement by
float velocity method were carried out for five weeks (one sample per week) at five samplingstations at Polash and Ghorasal Urea Fertilizer Factories during June-July, 2007. Waterquality samplings by grab sampling method were also carried out for five weeks (one sampleper week) at four stations in the Lakhya River system at the same time and Riverflows on theperiod of October-06 to September-07 were collected from Institute of Water Modelling.Effluents at both the places and the water sample from selected points in the river wereanalysed for pH, Temperature, DO, BOD5, COD, NHrN, NHrN. TS, TSS, and TDS duringJune-July, 2007 at the Environmental Engineering workshop of Bangladesh University ofEngineering and Technology, Bangladesh. The results showed that the effluents were alkalinewhile the level of DO, BOD5, COD, NHrN. NHrN. TS, TSS, and TDS relatively high. Theupstream water was near to neutral pH (average pH, 7.66:tO.102) with high dissolved oxygenbut low in the levels of the other parameters. The river water after the effluent dischargepoints was alkaline (average pH, 8.16:tO.08) and the levels of other parameters were highdue to heavy pollution load especially Ammonia discharged from fertilizer factories. Theresults suggested that the water in the river was polluted and not good for humanconsumption. It is therefore recommended that the disposal of improperly treated oruntreated wastes should be stopped to save the river water from further deterioration.Although the values of some water quality parameters in some cases were lower than theallowable limits, the continued discharge of the effluents in the river may result in severeaccumulation of the contaminants and unless the authorities implement the laws governingthe disposal of wastes this may affect the lives of the people.
II

TABLE OF CONTENTS
ACKNOWLEDGEMENT
ABSTRACT
LIST OF FIGURES
LIST OF SCHEMATIC DIAGRAMS
LIST OF TABLES
LIST OF PHOTOGRAPHS
LIST OF ABBREVIATIONS
PageI
II
VIII
XII
XIII
XIV
XV
CHAPTER 1 INTRODUCTION 1
1.1 Background 11.2 Importance ofthe Study 21.3 Objectives of the Study 21.4 Organization of the Study 3
CHAPTER 2 LITERATURE RIVIEW 4
2.1 Introduction 42.1.1 Definition of water pollution 52.1.2 Types of water pollution 52.1.1.2 Surface water pollution 62.1.3 Causes of water pollution 62.1.4 Effluent 72.1.4.1 Industrial Effluent 7
2.2 Fertilizer factories in Bangladesh 82.2.1 Manufacturing process involved in Polash and 10
Ghorasal urea fertilizer factories2.2.2 Principle on urea production using carbamate 10
solution total recycle process2.2.3 Pollutants from Polash and Ghorasal urea fertilizer 11
factories
III
2.3 Why does pollution matter 122.3.1 How do we know when water is polluted 12
2.4 Physical and Chemical properties 122.4.1 pH 132.4.2 Temperature 142.4.3 Dissolved Oxygen (DO) 152.4.4 Bio-Chemical Oxygen Demand (BOD) 162.4.5 Chemical Oxygen Demand (COD) 182.4.6 Total Solids 182.4.7 Total Suspended Solids (TSS) 182.4.8 Total Dissolved Solids (TDS) 192.4.9 Ammonia 20
2.5 Biological parameters 212.5.1 Total coliform and fecal coliform 212.5.2 Algae 23
2.6 Environmental Quality Standards 232.7 Summary of previous works 28
CHAPTER 3 SAMPLING AND ANALYSIS 31
3.1 Introduction 313.2 Ghorasal and Polash urea fertilizer factories 313.3 Sample and Sampling 32
3.3.1 Field trip preparations 323.3.2 Selection of sampling site 323.3.3 Water and waste water sampling 393.3.4 Discharge measurements 39
3.4 Analysis of samples 393.5 Pollution load calculation 403.6 Standard Deviation calculation 40
CHAPTER 4
4.14.2
4.2.14.2.24.2.34.2.4
CHARACTERIZATION OF EFFLUENT
IntroductionWastewater quality analysisBio-chemical Oxygen Demand (BOD)Chemical Oxygen Demand (COD)Dissolved Oxygen (DO)pH
IV
41
414242434445
4.2.54.2.64.2.74.2.84.2.94.2.104.2.11
TemperatureTotal AmmoniaAmmonia as Nitrogen (NH3-N)Ammonium as Nitrogen (NH4-N)Total Solids (TS)Total Suspended Solids (TSS)Total Dissolved Solids (TDS)
45464748495050
CHAPTER 5 ESTIMATION OF WATER POLLUTION 52LOAD
5.1 Introduction 525.2 Estimation of effluent flow rate discharged from 52
fertilizer factories5.3 Estimation of water pollution load discharged from 53
different sampling points of fertilizer factories5.3.1 Sampling point-4 535.3.2 Sampling point-5 555.3.3 Sampling point-7 56
5.4 Estimation of total water pollution load discharged 57from fertilizer factories
CHAPTER 6 IMPACT OF EFFLUENT ON THE LAKHYA 59RIVER WATER QUALITY
6.1 Introduction 596.2 Analysis of flow rate in the different points along 59
the Lakhya River6.2.1 Sampling point-l 596.2.2 Sampling point-6 606.2.3 Sampling point-8 606.2.4 Sampling point-9 60
6.3 Analysis of water quality along Lakhya River to 61assess impact of fertilizer factories effluent
6.3.1 Bio-chemical Oxygen Demand (BOD) 616.3.2 Chemical Oxygen Demand (COD) 62
6.3.3 Dissolved Oxygen (DO) 62
6.3.4 pH 636.3.5 Temperature 64
6.3.6 Total Ammonia 64
v

6.4
6.3.76.3.86.3.96.3.106.3.11
6.4.16.4.26.4.36.4.46.4.56.4.66.4.76.4.8
Ammonia as Nitrogen (NH3-N)Ammonium as Nitrogen (NH4-N)Total Solids (TS)Total Suspended Solids (TSS)Total Dissolved Solids (TDS)Analysis of pollution load along Lakhya River toassess impact of fertilizer factories effluentBio-chemical Oxygen Demand (BOD)Chemical Oxygen Demand (COD)Total AmmoniaAmmonia as Nitrogen (NH3-N)Ammonium as Nitrogen (NH4-N)Total Solids (TS)Total Suspended Solids (TSS)Total Dissolved Solids (TDS)
65666768
6869
6970707172
737475
CHAPTER 7 SURFACE WATER QUALITY MODELLING 79
7.1 Surface water quality modelling for Lakhya River 797.2 Effects on river water quality 80
7.2.1 Bio-chemical Oxygen Demand (BOD) 807.2.2 Chemical Oxygen Demand (COD) 807.2.3 Total Ammonia 81
7.3 Relationship between River flow and concentration 82of Total Ammonia
7.4 Relationship between River flow and concentration 83of Ammonia
7.5 Relationship between River flow and concentration 84of Ammonium
7.6 Relationship between River flow and concentration 85of Biochemical Oxygen Demand (BODs)
7.7 Relationship between River flow and concentration 86of Chemical Oxygen Demand (COD)
7.8 Relationship between River flow and concentration 87of Total Solids (TS)
7.9 Relationship between River flow and concentration 88of Total Dissolved Solids (TDS)
7.10 Comparision of correlation co-efficient of different 89water quality parameters
7.11 Comparision between up stream and down stream 89water quality parameters
7.11.1 Total Ammonia 89
VI

7.11.2 Ammonia as Nitrogen (NH3-N) 907.11.3 Ammonium as Nitrogen (NH4-N) 917.11.4 Bio-chemical Oxygen Demand (BOD) 927.11.5 Chemical Oxygen Demand (COD) 937.11.6 Total Solids (TS) 947.11.7 Total Dissolved Solids (TDS) 95
7.12 Relationship between Temperature and Dissolved 96Oxygen along the Lakhya River
7.13 Percent saturation Dissolved Oxygen along the 97Lakhya River
7.14 Development of industrial policy from impact of 98effluent
7.14.1 Ammonia 987.14.2 Ammonium 987.14.3 Bio-chemical Oxygen Demand (BOD) 997.14.4 Chemical Oxygen Demand (COD) 1007.14.5 Total Solids (TS) 1007.14.6 Total Dissolved Solids (TDS) 101
CHAPTER 8
8.18.2
8.2.18.2.28.2.38.2.4
CONCLUSION AND RECOMMENDATIONS
ConclusionRecommendationsIntroductionRecommending Intervensions to minimize impactLimitations of the studyRecommendations for further study
102
102108108108110111
REFERENCES
APPENDIX
VII
112
A-I

Figure 3.1Figure 4.1
Figure 4.2
Figure 4.3
Figure 4.4Figure 4.5
Figure 4.6
Figure 4.7
Figure 4.8
Figure 4.9
Figure 4.10Figure 4.11Figure 5.1
Figure 5.2
Figure 5.3
Figure 5.4
Figure 5.5
Figure 5.6
Figure 5.7
Figure 5.8
Figure 5.9
Figure 5.10
LIST OF FIGURES
Sampling point locationsVariation of BOD5 in mg/l at different sampling points of fertilizerfactoriesVariation of COD in mg/l at different sampling points of fertilizerfactoriesVariation of DO in mg/l at different sampling points of fertilizerfactoriesVariation of pH at different sampling points of fertilizer factoriesVariation of Temperature in oC at different sampling points offertilizer factoriesVariation of Total Ammonia at different sampling points of fertilizerfactoriesVariation of NH3-N at different sampling points of fertilizerfactoriesVariation of NH4-N at different sampling points of fertilizerfactoriesVariation of Total Solids at different sampling points of fertilizerfactoriesVariation ofTSS at different sampling points offertilizer factoriesVariation ofTS at different sampling points offertilizer factoriesVariation of effluent flow rate at different sampling point of fertilizerfactoriesVariation of BOD5 and COD in kg/day discharged load of fromsampling point-4 into the Lakhya RiverVariation of Total Ammonia, Ammonia and Ammonium in kg/daydischarged from sampling point-4 into the Lakhya RiverVariation of total solids, total suspended solids and total dissolvedsolids in kg/day discharged from sampling point-4 into the LakhyaRiverVariation of BOD, COD, Total Ammonia, TS, TSS, and TDS inkg/day discharged from residential area of fertilizer factories into thesampling point-4Variation of BOD5 and COD in kg/day discharged load of fromsampling point-5 into the Lakhya RiverVariation of Total Ammonia, Ammonia and Ammonium in kg/daydischarged from sampling point-5 into the Lakhya RiverVariation of total solids, total suspended solids and total dissolvedsolids in kg/day discharged from sampling point-5 into the LakhyaRiverVariation of BOD5 and COD in kg/day discharged load of fromsampling point-5 into the Lakhya RiverVariation of Total Ammonia, Ammonia and Ammonium in kg/daydischarged from sampling point-5 into the Lakhya River
VIII
Page3543
44
44
4546
47
48
49
49
505152
53
54
54
54
55
55
56
56
57

Figure 5.11
Figure 5.12
Figure 5.13
Figure 5.14
Figure 6.1Figure 6.2
Figure 6.3
Figure 6.4
Figure 6.5Figure 6.6Figure 6.7Figure 6.8Figure 6.9Figure 6.10Figure 6.11Figure 6.12Figure 6.13Figure 6.14Figure 6.15Figure 6.16Figure 6.17Figure 6.18Figure 6.19
Figure 6.20
Figure 6.21Figure 6.22
Figure 6.23
Figure 7.1Figure 7.2Figure 7.3
Variation of total solids, total suspended solids and total dissolvedsolids in kg/day discharged from sampling point-5 into the LakhyaRiverVariation of BOD5 and COD in kg/day discharged from samplingpoint-5 into the Lakhya RiverVariation of Total Ammonia, Ammonia and Ammonium in kg/daydischarged from sampling point-5 into the Lakhya RiverVariation of total solids, total suspended solids and total dissolvedsolids in kg/day discharged from sampling point-5 into the LakhyaRiverVariation of flow rate at sampling point-l along the Lakhya RiverVariation of flow rate at the sampling point-6 along the LakhyaRiverVariation of flow rate at the sampling point-8 along the LakhyaRiverVariation of flow rate at the sampling point-9 along the LakhyaRiverVariation ofBOD5 in mg/l along the Lakhya RiverVariation of COD in mg/l along the Lakhya RiverVariation of DO in mg/l along the Lakhya RiverVariation of pH along the Lakhya RiverVariation of Temperature along the Lakhya RiverVariation of Ammonia in mg/l along the Lakhya RiverVariation ofNH3-N in mg/l along the Lakhya RiverVariation ofNH4-N in mg/l along the Lakhya RiverVariations of Total Solids in mg/l along the Lakhya RiverVariations of Total Suspended Solids in mg/l along the Lakhya RiverVariation of Total Dissolved Solids in mg/l along the Lakhya RiverVariation ofBOD5 in kg/day along the Lakhya RiverVariation of COD in kg/day along the Lakhya RiverVariation of Total Ammonia in kg/day along the Lakhya RiverVariation of Ammonia as Nitrogen (NH3-N) in kg/day along theLakhya RiverVariation of Ammonium as Nitrogen (NH4-N) in kg/day along theLakhya RiverVariation of Total Solids in kg/day along the Lakhya RiverVariation of Total Suspended Solids in kg/day along the LakhyaRiverVariation of Total Dissolved Solids in kg/day along the LakhyaRiverDecay constant for BOD5 with distanceDecay constant for COD with distanceDecay constant for NH3-N with distance
IX
57
58
58
58
5960
60
61
616263636465666767686969707172
73
7475
75
808181
Figure 7.4
Figure 7.5
Figure 7.6
Figure 7.7
Figure 7.8
Figure 7.9
Figure 7.10
Figure 7.11
Figure 7.12
Figure 7.13
Figure 7.14
Figure 7.15
Figure 7.16
Figure 7.17
Figure 7.18
Figure 7.19
Figure 7.20
Figure 7.21
Figure 7.22
Figure 7.23
Figure 7.24
Figure 7.25
Relationship between River flow and Total Ammonia concentrationat sampling point-l
Relationship between River flow and Total Ammonia concentrationat sampling point-9
Relationship between River flow and Ammonia concentration at'sampling point-l
Relationship between River flow and Ammonia concentration atsampling point-9
Relationship between River flow and Ammonium concentration atsampling point-l
Relationship between River flow and Ammonium concentration atsampling point-9
Relationship between River flow and BOD5 concentration atsampling point-l
Relationship between River flow and BOD5 concentration atsampling point-9
Relationship between River flow and COD concentration atsampling point-l
Relationship between River flow and COD concentration at'sampling point-9
Relationship between River flow and TS concentration at samplingpoint-l
Relationship between River flow and TS concentration at samplingpoint-9Relationship between River flow and TDS concentration at samplingpoint-l
Relationship between River flow and TDS concentration at samplingpoint-9
Comparision of Total Ammonia concentration (simulated) betweenup stream and down stream
Comparision of Total Ammonia concentration (observed) betweenup stream and down streamComparision of Ammonia concentration (simulated) between upstream and down stream
Comparision of Ammonia concentration (observed) between upstream and down stream
Comparision of Ammonium concentration (simulated) between upstream and down streamComparision of Ammonium concentration (observed) between upstream and down streamComparision of BOD5 concentration (simulated) between up streamand down stream
Comparision of BOD5 concentrations (observed) between up streamand down stream
x
82
82
83
83
84
84
85
85
86
86
87
87
88
88
89
90
90
91
91
92
92
93

Figure 7.26 Comparision of COD concentration (simulated) between up stream 93and down stream
Figure 7.27 Comparision of COD concentrations (observed) between up stream 94and down stream
Figure 7.28 Comparision of TS concentrations (simulated) between up stream 94and down stream
Figure 7.29 Comparision ofTS concentrations (observed) between up stream and 95down stream
Figure 7.30 Comparision of TDS concentration (simulated) between up stream 95and down stream
Figure 7.31 Comparision of TDS concentration (observed) between up stream 96and down stream
Figure 7.32 Relationship between Temperature and Dissolved Oxygen along the 96Lakhya River
Figure 7.33 Variation of percent saturation of Dissolved Oxygen along the 97Lakhya River
Figure 7.34 The load of Ammonia as percent of upstream load discharged from 98fertilizer factories into the Lakhya River
Figure 7.35 The load of Ammonia as percent of upstream load discharged from 99fertilizer factories into the Lakhya River
Figure 7.36 The load of BOD5 as percent of upstream load discharged from 99fertilizer factories into the Lakhya River
Figure 7.37 The load of COD as percent of upstream load discharged from 100fertilizer factories into the Lakhya River
Figure 7.38 The load of Total solids as percent of upstream load discharged from 101fertilizer factories into the Lakhya River
Figure 7.39 The load of Total Dissolved Solids as percent of upstream load 101discharged from fertilizer factories into the Lakhya River
XI

Diagram 6.1Diagram 6.2Diagram 6.3Diagram 6.4Diagram 6.5
Diagram 6.6
LIST OF SCHEMATIC DIAGRAMS
Different sources of BODs along the Lakhya RiverDifferent sources of COD along the Lakhya RiverDifferent sources of Ammonia along the Lakhya RiverDifferent sources of Total Solids along the Lakhya RiverDifferent sources of Total Suspended Solids along the LakhyaRiverDifferent sources of Total Dissolved Solids along the LakhyaRiver
XII
Page7676777778
78

Table 2.1Table 2.2Table 2.3Table 2.4Table 2.5Table 2.6
Table 2.7
Table 2.8Table 3.1Table 3.2Table 3.3
LIST OF TABLES
Ranking of the industrial sectors (top five polluters)Emissions and Effluents of GUFFL and PUFFLEQS of some relevant water quality parameters, DOE 1991EQS of some relevant water quality parameters, DOE 1997Drinking water quality standardsMaximum allowable concentrations of water quality variables fordrinkingMaximum allowable concentrations of water quality variables forFisheries and other aquatic livesIndustrial /Project Effluent StandardsDetail of wastewater sampling and flow measurement locationsParameters tested for different wastewater sampleDifferent methods of testing sample
XIII
Page91224242425
26
27343940

Photograph 3.1
Photograph 3.2
Photograph 3.3Photograph 3.4Photograph 3.5Photograph 3.6Photograph 3.7Photograph 3.8Photograph 3.9Photograph 3.10
Photograph 3.11
Photograph 3.12
Photograph 3.13Photograph 3.14Photograph 3.15Photograph 3.16
LIST OF PHOTOGRAPHS
Untreated effluent discharged into the Lagoon through thisdrainUntreated effluent discharged from Polash and Ghorasal ureafertilizer factories combine at this pointSampling point-2 (Lagoon)Sampling point-2 (Lagoon)Effluent discharged from Lagoon through these pumpEffluent discharged from Lagoon through this drainSampling point-3Effluent of sampling point-2 and 3 combine at this pointHouse hold effluent discharged through this drainHousehold effluent, effluent of sampling point-2 and 3 combineat this pointSampling point-5 ( Untreated effluent discharged into theLakhya River through this drain in June-July, 2007)Sampling point-5 ( Untreated effluent discharged into theLakhya River through this drain in March-April, 2007)Sampling point-7Measurement of pH, DO, Temperature at the sampling siteWater quality sampling at Lakhya RiverRemovig of air bubble from water quality sampling at LakhyaRiver.
XIV
Page36
36
3636363637373737
37
37
38383838

BODBUET
COD
DODOE
ECREQSEUIWMMOEFNH3-N
NH4-N
SIDATSTSSTDSUSEPAWARP 0WB
WHO
LIST OF ABBREVIATIONS
Bio-chemical Oxygen DemandBangladesh University of Engineering and TechnologyChemical Oxygen Demand
Dissolved Oxygen
Department of Environment
Environmental Conservation RulesEnvironmental Quality StandardsEuropean UnionInstitute of Water ModellingMinistry of Environment and ForestAmmonia as NitrogenAmmonium as Nitrogen
Swedish International Development Cooperation Agency
Total Solids
Total Suspended SolidsTotal Dissolved SolidsUnited State Environmental Protection AgencyWater Resources and Planning Organization
World Bank
World Health Organization
xv

1.1 Background
CHAPTER 1
INTRODUCTION
Water is essential to all forms of life and makes up 50-97% of the weight of all plants and
animals and abou~ 70% of human body (Buchholz, 1998).Water is also a vital resource for
agriculture, manufacturing, transportation and many other human activities. Despite its
importance, water is the most poorly managed resource in the world (Fakayode, 2005).
Ground and surface waters can be contaminated by several sources. In farming areas, the
routine application of agricultural fertilizers is the major source (Altman and Parizek, 1995;
Emongor et aI., 2005). In urban areas, the careless disposal of industrial effluents and other
wastes may contribute greatly to the poor quality of the water (Chindah et aI., 2004; Emongor
et aI., 2005; Furtado et aI., 1998 and Ugochukwu, 2004). A study on the impact of industrial
effluent on water quality of a river carried out in Nigeria (Fakayode, 2005) showed that the
chemical parameters studied were above the allowable limits and also tended to accumulate
downstream. The increasing demand on water arising from fast growth of industries has put
pressure on limited water resources. While most people in urban cities of the developing
countries have access to piped water, several others still rely on borehole and river water for
domestic use. Most of the rivers in the urban areas of the developing world are the end points
of effluents discharged from the industries. Industrial effluents, if not treated and properly
controlled can also pollute ground water (Olayinka, 2004; SARDC, 2005). Therefore, both
bore holes and rivers generally have poor quality water in the affected areas. Since people use
untreated waters from these sources, the result is continuous outbreaks of diseases such as
cholera, diarrhoea, desyntry and others. Bangladesh is experiencing rapid industrial growth
and this is making environmental conservation a difficult task (WB, 2007). Although the
government has put in place policies for effective environmental conservation and natural
resources manageplent, lack of political will is impeding their implementation. This is also.
compounded by the fact that the industrial sector shifts the responsibility of pollution
prevention to the government alone and this makes it difficult to prevent pollution. As a
result, there is unsustainable and wasteful utilization of resources which give rise to
dwindling wild life; more land degradation and increasing generation and indiscriminate
disposal of commercial, industrial and domestic wastes.

In the capital city of Bangladesh, there are a number of big rivers that runs through an
industrial site. The effluents from some industries are discharged into these rivers. People
who live near the area use the water from the river for domestic purposes. Unfortunately,
there is no information on the quality of the effluent discharged into this river and also on the
quality of the water in the river for human use. Such information is important for the
authorities to take proper action in preventing pollution of the environment for the good
health of the population. The objective of this study was therefore to assess the extent of
chemical pollution in receiving rivers as affected by industrial effluents discharged therein.
1.2 Importance of the Study
Industrialization has become essential for economic growth and employment generation in
Bangladesh. But the speeding up of the process of industrialization without adequate waste
management facilities has become the cause of degradation of environment and quality of
life. Indiscriminate disposal of polluting wastes beyond assimilation capacity of the water
bodies has become the cause of deterioration of water quality and aquatic ecosystem (WB-
2007). The Buriganga, the Dhaleswari, the Lakhya, and the Balu rivers have become highly
contaminated around the industrial clusters (IWM-2004 and SIDA-2006). For instance, The
Urea Fertilizer Factories (Pol ash and Ghorasal) produce around 1,400 tons urea per day. The
industry has an effluent treatment plant with inadequate capacity. Most of the untreated
effluent is being discharged into the Lakhya River through pump. In this connection,
Interventions are required to minimize impact (WB-2007).
1.3 Objectives of the Study
Objectives of the study are mentioned as follows:
• Characterization of effluent from fertilizer factories
• Estimation of water pollution load discharged from feliilizer factories
• Analysis of water quality along the Lakhya River to assess impact of fertilizer factories
effluent
• Recommending interventions to minimize impact
2
The study will help in formulation of policy for minimizing the surface water pollution,
contributed by the fertilizer factories.
1.4 Organization of the Study
The present study is organized as follows. Chapter I provides an introduction with
background, importance, objectives and organization of the study, Chapter 2 describes
Literature Review on water quality, effluent from fertilizer factories and their impact on
River water quality, Summary of previous works, Chapter 3 provides site selection, point of
data collection, methodology for data collection, analysis of sample, Chapter 4 describes the
characteristics of effluent from fertilizer factories, Chapter 5 describes the analysis of effluent
flow rate and estimation of water pollution load discharged from fertilizer factories, Chapter
6 describes the analysis of water quality and water pollution load along the Lakhya River to
assess impact of fertilizer factories effluent, Chapter 7 describes decay constant of different
water quality parameters, Relationship between River flow and different water quality
parameters, Comparision between up stream and down stream water quality parameters,
Development of industrial policy from impact of effluent; Chapter 8 provides the conclusion
on the present study, recommending interventions to minimize impact and recommendations
for the future research work.
3

CHAPTER 2
LITERATURE REVIEW
2.1 Introduction
Water is the most vital element among the natural resources, and is crucial for the survival of
all living organisl1)s. The environment, economic growth and development of Bangladesh are
all highly influenced by water - its regional and seasonal availability, and the quality of
surface and groundwater. Spatial and seasonal availability of surface and groundwater is
highly responsible to the monsoon climate and physiography of the country. Availability also
depends on upstream withdrawal for consumptive and nonconsumptive uses. In terms of
quality, the surface water of the country is unprotected from untreated industrial effluents and
municipal wastewater, runoff pollution from chemical fertilizers and pesticides, and oil and
lube spillage in the coastal area from the operation of sea and river ports. Water quality also
depends on effluent types and discharge quantity from different type of industries, types of
agrochemicals used in agriculture, and seasonal water flow and dilution capability by the
river system.
The increasing urbanization and industrialization of Bangladesh have negative implications
for water quality. The pollution from industrial and urban waste effluents and from
agrochemicals in some water bodies and rivers has reached alarming levels. The long-term
effects of this water contamination by organic and inorganic substances, many of them toxic,
are incalculable. The marine and aquatic ecosystems are affected, and the chemicals that enter
the food chain have public health implications. Water quality in the coastal area of
Bangladesh is degraded by the intrusion of saline water that has occurred due to lean flow in
the dry season.
In particular, water quality around Dhaka is so poor that water from the surrounding rivers
can no longer be considered as a source of water supply for human consumption. The largest
use of water is made for irrigation. Besides agriculture, some other uses are for domestic and
municipal water supply, industry, fishery, forestry and navigation. In addition, water is of
fundamental importance for ecology and the wider environment. Water stress occurs when
the demand for water exceeds the amount available during a certain period or when poor
quality restricts its use.
4

2.1.1 Definition of water pollution
Poorer water quality means water pollution. Water pollution can be defined in many ways.
Usually, it means one or more substances have built up in water to such an extent that they
cause problems for animals or people.
Water pollution almost always means that some damage has been done to an ocean, river,
lake, or other water source. A 1971 United Nations report defined ocean pollution as: "The
introduction by man, directly or indirectly, of substances or energy into the marine
environment (including estuaries) resulting in such deleterious effects as harm to living
resources, hazarqs to human health, hinderance to marine activities, including fishing,
impairment of quality for use of sea water and reduction of amenities. " Fortunately, Earth is
forgiving and damage from water pollution is often reversible.
2.1.2 Types of water pollution
Water resources like oceans, lakes, and rivers are called surface waters. The most obvious
type of water pollution affects surface waters. A great deal of water is held in underground
rock structures known as aquifers. Water stored underground in aquifers is known as
groundwater.
Surface water and groundwater are the two types of water resources that pollution affects.
There are also two different ways in which pollution can occur. If pollution comes from a
single location, such as a discharge pipe attached to a factory, it is known as point-source
pollution. Other examples of point source pollution include an oil spill from a tanker, a
discharge from a smoke stack (factory chimney), or someone pouring oil from their car down
a drain. A great deal of water pollution happens not from one single source but from many
different scattered sources. This is called nonpoint-source pollution.
When point-source pollution enters the environment, the place most affected is usually the
area immediately around the source. This is less likely to happen with nonpoint source
pollution which enters the environment from many different places at once. Sometimes
pollution that enters the environment in one place has an effect hundreds or even thousands
of miles away. This is known as transboundary pollution. One example is the way radioactive
waste travels through the oceans from nuclear reprocessing plants in England and France to
nearby countries such as Ireland and Norway.
5

2.1.2.1 Surface Water Pollution
Surface water quality are gradually emerging due to the dispersed locations of polluting
industries and the adverse effect on surrounding land and aquatic ecosystems, as well as
subsequent impacts on the livelihood system of the local community. The extreme examples
of this type of effect are near Dhaka at Konabari and Savar, where industrial effluents are
discharged into nearby land and water bodies without any treatment. Among the polluted
areas, the worst problems are in the River Buriganga situated to the south of Dhaka, where
the most significant source of pollution appears to be from tanneries in the Hazaribagh area.
In the dry season, the dissolved oxygen level becomes very low or non-existent and the river
becomes toxic (WARPO, 1999). The second most polluted river is the Shitalakhya, flowing
from the east of Dhaka. The major polluters of the river are Ghorashal Urea Fertilizer Factory
and an oil terminal situated on the bank of the river. Industrial units at Narayanganj and
Demra are also sources of the pollution. Water of the river Balu is badly contaminated by
urban and industrial wastes from Tongi and the effluent flowing out through the Begubari
Khal, most of which emanates from the Tejgaon industrial area in Dhaka. In the rivers Balu
and Turag, water quality in the dry season becomes worse, with DO concentrations becoming
almost zero (Saad, 2000).
2.1.3 Causes of Watcl' Pollution
The major causes of degradation of inland water quality are related to land based activities,
when adequate regulatory measures are not incorporated and the stakeholders do not show
proper concern. The underlying driving forces for this are poverty, an unhealthy national
economy, lack of institutional strength, and lack of awareness and education. Pollutants that
enter the marine' and coastal environment originate on land in the fonTI of runoff from
municipal, industrial and agricultural wastes, and from commercial seafaring activities. Most
water pollution doesn't begin in the water itself. Take the oceans: around 80 percent of ocean
pollution enters our seas from the land. Virtually any human activity can have an effect on
the quality of our water environment. When farmers fertilise the fields, the chemicals they
use are gradually washed by rain into the groundwater or surface waters nearby. Sometimes
the causes of water pollution are quite surprising. Chemicals released by smokestacks
(chimneys) can enter the atmosphere and then fall back to earth as rain, entering seas, rivers,
and lakes and causing water pollution. Water pollution has many different causes and this is
one of the reasons why it is such a difficult problem to solve.
6

2.1.4 Effluent
Effluent is liquid waste product (whether treated or untreated) discharged from an industrial
process or human activity that is discharged into the environment.
Effluent is a waste product, which could be in any of the three states of matter, discharged
from boundary of manufacturers to the environment (Bridgewater and Mumfod, 1979). They
are wastes resulting from processes employed in industrial establishments to the
environment; they could be reused after recovery. Water, which has been described by many
as the most essential commodity required for man's survival has received enormous
environmental abuse. Process industries and sewage systems are particularly guilty of
pollution of water systems (Asubiojo et aI., 1993).
2.1.4.1 Industrial effluent
In Bangladesh, industrial units are mostly located along the banks of the rivers. There are
obvious reasons for this such as provision of transportation for incoming raw materials and
outgoing finished products. Unfortunately as a consequence, industrial units drain effluents
directly into the rivers without any consideration of the enviromnental degradation. The most
problematic industries for the water sector are textiles, tanneries, pulp and paper mills,
fertilizer, industrial chemical production and refineries. A complex mixture of hazardous
chemicals, both organic and inorganic, is discharged into the water bodies from all these
industries usually without treatment. The highest numbers of industrial establishments in the
country are located in the North Central (NC) region, which comprises about 49 per cent of
the total sector. About 33 per cent of the industries in the NC region are textiles, apparels and
tanneries, of which Dhaka district accounts for almost half and Narayanganj about 32 per
cent. About 65 per cent of the total chemicals, plastics and petroleum industries are also
located in the NC region, and concentrated in and around Dhaka, Narayanganj and Gazipur
districts (WARPO, 2000). The organic pollutants are both biodegradable' and non-
biodegradable in nature. The biodegradable organic components degrade water quality during
decomposition by depleting dissolved oxygen. The non-biodegradable organic components
persist in the water system for a long time and pass into the food chain (Ahmed and
Reazuddin, 2000). Inorganic pollutants are mostly metallic salts, and basic and acidic
compounds. These inorganic components undergo different chemical and biochemical
interactions in the river system, and deteriorate waterquality.
7

2.2 Fertilizer factories in Bangladesh
There are eight public fertilizer factories in Bangladesh falling under three categories and ting
under the jurisdiction of Bangladesh Chemical Industries Corporation (BCIC):
Ammonia-urea production complexes
• Ghorashal Urea Fertilizer Factory at Ghorashal (GUFFL)
• Polash Urea Fertilizer Factory at Ghorashal (PUFL)
• Zia Fertilizer Factory at Ashuganj (ZFL)
• Chittagong Urea Fertilizer Factory at Chittagong (CUFL)
• Natural Gas Fertilizer Factory at Fenchuganj (NGFL)
• Jamuna Fertilizer Factory at Jamalpur (JFL)
Triple Super phosphate (TSP) production complex
• T.S.P Complex at Chittagong
Ammonia Sulphate production complex
• Ammonia Sulphate Complex
In addition, there is one private sector plant belonging to KAFCO (DOE, 1994). Limited data
is available on the type of waste generated, and physical and chemical characteristics of
effluent produced in both urea and phosphate plants. A study conducted by Islam et ai, 1994
shows that (Table 2.1) the rank of fertilizer factory as a pollutant in context of water;
pollution is fifth in Bangladesh. The acidic and alkaline waste generated from fertilizer.
Factories affect aquatic life. Ammonia present in the waste is toxic to fish. The amines have
high oxygen and chlorine values. Rainwater runoff from storage areas carries dissolved and
suspended solids, urea dust, and other materials such as, chromium and nickel. Phosphate
from T.S.P. complex can accelerate the growth of algae and other aquatic weeds. Ammonia
and urea dust may affect land areas around the fertilizer plants. Other substances found in the
effluent of fertilizer factories that are toxic to aquatic life are urea, hydrogen sulfide,
hydrogen cyanide, arsenic, methanol and fluorides. Sometimes fine carbon particle in the
effluent reduces dissolved oxygen content of the receiving stream.
8

Table 2.1 Ranking of the industrial sectors (top five polluters)
Rank Industrial sector Emission Percent Cumulative
(tons/year) contribution percent
Air pollution
1 Food industry 146356.06 38.7% 38.7%
2 Cement/Clay 62725.88 16.6% 55.3%
3 Pulp and paper 51963.92 13.7% 69.0%
4 Textile 39831.01 10.5% 79.5%
5 Tobacco 16992.22 4.5% 84.0%
Water pollution
1 Pulp and paper 91768.10 47.4% 47.4%
2 Pharmac~uticals 30866.72 15.9% 63.3%
3 Metal 27174.61 14.0% 77.3%
4 Food industry 23403.39 12.1% 89.4%
5 Fertilizers/pesticides 12715.00 6.6% 96.0%
Toxic metals emission
1 Metal 1071.92 28.3% 28.3%
2 Cement/Clay 688.90 18.2% 46.6%
3 Tanneries/leather 659.38 17.4% 64.0%
4 Fertilizers/pesticides 407.30 10.8% 74.8%
5 Textile 192.46 5.1% 79.8%
Toxic chemicals emission
1 Tanneries/leather 13630.55 20.6% 20.6%
2 Pulp and paper 10132.96 15.3% 35.9%
3 Pharmaceuticals 8362.393 12.6% 48.6%
4 Fertilizers/pesticides 8226.275 12.4% 61.0%
5 Industrial chemicals 5713.782 8.6% 69.6%
In addition to pollution, several occupational hazards have taken place in fertilizer factories
due to lack of safety measures. Workers are subjected to noice pollution and various health
risks from breathing urea dust gaseous ammonia.
9

2.2.1 Manufacturing Process Involved in Polash and Ghorasal Urea Fertilizer
Factories
The People's Republic of Bangladesh is designed to produce 305 and 1100 tons of uncoated
urea per steam day using carbamate solution total recycle process from Polash and Ghorasal
urea fertilizer factories respectively. The process adopts two stages of decomposition, three
stages of absorption, two stages of evaporation and partially heat recovery system. It is
characterized by stable production, easy operation and high product quality. Urea production
process is generally divided into the following sections
• Compression of CO2
• Purification and transportation of ammonia
• Systhesis of urea
• Recycle System
• Primary recycling
• Secondary recycle
• Evaporating, prilling and storage
• Flashing
• Evaporating
• Prilling and Storing
• Tail absorption
• Utilities
• Steam System
a Expanded steam
a Saturated steam system
• Steam condensate system
• Cooling water system
• Nitrogen system
• Air system
2.2.2 Principle on Urea Prodnction Using Carbamate Solution Total Recycle Process
1. Synthesis of urea
1. Synthesis reaction of urea
Synthesis reaction of urea is conducted in liquid phase in two successive steps. In the first
10

step, ammonia reacts with CO to from into ammonium carbamate.
2NH3 +C02 = NH4COONH2+QI
This is an exothermal reaction at a rapid speed and it easily obtains its equilibrium under
which the conversion rate of CO2to ammonium carbamate is considerably high. While in the
second step, the ammonium carbamate is dehydrated to form into urea.
NH4COONH2 = NH2CONH2 + H20 - Q2
It is a slightly endothermic reaction at a comparatively low speed and requires a considerable
length of time to obtain equilibrium. And even equilibrium is achieved, it is still impossible
for all the carbamate to be dehydrated to form urea. Hence the conversion rate is much lower
as compared with the first step. Thus the second step serves as the control reaction in the urea
synthesis.
It should be pointed out that the reaction in which carbamate is dehydrated to from urea must
be carried out in liquid phase, i.e. the carbamate must be under molten state, so the reaction
temperature must be higher than that of melting point. Since decomposition of carbamate is
favored by high temperature, a considerably high pressure should be maintained to ensure the
stability of carbamate. Therefore the synthesis reaction of urea may be realized only under
high pressure and high temperature conditions.
2. Effect of various factors on the conversion rate of systhesis reaction of urea
II. Separation and recovery of the unreacted feed materials
III. Formation of biuret
2.2.3 Pollutants from Polash and Ghorasal urea Fertilizer Factories
GUFFL and PUFFL has i) utility unit (water treatment unit, IG plant, Auxiliary boiler,
cooling water and waste water treatment plant), ii) ammonia plant unit, iii) urea unit, iv)
bagging and finishing unit, v) maintenance unit. These units discharge different types of
pollutants containing ammonia, acid/alkali wash water, mud and aluminum hydroxide sludge,
natural gas condensate, lubricating oil, urea condensate, diethanol amine potassium carbonate
solution, vanadium oxides, urea dust etc.
II

Table 2.2 Emissions and Effluents of GUFFL and PUFFL
Nature of pollution Type of pollutants
Emissions Sulfuric acid fume, hydrogen sulfide
Air pollutions Carbon monoxide, carbon dioxide, oxides of nitrogen,
hydrocarbons, oxides of sulfur, urea dust, ammoma,
dusts of sulfur
Effluents Suspended solids, hydrochloric acid, sulfuric acid,
sodium hydroxide, ammonium hydroxide, methanol,
lubricating oil, acid/alkali wash water, chromium
compounds, copper compounds, mud and alum sludge,
steam condensate and hot water etc.
Source: GUFFL and PUFFL
2.3 Why does pollution matter
Pollution matters because it harms the environment on which people depend. The
environment is not something distant and separate from our lives. The environment is
everything that surrounds us that gives us life and health. Destroying the environment
ultimately reduces the quality of our own lives-and that, most selfishly, is why pollution
should matter to all of us.
2.3.1 How do we know when water is polluted
There are two main ways of measuring the quality of water. One is to take samples of the
water and measure the concentrations of different chemicals that it contains. If the chemicals
are dangerous or the concentrations are too great, we can regard the water as polluted.
Measurements like this are known as chemical indicators of water quality. Another way to
measure water quality involves examining the fish, insects, and other invertebrates that the
water will support. If many different types of creatures can live in a river, the quality is likely
to be very good; if the river supports no fish life at all, the quality is obviously much poorer.
Measurements like this are called biological indicators of water quality.
2.4 Physical and Chemical Parameters
Chemical testing measures the concentration of dissolved or suspended substances in the
water. Physical P\lrameters, such as temperature, volume of flow, and velocity, can indicate
12

what type of aquatic organisms the stream will support. The physical and chemical make-up
of a stream is affected by soil, geology, precipitation, vegetation and land use in the
watershed. These parameters can change from day to day. They indicate conditions in the
water at the time of sampling and can increase or decrease with the quantity of runoff
Physical and chemical parameters help determine the type of pollution that may be affecting a
waterway and can provide some clues as to the sources. Water quality is good if naturally
occurring substances are present at levels that support aquatic life. Problems occur when
activities alter natural levels or introduce substances that are toxic to aquatic life.
2.4.1 pH
Water (H20) contains both hydrogen (H+) and hydroxyl (OH-) ions. The pH of water is a
measurement of the concentration ofH+ ions, using a scale that ranges from 0 to 14. A pH of
7 is considered "neutral", since concentrations of H+ and OH- ions are equal. Liquids or
substances with pH measurements below 7 are considered "acidic", and contain more H+ ions
than OH- ions. Those with pH measurements above 7 are considered "basic" or "alkaline,"
and contain more OH- ions than H+ ions. For everyone unit change in pH, there is
approximately a ten-fold change in acidity or alkalinity. Therefore, a pH of 4 is 10 times
more acidic than a pH of 5. Similarly, a pH of 9 is 10 times more alkaline than a pH of 8 and
100 times more alkaline than a pH of 7. Pure deionized water is neutral, with a pH of 7. pH is
an important property of natural waters influenced by the substances dissolved in the water
and influencing chemical reactions and the ability of water to bring other substances into
solution. A pH range of 6.0 to 9.0 appears to provide protection for the life of freshwater fish
and bottom dwelling invertebrates
pH is defined as the negative logarithm of the activity of H+ ions: pH = -log [H+], Where
[H+] is the concentration ofH+ ions in moles per liter
A range of pH 6.5 to pH 8.2 is optimal for most organisms.
• Most organisms have adapted to life in water of a specific pH and may die if it
changes even slightly. The toxicity level of ammonia to fish, for example, varies
tremendously within a small range of pH values.
• Acid rain containing nitric and sulferic acids can sharply lower the pH of a stream as
the rain runs quickly off streets and roofs into creeks. Acidic water can cause heavy
13

metals such as copper and aluminum to be released into the water. Copper from worn
automobile brake pads is often present in runoff.
• Rapids growing algae remove carbon dioxide from the water during photosynthesis,
which can result in a significant increase in pH levels.
Runoff from agricultural, domestic, and industrial areas may contain Iron, aluminum,
ammonia, mercury or other elements. The pH of the water will determine the toxic effects, if
any, of these subs~ances. For example, 4 mg/l of iron would not present a toxic effect at a pH
of 4.8. However, as little as 0.9 mg/l of iron at a pH of 5.5 can cause fish to die.
Synergy has special significance when considering water and wastewater treatment. The steps
involved in water and wastewater treatment require specific pH levels. In order for
coagulation (a treatment process) to occur, pH and alkalinity must fall within a limited range.
Chlorination, a disinfecting process for drinking water, requires a pH range that is
temperature dependent. pH levels between 7.2 to 8.5 are considered acceptable.
2.4.2 Temperature
It is important to monitor the temperature of our water bodies because the temperature of
water influences the amount of oxygen available for aquatic organisms. Cold water holds
more oxygen than warm water. Temperature also influences the rate of photo synthesis of
aquatic plants. As water temperature increases, photosynthes is goes up, and the rate of
decomposition and use of oxygen in creases. This can lead to degradation of the aquatic
community.
Temperature also influences the sensitivity of organisms to toxic wastes, parasites, and
disease. Bacteria grow faster in warm water, which could pose problems as Thennal pollution
from storm water is added our water bodies Temperature of water is a very important factor
for aquatic life. It controls the rate of metabolic and reproductive activities, and determines
which fish species can survive. Temperature also affects the concentration of dissolved
oxygen and can influence the activity of bacteria and toxic chemicals in water.
Temperature is important because it governs the kinds of aquatic life that can live in a stream.
Fish, insects, zooplankton, phytoplankton, and other aquatic species all have a preferred
temperature range. If temperatures get too far above or below this preferred range, the
number of individuals of the species decreases until finally there are none.
14
Temperature also' is important because it influences water chemistry. The rate of chemical
reactions generally increases at higher temperatures, which in tum affects biological activity.
Some compounds are also more toxic to aquatic life at higher temperatures.
Water temperature is sensitive to atmospheric temperature. It is influenced by the Sun's
energy, water depth, water circulation, pump motor heat, and heat from other mechanical
devices. Water temperature directly impacts the level of dissolved oxygen retention. A water
temperature exceeding 7SoF can inhibit the ability of fresh water to retain an acceptable level
of dissolved oxygen.
2.4.3 Dissolved Oxygen
Dissolved oxygen (DO) refers to the volume of oxygen that is contained in water. Oxygen
enters the water as rooted aquatic plants and algae undergo photosynthesis, and as oxygen are
transferred across the air-water interface. The amount of oxygen that can be held by the water
depends on the water temperature, salinity, and pressure. Gas solubility increases with
decreasing temperature (colder water holds more oxygen). Gas solubility increases with
decreasing salinity (freshwater holds more oxygen than does saltwater). Both the partial
pressure and the degree of saturation of oxygen will change with altitude. Finally, gas
solubility decreases as pressure decreases. Thus, the amount of oxygen absorbed in water
decreases as altitude increases because of the decrease in relative pressure.
Dissolved oxygen, may playa large role in the survival of aquatic life in temperate lakes and
reservOIrs during the summer months, due to a phenomenon called stratification (the
formation of layers). Seasonal stratification occurs as a result. of water's temperature-
dependent density. As water temperatures increase, the density decreases. Thus, the sun-
warmed water will remain at the surface of the water body (forming the epilimnion), while
the denser, cooler water sinks to the bottom (hypolimnion). The layer of rapid temperature
change separating the two layers is called the thermocline.
The introduction of excess organic matter may result in a depletion of oxygen from an
aquatic system. Prolonged exposure to low dissolved oxygen levels (less than S to 6 mg/I
oxygen) may not directly kill an organism, but will increase its susceptibility to other
environmental stresses. Exposure to less than 30% saturation (less than 2 mg/I oxygen)
15

Dissolved Oxygen (DO) is the amount of gaseous oxygen that is dissolved in water. DO is
considered low at levels less than 5mg/l and is lethal to many organisms at levels of less than
3mg/l. DO is probably the most significant indicator of aquatic health because DO is critical
for aquatic animals such as fish that "breathe" oxygen through their gills.
Dissolved Oxygen
• Fish, invertebrates, plants, and aerobic bacteria all require oxygen for respiration.
• Much of the dissolved oxygen in water comes from the atmosphere. After dissolving
at the surface, oxygen is distributed by current and turbulence. Algae and rooted
aquatic plants also deliver oxygen to water through photosynthesis.
• The main factor contributing to changes in dissolved oxygen levels is the build-up of
organic wastes. Decay of organic wastes consumes oxygen and is often concentrated
in summer, when aquatic animals require more oxygen to support higher
metabolisms.
• Depletions in dissolved oxygen can cause major shifts in the kinds of aquatic
organisms found in water bodies.
• Temperature, pressure, and salinity affect the dissolved oxygen capacity of water. The
ratio of the dissolved oxygen content (ppm) to the potential capacity (ppm) gives the
percent saturation, which is an indicator of water quality.
DO levels below about 40% will not support most aquatic life. At least 60% is required to
sustain fish populations. The DO level required to sustain sensitive species is around 80-
90%.
2.4.4 Biochemical Oxygen Demand
When organic matter decomposes, microorganisms (such as bacteria and fungi) feed upon it
and eventually it becomes oxidized (combined with oxygen). Biochemical oxygen demand is
a measure of the quantity of oxygen used by these microorganisms in the aerobic oxidation of
organic matter.
BOD is a measure of the amount of oxygen used up by biological and chemical processes in a
sample of stream water over a 5-day. Oxygen in the water is consumed by process such as:
the break down (rotting) of organic material; oxygen use by bacterial activity; and chemical
reactions as chemicals are converted to more stable forms (e.g. the conversion of ammonia to
nitrate).
16

BOD is calculated by measuring the oxygen level of the water on collection and then 5 days
later after storage in the dark (to stop photosynthetic activity) at a constant temperatureo
(usually 20 C). The difference between the two values is the demand or consumption of
oxygen by chemical and biological processes.
Biochemical Oxygen Demand
• Biochemical oxygen demand is a measure of the quantity of oxygen used by
microorganisms (e.g., aerobic bacteria) in the oxidation of organic matter.
• Natural sources of organic matter include plant decay and leaf fall. However, plant
growth and decay may be unnaturally accelerated when nutrients and sunlight are
overly abundant due to human influence.
• Urban runoff carries pet wastes from streets and sidewalks; nutrients from lawn
fertilizers; leaves, grass clippings, and paper from residential areas, which increase
oxygen demand.
• Oxygen consumed in the decomposition process robs other aquatic organisms of the
oxygen they need to live. Organisms that are more tolerant of lower dissolved oxygen
levels may replace a diversity of more sensitive organisms.
CBODs Carbonaceous Biochemical Oxygen Demand represents the amount of oxygen
consumed by bacteria and other microorganisms while they decompose organic matter. It is
a test used to detemline the relative oxygen requirements of wastewaters, effluents, and
polluted waters.
Calculation
For each test bottle meeting the 2.0-mg/L minimum DO depletion and the 1.0-mg/L residual
DO, calculate BODs as follows:
When dilution water is not seeded:
BODs, mg/L = -------p
When dilution water is seeded:
(D1 -Dz) - (B1 -Bz)fBODs, mg/L = --------
p
17
Where:
D1 = DO of diluted sample immediately after preparation, mg/L, .
Dz =DO of diluted sample after 5 d incubation at 20°C, mg/L,
P = decimal volumetric fraction of sample used,
B! =DO of seed control before incubation, mg/L
Bz = DO of seed control after incubation mg/L and
f = ratio of seed in diluted sample to seed in seed control = (% seed in diluted sample )/(%seed in seed control).
If seed material is added directly to sample or to seed control bottles:
f= (volume of ~eed in diluted sample)/(volume of seed in seed control)
"Biochemical Oxygen Demand" (BOD). Because the test is performed over a five day
period, it is often referred to as a "Five Day BOD", or a BOD5.
2.4.5 Chemical Oxygen Demand
The concept of chemical oxygen demand (COD) is that all organic compounds, with but few
exceptions, can be oxidized to carbon dioxide and water. In contrast with the BOD test,
which measures only the biodegradable fraction, COD may measure toxic as well as
biodegradable organic compounds. It is therefore applicable to many industrial wastes not
readily analyzed for water quality factors by the sewage oriented BOD test (McGauhey,
1968)
2.4.6 Total Solids
The term "total solids" refers to matter suspended or dissolved in water or wastewater, and is
related to both specific conductance and turbidity. Total solids (also referred to as total
residue) are the term used for material left in a container after evaporation and drying of a
water sample. Total Solids includes both total suspended solids, the portion of total solids
retained by a filter and total dissolved solids, the portion that passes through a filter
2.4.7 Total Suspended Solids (TSS)
Total Suspended Solids (TSS) is solids in water that can be trapped by a filter. TSS can
include a wide variety of material, such as silt, decaying plant and animal matter, industrial
18

wastes, and sewage. High concentrations of suspended solids can cause many problems for
stream health and aquatic life.
High TSS can block light from reaching submerged vegetation. As the amount of light
passing through the water is reduced, photosynthesis slows down. Reduced rates of
photosynthesis causes less dissolved oxygen to be released into the water by plants. If light is
completely blocked from bottom dwelling plants, the plants will stop producing oxygen and
will die. As the plants are decomposed, bacteria will use up even more oxygen from the
water. Low dissolved oxygen can lead to fish kills. High TSS can also cause an increase in
surface water temperature, because the suspended particles absorb heat from sunlight. This
can cause dissolved oxygen levels to fall even further (because wam1er waters can hold less
DO), and can harm aquatic life in many other ways.
The decrease in water clarity caused by TSS can affect the ability of fish to see and catch
food. Suspended sediment can also clog fish gills, reduce growth rates, decrease resistance to
disease, and prevent egg and larval development. High TSS in a water body can often mean
higher concentrations of bacteria, nutrients, pesticides, and metals in the water. These
pollutants may attach to sediment particles on the land and be calTied into water bodies with
storm water.
Total Suspended Solids (TSS) is the non-filterable portion of solids found in the water
column. These contribute to the turbidity or cloudiness of the water and may clog fish gills,
either killing them or reducing their growth rate. Suspended solids also reduce light
penetration thus reducing the ability of algae to produce food and oxygen. TSS can also
destroy fish habitat because suspended solids settle to the bottom and can eventually blanket
the river bed. Suspended solids can smother the eggs of fish and aquatic insects, and can
suffocate newly-hatched insect larvae. Suspended solids can also harm fish directly by
clogging gills, reducing growth rates, and lowering resistance to disease. Changes to the
aquatic environment may result in a diminished food sources, and increased difficulties in
finding food. Natural movements and migrations of aquatic populations may be disrupted.
2.4.8 Total Dissolved Solids (TDS)
Total Dissolved Solids (TDS) are solids in water that can pass through a filter (usually with a
pore size of 0.45 micrometers). TDS is a measure of the amount of material dissolved in
19

water. This material can include carbonate, bicarbonate, chloride, sulfate, phosphate, nitrate,
calcium, magnesium, sodium, organic ions, and other ions. A certain level of these ions in
water is necessary for aquatic life. Changes in TDS concentrations can be harmful because
the density of the water determines the flow of water into and out of an organism's cells.
However, if TDS concentrations are too high or too low, the growth of many aquatic lives
can be limited, and death may occur.
Similar to ISS, high concentrations of TDS may also reduce water clarity, contribute to a
decrease in photosynthesis, combine with toxic compounds and heavy metals, and lead to an
increase in water temperature TDS is used to estimate the quality of drinking water, because
it represents the amount of ions in the water. Water with high TDS often has a bad taste
and/or high water hardness, and could result in a laxative effect.
A certain level of these ions in water is necessary for aquatic life. Changes in TDS
concentrations can be harmful because the water density determines the flow of water in and
out of an organism's cells. If IDS concentrations are too high or too low, growth of aquatic
life may be limite~ and death may occur. High concentrations of IDS may also reduce water
clarity, contribute to a decrease in photosynthesis, lead to an increase in temperature, and
transport toxic compounds and heavy metals. Rainwater contains less than 10 ppm TDS.
Rivers may contain between 100 and 2,000 ppm. Maximum allowable levels range from 750
ppm to 1500 ppm. The specific allowable level is determined by the type of/waterway -
warm or cold water stream and the type offish it should support.
2.4.9 Ammonia
In nature, ammonia is formed by the action of bacteria on proteins and urea. Ammonia is
toxic to fish and aquatic organisms, even in very low concentrations. When levels reach 0.06
mg/L, fish can suffer gill damage. When levels reach 0.2 mg/L, sensitive fish like trout and
salmon begin to die. As levels near 2.0 mg/L, even ammonia-tolerant fish like carp begin to
die. Ammonia levels greater than approximately 0.1 mg/L usually indicate polluted waters.
The danger ammonia poses for fish depends on the water's temperature and pH, along with
the dissolved oxygen and carbon dioxide levels. Remember, the higher the pH and the
warmer the temperature, the more toxic the ammonia. Also, ammonia is much more toxic to
fish and aquatic life when water contains very little dissolved oxygen and carbon dioxide.
20

• Nitrogen occurs in natural waters as nitrate (N03), nitrite (NOz), ammonia (NH3), and
organically bound nitrogen.
• As aquatic plants and animals die, bacteria break down large protein molecules
containing nitrogen into ammonia. Ammonia is then oxidized by specialized bacteria
to form nitrites and nitrates.
• Sewage is the main source of ammonia added by humans to rivers. The ammonia
arises mostly from the hydrolysis of urea in urine, but additional ammonia is
generated by the decomposition of other nitrogenous materials in sewage.
In a flowing stream, the presence of ammonia in high concentrations indicates recent
pollution. Sewage may be entering the water somewhere in the vicinity.
2.5 Biological Parameters
Biological monitoring provides an indication of stream health over time, because it measures
aquatic organisms and their responses to changes in their environment. The presence,
diversity, and abundance of certain types of organisms can provide information on stream
health, because they react differently to changes in water quality. Biological surveys can be
used to identify the impact of pollution and pollution control activities, to rank stream health,
and identify water quality trends. The most common organisms studied are fish, algae, and
macro invertebrates. This study focuses on macro invertebrates.
2.5.1 Total Coli form and Fecal Coli form
Total coliform bacteria are a collection of relatively harmless microorganisms that live in
large numbers in the intestines of man and warm- and cold-blooded animals. They aid in the
digestion of food. A specific subgroup of this collection is the fecal colifonn bacteria, the
most common member being Escherichia coli. These organisms may be separated from the
total coliform group by their ability to grow at elevated temperatures and are associated only
with the fecal material ofwann-blooded animals.
The presence of fecal coliform bacteria in aquatic environments indicates that the water has
been contaminated with the fecal material of man or other animals. At the time this occurred,
the source water may have been contaminated by pathogens or disease producing bacteria or
Zl

viruses which can also exist in fecal materia!. Some waterborne pathogenic diseases include
typhoid fever, viral and bacterial gastroenteritis and hepatitis A.
Fecal coli forms are bacteria that are naturally occurring in the digestive tracts of human and
other warm blooded animals. Fecal coli form itself does not cause disease, but it may
indicate the presence of other bacteria that may be harmful. Fecal coli form mis routinely
tested because it is a safe, inexpensive way to determine if other bacteria are present. If fecal
coli form counts are high; it is likely that other organisms are present. It is the second
Occurring organisms that have been linked to typhoid fever, hepatitis, gastroenteritis,
dysentery, and ear infections.
The coliform bacteria group consists of several genera of bacteria belonging to the family
enterobacteriacea,e. These mostly harmless bacteria live in soil, water, and the digestive
system of animals. Fecal coliform bacteria, which belong to this group, are present in large
numbers in the feces and intestinal tracts of humans and other warm-blooded animals, and
can enter water bodies from human and animal waste. If a large number of fecal coliform
bacteria (over 200 colonies/1 00 milliliters (ml) of water sample) are found in water, it is
possible that pathogenic (disease- or illness-causing) organisms are also present in the water.
Fecal coliform bacteria are microscopic organisms that live in the intestines ofwann-blooded
animals. They also live in the waste material, or feces, excreted from the intestinal tract.
When fecal coliform bacteria are present in high numbers in a water sample, it means that the
water has received fecal matter from one source or another. Although not necessarily agents
of disease, fecal coliform bacteria may indicate the presence of disease-carrying organisms,
which live in the same environment as the fecal coliform bacteria.
Coli forms are a broad class of bacteria found in our environment, including the feces of man
and other warm-blooded animals. The presence of coliform bacteria in drinking water may
indicate a possible presence of harmful, disease-causing organisms.
22
2.5.2 Algae
• Algae, also known as phytoplankton, are tiny, single-celled plants.
• The abundance of algae is controlled by factors such as light, salinity, water
temperature, and nutrient levels. An algal population explosion is known as a
"bloom."
• High concentrations of algae will raise the dissolved oxygen concentration during the
day while algae photosynthesize, but oxygen concentrations may drop off steeply
overnight as algae consume oxygen or decompose. Aquatic animals may suffocate as
a result.
• The photosynthetic process may also raise the pH to uncomfortable levels. Decaying
algae can also cause odor problems and attract flies.
• Urban creeks, which are often poorly shaded and well feed with runoff from fertilized
yards and home car washes, are especially susceptible to algal blooms.
2.6 Environmental Quality Standards (EQS)
The Environmental Quality Standards (EQS) of relevant parameters set out by the DOE
(DOE, 1991) for fishing, recreational and irrigation water as shown in Table 2.3. The
Ministry of Environment and Forest (MOEF) published EQS in a Gazette (Bangladesh
Gazette, Addendum, on 28 August in 1997 (MOEF, 1997) for environmental protection and
management in the working level. Besides, there are several guidelines provided by different
countries or organizations like United State Environmental Protection Agency (USEP A),
World Health Organization (WHO), European Union (EU), Canada and Russia. Table 2.5
describes the following limits of different inorganic water quality parameters for drinking
waters specified by USEPA, WHO and Bangladesh. Table 2.6 describes maximum allowable
concentration of water quality variables for drinking provided by WHO, EU, Canada and
Russia. Table 2.7 describes maximum allowable concentrations of water quality variables for
fisheries and other aquatic lives.
23

Table 2.3 EQS of some relevant water quality parameters, DOE 1991
Parameters Recreational Fishing IrrigationTotal Alkalinity, mgll NYS 70-100 NYSAmmonia (NH3), mg/l 2 0.025 3Ammonical Nitrogen (as N), mgll NYS 1.2 15BOD (ultimate), mg/l 3 6 10Chloride (as Cl ), mgll 600 600 600COD, mg/l 4 NYS NYSChromium, mgll NYS 0.05 NYSColiform (total), Nos/l 00 ml NYS NYS 10DO, mgll 4-5 4-6 5Nitrate (as N), mgll NYS NYS NYSpH 6-9.5 6.5-8.5 6-8.5SS, mgll 20 25 NYS
Table 2.4Source: Kamal, 1996
EQS of some relevant water quality parameters, DOE 1997
Parameters Recreational Fishing IrrigationpH 6.5-8.5 6.5-8.5BOD (ultimate), mgll ~3 ~6DO, mgll ~5 ~5 ~5Total Coliform (No.11OOml) ~200 ~ 5000 ~ 1000Ammonical Nitrogen (as N), mgll - ~1.2 -Electrical Conductivity (llmho/cm) - - 2250
Source: Bangladesh Gazette, Addendum, 28th August 1997
Table 2.5 Drinking water quality standards (Source: Ahmed, et aI, 2001)
Parameter USEP A (2000) WHO (1993) Bangladesh(GoB,1~97)
Aluminium (mgll) 0.05-0.20 0.20 0.1(0.2)Antimony (mgll) 0.006 0.005Arsenic (mgll) 0.01 0.01 0.05Barium (mgll) 2.0 0.70 1.0Bromide (mgll) 10 10Calcium (mgll) 75(200)Cadmium (mgll) 0.005 0.003 0.01Chloride (mg/l) 250 250 200(600)Chromium (mgll) 0.10 0.05 0.05Copper (mg/l) 1.31 0.20 1.5Fluoride (mg/l) 2.0 1.50 1.0Hardness as CaCo3 (mg/l) 100-500 200-500Iron (mg/l) 0.30 0.30 0.30(1.0)Lead (mg/l) 0.Ql5 0.01 0.10Manganese (mgll) 0.10 0.1-0.05 0.10(0.5)
24

Nickel (mg/I) 0.10 0.02Nitrate (mg/I) 10 50 10Nitrite (mg/I) 1Phosphate (mg/l) 0.005 6.0pH 6.5-8.5 6.5-8.5 6.5-8.5Selenium (mg/l) 0.05 0.01Silver (m.gll) 0.10Sodium (mg/l) 200Sulfate (mg/l) 250 250 400TDS (mg/l) 400-500 1000 500(1500)Zinc (mg/l) 5.0 3.0 5(15)
Bangladesh standard values are given as maximum desirable concentration with maximumpermissible concentration in parentheses.
Table 2.6 Maximum allowable concentrations of water quality variables for drinking(Source: Chapman, 1996)Use Variable WHO EU Canada USA Russia
Colour (TCU) 15 20 Pt-Co 15 15 20Total dissolved solids (mg/I) 1000 500 500 1000Total suspended solids (mg/l)Turbidity (NTU) 5 4JTU 5 0.5-LOpH <8 6.5-8.5 6.5-8.5 6.5-8.5 6.0-
9.0Dissolved Oxygen(mg/l) 4.0Ammonical Nitrogen (as N), mg/I 2.0Ammonium (NH3), mg/l 0.50 2.0Nitrate as N(mg/I) 10 10Nitrate(mg/I) 50 50 45Nitrite as N(mg/I) LO LONitrite( mgll) 3 0.1 3.0Phosphorus(mg/I) 3 5.0BOD(mg/1 O2) 3.0Sodium(mg/I) 200 150Chloride (mg/l) 250 25 250 250 350Chlorine(mg/l) 5Sulfate(mg/l) 250 250 500 250 500Sulphide(mg/I) 0.05Fluoride (mg/l) 1.5 L5 L5 2.0 <1.5Boron(mg/l) 0.30 LO 5.0 0.30Cyanide(mg/I) 0.07 0.05 0.2 0.2(PP) 0.07Aluminium (mg/I) 0.20 0.2 0.50Arsenic (mg/I) 0.01 0.05 0.05 0.05 0.01Barium(mg/I) 0.7 0.1 1.0 2.0 0.7Cadmium (mg/I) 0.003 0.005 0.005 0.005 0.003Chromium(mg/l) 0.05 0.05 0.05 0.10 0.05Cohalt(mg/l) 0.10Copper(mg/I) 2 0.1-3.0 1.0 1 2.0Iron (mg/I) 0.3 0.2 0.3 0.3 0.30Lead (mg/I) 0.01 0.05 0.05 0.015 0.01Manganese (mg/l) 0.5 0.05 0.05 0.05 0.5
25

Mercury (mg/I) 0.001 0.001 0.001 0.002 0.001Nickel(mg/I) 0.02 0.05 0.02Selenium(mg/I) om 0.01 0.01 0.05 0.01Zinc(mg/l) 3 0.1-5.0 5.0 5 5.0Oil and petroleum products (J.!g/I) 0.01 0.10Total pesticides(J.!g/l) 0.5 100Aldrin& dieldrin (J.!gll) 0.03 0.7
DDT(lJ-gll) 2 30.0 2.0Lindane(J.!g/l) 2 4.0 0.2 2.0Methoxychlor(J.!g/l) 20 100 40Benzene(J.!gll) 10 5Penta chlorophenol 9 10 10Phenols(J.!g/1) 0.5 2 1.0Detergents(J.!g/I) 0.2 0.5 0.5Faecal Coliforms (E.Coli) (No. per 100ml) 0 0 0 0Total Coliforms (No. per 100ml) 0 10 I 0.30
Table 2.7 Maximum allowable concentrations of water quality variables for Fisheriesand other aquatic lives (Source: Chapman, 1996)
Use Variable EU Canada RussiaTotal suspended solids (mg/I) 25 10pH 6.0-9.0 6.0-9.0Dissolved Oxygen(mg/I) 5.0-9.0 5.0-9.0 4.0-6.0Ammonical Nitrogen (as N), 0.005-0.025 1.37-2.2 0.05mg/IAmmonium (NH3), mg/I 0.04-1.0 0.50Nitrate(mg/I) 40Nitrite(m.gil) 0.01-0.03 0.06 0.08BOD (mg/I) 3.0-6.0 3.0Sodium(mg/I) 120Chloride (mg/1) (mg/I) 300Chlorine(mg/I)Sulfate(mg/I) 0.002 100Fluoride (mg/I) 0.75Cyanide(mg/I) . 0.005 0.05Aluminium (mg/I) 0.005-0.1Arsenic (mg/I) 0.05 0.005Cadmium (mg/I) 0.0002-0.0018 0.02-0.005Chromium(mg/I) 0.02-0.002 0.01Cobalt(m.gil) 0.001Copper(mg/l) 0.005-0.112 0.002-0.004 0.10Iron (mg/I) 0.30 0.10Lead (mg/I) 0.001-0.007 0.01Manganese (mg/I) 0.00001Mercury (mg/I) 0.0001 0.01Nickel(mg/I) 0.025-0.12 0.0016Selenium(mg/l) 0.001 0.01
26
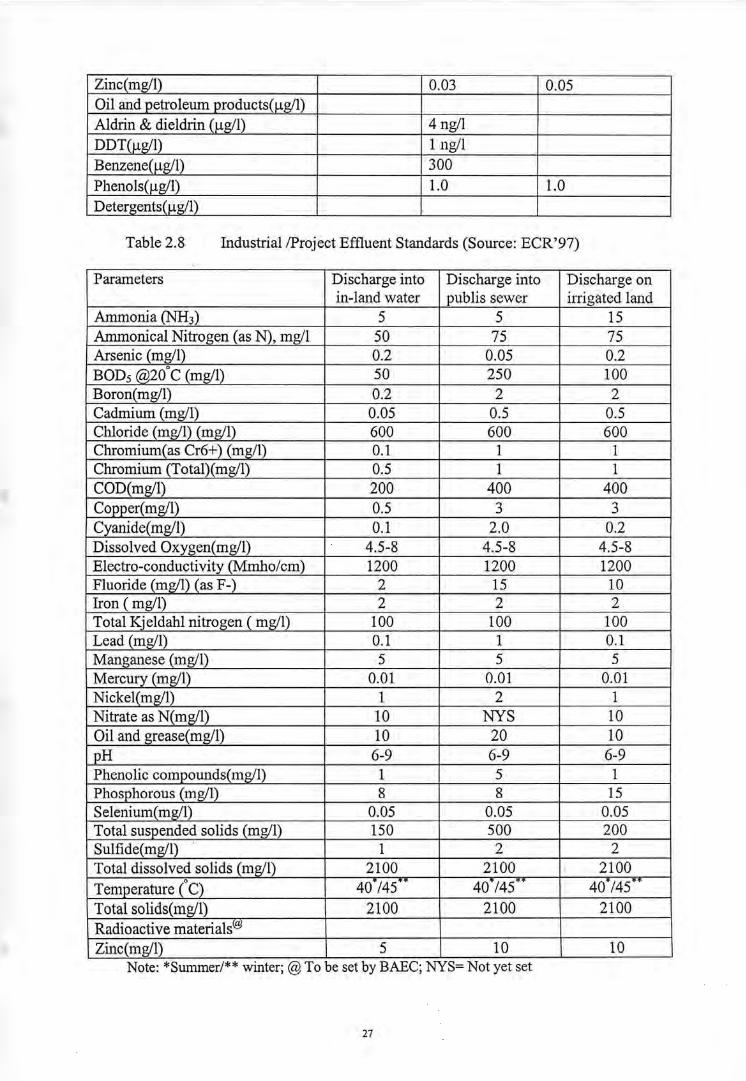
0.03 0.05
4 ng/I1 ng/l3001.0 1.0
Table 2.8 Industrial /Project Effluent Standards (Source: ECR'97)
Parameters Discharge into Discharge into Discharge onin-land water publis sewer irrigated land
Ammonia (NH3) 5 5 15Ammonical Nitrogen (as N), mg/I 50 75 75Arsenic (mg/I) 0.2 0.05 0.2BODs @20.C (mg/l) 50 250 100Boron(mg/I) 0.2 2 2Cadmium (mg/l) 0.05 0.5 0.5Chloride (mg/I) (mg/I) 600 600 600Chromium(as Cr6+) (mg/I) 0.1 1 1Chromium (Total)(mg/I) 0.5 1 1COD(mg/l) 200 400 400Copper(mg/I) 0.5 3 3Cvanide(mg/l) 0.1 2.0 0.2Dissolved Oxygen(mg/I) 4.5-8 4.5-8 4.5-8Electro-conductivity (Mmho/cm) 1200 1200 1200Fluoride (mg/I) (as F-) 2 15 10Iron (mg/I) 2 2 2Total Kjeldahl nitrogen ( mg/I) 100 100 100Lead (mg/I) 0.1 1 0.1Manganese (mg/I) 5 5 5Mercury (mg/I) 0.01 0.01 0.01Nickel(mg/I) 1 2 1Nitrate as N(mg/I) 10 NYS 10Oil and grease(mg/I) 10 20 10pH 6-9 6-9 6-9Phenolic compounds(mg/I) 1 5 IPhosphorous (mg/I) 8 8 15Selenium(mg/I) 0.05 0.05 0.05Total suspended solids (mg/I) 150 500 200Sulfide(mg/I) I 2 2Total dissolved solids (mg/I) 2100 2100 2100Temperature (C) 40./45 .• 40./45.' 40 145Total solids(mg/l) 2100 2100 2100Radioactive materials(f9Zinc(mg/I) 5 10 10
Note: *Summer/** winter; @ To be set by BAEC; NYS= Not yet set
27
2.7 Summary of Previous Works
Some potential studies were done on impact of effluent on water quality and environment.
The summary of some of them is described briefly in the following sections.
Kalam (1968) investigated the water quality of the river Buriganga near Chadnighat in the
year 1967 to 1968. Kalam observed that, for making potable the water of the Buriganga is
required to be treated for the removal of turbidity, hardness, alkalinity, soluble Iron,
manganese etc.
Islam (1977) investigated the water quality of various rivers in and around Dhaka city. He
noticed that the surface waters are being increasingly polluted with the passage of time. He
also recommended that water from both Buriganga and Sitalakhya could be treated
effectively and economically for Dhaka water supply.
Tarikuzzaman (1998) assessed the impact of Jamuna fertilizer industry on the surrounding
environment. He found that the concentration of pH, conductivity, BODs, COD, SS, TS
ammonia, urea sulphate, sulphide, heavy metals (Cu, Zn, Pb, Mn) and turbidity occasionally
exceed the respective permissible values. As a result fish population of the Jamuna River near
the factory reduced to a great extent compared to that before installation of the industry.
Islam (2004) estimated industrial pollution load in Bangladesh. He noticed that the BOD load
from the entire in?ustrial sector has been estimated at around 34,000 metric ton for the year
1991-92 and about 28,000 metric ton for the year 1995-96. The total TSS load from all
industrial sectors have been estimated to be around 40,000 metric ton for the year 1991-92
and about 30,000 metric tons for the year 1995-96. The total toxic-chemical pollution load in
Bangladesh has been estimated to be about 37000 MT and 41000 MT in 1991-92 and 1995-
96, respectively. Estimated total toxic-metal release in the country in 1991-92 and 1995-96 is
approximately 7250 MT and 7500 MT, respectively.
Institute of Water Modelling (2004) conducted a study to investigate alternate location of the
intake of Saidabad water treatment plant. Results of the study showed that the DO level in
present condition (0.6 mg/I) is far below the critical DO level (4 mg/I) and it will continue to
decrease with increasing waste load in future. Norai khal, DND canal and Majheepara khal,
Tanbazar khal, Killarpul khal, Kalibazar khal and B.K Road khal from Narayanganj had been
identified as the major pollutant sources affecting the water quality at Sarulia.
28
Sarkar (2005) assessed surface water for Sylhet city. He noticed that the physical, chemical
and biochemical characteristics of water of the river Surma and the river Kushiyara were
determined through extensive laboratory tests. Except suspended solids and turbidity all other
parameters have higher concentrations in the dry season comparing to the wet season for both
the rivers as high flows in wet season provide better dilution of pollutants. Huge amount of
surface and agricultural runoff and bank erosion increases suspended solids and turbidity in
the wet season. It is evident from experimental results of water quality parameters that both
the rivers can be used as source of water for fishing, industrial and irrigation purpose
according to Bangladesh standards of inland surface water. However, the test results of
coliform exceed the limit of Bangladesh standard for recreational use. Comparing to the
surface water bodies around Dhaka city it can be concluded that the degree of pollution of the
Surma and the Kushiyara is not yet high and can be used as an alternative source of water
supply instead of ground water for Sylhet City Corporation.
Magumdar (2005) assessed the water quality around Dhaka city. He observed that in
consideration of drinking standards, the river water is contaminated by several parameters,
which include organic matter, suspended solids and microorganisms. Ammonia level in
different reaches of the river system is well above the pernlitted value specified in the United
State Environmental Protection Agency (USEP A) guideline to avoid toxic effect on fishes.
Concentrations of Nitrate (N03-), Phosphate (POl-), Zinc (2n), Chromium (Cr), Lead (Pb)
and Mercury (Rg) in the river system are well below the allowable limits specified in
different Environmental Quality Standards (EQS).
Alam (2006) characterized the liquid waste of Natural Gas Fertilizer Factory Limited and to
identify any changes of water quality of Kushiara River due to discharge of industrial effluent
from NGFFL. He observed that Dissolved solid contents of the lagoons were within the limit,
but suspended solid contents exceeded the Bangladesh Standards for industrial eftluent. COD
and BODs were well below the Bangladesh Standard. Dissolved Oxygen of the wastewater
was found to be between 2.0 to 3.0 mg/l, which do not satisfy the standard (4.5 -8 mgll). Oil
and grease concentrations were found in the range of28 to 68 mgll, much higher than the
standard (10 mg/l) for discharge into the inland surface water. Chromium and nitrate were
found to be slightly higher than the standard limit for some samples. Ammonia nitrogen
concentration was very high in lagoon I, which is being directly discharged into the Kushiara
River. River water quality was analyzed in the month of December. Ammonia nitrogen was
29

found to be 0.44 mg/l and 0.18 mg/l at the 300 yards and 1500 yards downstream of the
eftluent discharge point, respectively. The efficiency of lagoon 2 was analyzed and found that
the lagoon 2 is not efficiently reducing ammonia.
World Bank (2007) conducted a study on industrial environmental compliance and pollution
control in greater Dhaka. World Bank noticed the following observations: 1) Except for very
few, most of the industries in the Clusters either do not have or have rudimentary/inadequate
effluent treatment facilities. As a result, the effluent quality in almost all cases violates the
Environment Quality Standards (EQS) of Bangladesh. 2) From water sample analyses at 14
locations in the river system of Dhaka watershed, it has become evident that in 12 locations
the BOD and DO levels are beyond acceptable limits. This implies that the surface water
quality situation in Dhaka watershed is generally in unacceptable conditions. 3) Groundwater
over abstraction caused unusual declining rate of water level and developed mining situation
which accelerates force recharge and enhances the risk of aquifer contamination from
peripheral polluted rivers system and industrial effluent of the Dhaka watershed. 4) The
elevated concentration of heavy metals and the influent character of the city river systems
allow the mobilization of metal ions and their transport into the nearby section of Upper Dupi
Tila aquifer system and subsequently migration with the groundwater flow towards the
DWASA wells. There is possibility of infiltration of polluted water from the drains and ponds
directly to the aquifer (through the overlying clay layer) and with the groundwater flow
towards the production wells.
30

CHAPTER 3
SAMPLING AND ANALYSIS
3.1 Introduction
In Bangladesh, industrial units are mostly located along the banks of the rivers. There are
obvious reasons for this such as provision of transportation for incoming raw materials and
outgoing finished products. Unfortunately as a consequence, industrial units drain effluents
directly into the rivers without any consideration of the environmental degradation. The most
problematic indu~tries for the water sector are textiles, tanneries, pulp and paper mills,
fertilizer, industrial chemical production and refineries. A complex mixture of hazardous
chemicals, both organic and inorganic, is discharged into the water bodies from all these
industries usually without treatment.
3.2 GhorasaI and Polash Urea Fertilizer Factories
The seven (one private) urea fertilizer plants currently operating in Bangladesh are all under
the control of BCIC, a state corporation. Most of them are located on rivers, into which they
discharge their wastewater. Most of them use natural gas as the basic feedstock; include both
ammonia and urea facilities; and operate on selfgenerated electricity. Polash (N-23° 59' 12",
E-90° 38' 27.05"),and Ghorasal (N-23° 59' 8.9", E-90° 38' 32.8") Urea fertilizer factories are
also situated on the bank of the river Lakhya which flows around the capital city of
Bangladesh. These are under Narsinghdi district of Bangladesh. These two plants were built
in different eras: GUFF with Japanese assistance in 1968 and PUFF with Chinese assistance
in 1985. Technologically, however, they are approximately at parity. The Chinese design
closely reflects the two-decades-old Japanese design. The major water pollutants are the
same: BOD, pH, ammonia, urea, alum sludge, oil, and grease. The two plants also share a
first-stage treatment lagoon, which was constructed by GUFF in 1980. Both factories use the
lagoon to dilute the effluent with wastewater from their staff colonies. Polash and Ghorasal
Urea Fertilizer Factories produce 305 and 1100 tons urea per day respectively. As a result a
huge amount of effluent produced from these factories, but unfortunately most of the effluent
is discharged into'the Lakhya River without treatment and patial treatment. A large number
of peoples depend on Lakhya River for their household, industrial and other purposes.
However, the water quality of the Lakhya River is deteriorating day by day due to human
31

activities and industrial effluents, which are built up on its bank. So it is of vital importance
to monitor and simulate the water quality parameters of the Lakhya River to ascertain
whether the water is still suitable for various uses.
3.3 Sample and Sampling
Samples of waste water collected from different sources should fairly represent the body of
the waste from which they were collected. There are three main methods of sampling viz.
grab sampling, composite sampling and continuous monitoring sampling. However sampling
for ordinary chemical analysis requires no specific methods and precautions other than
collecting it in a clear glass container of good quality having glass stopper. Samples for
bacterial analysis must be collected in a sterilized bottle with stopper. For this study grab-
sampling method was employed and samples were collected in plastic containers with stopper
from 20 cm below the top of the water surface from the sampling point 2,3,4,5, 7 and mid
point of Lakhya River at the sampling point 1, 6, 8 and 9.
Water quality is a value judgment that is related to the intended purpose of the water body
and based on the physical, chemical, and/or biological attributes of the water body. Water
quality may be defined by a single or multiple characteristics. The study requires physico-
chemical characteristics of the effluent discharged from the factories and the river water
quality data of the upstream and downstream side of the discharged point over a certain
period of time. This study is based on the data which was obtained by the test performed at
the Envirorunental Engineering workshop in the Civil Engineering Department, BUET,
Dhaka. For this purpose the tests were performed at June, 2007 to July, 2007.
3.3.1 Selection of Sampling Site
Ideal sampling sites are seldom present. Selection of a sampling site should consider the
following characteristics and the importance of each to the study objectives and how each
may affect the quality of the sampling results, based on study objectives. In locating sampling
stations or points on a river it was necessary to determine a suitable point on the longitudinal
section, taking into consideration the distance from the river bank and the depth, usually
measured from the water sample.
In selecting sampling location the following three criteria was the basic practical
consideration:
32

1. The sampling points were located at points where the measured parameters show a
distinct gradient.
2. It is not the water quality at the sampling point, which is of interest, but that of the
total water body. Sampling points selected was therefore the representative, as far as
possible, of a whole water body.
3. Some practical constraints were considered, for example, river traffic condition or the
access to the sampling station.
The sampling points which were selected in this study were as follows
Sampling point-I: This point is located upstream of the fertilizer factories. Water sample
was collected from this point was unaffected by the effluent of the fertilizer factories (Polash
and Ghorasal).
Sampling point-2: This is the lagoon where effluent discharged from the fertilizer factories
(Polash and Ghorasal) was retained. Ultimately this effluent was discharged into the Lakhya
River through pump and this point is very close to the pump.
Sampling point-~: This is the drain of the Polash urea fertilizer factory. The treated effluent
of this factory was discharged through this drain. The performance of the treatment process
of Pol ash factory was evaluated from this point.
Sampling point-4: The sample in this drain was the combination of treated effluent
discharged from the Polash urea fertilizer factory, untreated effluent discharged from Lagoon
and household effluent discharged from residential area of the fertilizer factories. This drain
discharged effluent into the Lakhya River.
Sampling point-5: Untreated effluent of Ghorasal Urea Fertilizer Factory was discharged
through this point.
Sampling point-6: This point is IOOOmdownstream from the sampling point-I. The water
samples at this point were affected by the untreated effluent of Ghorasal Urea Fertilizer
Factory.
Sampling point-7: This is the drain of the Ghorasal urea fertilizer factory. The treated
effluent of this factory was discharged through this drain. This drain discharged effluent into
the Lakhya River. The perfonnance of the treatment process of Ghorasal factory was
evaluated from this point.
Sampling point-8: This point is 538m downstream from the sampling point-6. The water
samples of this point were totally affected by both the fertilizer factories (Polash and
33

Ghorasal). Combined effects of effluent from both the factories on the Lakhya were evaluated
from investigation at this point.
Sampling point-9: This point is 514m downstream from the sampling point-So The water
samples of this point were also totally affected by both the fertilizer factories (Polash and
Ghorasal). This point was necessary to evaluate the impact of effluent from fertilizer factories
along the length of the river.
Polash and Ghorasal urea fertilizer factories are situated on the left bank and there are
residential areas on the right bank ofthe Lakhya River
Wastewater sampling and flow measurements were carried out at nine points (Table-I).
Table-I: Detail of wastewater sampling and flow measurement locations
Wastewater Number of samples Number of flowsampling Sampling Position were taken (one measurements werestation point sample/week) taken (one
measurement/week)Polash. 1 N-23° 59' 48.06" 5 Secondary source
E-90' 38' 16.12" (IWM)Polash 2 N-23' 59' 22.2" 5 5
E-90' 38' 52"Pol ash 3 N-23' 59' 12" 5 5
E-90' 38' 27.05"Polash 4 N-23' 59' 8.9" 5 5
E-90' 38' 32.8"Pol ash 5 N-23' 59' 22.2" 5 5
E-90' 38' 13.8"Pol ash 6 N-23' 59' 19.68" 5 Secondary source
E-90' 38' 8.33" (IWM)Polash 7 N-23' 59' 16.6" 5 5
E-90' 38' 13.2"Polash 8 N-23' 59' 3.35" 5 Secondary source
. E-90' 38' 1.95" (IWM)
Pol ash 9 N-23' 58' 47.83" 5 Secondary sourceE-90' 37' 56.67" (IWM)
Total 45 nos.
Comprehensive water quality sampling and flow measurement were carried out at several
stations in the Lakhya River system. Waste water sampling was also carried out at Polash and
Ghorasal Urea Fertilizer Factories. Locations of water/waste water quality sampling and
discharge measurement stations are shown in Figure-3.1
34

Figure 3.1: Sampling point locations
35
~
N
I'v* Rowdirection. shp• sample point.shpN Drainshp.shp/\jLakhya_riYer.shpfndustry -9horasa1.shp
Ghorasal Urea Fertilizer Factoryo Lagoono Polash Urea Fertilizer Factory
o 500 Meters~

Photograph 3.1: Untreated effiuent dischargedin to the Lagoon through this drain
Photograph 3.2: Untreated effl~ent from Polash andGhorasal urea fertilizer factories combined at this
point
Photograph 3.3: Sampling point-2 (Lagoon)
Photograph 3.5: Effluent discharged fromLagoon through these pump
36
Photograph 3.4: Sampling point-2 (Lagoon)
Photograph 3.6: Effiuent discharged fromLagoon through this drain
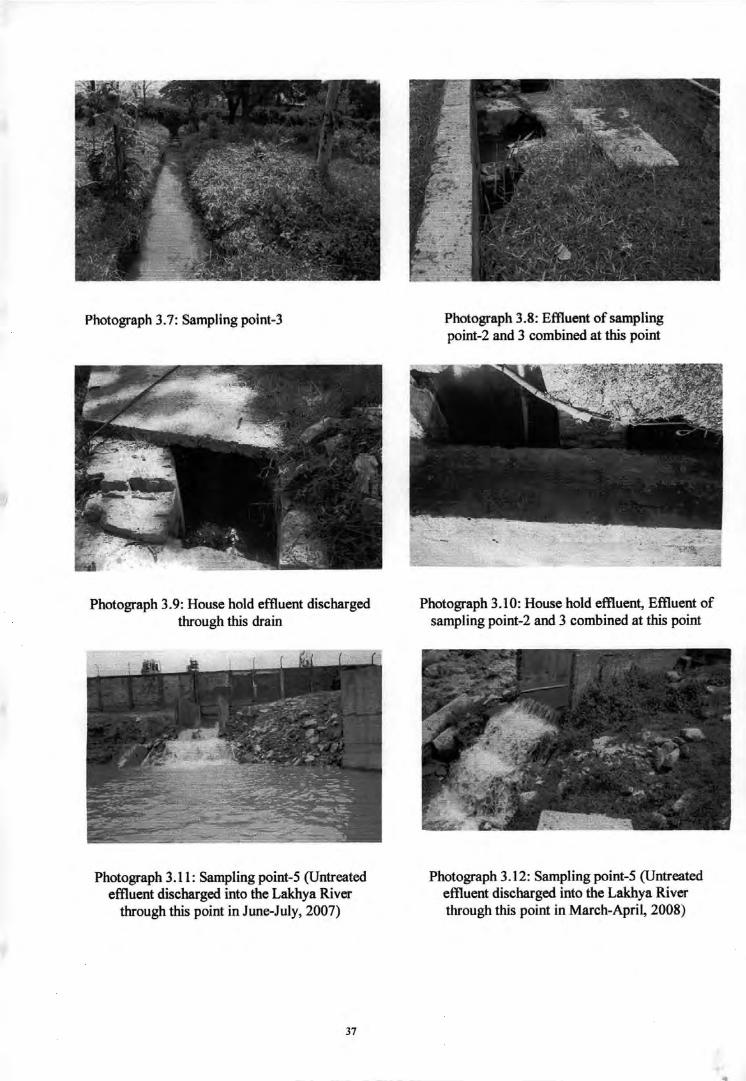
Photograph 3.7: Sampling point-3
Photograph 3.9: House hold effluent dischargedthrough this drain
Photograph 3.11: Sampling point-5 (Untreatedeffluent discharged into the Lakhya Riverthrough this point in June-July, 2007)
37
Photograph 3.8: Effluent of samplingpoint-2 and 3 combined at this point
Photograph 3.10: House hold effluent, Effluent ofsampling point-2 and 3 combined at this point
Photograph 3.12: Sampling point-5 (Untreatedeffluent discharged into the Lakhya Riverthrough this point in March-April, 2008)

Photograph 3.13: Sampling point-7
Photograph 3.15: Water quality sampling at theLakhya River
38
Photograph 3.14: Measurement of pH, DO,Temperature at the sampling site
Photograph 3.16: Removing air bubble fromwater quality sampling at the Lakhya River

3.3.2 Water and wastewater sampling
The positions of Dissolved Oxygen (DO) measurement and Water quality (WQ) sample
collection were determined with the aid of a hand-held GPS. The depths of the rivers at each
of the sections were measured by means of weight, rope and measuring tape. The weight
were attached to the end of the rope and lowered at the particular section till it hit the
riverbed. Pumped .river water was collected in a metallic cylinder and the sampling bottle was
subsequently immersed to remove air bubbles. Once the sampling bottle was filled up with
the river water, it was sealed and preserved in an icebox.
3.3.2 Discharge measurements
Discharge measurements were carried out at Polash and Ghorasal Urea Fertilizer Factories. It
were carried out at sampling point 2, 3, 4, 5, 7 by float velocity method and at sampling point
1,6,8,9 of Lakhya River from Institute of Water Modelling.
3.4 Analyses of samples
Wastewater samples were tested at the Environmental Engineering workshop of Bangladesh
University of Engineering and Technology (BUET) for analyses of Total Ammonia (NH3-N
and NH4-N), BODs, COD, TS, TSS, and TDS. Temperature, pH and DO were tested and
flow measured on the site. The impact of fertilizer factories on the Lakhya River were
evaluated by the analyses of water sample of sampling point 1, 6, 8 and 9. The amounts of
waste discharged from the factories were evaluated by the analyses of wastewater sample and
discharge measurement of sampling point 2,3,4,5 and 7.
Table 3.1 Parameters tested for different wastewater samples
Parameters tested
Samplingpoint NH4-N NH3-N pH Temp DO BODs COD TS TSS TDS
1 x x x x x x x x x x2 x x x x x x x x x x3 x x x x x x .x x x x4 x x x x x x x x x x5 x x x x x x x x x x6 x x x x x x x x x x7 x x x x x x x x x x8 x x x x x x x x x x9 x x x x x x x x x x
39
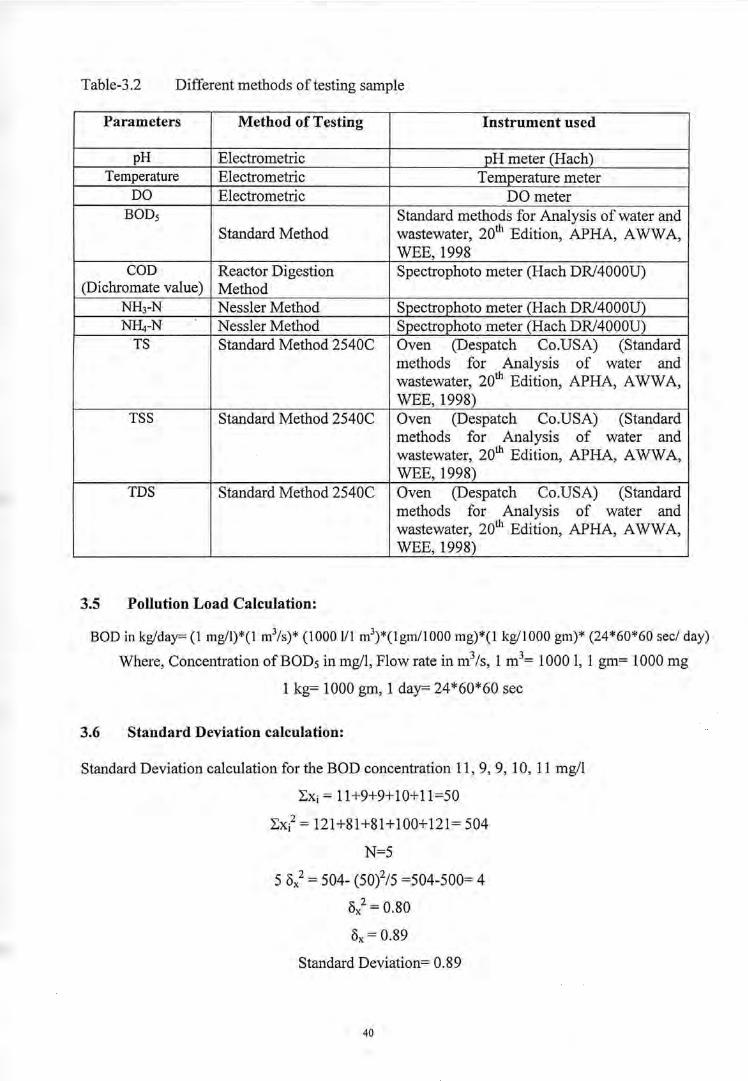
Table-3.2 Different methods of testing sample
Parameters Method of Testing Instrument used
pH Electrometric pH meter (Hach)Temperature Electrometric Temperature meter
DO Electrometric DO meterBODs Standard methods for Analysis of water and
Standard Method wastewater, 20th Edition, APHA, AWWA,WEE, 1998
COD Reactor Digestion Spectrophoto meter (Hach DR/4000U)(Dichromate value) Method
NH3-N Nessler Method Spectrophoto meter (Hach DR/4000U)NH4-N Nessler Method Spectrophoto meter (Hach DR/4000U)TS Standard Method 2540C Oven (Despatch Co.USA) (Standard
methods for Analysis of water andwastewater, 20th Edition, APHA, AWWA,WEE, 1998)
TSS Standard Method 2540C Oven (Despatch Co.USA) (Standardmethods for Analysis of water andwastewater, 20th Edition, APHA, AWWA,WEE, 1998)
TDS Standard Method 2540C Oven (Despatch Co.USA) (Standardmethods for Analysis of water andwastewater, 20th Edition, APHA, AWWA,WEE, 1998)
3.5 Pollution Load Calculation:
BOD in kg/day= (1 mg/l)*(l m3/s)* (1000 III m3)*(lgmIl000 mg)*(l kg/lOOOgm)* (24*60*60 sec/ day)
Where, Concentration of BODs in mg/I, Flow rate in m3/s, 1 m3= 1000 I, 1 gm= 1000 mg
1 kg= 1000 gm, 1 day= 24*60*60 sec
3.6 Standard Deviation calculation:
Standard Deviation calculation for the BOD concentration 11, 9, 9, 10, II mg/I
~Xi = 11+9+9+ 10+11=50
~x? = 121+81+81+100+121= 504
N=5
5 0/ = 504- (50)2/5 =504-500= 4
0/ = 0.80Ox = 0.89
Standard Deviation= 0.89
40
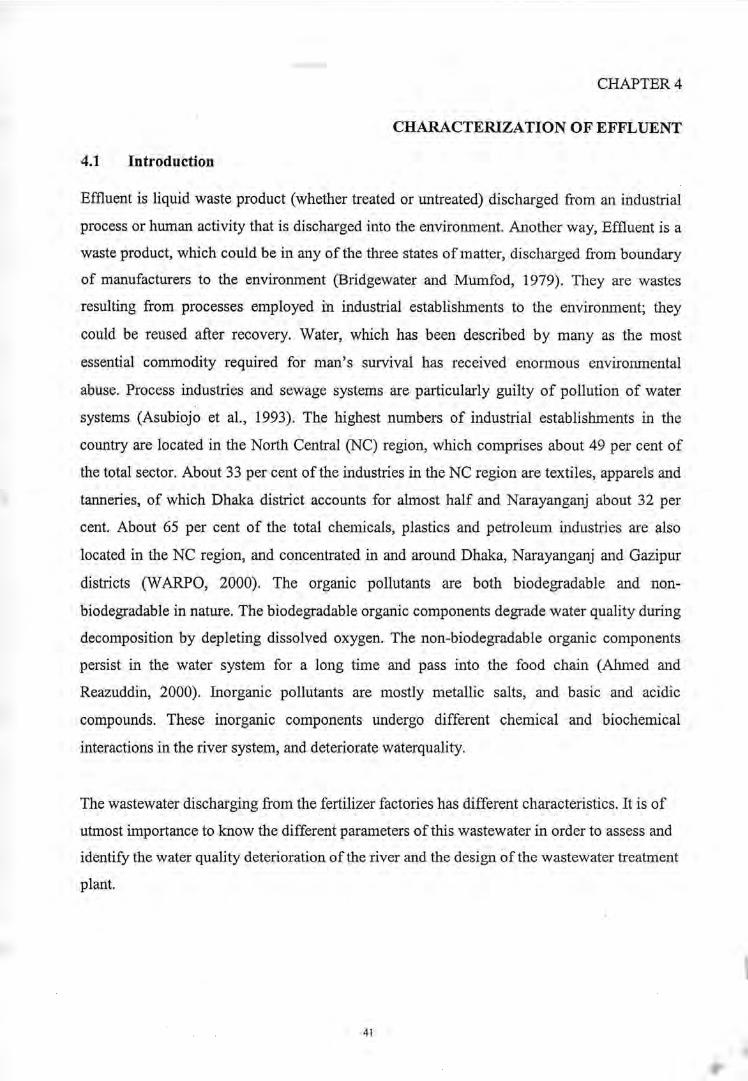
CHAPTER 4
CHARACTERIZATION OF EFFLUENT
4.1 Introduction
Effluent is liquid waste product (whether treated or untreated) discharged from an industrial
process or human activity that is discharged into the environment. Another way, Effluent is a
waste product, which could be in any of the three states of matter, discharged from boundary
of manufacturers to the environment (Bridgewater and Mumfod, 1979). They are wastes
resulting from processes employed in industrial establishments to the environment; they
could be reused after recovery. Water, which has been described by many as the most
essential commodity required for man's survival has received enormous envirorunental
abuse. Process industries and sewage systems are particularly guilty of pollution of water
systems (Asubiojo et a!., 1993). The highest numbers of industrial establishments in the
country are located in the North Central (NC) region, which comprises about 49 per cent of
the total sector. About 33 per cent of the industries in the NC region are textiles, apparels and
tanneries, of which Dhaka district accounts for almost half and Narayanganj about 32 per
cent. About 65 per cent of the total chemicals, plastics and petroleum industries are also
located in the NC region, and concentrated in and around Dhaka, Narayanganj and Gazipur
districts (WARPO, 2000). The organic pollutants are both biodegradable and non-
biodegradable in nature. The biodegradable organic components degrade water quality during
decomposition by depleting dissolved oxygen. The non-biodegradable organic components
persist in the water system for a long time and pass into the food chain (Ahmed and
Reazuddin, 2000). Inorganic pollutants are mostly metallic salts, and basic and acidic
compounds. These inorganic components undergo different chemical and biochemical
interactions in the river system, and deteriorate waterquality.
The wastewater discharging from the fertilizer factories has different characteristics. It is of
utmost importance to know the different parameters of this wastewater in order to assess and
identify the water quality deterioration of the river and the design of the wastewater treatment
plant.
41

4.2 Wastewater Quality Analysis
As the study area were fertilizer factories, the effluent parameters analyzed were pH,
Biochemical Oxygen Demand (BOD5), Chemical Oxygen Demand (COD), Dissolved
Oxygen (DO), Total Ammonia (NH3-N), Ammonia as nitrogen (NH3-N), Ammonium as
Nitrogen (NH4-N), Temperatute, Total Solids (TS), Total Suspended Solids(TSS), Total
Dissolved Solids(TDS).
The Detailed Chacterization of effluent from fertilizer factories are as follows
The values of effluent parameters shows in range and mean values (means :t Standard
Deviation) are in parentheses.
4.2.1 Biochemical Oxygen Demand (BOD)
The level of BOD5 of effluent from Polash and Ghorasal Urea Fertilizer Factories are shown
in Figure 4.1 and Table A4.1. The levels of Biochemical Oxygen Demand (BOD5) were 43-
60 mg/l (5015.76 'mg/l) in the effluent from sampling point-2, 24-46 mg/l (32.2018.08 mg/l)
in the effluent from sampling point-3, 120-148 mg/l (135.2019.83 mg/l) in the effluent from
sampling point-4, 21-31 mg/l (28.2013.66 mg/l) in the effluent from sampling point-5, 19-53
mg/l (36.80111 mg/l) in the effluent from sampling point-7. According to the Bangladesh
standard, BOD5 should be within 50mg/1 before discharging into inland water. BOD5 were
found lower than the effluent standard limit at the sampling point-2, 3, 5, and 7. But in the
sampling point-4, BOD5 were found higher than the standard limit. The samples in this drain
were the combination of treated effluent discharged from the Polash urea fertilizer factory,
treated effluent discharged from Lagoon and house hold waste discharged from the
residendial area of fertilizer factories. Due to the household waste BOD5 were high at this
point. This drain discharged effluent into the Lakhya River. So BOD5 is a concern of the
effluent from sampling point-4 which is discharging into the Lakhya River.
42
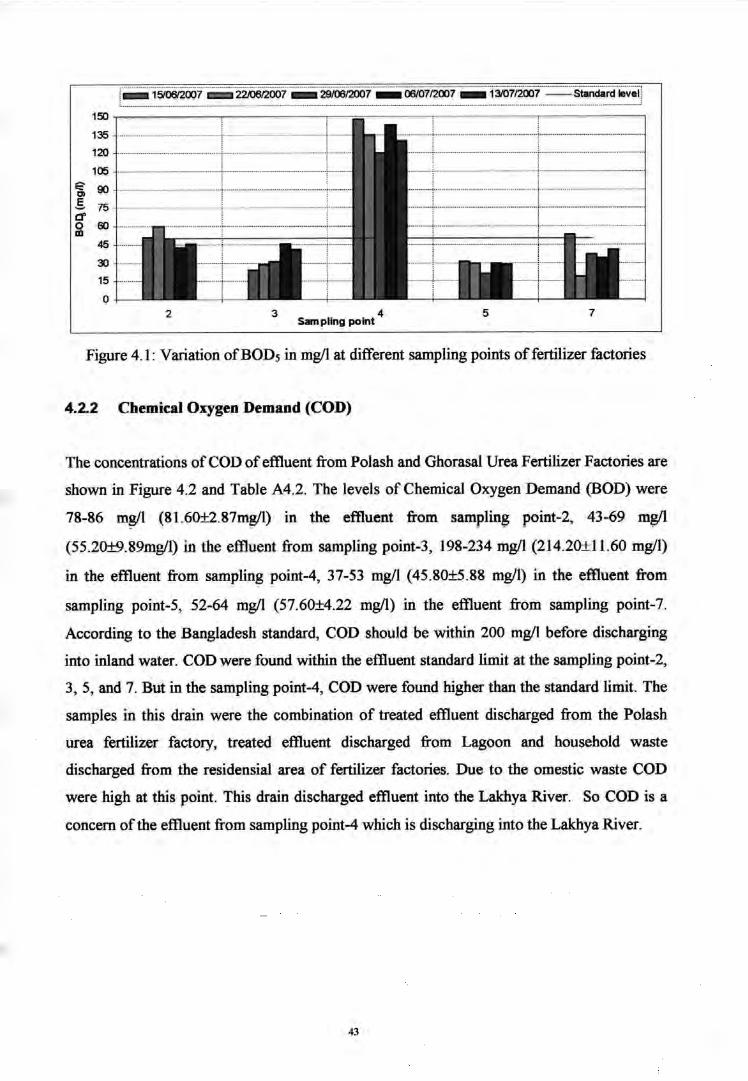
........
150135120105
'a 90oS 75Cf0 60m
45
30150
2 3 4Sampling point
5 7
Figure 4.1: Variation ofBODj in mg/l at different sampling points offertilizer factories
4.2.2 Chemical Oxygen Demand (COD)
The concentrations of COD of effluent from Polash and Ghorasal Urea Fertilizer Factories are
shown in Figure 4.2 and Table A4.2. The levels of Chemical Oxygen Demand (BOD) were
78-86 mwl (81.60:t2.87mWI) in the effluent from sampling point-2, 43-69 mg/I
(55.20:t9.89mg/l) in the effluent from sampling point-3, 198-234 mg/I (214.20:t11.60 mg/I)
in the effluent from sampling point-4, 37-53 mg/I (45.80:t5.88 mg/I) in the effluent from
sampling point-5, 52-64 mg/I (57.60:t4.22 mg/I) in the effluent from sampling point-7.
According to the Bangladesh standard, COD should be within 200 mg/I before discharging
into inland water. COD were found within the effluent standard limit at the sampling point-2,
3, 5, and 7. But in the sampling point-4, COD were found higher than the standard limit. The
samples in this drain were the combination of treated effluent discharged from the Polash
urea fertilizer factory, treated effluent discharged from Lagoon and household waste
discharged from the residensial area of fertilizer factories. Due to the omestic waste COD
were high at this point. This drain discharged effluent into the Lakhya River. So COD is a
concern of the effluent from sampling point-4 which is discharging into the Lakhya River.
43

= 1510612007= 22/0612007 _ 29/0612007 _ 06/0712007 ••• 13/0712007 --Standard level
240
210
180
'2150Cl
5.120000 90
60
30
02 3
Sampling point4 5 7
Figure 4.2: Variation ofeOD in mg/l at different sampling points offertilizer factories
4.2.3 Dissolved Oxygen (DO)
The level of DO of effluent from Po lash and Ghorasal Urea Fertilizer Factories are shO\vn in
Figure 4.3 and Table A4.3. The levels of Dissolved Oxygen (DO) were 0.65-0.78 mg/l
(0.728:tO.047mg/l) in the effiuent from sampling point-2, 2.86-2.96 mg/l (2.898:tO.037mg/l)
in the effluent from sampling point-3, 2.81-2.91 mg/l (2.858:tO.040mg/l) in the effiuent from
sampling point-4, 2.64-2.89 mg/l (2.734:t0.085mg/l) in the effiuent from sampling point-5,
2.8-3 mg/l (2.896:t0.065mg/l) in the effiuent from sampling point-7. According to the
Bangladesh standard, DO should be 4.5-8 mg/l before discharging into inland water. DO were
found below the effiuent standard limit at the sampling point-2, 3, 4, 5 and 7. So these DO
levels indicate the poor quality effiuent discharge from the fertilizer factories.
i-c::::::i-i5loo'2ooY-c:::::i"22166iiooi-"iiiiiiiIii-29iOOi2ooY"'iiiiiiiiiiiioo,u712oo1'-iiiiiiiiiiiii"1-3;Qii2oor==siandardlE;vel....... _ ....•. _ -._ - _ -. _. .....................•. _...... . _ _. .......•....... _ - ............•.•......• . .
9
8 .
7
6
C> 5E04o
3
2
o2 3 4
Sampling point5 7
Figure 4.3: Variation of DO in mg/l at different sampling points offertilizer factories
44

4.2.4 pH
The value of pH of effluent from Polash and Ghorasal Urea Fertilizer Factories are shown in
Figue 4.4 and Table A4.4. The levels of pH were 8.4-8.9 mg/l (8.52:tO.19mg/l) in the
effluent from sampling point-2, 8.2-8.5 mg/l (8.34:t0.l0mg/l) in the effluent from sampling
point-3, 8.8-9.3 mg/l (9.04:tO.19mg/l) in the effluent from sampling point-4, 9.2-9.8 mg/l
(9.58:tO.21rng/l) in the effluent from sampling point-5, 8.2-8.8 mg/l (8.56:tO.23mg/l) in the
effiuent from sampling point-7. In the sampling point-2, 3, 4, 5 and 7 the value of pH is
greater than 7 which means the effiuent quality is alkaline. According to the Bangladesh
standard, pH should be 6-9 before discharging into inland water. pH were found below the
effiuent standard limit in the sampling point-2, 3, and 7. But the value of pH in the sampling
point 4 and 5 is greater than the standard limit.••••••••••••••••••••••• _ •••••••••• _ •••••••••••••• --_ .•••••••••• _ ••••• _......... • •••••• __._-_._ ••• __ ••••••• _ •••• _ •••••••••• - ••••• _ •••••••••••••• _ •• _ •••••• _ •••••••••••••• _....... • •••••••••••••••• _ •• -- •• 1
!= 15/0612007 = 'Z2I06f2oo7 _ 2910612007 _ 0610712007 _ 1310712007 - Standard level;10 L..._....._•..••••••.••....•.•_.......... .......•..•.._............ ........•.•..•_•••.•••..•...•_..•..................._..•.••.._............. ...•...•..•...•
9
8
7
6:I: 5Q.
4
3
2
1
02 3 4 5 7
Sampling point
Figure 4.4: Variation of pH at different sampling points of fertilizer factories
4.2.5 Temperature
The value of Temperature of effluent from Polash and Ghorasal Urea Fertilizer Factories are
shown in Figure 4.5 and Table A4.5. The value of Temperature were 30.4-31 °c
(30.60:t0.38°C) in the effiuent from sampling point-2, 33-36 °c (34.32:tO.98°C) in the effluent
from sampling point-3, 31-34.iC (32.64:t1.21°C) in the effiuent from sampling point-4, 42-
46.5°C (45.20:t1.69°C) in the effiuent from sampling point-5, 38-38.6°C (38.20:tO.25°C) in the
effiuent from sampling point-7. According to the Bangladesh standard, Temperature should
be within 40°C (summer) or 45°C (winter) before discharging into inland water. Temperature
was found near or within the effiuent standard limit in the sampling point-2, 3, 4, and 7. But
45

in the sampling point-5, Temperature was found higher than the standard limit. The effluent
discharging directly into the river from this point is untreated and held maximum
temperature. So Temperature is a concern of the effiuent from sampling point-5 which is
discharging into the Lakhya River
=1510612007 = 22/0612007 _ 29/0612007 _ 0610712007 _ 13/0712007 --Standard level
50
45
40
V35
~30
.a 25l!!~20E~ 15
10 .
5
o2 3 Sampiing point 4 5 7
Figure 4.5: Variation of Temperature in °C at different sampling points of fertilizer factories
4.2.6 Total Ammonia (NHJ-N+ NH4-N)
The concentration of Total Ammonia of effiuent from Polash and Ghorasal Urea Fertilizer
Factories are shown in Figure 4.6 and Table A4.6. The concentrations of Total Ammonia
were 685-697.5 m~1 (691.9O:t4.29mg/1) in the effiuent from sampling point-2, 85-120 mg/I
(104.40I13.29mg/l) in the effiuent from sampling point-3, 434-460 mg/I (444.40:t9.4lmg/l)
in the effiuent from sampling point-4, 997.5-1230 mg/l (l098.50:!:79.27mg/l) in the effiuent
from sampling point-5, 95-147 mg/l (125.70:!:16.99mg/l) in the effiuent from sampling point-
7. According to the Bangladesh standard, Total Ammonia should be within 50 mg/l before
discharging into inland water. Total Ammonia was found higher than the effiuent standard
limit in the sampling point-2, 3, 4, 5, and 7. Treated effiuent of Polash and Ghorasal Urea
Fertilizer Factories were discharged by the sampling point-3 and 7 respectively. But the
concentration of Total Ammonia is very high than the standard limit. So it can be mentioned
that proper effiuent treatment process were not maintained. On the other hand untreated
effiuent discharged into the lagoon in one side and it discharged by the other side into the
Lakhya River. For this, retension period is less than required, hence high values of ammonia
were found. In the sampling point-4, household effiuent were added hence the total amount of
Ammonia were higher than the amount discharged from sampling point-2 and 3. Untreated
46

effluent was discharged directly into the Lakhya River from sampling point-5. Discharging
effluent this point contains high concentration of Ammonia which was very much vulnerable
to the environment. So Total Ammonia is a serious concern of the effluent from all sampling
point which is discharging into the Lakhya River.
= 15/0612007 = 22106/2007 __ 29i0612OO7 _ 0610712007 _ 13/0712007 --Standard level
1400
1200
C, 1000.S-.!!! 800c:0E
800E«~ 4000I-
200
02 3
Sampling point4 5 7
Figure 4.6: Variation of Total Ammonia at different sampling points of fertilizer factories
4.2.7 Ammonia as Nitrogen (NHJ-N)
The concentration of NH3-N (Ammonia as Nitrogen) of effluent from Polash and Ghorasal
Urea Fertilizer Factories are shown in Figure 4.7 and Table A4.7. The concentrations of
Ammonia as Nitrogen (NH3-N) were 83.09-211.95 mg/I (l13.09:t49.94mg/l) in the effluent
from sampling point-2, 8.4-17.03 mg/I (l1.58:t3.54mg/l) in the effluent from sampling point-
3, 112.77-235.35 mg/I (170.03:t47.20 mg/I) in the effluent from sampling point-4, 464.35-
954.67 mg/I (740.72:t260.27mg/l) in the effluent from sampling point-5, 7.61-37.85 mg/I
(23.53:t11.19 mg/I) in the effluent from sampling point-7. According to the Bangladesh
standard, NH3-N should be within 5 mg/I before discharging into inland water. NH3-N
(Ammonia as Nitrogen) was found higher than the effluent standard limit in the sampling
point-2, 3, 4, 5, and 7. Treated effluent of Po lash and Ghorasal Urea Fertilizer Factories were
discharged by the sampling point-3 and 7 respectively. But the concentration of Ammonia
(NH3-N) is very high than the standard limit. So it can be mentioned that proper effluent
treatment process were not maintained. So NH3-N (Ammonia as Nitrogen) is a serious
concern ofthe effluent from all sampling point that is discharging into the Lakhya River.
47

= 1510612007= 22/0612007 _ 29/06/2007 _ 06/07/2007 _ 13107/2007 --Standard level
1000
900
BOO700 .
C,g 600 .
~ 500c~ 400
~ 300200
100
o2 3 Sampling point 4 5 7
Figure 4.7: Variation ofNH3-N in mg/l at different sampling points offertilizer factories
4.2.8 Ammonium as Nitrogen (NH4-N)
The concentration ofN~-N (Ammonium as Nitrogen) of effluent from Polash and Ghorasal
Urea Fertilizer Factories are shown in Figure 4.8 and Table A4.8. The concentrations of
Ammonium as Nitrogen (N~-N) were 485.55-610.7 mg/l (578.8l:t47.30 mg/I) in the
effluent from sampling point-2, 76.6-105.44 mg/l (92.82:1:10.82 mg/I) in the effluent from
sampling point-3, 214.65-325.23 mg/1 (274.36:1:39.56 mg/I) in the effluent from sampling
point-4, 275.33-533.14 mg/l (357.78:1:100.72 mg/l) in the effluent from sampling point-5,
87.39-110.28 mg/I (102.16:1:8.86 mg/I) in the effluent from sampling point-7. According to
the Bangladesh standard, N~-N should be within 50 mg/I before discharging into inland
water. NH4-N was found higher than the effluent standard limit in the sampling point-2, 3,4,
5, and 7. Treated effluent of Polash and Ghorasal Urea Fertilizer Factories were discharged
by the sampling point-3 and 7 respectively. But the concentration ofN~-N is very high than
the standard limit. So it can be mentioned that proper effluent treatment process were not
maintained. So N~-N (Ammonium as Nitrogen) is a serious concern of the effluent from all
sampling point which is discharging into the Lakhya River.
48

= 1510612007= 2210612007 _ 2910612007 _ 06107/2007 _1310712007 --Standard level
700
600
=- 500C,EE 400::J'g 300 ...E.i 200
100
o2 3 Sampling point 4 5 7
Figure 4.8: Variation ofNHt-N in mg/I at different sampling points offertilizer factories
4.2.9 Total Solids (TS)
The concentrations of Total Solids (TS) of effluent from Polash and Ghorasal Urea Fertilizer
Factories are shown in Figure 4.9 and Table A4.9. The concentrations of Total Solids (TS)
were 112-183 mg/I (147I26.13mg/l) in the effluent from sampling point-2, 45-90 mg/I
(69.20:!:14.54mg/l) in the effluent from sampling point-3, 154-247 mg/I (2IOAO:!:45A7mg/l)
in the effluent from sampling point-4, 215-274 mg/I (236.60I21.23mg/l) in the effluent from
sampling point-5, 389-459 mg/I (448:!:47.57mg/l) in the effluent from sampling point-7.
According to the Bangladesh standard, TS should be within 2100 mg/l before discharging
into inland water. TS were found lower than the effluent standard limit in the sampling point-
2, 3, 4, 5 and 7. So the concentration of TS is not a concern of the effluent which is
discharging into the Lakhya River.
= 1510612007= 2210612007 _ 2910612007 _ 0610712007 _1310712007 --Standard level
2400
2100
.............................................•.................................. ;••.•.
300 .
o
..j , .
..................•...........•....•.••.•.••.•••..••.••.••••. 1••••••••• _ ••••••••••••••••••••• _ ••••••••••..•.•....
.......__._.__.-!.__.._._ ..__ __ _._.- .._._-_ __ _-_. __ 1.---..- .._ _ __ -._..- _ .
;..__+ _ .
...............................................__.t ..__ .
..._.._ _ _._ _.._ _... "'---f---'=- 1800C,g 1500
••] 1200o
III(ij 900'0I- 600
2 3sampling point
4 5 7
Figure 4.9: Variation of Total Solids at different sampling points offertilizer factories
49
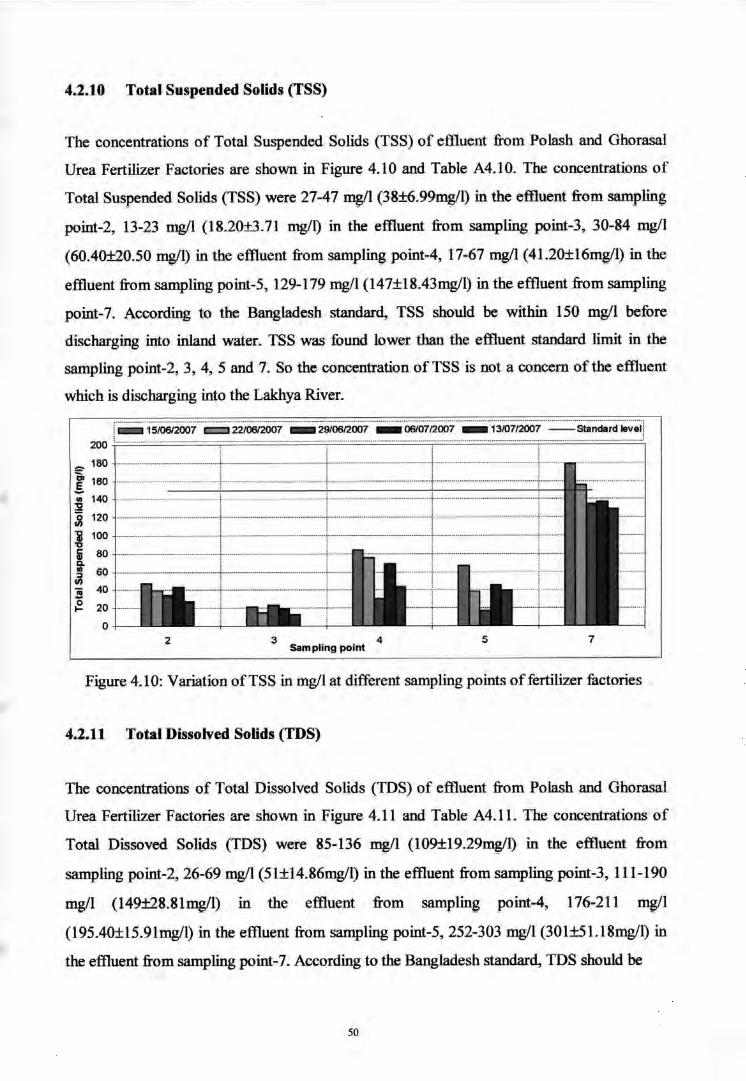
4.2.10 Total Suspended Solids (TSS)
The concentrations of Total Suspended Solids (TSS) of eftluent from Polash and Ghorasal
Urea Fertilizer Factories are shown in Figure 4.10 and Table A4.10. The concentrations of
Total Suspended Solids (TSS) were 27-47 mg/l (38:t6.99mgil) in the eftluent from sampling
point-2, 13-23 mg/I (18.20B.71 mg/I) in the eftluent from sampling point-3, 30-84 mg/I
(60.40:t20.50 mg/l) in the eftluent from sampling point-4, 17-67 mg/I (41.20:t16mg/l) in the
eftluent from sampling point-5, 129-179 mg/I (l47:t18.43mg/l) in the effluent from sampling
point-7. According to the Bangladesh standard, TSS should be within 150 mg/I before
discharging into inland water. TSS was found lower than the eftluent standard limit in the
sampling point-2, 3, 4, 5 and 7. So the concentration ofTSS is not a concern of the eftluent
which is discharging into the Lakhya River.
c:::J 15/0612007 c:::J 22/0612007 _ 29/0612007 _ 0610712007 _ 13107/2007 -Standard
200
""" 180C> 160g•• 140:2~ 120
"il 100"C
5i 80Co~ 60IIIiii 40
~ 20
o2 3 4
Samplingpoint5 7
Figure 4.10: Variation ofTSS in mg/I at different sampling points offertilizer fuctories
4.2.11 Total Dissolved Solids (TDS)
The concentrations of Total Dissolved Solids (TDS) of eftluent from Polash and Ghorasal
Urea Fertilizer Factories are shown in Figure 4.11 and Table A4.11. The concentrations of
Total Dissoved Solids (TDS) were 85-136 mg/I (l09:t19.29mg/l) in the eftluent from
sampling point-2, 26-69 mg/I (5 HI4.86mg/l) in the eftluent from sampling point-3, 111-190
mg/l (149:t28.81mg/l) in the eftluent from sampling point-4, 176-211 m~/l
(195.40:t15.91mg/l) in the eftluent from sampling point-5, 252-303 mg/I (30I:t51.l8mg/l) in
the eftluent from sampling point-7. According to the Bangladesh standard, TDS should be
50

within 2100 mg/I before discharging into inland water. TDS was found below the effluent
standard limit in the sampling point-2, 3, 4, 5 and 7. So the concentration of TDS is not a
concern of the effiuent discharging into the Lakhya River.~ . . _. . ._. .__ .__ _.._ _ _ __..__. _ .•._ __.__.__._ __..__ ..__ _. ---- -- - ..--.- ..---- -- ---- ----------""f
15/0612007 E::::'322/06l2oo7 _ 29/0612007 _ 0610712007 _13/07/2007 --Standard level---_ _----_._-_._---;
,, ...................._-- .
.........- -.- ..- -f.. . -- ---
. _ _.--_ _ _ .._._ .._ •.....,. --_. __ .- ..............••• _ .._ _.,...__ ....................••. .:. .
,. j ..••••••.-
.....................••••.•...... _ +..•......•
........................... -.•..
_._--_ _ .._.-_._-----_._.~--_ __ ..-.--_ ..-_ _ _ -~ -_._--_._ _ _ .......•.•.•.. _._---
........ - •.•..- ••.---.- - -r .•.- ..•••- .. -.. -- - - •.... ~- - -.- .. - ---.- .
_ --.-_ _.._.__..+- .
... _._ _ __ .. _--_ _ + _.... -_ _ _ .. _ _... ._ .. _._j. __. . _ ••• _ •••_._ .•. _.... . ......••••••••.•. _.__. __._.. _._._ - .•.• _-~ ••••••• -.- .. _...............••.••• _ ••__ ••• _•••..
...-------.--.-- ..----.-+--- --.-- ------..----.f- --.------ --- --- -1 --- - --- ---------- ---~ -- .. _-----_._---_ .. -._ __ - -
... ----'1._ •••••-.------- __.. _-_.__.. __ ••••••.••.• -
2200
2000
'a, 1800
.5- 1800••:2 1400
~ 1200al 1000.2:0 800••••0 800S 400{:.
200
02 3 Sampling point 4 5 7
Figure 4.11: Variation ofTDS in mg/I at different sampling points of fertilizer factories
51

CHAPTERS
ESTIMATION OF WATER POLLUTION LOAD
5.1 Introduction
Unplaned growth of industries and lack of treatment facilities of industrial waste water is the
primary cause of water pollution in Bangladesh. Water pollution disturbs the normal uses of
water for irrigation, agriculture, industry, public water supply and aquatic life. Prevention of
water pollution is not only important from the viewpoint of public health, but also from the
viewpoint of aesthetics, conservation and preservation of natural resources. In Bangladesh,
pollution of surface water bodies from industrial effluents is a major concern. Here majority
of the industrial wastes is discharged into surface water bodies without any kind of treatment.
According to the study (BKH, 1995), an estimated 32 million kilogram of BOD are
discharged into the environment annually, most of which end up in the surface water bodies
around the industrial locations. While this figure is quite alarming it must be recognized that
the number of industrial units and industrial production have increased significantly since
these estimates were made; and the present estimates of wastewater flow and waste load are
expected to be significantly higher.
5.2 Estimation of Effluent flow rate Discharged from Fertilizer Factories
The measurements of effluent flow rate from sampling point-2, 3, 4, 5 and 7 were 0.125-0.15
m3/s (0.137:1:0.009), 0.0262-0.0266 m3/s' (0.026:1:0.000), 0.211-0.249 m3/s (0.023:1:0.013),
0.08-0.13 m3/s (0.092:tO.019) and 0.065-0.071 m3/s (0.068:1:0.003) respectively. The flow
measurement are shown in Figure 5.1 and Table A5.1
, ==Sailliiingpoiiit:2 ==Saillilng.point:3 ==.sailliiing.poiiit:4"-- SaJll)ling point-5 -- SaJll)fing point- 7
0.25.__ .._--_._----_.- _._ _.. . _ _ " _ .."..
¥- 0.20.s.S!0.15l!!~~ 0.10;:OJ::lE 0.05w
==:::=::::::::::::::':::::::=..J::.., ==. ===='===i=.=:::::::.= ===f'..=:::::::===. ==---m:~mmmmmmmm.mmmmmnm+mm.n .. m..... n.nn. nmnmmmm'mmmmmmnmm.mmmmnnmmmm;
13/0712007061071200729/0612007Date22J0612oo7
0.00+--------+--------j---------+---------i---.l
1510612007
Figure 5.1 Variation of effluent flow rate at different sampling point offertilizer factories
52

5.3 Estimation of Water Pollution Load Discharged from Different Sampling Pointsof Fertilizer Factories
5.3.1 Sampling point-4
Two kinds of effluents were discharged from this point. One is industrial effluent comes from
Polash and Ghorasal Urea Fertilizer factories and another is domestic effluent comes from
residential area. Pollution load (Industrial and Residential) were discharged from sampling
point-4 are shown in Table A5.2 and A5.3. The amount of pollution load discharged from
sampling point-4 into the Lakhya River were, Biochemical Oxygen Demand (BODs) were
2291-2903 kg/day (2683I208.48 kg/day) where as 1659.55-2277.62kg/day (2014.7I207.7
kg/day) discharged from residential area, Chemical Oxygen Demand (COD) were 4124-4286
kg/day (4244:t60.69 kg/day) (Figure-5.2) where as 3036.93-3315 kg/day (3150:t90 kg/day)
discharged from residential area, Total Ammonia were 7911-9681 kg/day (8833:t562.25
kg/day) where as 266.85-688.78 kg/day (404:t154 kg/day) discharged from residential area,
Ammonia as Nitrogen (NH3-N) were 2279.94-5063.22 kg/day ( 3400.89:tl052.68 kg/day),
Ammonium as Nitrogen (NHt-N) were 4617.89-6575.37 kg/day (5432.2l:t725.38 kg/day)
(Figure-5.3), Total Solids (TS) were 2997-5258 kg/day (4164:t865 kg/day) where as 1408.46-
3099 kg/day (227l:t642 kg/day) discharged from residential area, Total Suspended Solids
(TSS) were 572-1536 kg/day (l193:t382.65 kg/day) where as 545.29-1030.45 kg/day
(705:t329 kg/day) discharged from residential area, Total Dissolved Solids (TDS) were 2329-
3857 kg/day (2952:t564 kg/day) (Figure-5.4) where as 1174.11-2261.81 kg/day (l546:t425
kg/day) discharged from residential area. The pollution load discharged from residential area
into the sampling point-4 are shown in Figure 5.5....................................... _-_ .....................••• -•••.•••••••....................... __ ..........................•..••• -,
• COD
4500..
4200
>: 3900'":ECl 3600~"0
'" 3300.S!
" 3000.Q
~ 27000a.
2400 .
2100
15/06/07 22/06107 29106107 Date 06/07/07 13/07/07
Figure 5.2 Variation of BODs and COD in kg/day discharged load of from sampling point-4 into the Lakhya River
53
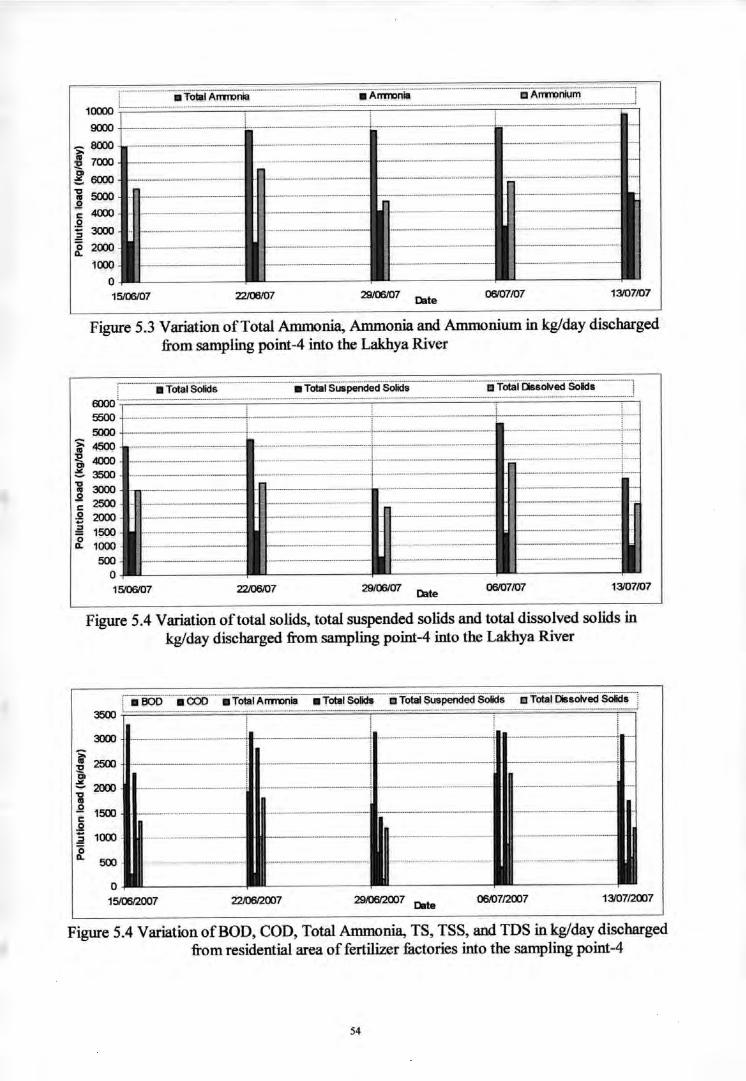
c Arrrronium
3000
2000
1000
o15106107
10000
9lXXl
:;;;8000
~ 7000Cl~ 6000-
"g5OOO.2c: 4000.2~o0..
22100/07 zglOOlO7 Date 06/07107 13107107
Figure 5.3 Variation of Total Ammonia, Ammonia and Ammonium in kg/day dischargedfrom sampling point-4 into the Lakhya River
13107/0706/07107zg/00/07 Date
.....•..•.•..•••.•..................•.•..••••••.•...•....... - _.- .............•.•.••.•... _..... . _ .......••._ .• Total Suspended Solids C Total Dssolved Soids. _ _ _................. .................• ,
22I06I07
........ ......................... ............... _ ......
............................... - ...... ............. -..........- .........•...•....
._---- .......••••.•...•. __ ...._-- ._-_ ............ .._---_ ....................... --_ .... ----_ .............. ....._ .....-..__ ....._--------_ .....__ ••.•.... ..-
...__ .._--- ..__ ...__ .....-_..__ ......__ .... --_ .... .__ ..._ ..•._ ......... _ •• __ ._--- ______ 0 • .......__ ..._-_ ... .....•....• .... --_ .... .._---_ ....... ....... _ .._ .._ ........... ................ __ ......__ .............. ..................•...•... _ ..•.... ..._ .... .... ...................•...•.••... _ .... .............. ...............•.... ...._ ........ ..•.............................. _ ..._._ ......-........................... ............. _ ....... ... ...._ ...... ............. ........ ............•.....
J................. ...... .........•..•....•..•.......
................. ........ .......••_ •••••........ ......... ..•.... ........••. _ .... ..•.... _ .......- ............. _ ......._ .... ...... .••.••............ _ . .......•..._ ..••........... _ .
............._ .............. ............. ....... ..._ ...... - ................ - ...._ .._ . ..... ............... ....._ ......_._ .......... ............. _ .. ......_ ............ __ ......_ ...
• Total Solids6000 '-- --- - -.-.-- ..-..-- -..- - .
55005000
~4500324000~35OO"g3OQ(J~ 2500.2 2000~ 1500;e 1000
500o15'00/07
Figure 5.4 Variation of total solids, total suspended solids and total dissolved solids inkg/day discharged from sampling point-4 into the Lakhya River
iii86o---. CQ6- -.Totai.A-riiTDnia-------iii--Tolaisoiids----ciTolai-sus-pendedSolids "cTola'-DSsoiVed Soiids--'3500 .----------------.--..-------.-------------------------------.---..-- --..- ----..--.--..- -- -.--- ..-..-..- -.--- - - - --- ..------.-----------..---------.---- ..-.--..-.---.-.--- ..)
3000
~ 250032Cl~ 2000-cto.2 1500c:.2~ 1000 .00..
500
01510612007 2210612007 zglO6/2oo7 Dale 0610712007 1310712007
Figure 5.4 Variation of BOD, COD, Total Ammonia, TS, TSS, and TDS in kg/day dischargedfrom residential area of fertilizer factories into the sampling point-4
54

5.3.2 Sampling point-5
Untreated effluent from Ghorasal Urea fertilizer factory was discharged through this point.
Pollution load were discharged from sampling point-5 are shown in Table AS.4. The amount
of pollution load discharged from sampling point-5 into the Lakhya River were Biochemical
Oxygen Demand (BOD5) were 146-348 kg/day (226:t66.26 kg/day), Chemical Oxygen
Demand (COD) were 258-595 kg/day (369:tl18.68 kg/day) (Figure-5.6) , Total Ammonia
(NH3-N) were 7368-11203 kg/day (8624:t1344.34 kg/day), Ammonia as Nitrogen (NH3-N)
were 4975.23-6598.68 kg/day (5643.73:t590.45 kg/day), Ammonium as Nitrogen (Nl-4-N)
were 1903.08-5988.22 kg/day (2980.78:tl541.86 kg/day) (Figure-5.7), Total Solids (TS)
were 1523-3077 kg/day (1908.88:t594.29 kg/day), Total Suspended Solids (TSS) were 118-
752 kg/day (348:t213.03 kg/day), Total Dissolved Solids (TDS) were 1216-2325 kg/day
(1560:t402 kg/day) (Figure-5.8)
•......_ ................•••..•••.•.............. _ .600
......•.000 .. _ ;
500
~ 300.Qc:.9 200~~ 100
o15106107 22100/07 "2!JIOOI07 Date 00/07107 13107/07
Figure 5.6 Variation ofBOD5 and COD in kg/day discharged load of from sampling point-5 into the Lakhya River
• AlTITDniaD Armonium _ .
13/07/0706107/0729/00/07 Date22100/07
,... .....•.......... - ................ _ ..............•.. _ ...- ....................... _ ....._ ....... ....._. ..................... ........._ •.....
..._ ......•.. _ ..•_ .. .. .........._ ..•..._ .._ .. ...__ ......_ ..._ ....._ ...•. .............. _ ..._ .. ......_.- ....._._ ...- ...._. ..._ .._ ......_ ... .... ......... ._............. _._ ..... ......._._ .. --....•.•.....•.............. ............. ..............- .............- .......... _ ......- ............- .......... ............_. .__ .............•.......• _._ ..... .- _ .._ .._ .....__ .
-_ ....... ......................... ._.... ........•.. ........................•. ..._ .... ._..._ ...._ ..... .... -_ ...._ ....... .......... - .... -_ ....... _ ... ....... ....•.......... .......................... -
••..••....................•.••••. - .. -_ ............ 1. .._ ..... ...................... -.... ........_ ...-.- .......... ........_. .- .•...... ~.............._ ...
o15J06!07
1500
12()()() : .
10500
~900032~ 7500
~6000.Q
.~ 4500
~ 3000~
Figure 5.8 Variation of Total Ammonia, Ammonia and Ammonium in kg/day dischargedfrom sampling point-5 into the Lakhya River
55
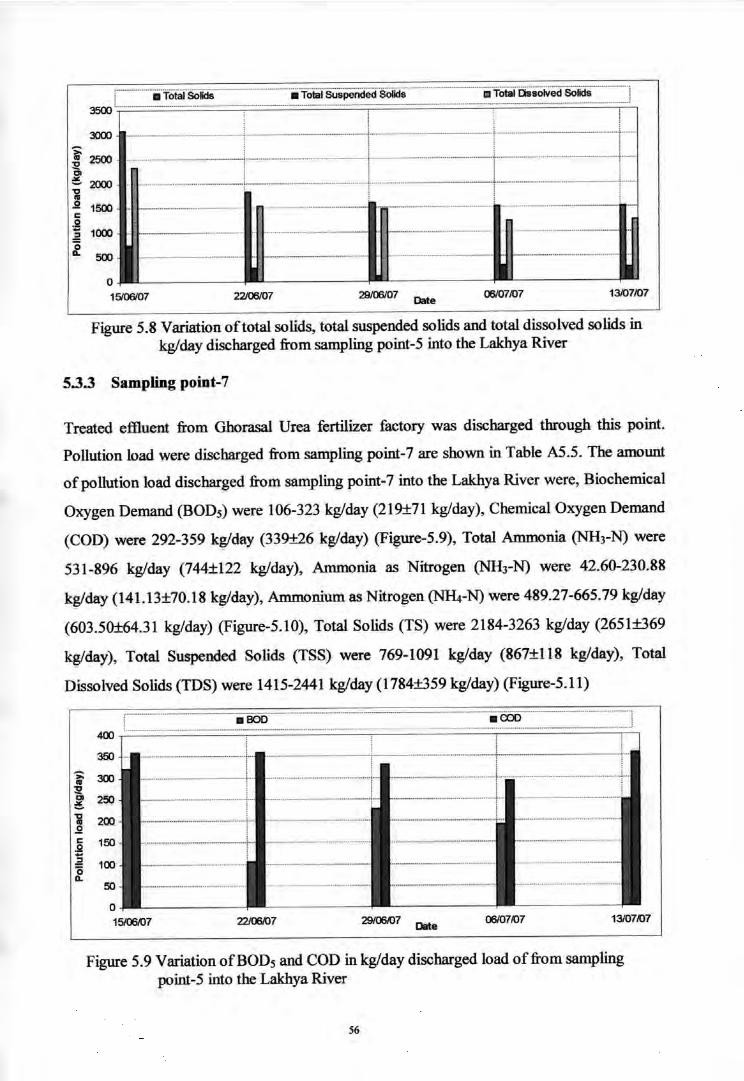
.................iiiTotiij.soiid" .......................ii.TotaTSu.s.pende;fSoiids .
1310710700107107'2!a/06'07 Date22/06'07
....••...... _- ......•. _ .•....... _.__ . .......• _ .....
......... ............... __ •.......... ...........
.__ ... ..•..•... _-- ....•..• _ ...-........... ...__ ......__ ........- ...._ ..............•... - ... •.. ..... ................•.... ....._ .......... ..-
............ _ . ............... _ ......_ ..._ ..... ._-_._-_ ..__ ........... ............. _ ......._.- .......... - ......._ .......... ......__ .__ ....•. .---'- ........•_ ... .............. __ .......... _.
- .............. ................•. ............. .... ...........•..•.••••..... _-- ..__ ...•.•.••.... .....__ ••..........__ .........._ •................. ... ................ _ ... .. .........._ ..........
Iio15/06'07
>:~ 2500
~~ 2000-g.2 1500c.2:2 1000
~ 500
3500 _ .
3000
Figure 5.8 Variation of total solids, total suspended solids and total dissolved solids inkg/day discharged from sampling point-5 into the Lakhya River
5.3.3 Sampling point-7
Treated effluent from Ghorasal Urea fertilizer factory was discharged through this point.
Pollution load were discharged from sampling point-7 are shown in Table AS.5. The amount
of pollution load discharged from sampling point-7 into the Lakhya River were, Biochemical
Oxygen Demand (BODs) were 106-323 kg/day (219:t71 kg/day), Chemical Oxygen Demand
(COD) were 292-359 kWday (339:1:26 kg/day) (Figure-5.9), Total Ammonia (NH3-N) were
531-896 kg/day (744:t122 kg/day), Ammonia as Nitrogen (NH3-N) were 42.60-230.88
kg/day (141.13:t70.18 kg/day), Ammonium as Nitrogen (N}4-N) were 489.27-665.79 kg/day
(603.50:t64.31 kg/day) (Figure-5.lO), Total Solids (TS) were 2184-3263 kg/day (2651:t369
kg/day), Total Suspended Solids (TSS) were 769-1091 kg/day (867:tl18 kg/day), Total
Dissolved Solids (TDS) were 1415-2441 kg/day (l784:t359 kg/day) (Figure-5.11)
.............._................iii80o................... - ........- __ -. coD- - .
400
350
>: 300••:ECl 250~" 200 -••.2c 150.2:2 1000a.
50
o15/06107 22I06I07 29/06107 Date 06/07107 13/07107
Figure 5.9 Variation of BODs and COD in kg/day discharged load of from samplingpoint-5 into the Lakhya River
S6

13107/07
............•c Arrrronium
06/0710729/06/07 Date22106107
• Total A.;:,:m;.n.ia ............... ......... .........
............... .................••••. ...... ...........• .......... _ ........... ........ ......... ....
....... .................... ..... .................. ............. ........................ ............. ....
.................. ..................•.......... .............. ............... ... .........•••••.•.... .......... ... ...........••.•... ................... ...........•..• - ..... ................••.........
_ ........ .............. .. ............... .._ ...... _ .. ........ ........ _._ ...... ................. _ ..... ...................•....... ........... ............ ......._ .•..............
........... ......... _ ........ ...............•• _. ....._ .......... ........ ................. ........... ................... ............. -........ .....................
..... _ ..... .. ........ ........... ..... ..... ........•.•.•..... ............. .................••• ..................... ...............
...........•.•.•.••.......... ........... ........ ......... _ ..... .....-. .............•..•••••... .................. .........•..•. .. .......... ...............•••••.•... ...............•••••••....
1000
900_ BOO,..~ 700
~600"g5OO.Q,,400.9:2300~ 200
100
o15/06107
Figure 5.10 Variation of Total Ammonia, Ammonia and Ammonium in kg/day dischargedfrom sampling point-5 into the Lakhya River
,~ .3500
....• ToiaTsoiids............................ ..Ii.Toial.Suspeiide<i.SOlids- .•••••.............. _.
C Total Dssolved Soids.............. J
3000 .
>:~ 2500.C>.><- 2000"g.Q 1500.
".9:2 1000'0D. 500
o15/06J07 22/06107 29/06107 Date
06107/07 13/07107
Figure 5.11 Variation of total solids, total suspended solids and total dissolved solids inkg/day discharged from sampling point-5 into the Lakhya River
5.4 Estimation of Total Water Pollution Load Discharged from Fertilizer Factories
Effluent from Polash and Ghorasal Urea fertilizer factories were discharged through the point
of 4, 5, 7. Total water pollution load were discharged from fertilizer factories are shown in
Table A5.6. The amount of pollution load discharged from fertilizer factories into the Lakhya
River were, Biochemical Oxygen Demand (BOD5) were 2665-3369 kg/day
(3129i:253kwday), Chemical Oxygen Demand (COD) were 4714-5221 kg/day
(4953:t164kg/day) (Figure-5.12), Total Ammonia (NH3-N) were 17425-20012 kg/day
(l8202:t936 kg/day), Ammonia as Nitrogen (NH3-N) were 7850.68-10671.21 kg/day
(9185.76:!:l013.79 kg/day), Ammonium as Nitrogen (NHt-N) were 7164.34-12161.79 kg/day
(9016.5l:t1705.80 kg/day) (Figure-5.l3), Total Solids (TS) were 7449-10380 kg/day
(8725:t1023kg/day), Total Suspended Solids (TSS) were 1513-3375 kg/day
57
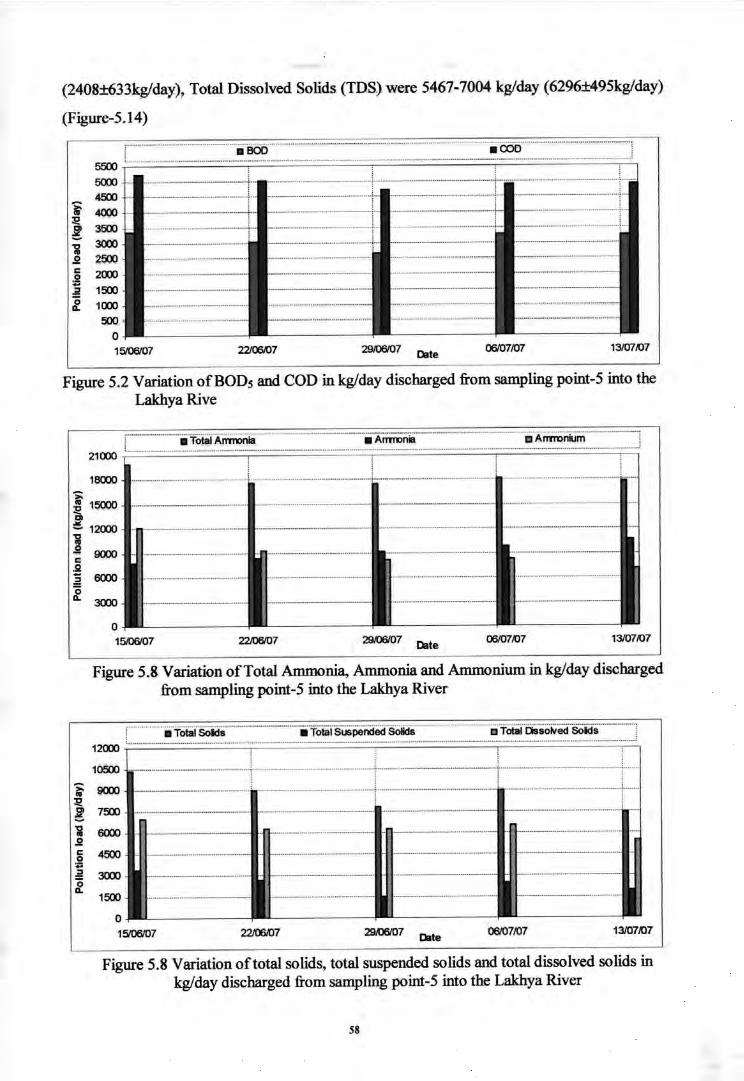
(2408:!:633kg/day), Total Dissolved Solids (TDS) were 5467-7004 kg/day (6296:t495kglday)
(Figure-5.14).........•.00.0 .
1310710706107/07Date29I06I0722lO0I07
5500500)
4500~4000J2~ 3500"C 3000IV.9 2500
.2 20CD2 1500
~ 1000500 .
o15J06/07
Figure 5.2 Variation of BOD5 and COD in kg/day discharged from sampling point-5 into theLakhya Rive
21000
• Tolal Arrrronia........-•. AiinDiiiii .. - __ _.._.--ii"AiTiTOiiium- _ _.,
...........••.•••...... _-_ _-_ - _. .....................•••..• .....•........_.............. . _ _~
18000-;:.;:E 1500)Cl
:!:!. 12000~.99000c:.226000oQ.3000
o15106107 22lO6I07 29I0OI07 Date 00107107 13/07107
Figure 5.8 Variation of Total Ammonia, Ammonia and Ammonium in kg/day dischargedfrom sampling point-5 into the Lakhya River
..............•foiaiSuspended.Soiids ....12000
.... _--
10500
-;:.; 9000 .IVJ2Cl 7500:!:!."C 6000IV.9c: 4500.2~ 30000Q.
1500
o15106107 22lO0I07 29I0OI07 Date
06107107 13107107
Figure 5.8 Variation of total solids, total suspended solids and total dissolved solids inkg/day discharged from sampling point-5 into the Lakhya River
58

CHAPTER 6
IMPACT OF EFFLUENT ON THE LAKHYA RIVER WATER QUALITY
6.1 Introduction
Rapid growth of industry in Bangladesh is putting stress on natural resources and the
environment. Water and air pollution, degradation of land resources, soil erosion, over
exploitation of land resources and threats to the ecosystem are among the most challenges.
Besides mismanagement, important reasons for the rapid increase of environmental pollution
are the limitations in the level of technology applied in industrial production process and
wastes treatment (Hung, 1997).
Industrial production activities have impacts on the natural environment through the entire
cycle of raw materials exploration and extraction, transformation into products, and use and
disposal of products by the final consumers. All these activities generate wastes. Neither
enterprises nor consumers want to store wastes in their own yards. Therefore, they have to
find places and methods to get rid of it and frequently the natural environment is serving as
the recipient of all kinds of wastes, among which industrial wastes with high toxicity and
loading of contaminants. This study explains why industrial wastes are one of the major
causes of severe causes of water pollution in Bangladesh.
6.2 Analysis of flow rate in the different points along the Lakhya River
6.2.1 Sampling point-l
The flow rate from sampling point-l of Lakhya River is shown in Table A6.1. Flow rate
(Figure-6.1) from sampling point-l were 581. 732-1032.429 m3/s (824.86:1:155)
Rate of flow in sampling point-1 of Lakhya River
~ .•.•..•..•.•...•..--.....................•...... :7 ..........•.~_ .... ................•....
r---........~ -.._ ............_ .....
5001210612007 17/0012007 22/0012007 27/0012007 0210712007 07/0712007 1210712007 1710712007
Date
1100
~ 1000..,,5.900~£ 800
'0 700••'lii 600a::
Figure 6.1 Variation of flow rate at sampling point-l along the Lakhya River
59
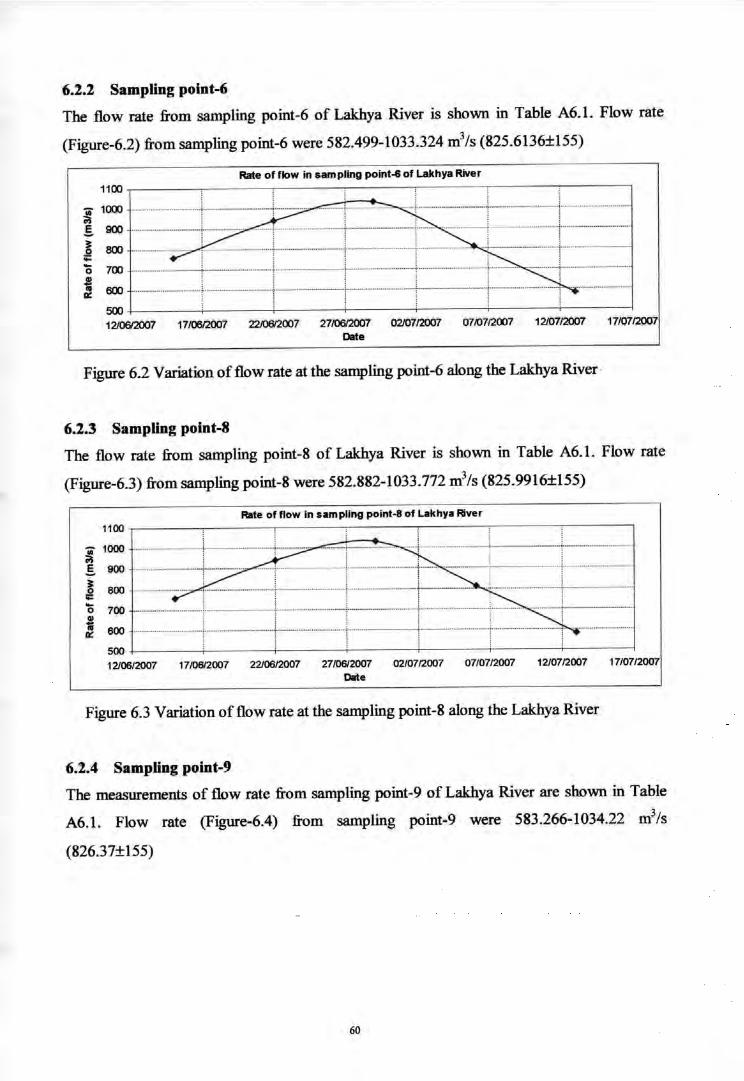
6.2.2 Sampling point-6
The flow rate from sampling point-6 of Lakhya River is shown in Table A6.1. Flow rate
(Figure-6.2) from sampling point-6 were 582.499-1033.324 m3/s (825.6136:t155)
Rate of flow in sam piing point-6 of Lakhya River
;;;-- ..•••..• .._ ...... __ .........-~~ ............. ........ _-_ .......
~ ~-. ...............•.... _ ... ..........• •...•.•....
-.............~ ••.............•..........
1100
'iii' 1000illoS 900~.g 800
'0 700~~ 600
50012/0612007 17/0012007 2210612007 27/0612007 02/0712007 0710712007 12/0712007 17/0712007
Date
Figure 6.2 Variation of flow rate at the sampling point-6 along the Lakhya River
6.2.3 Sampling point-8
The flow rate from sampling point-8 of Lakhya River is shown in Table A6.1. Flow rate
(Figure-6.3) from sampling point-8 were 582.882-1033.772 m3/s (825.9916:t155)
Rate of flow in sampling point.S of Lakhya River
......-- .._._ .._- .... ..._-_ ..._ ••.... ..•••..•
.-' ~
...........•.• __ ......_---_ ... ~ ~~
~ ...•...... ..__ ...............
'iii' 1000illoS 900~,g 800
'0 700••~ 600
50012/00/2007 17106/2007 22/00/2007 27/0612007 02/0712007 07/07/2007 12/0712007 17/07/2007
Date
1100
Figure 6.3 Variation of flow rate at the sampling point-8 along the Lakhya River
6.2.4 Sampling point-9
The measurements of flow rate from sampling point-9 of Lakhya River are shown in Table
A6.1. Flow rate (Figure-6.4) from sampling point-9 were 583.266-1034.22 m3/s
(826.3 7:tl55)
60

Rate of flow in sampling point.9 of Lakhya River
---'~.•..•..•~
...._--_ ....".._--------_ .... ~ ......_ ... ..........•..•..•.•..•..
~•..................••. --_ .
~ 1000M.5. 900
~ 800;:
'0 700$~ 800
5001210612007 17/0612007 22/0612007 27/06/2007 02/0712007 07/07/2007 12107/2007 17/0712007
Date
1100
Figure 6.4 Variation of flow rate at the sampling point-9 along the Lakhya River
6.3 Analysis of water quality along the Lakhya River to assess impact of Polash and
Ghorasal urea fertilizer factories emuent
6.3.1 Biochemical Oxygen Demand (BOD)
The level of Biochemical Oxygen Demand (BODs) was 8-11 mg/l (9.2:1:1.16mg/l) in the
sampling point-I. In the sampling point-6 it was 9-11 mgll (l0:l:0.89mg11) in which 146.97-
348.19 kg/day (226.18:1:66.26 kg/day) BODs discharged from sampling point-5. In the
sampling point-8, it was 11-14mg11 (12.4:1:1.01 mg/l) in which 2518.3-3094.42 kglday
(2902.92:1:211.31 kg/day) BODs discharged from sampling point-4 and 7. For the dilution
factor the BODs reduced in the sampling point-9 and it was 10-13 mgll (11.4:1:1.01 mgll). The
levels of BODs along Lakhya River are shown in Figure 6.5 and Table A6.2.
f ••• 'i"5106aoo:;--E:i-22i06i200iliiiiiiiiii'29iOOliooi....-""Q6.i07I2OOi ••• 1310712007 ---=::Slanda~ Iev"el,16 .."....... "."......... . "..................................... . " " .
14
12
E"E 10
d' 8
2 6
4
2
o6 salTllling point 8 9
Figure 6.5 Variation of BODs in mg/l along the Lakhya River
61
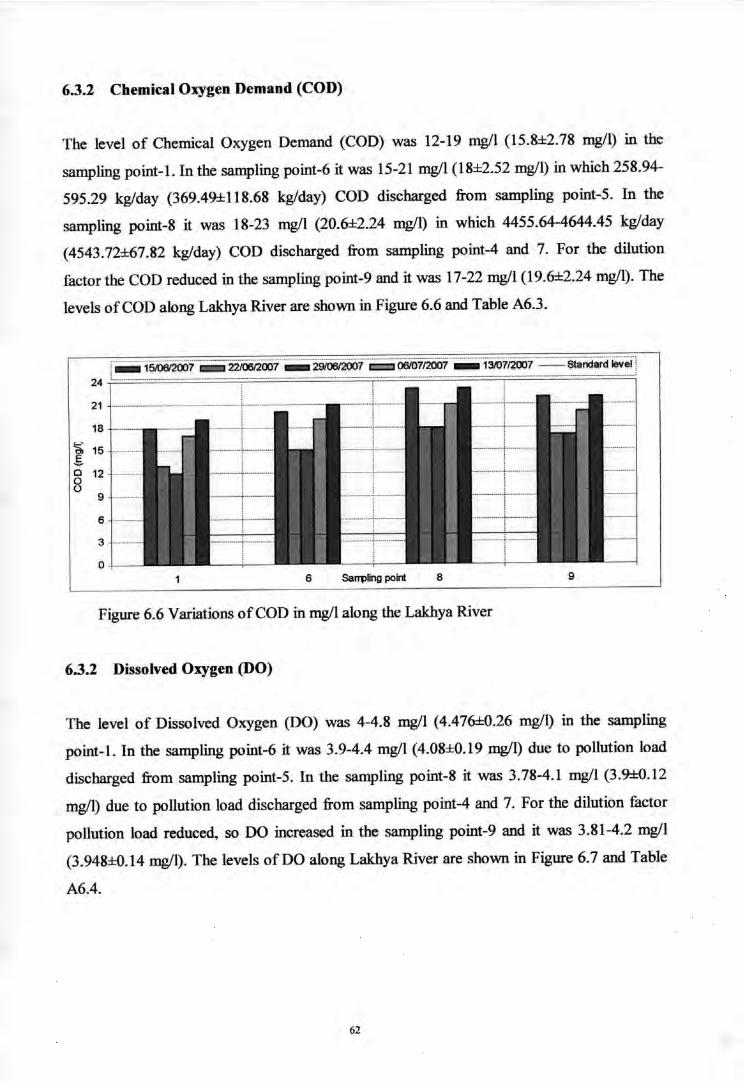
6.3.2 Chemical Oxygen Demand (COD)
The level of Chemical Oxygen Demand (COD) was 12-19 mg/I (15.8:1:2.78 mg/I) in the
sampling point-I. In the sampling point-6 it was 15-21 mg/I (18:1:2.52mg/I) in which 258.94-
595.29 kg/day (369.49:1:118.68 kg/day) COD discharged from sampling point-5. In the
sampling point-8 it was 18-23 mg/I (20.6:1:2.24 mg/I) in which 4455.64-4644.45 kg/day
(4543.72:1:67.82 kg/day) COD discharged from sampling point-4 and 7. For the dilution
factor the COD reduced in the sampling point-9 and it was 17-22 mg/I (19.6:1:2.24 mg/I). The
levels of COD along Lakhya River are shown in Figure 6.6 and Table A6.3.
! __ 1s;ti6l2ooi'C::::J 22/ool2ooiiliiiiiiiii29iooi2007 .~ O6Ioii2007 .iiiiiiiiiI:;310712ooi"=:::"" Standard level!24 L................................ .................................•....................•........_............................ . _ _ ...............•
21
18
~ 15.E-o 12au
9
6
3
o6 Sarrpling point 8 9
Figure 6.6 Variations of COD in mg/I along the Lakhya River
6.3.2 Dissolved Oxygen (DO)
The level of Dissolved Oxygen (DO) was 4-4.8 mg/I (4.476:1:0.26 mg/I) in the sampling
point-I. In the sampling point-6 it was 3.9-4.4 mg/I (4.08:1:0.19 mg/I) due to pollution load
discharged from sampling point-5. In the sampling point-8 it was 3.78-4.1 mg/I (3.9:1:0.12
mg/I) due to pollution load discharged from sampling point-4 and 7. For the dilution factor
pollution load reduced, so DO increased in the sampling point-9 and it was 3.81-4.2 mg/I
(3.948:1:0.14 mg/I). The levels of DO along Lakhya River are shown in Figure 6.7 and Table
A6.4.
62

7........ _............ . _ _.. . _ _.- ...........•. _._ _...... .._ _._ _... ..• . _ _._ _ _._ _ _.. ...•.._ _.................. . _ .•._ •.•.....
----'----------'----------'----_ .................•..•......6'a>.s 5c:••'"g 4 •••
-g 3
~'"is 2
o
...........•••••....... '1-
6
....+....
,._._._ ...-•...._ ..._ .....,
Sarrpling point 8 9
Figure 6.7 Variation of DO in mg/l along the Lakhya River
6.3.3 pH
The level of pH was 7.5-7.8 (7.66:1:0.102) in the sampling point-I. In the sampling point-6 it
was 7.9-8.3 (8. HO.12) due to pollution load discharge from sampling point-5. In the
sampling point-8 it was 8-8.4 (8.18:1:0.13) due to pollution load discharge from sampling
point-4 and 7. For the dilution factor pollution load decreased at the sampling point-9, so pH
decreased at that point and it was 8.1-8.3 (8.16:l::0.08). The levels of pH along Lakhya River
are shown in Figure 6.8 and Table A6.5.
9
8
7
6
:I: 5Q.
4
2
o6 Sarrpling point 8 9
Figure 6.8 Variation of pH along the Lakhya River
63

6.3.4 Temperature
The level of Temperature was 28-31.4 °c (29.68:J:1.13 0c) in the sampling point-I. In the
sampling point-6 it was 28-32 °c (30.4:J:1.43°C) due to pollution load in high temperature
discharged from sampling point-5. In the sampling point-8 it was 28.2-31.7 °c (30.14:J:1.26
0c) due to pollution load in high temperature discharged from sampling point-4 and 7. In the
sampling point-9, it was 28.1-30.5 °c (29.72:J:1.04 0c). The levels of Temperature along
Lakhya River are shown in Figure 6.9 and Table A6.6.
35
30
10
_ 15/0612007 = 22/0612007 _ 29/0612007 06/07/2007 _ 13/07/2007 -Standard
6 Sa"lliing point 6 9
Figure 6.9 Variation of Temperature in °c along the Lakhya River
6.3.5 Total Ammonia (NH3-N+ Na.-N)
The concentration of Total Ammonia was 0.685-0.71 mg/I (0.69:J:0.009mg/l) in the sampling
point-I. In the sampling point-6 it was 0.97-1.19 mg/I (1.086:J:0.079 mgIl) due to 7368-11203
kg/day (8624:J:1344 kg/day) total Ammonia discharged from sampling point-5. In the
sampling point-8, it was 1.09-1.30 mgIl (1.2:I::0.072 mgIl) due to 8808-10467 kg/day
(9577:I::533kg/day) total Ammonia discharged from sampling point-4 and 7. For the dilution
factor the total Ammonia reduced in the sampling point-9 and it was 0.95-1.15 mg/I
(1.05:J:0.07 mg/I). It was observed that fertilizer factories are the major sources of Total
Ammonia discharged into the Lakhya River in the study area. The concentration of total
Ammonia in sampling point-9 is greater than the concentration of Total Ammonia in
sampling point-I. This increment is fully responsible the Ammonia load discharged from
fertilizer factories. So the Ammonia load discharged from fertilizer factories has a large
64

impact on the Lakhya River water quality. The levels of total Ammonia along Lakhya River
are shown in Figure 6.10 and Table A6.7 .
. __ .. . _........................ .._-_ .....•.••.__ _-_ __ ........•...................• _.. . _ --_ _ •...__ ._-_. __ .1.5
~ 1.2
.s-
.l!! 0.9c0EE<{
0.6m(;I-
0.3
o6 Sarrpling point 8 9
Figure 6.10 Variation of Total Ammonia in mg/l along the Lakhya River
6.3.6 Ammonia as Nitrogen (NHJ-N)
The concentration of Ammonia as Nitrogen (NH3-N) was 0.01-0.02 mg/l (0.016=1:0.0004mg/l)
in the sampling point-I. In the sampling point-6 it was 0.08-0.11 mg/l (0.074=1:0.022 mg/l)
due to 4975.23-6598.68 kg/day (5643.73=1:590.45 kg/day) NH3-N discharged from sampling
point-5. In the sampling point-8 it was 0.06-0.15 mg/l (0.096=1:0.03 mg/l) due to 2322.54-
5265.65 kg/day (3542.03=1:1080.86 kg/day) NH3-N discharged from sampling point-4 and 7.
For the dilution factor the NH3-N reduced in the sampling point-9 and it was 0.06-0.11 mg/l
(0.078=1:0.01mg/l). It was observed that fertilizer factories are the major sources of Ammonia
(NH3-N) discharged into the Lakhya River in the study area. The concentration of Ammonia
in sampling point-9 is greater than the concentration of Ammonia in sampling point-I. This
increment occured due to the Ammonia discharged from fertilizer factories. So the Ammonia
discharged from fertilizer factories has a large impact on the Lakhya River water quality. The
levels ofNH3-N along Lakhya River are shown in Figure 6.11 and Table A6.8.
65
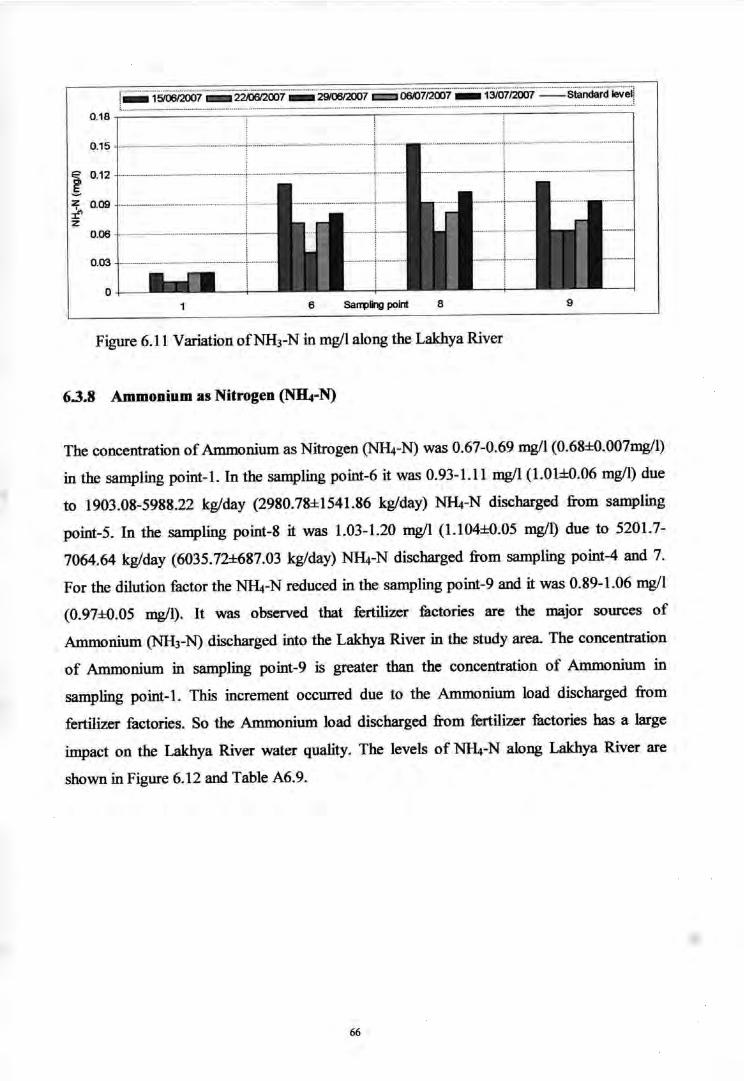
_ 15/0612007 = 2210612007 _ 29/0012007 = 0610712007 _ 13/0712007 -Standard level.._, ..-•..._ ..•.,.,_ _ ..~._._ - _ ..__ _ _._ _ __ _._ _ _ .._... ........• _ _ .._ _ _ .._ _ _ .....•_ .._...... . _ .._ .
...... _ _ _ _ _ ..••..........•..••..••......... _ .._ - _ _ ..•...............•.....•...............••.••••...............•.•.............••.......
0.18
0.15
E 0.12
~ 0.09I'z
0.06
0.03
o6 Sa"1'lingpoint 8 9
Figure 6.11 Variation ofNH3-N in mg/I along the Lakhya River
6.3.8 Ammonium as Nitrogen (NH4-N)
The concentration of Ammonium as Nitrogen (Nlii-N) was 0.67-0.69 mg/I (0.68:f:0.007mg/l)
in the sampling point-I. In the sampling point-6 it was 0.93-1.11 mg/l (1.0l:!:0.06 mg/l) due
to 1903.08-5988.22 kg/day (2980.78:f:1541.86 kg/day) Nlii-N discharged from sampling
point-5. In the sampling point-8 it was 1.03-1.20 mg/I (1.104:f:0.05 mg/l) due to 5201.7-
7064.64 kg/day (6035.72:1:687.03 kg/day) Nlii-N discharged from sampling point-4 and 7.
For the dilution factor the Nlii-N reduced in the sampling point-9 and it was 0.89-1.06 mg/l
(0.97:1:0.05 mg/I). It was observed that fertilizer fuctories are the major sources of
Ammonium (NH3-N) discharged into the Lakhya River in the study area. The concentration
of Ammonium in sampling point-9 is greater than the concentration of Ammonium in
sampling point-I. This increment occurred due to the Ammonium load discharged from
fertilizer factories. So the Ammonium load discharged from fertilizer factories has a large
impact on the Lakhya River water quality. The levels of Nlii-N along Lakhya River are
shown in Figure 6.12 and Table A6.9.
66

•••••.•••n•••••_ •••••_••••••••_••••••••• _~ •••_ ••••••~ •••••••••- ••••••_••••••_ ••_ •••_-_._ ••••••- ••••••••• _ •••••- ••••••_ •••_ ••••_ ••••••_ ••••••- ••••••••••_ ••••••- ••••••_ ••••••••••- ••••••_ •••••••••••••••••• - ••••••_ ••••
15'0612007= 2210612007 _ 2910612007= 00I07f2oo7 _ 13/07f2oo7 --Standard level!
1.5.•...
1.2
~ 0.9.sz~z
0.3
06 SarTl'lingpoint 8 9
Figure 6.12 Variation ofNHt-N in mg/I along the Lakhya River
6.3.9 Total Solids (TS)
The concentration of Total Solids (TS) was 179-247 mg/I (200:l:24.88mg/l) in the sampling
point-I. In the sampling point-6 it was 193-261 mg/I (220:1:22.82 mg/I), in which 1523-3077
kg/day (1908:f:594 kg/day) TS discharged from sampling point-5. In the sampling point-8 it
was 220-286 mg/I (251:f:21.6mg/l) in which 5925-7302 kg/day (6816:f:606.69 kg/day) TS
discharged from sampling point-4 and 7. Total solids were accumulated in the downstream,
for this, the value of TS were increased in the sampling point-9 and it were 237-298 mg/I
(267.6:f:22.08 mg/I). The concentrations of Total Solids (TS) along Lakhya River are shown
in Figure 6.13 and Table A6.1O.
..............._ ----+------------------_ _ _.._.
...................................................................................................... .; .
...........•..•.• _........ . ..............•.•••. - f ....•.. _ ••.. _.-
9
. + .
. _ +._ .
86
......._ - -f - -.
.....••.••.••.•............•....•••••••.... f .
.............. f .
.....................•.... ;- .
1100 .
1000900
E" 800E 700'"~ 800Cf) 500~ 400
300200100o
Figure 6.13 Variations of Total Solids in mg/I along the Lakhya River
67

6.3.10 Total Suspended Solids (TSS)
The concentration of Total Suspended Solids (TSS) was 19-41 mg/l (30I7mg/l) in the
sampling point-I. In the sampling point-6 it was 20-45 mg/l (33.2:l:8.65 mg/l) in which 1394-
2623 kg/day (2060I451 kg/day) TSS discharged from sampling point-5. In the sampling
point-8 it was 26-58 mg/l (43.2:l:11.56mg/l) in which 118-752 kg/day (348:1:213 kg/day) TSS
discharged from sampling point-4 and 7. Total suspended solids were accumulated in the
downstream, for this, the value ofTSS were increased in the sampling point-9 and it were 27-
62 mg/l (46:1:12.55 mg/l). The concentrations of Total Suspended Solids (TSS) along Lakhya
River are shown in Figure 6.14 and Table A6.1l.
_ 15/0612007 EE'ilI22106l2007 _ 29/0612007 IE5I 06107/2007 _ 13/0712007 -Standard level
70
~ 60
~ 50;Z"0 40
~8. 30 -----------!l~ 20
~10
o6 Salf1lling point 8 9
Figure 6.14 Variations of Total Suspended Solids in mg/l along the Lakhya River
6.3.11 Total Dissolved Solids (TDS)
The concentration of Total Dissolved Solids (TDS) was 141-228 mg/l (l70I30mg/l) in the
sampling point-I. In the sampling point-6 it was 162-245 mg/l (190.2:l:30.91 mg/l) in which
1394-2623 kg/day (2060I451 kg/day) TDS discharged from sampling point-5. In the
sampling point-8 it was 181-257 mg/l (207.4:1:27.8mg/l) in which 118-752 kg/day (348:1:213
kg/day) TDS discharged from sampling point-4 and 7. Total suspended solids were
accumulated in the downstream, for this, the value of TDS were increased in the sampling
point-9 and it were 192-271 mg/l (221.6:1:28.7 mg/l). The concentrations of Total Dissolved
Solids (TDS) along Lakhya River are shown in Figure 6.15 and Table A6.12.
68

......••...•••••..••......_ ~_ - _ _ _._._ _ _ _ _ _ ............•••...............•.••••.•.......•15/0612007= 22/0612007 29/0612007= 06/07/2007 _ 13/0712007 -Standard lever
, _ ••.•........... _._ _._ _ ..-.......•.. _._ _ _._ _ ••.•...... _ .._._._ _._ _ .._ _ .....•. _._ .._._ _ ..•••..... _ _ ....••_._ _._ ....................................•
..............•••.. - ..• 1 .
. _ + _ ,_ .
............. --- - 1.. - - - -.- -.- .. -.. . - - _._.-... . - - - .
............••..•..••••••....... j ..•••••••.•.••.••..••••••••• - ••.....•.••.••••• _ •••.•.•.•.. j............. ............•.•..•............ •......•..... j ••..••.. _ •....••.•••••••............•.•.•••.•.•.••
.............. _ .;. .
11001000 - ----'--------'--------'----
E',[ 900-.fA 800 j. . ..••............ _ •••••....• i _.- j ..•..•...• - ..••••.•...........•..•••••••••••..•.•.••...••• - •••
:2 700 .._.._.__. ...__. .._._. .._..L..._. ._... . ._. __ J.. ._. ._ _.__. L..._.__. ._.-.--.---..-....-..-.--.3i-g 600
~ 500III
~ 400iii 300~ 200
100
o6 Sa rrpling point 8 9
Figure 6.15 Variation of Total Dissolved Solids in mg/l along the Lakhya River
6.4 Analysis of Pollution Load along the Lakhya River to assess impact of Polashand Ghorasal urea fertilizer factories effluent
6.4.1 Biochemical Oxygen Demand (BOD)
The level of pollution load along the Lakhya River of Biochemical Oxygen Demand (BOD5)
was 552878-713615 kg/day (640523:l:51939 kg/day) in the sampling point-I. In the sampling
point-6 it was 553607-803513 kg/day (702374:l:82048 kg/day) in which 146.97-348.19
kg/day (226.18:l:66.26 kg/day) BOD5 discharged from sampling point-5. In the sampling
point-8 it was 705054-982497 kg/day (87 1789:l:102518 kg/day) in which 2518.3-3094.42
kg/day (2902.92:l:211.31 kg/day) BOD5 discharged from sampling point-4 and 7. In the
sampling point-9, it was 655124-982923 kg/day (802362H05472 kg/day). It was shown that
there was insignificant impact of pollution load of BOD5 discharged from fertilizer factories.
The levels ofBOD5 along Lakhya River are shown in Figure 6.16 and Table A6.13.
Figure 6.16 Variation ofBOD5 in kg/day along the Lakhya River
69
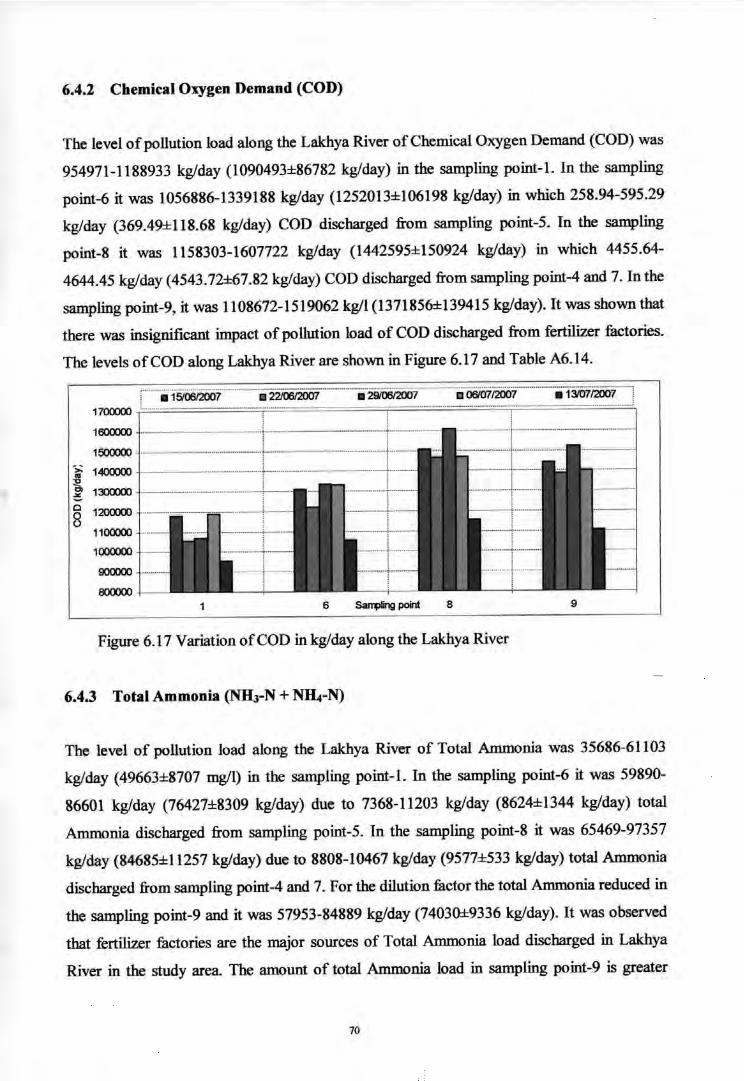
6.4.2 Chemical Oxygen Demand (COD)
The level of pollution load along the Lakhya River of Chemical Oxygen Demand (COD) was
954971-1188933 kg/day (1090493:1::86782 kg/day) in the sampling point-I. In the sampling
point-6 it was 1056886-1339188 kg/day (1252013:1::106198 kg/day) in which 258.94-595.29
kg/day (369.49:1::118.68 kg/day) COD discharged from sampling point-5. In the sampling
point-8 it was 1158303-1607722 kg/day (1442595:1::150924 kg/day) in which 4455.64-
4644.45 kg/day (4543.72:1::67.82kg/day) COD discharged from sampling point-4 and 7. In the
sampling point-9, it was 1108672-1519062 kg/I (1371856:1::139415 kg/day). It was shown that
there was insignificant impact of pollution load of COD discharged from fertilizer factories.
The levels of COD along Lakhya River are shown in Figure 6.17 and Table A6.14.
••••••••••••••• __ •••••• __ ••• _ •••••• __ ••••••••• _._ ••• __ ._._. •••• _ •• _ ••••• •• _ •••••••••• __ ••••••••• __ •••••••••• _ •••••••••• _ •• _ •••••• __ • • • __ •••••• _ •••••••• J
; 1.5i06i2OOi......ii221001200i............. ..iii2Siool2OOi c.06io7i200i........ ....• 13i6ii20071700000
1600000
1500000
.~ 1400000:!!~ 13000CXl
g 1200000o
1100000
100000o
900000
8000006 Sa"llUngpoint 8 9
Figure 6.17 Variation of COD in kg/day along the Lakhya River
6.4.3 Total Ammonia (NHJ-N + NH4-N)
The level of pollution load along the Lakhya River of Total Ammonia was 35686-61103
kg/day (49663:1::8707mg/I) in the sampling point-I. In the sampling point-6 it was 59890-
86601 kg/day (76427:1::8309 kg/day) due to 7368-11203 kg/day (8624:1::1344 kg/day) total
Ammonia discharged from sampling point-5. In the sampling point-8 it was 65469-97357
kg/day (84685:1::11257kg/day) due to 8808-10467 kg/day (9577:1::533kg/day) total Ammonia
discharged from sampling point-4 and 7. For the dilution factor the total Ammonia reduced in
the sampling point-9 and it was 57953-84889 kg/day (74030:1::9336kg/day). It was observed
that fertilizer factories are the major sources of Total Ammonia load discharged in Lakhya
River in the study area. The amount of total Ammonia load in sampling point-9 is greater
70

than the load of Total Ammonia in sampling point-I. This increment occurred due to the
Ammonia load discharged from fertilizer factories. So the Ammonia load discharged from
fertilizer factories has a large impact on the Lakhya River water quality. The levels of total
Ammonia along the Lakhya River are shown in Figure 6.18 and Table A6.15 .
100000._ ....-...
~ 90000>-••:!;I 80000Cl
C.Il! 70000c0E~ 60000
19 500000f-
40000
300006 SarT4'ingpoint 8 9
Figure 6.18 Variation of Total Ammonia in kg/day along the Lakhya River
6.4.4 Ammonia as Nitrogen (NH3-N)
The pollution load of Ammonia as Nitrogen (NH3-N) was 814-1399 kg/day (1084:l:231
kg/day) in the sampling point-I. In the sampling point-6 it was 3571-7215 kg/day
(5083:1:1293 kg/day) due to 4975.23-6598.68 kg/day (5643.73:1:590.45 kg/day) NH3-N
discharged from sampling point-5. In the sampling point-8 it was 5036-9840 kg/day
(6635:1:1788 kg/day) due to 2322.54-5265.65 kg/day (3542.03:1:1080.86 kg/day) NH3-N
discharged from sampling point-4 and 7. For the dilution factor the NH3-N reduced in the
sampling point-9 and it was 4535-7217 kg/day (5383:1:954 kg/day). It was observed that
fertilizer factories are the major sources of Ammonia load (NH3-N) discharged into the
Lakhya River in the study area. The amount of Ammonia load in sampling point-9 is greater
than the load of Ammonia in sampling point-I. This increment occurred due to the Ammonia
load discharged from fertilizer factories. So the Ammonia load discharged from fertilizer
factories has a large impact on the Lakhya River water quality. The pollution load ofNH3-N
along Lakhya River is shown in Figure 6.19 and Table A6.16.
71

. _ _ _ _ .•........ - ............•......... . _ -• 1510612007 c 22JOO/2007 • '2!iJ10612007
..................•••..•...... _ _ .c 0010712007 .13/0712007'
.. _ ••• _ •.•..............•••••••.........••..•. J
10000
8000
>:'":g 8000Cl~z£' 4000z
2000
06 SalTl'ling poinl 8 9
Figure 6.19 Variation of Ammonia as Nitrogen (NH3-N) in kg/day along the Lakhya River
6.4.5 Ammonium as Nitrogen (NH4-N)
The pollution load of Ammonium as Nitrogen (Nl-Li-N) was 34681-59765 kg/day
(48515:l:8670 kg/day) in the sampling point-I. In the sampling point-6 it was 55864-83030
kg/day (71344:l:9300 kg/day) due to 1903.08-5988.22 kg/day (2980.78:l:1541.86 kg/day)
Nl-Li-N discharged from sampling point-5. In the sampling point-8 it was 60433-91997
kg/day (78050:!:11161 kg/day) due to 5201.7-7064.64 kg/day (6035.72:l:687.03 kg/day) Nl-Li-
N discharged from sampling point-4 and 7. For the dilution factor the Nl-Li-N reduced in the
sampling point-9 and it was 53418-79527 kg/day (68648:l:9245 kg/day). It was observed that
fertilizer factories are the major sources of Ammonium load (NH3-N) discharged into the
Lakhya River in the study area. The amount of Ammonium load in sampling point-9 is
greater than the load of Ammonium in sampling point-I. This increment occurred due to the
Ammonium load discharged from fertilizer factories. So the Ammonium load discharged
from fertilizer factories has a large impact on the Lakhya River water quality. The pollution
load ofNl-Li-N along the Lakhya River is shown in Figure 6.20 and Table A6.17.
72
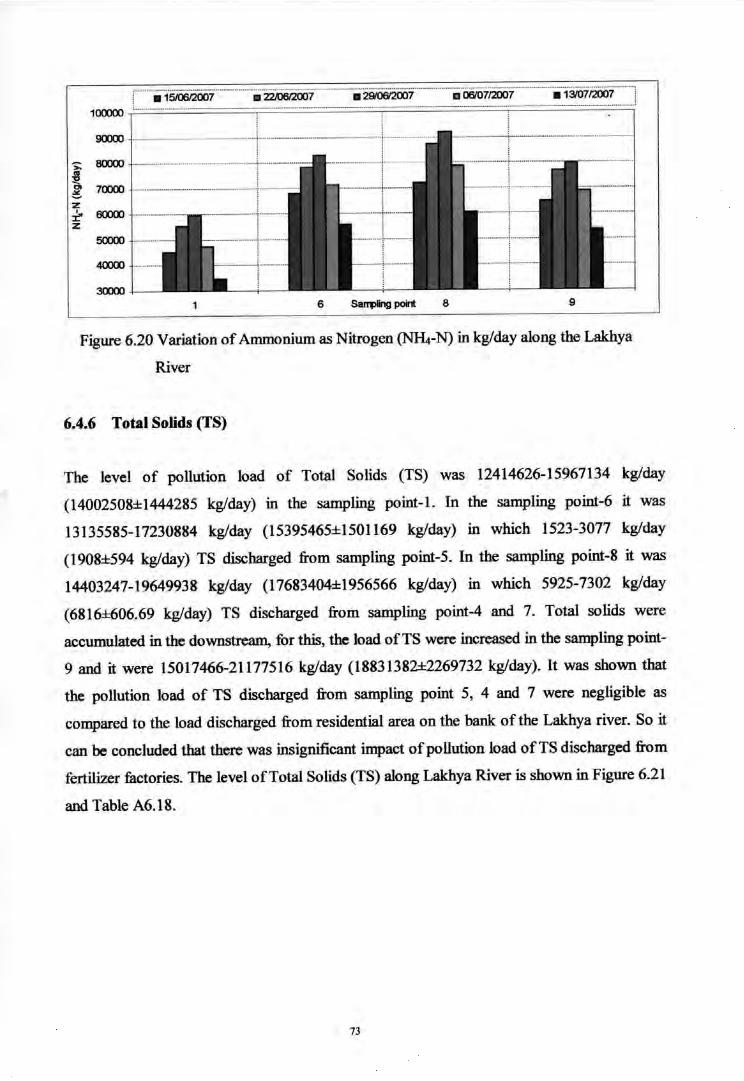
• 15/0612007 C '22J06I2007 • 29/0612007 [J 0610712007 • 1310712007
100000
90000
>: 80000to~E 70000zr- 60000z
50000
40000
3OOClO
..__ __ ..__ _ __ __ _-------_ _ __ .__ ._-------_ __ __ ........• __ .•.•..._--_ __ .. . _ _---_...... . __ . -
6 Sarrplingpoint 8 9
Figure 6.20 Variation of Ammonium as Nitrogen (N~-N) in kg/day along the Lakhya
River
6.4.6 Total Solids (TS)
The level of pollution load of Total Solids (TS) was 12414626-15967134 kg/day
(14002508:1:1444285 kg/day) in the sampling point-I. In the sampling point-6 it was
13135585-17230884 kg/day (15395465:1:1501169 kg/day) in which 1523-3077 kg/day
(1908:1:594 kg/day) TS discharged from sampling point-5. In the sampling point-8 it was
14403247-19649938 kg/day (17683404:1:1956566 kg/day) in which 5925-7302 kg/day
(6816:1:606.69 kg/day) TS discharged from sampling point-4 and 7. Total solids were
accumulated in the downstream. for this, the load ofTS were increased in the sampling point-
9 and it were 15017466-21177516 kg/day (18831382:1:2269732 kg/day). It was shown that
the pollution load of TS discharged from sampling point 5, 4 and 7 were negligible as
compared to the load discharged from residential area on the bank of the Lakhya river. So it
can be concluded that there was insignificant impact of pollution load ofTS discharged from
fertilizer factories. The level of Total Solids (TS) along Lakhya River is shown in Figure 6.21
and Table A6.18.
73
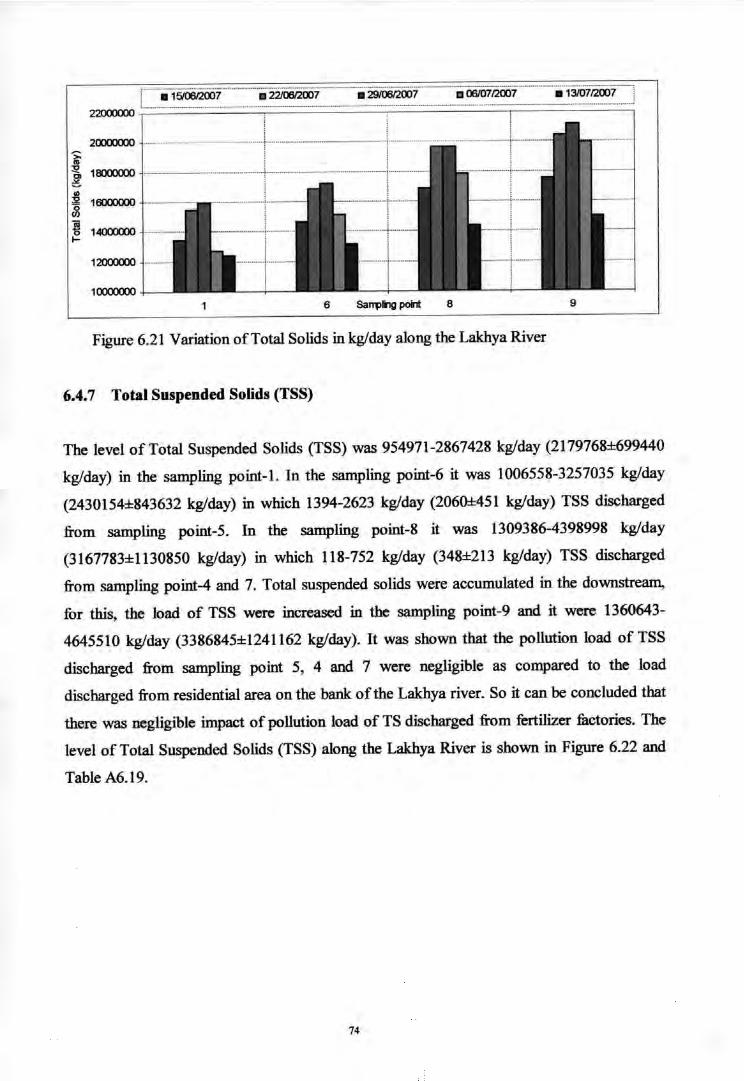
• 13/07(2007
9
Figure 6.21 Variation of Total Solids in kg/day along the Lakhya River
6.4.7 Total Suspended Solids (TSS)
The level of Total Suspended Solids (TSS) was 954971-2867428 kg/day (2179768:t699440
kg/day) in the sampling point-I. In the sampling point-6 it was 1006558-3257035 kg/day
(2430154:t843632 kg/day) in which 1394-2623 kg/day (206O:t451 kg/day) TSS discharged
from sampling point-5. In the sampling point-8 it was 1309386-4398998 kg/day
(3167783:t1130850 kg/day) in which 118-752 kg/day (348:t213 kg/day) TSS discharged
from sampling point-4 and 7. Total suspended solids were accumulated in the downstream,
for this, the load of TSS were increased in the sampling point-9 and it were 1360643-
4645510 kg/day (3386845:t1241162 kg/day). It was shown that the pollution load of TSS
discharged from sampling point 5, 4 and 7 were negligible as compared to the load
discharged from residential area on the bank of the Lakhya river. So it can be concluded that
there was negligible impact of pollution load of TS discharged from fertilizer factories. The
level of Total Suspended Solids (TSS) along the Lakhya River is shown in Figure 6.22 and
Table A6.19.
74

IJ 06/07/2007 • 13/07/2007
9
Figure 6.22 Variation of Total Suspended Solids in kg/day along the Lakhya River
6.4.8 Total Dissolved Solids (TOS)
The level of pollution load of Total Dissolved Solids (TDS) was 9861153-13558684 kg/day
(11822740:1:1251002 kg/day) in the sampling point-l. In the sampling point-6 it was
12256499-14463229 kg/day (13176508:i:818925 kg/day) in which 1394-2623 kg/day
(2060:1:451 kg/day) TDS discharged from sampling point-5. In the sampling point-8 it was
12942778-16166540 kg/day (14448096:i:1147385 kg/day) in which 118-752 kg/day
(348:i:213 kg/day) TDS discharged from sampling point-4 and 7. Total suspended solids were
accumulated in the downstream, for this, the load of TDS were increased in the sampling
point-9 and it were 13656823-17156469 kg/day (l5444538:i:1143304 kg/day). It was shown
that the pollution load of TDS discharged from sampling point 5, 4 and 7 were negligible as
compared to the load discharged from residential area on the bank the Lakhya river. So it can
be concluded that there was negligible impact of pollution load of TS discharged from
fertilizer factories. The level of Total Dissolved Solids (TDS) along the Lakhya River is
shown in Figure 6.23 and Table A6.20 .
1800000O
............... _---------_ .._....... ----_ _-_............. .........................•.•. ......••••.••........•..... __ - -. . _..... . __ .._-_ ------_ _-_ .._ ..11115/0612007 IJ 22/0612007 1129/0612007 IJ 0610712007 .13/0712007
'.----_ _--_ _ .._ _----_._---_ ..__ ._ _-_ _ .._-_ _ _ ..•_ ..__ _ _ _ .._ .•.................. _ .._._ .
1100000o
98Sa~ling point6
100000oo
900000O
1200000O
1400000O
13000000 .....
1600000O
1700000o
~
Figure 6.23 Variation of Total Dissolved Solids in kg/day along the Lakhya River
75

Schematic Diagrams of Water Quality Parameters for Different Sources along theLakhya River
IINDUSTRlAL AREA
I3128 kglday (039 %)
1 ! !S.P-5 S.P-7 S.P-4
226 kglday 219 kglday 2683 kglday(0.03%) (0.03%) (033"10)
~ ~ ~
1==5RESIDENTIAL AREA158711 kglday (19.78%)
U/S640523 kglday(79.83%)
lAKHYA RIVERDIS
802362 kglday(100%)
Diagram 6.1: Different sources of BODs along the Lakhya River
Ill-mUSTRlAL AREA
I4952 kglday (0.36 %)
1 ! !S.P-5 SP-7 S.P-4
369 kglday 339 kglday 4244 kglday(0.03%) (0.02%) (0.31%)
! ! !U/S
1090493 kglday(79.49%)
lAKHYA RIVERDIS
1371856 kglday(100%)
i iRESIDENTIAL AREA276411 kglday (20.15%)
i
Diagram 6.2: Different sources ofeOD along the Lakhya River
76

INDUSTRIAL AREA18201 kglday (24.59 %)
1 1 1S.P-5 S.P-7 S.P-4
8624 Jr-.glday 744 kglday 8833 kglday(11.65%) (1%) (11.93%)
! ! !
t==5RESIDENTIAL AREA6166 kglday (8.33%)
U/S49663 kglday(67.08010)
lAKHYA RIVERDIS
74030 kglday(100%)
Diagram 6.3: Different sources of Ammonia along the Lakhya River
INDUSTRIAL AREA8723 kglday (0.04 %)
1 ! 1S.P-5 S.P-7 S.P-4
1908 kglday 2651 kglday 4164 kglday(0.01%) (0.01%) (0.02%)
! ! !
U/S14002508 kglday
(74.36%)lAKHYA RIVER
DIS--J 18831382 kglday
(100%)
i iRESIDENTIAL AREA4820151 kglday (25.60%)
i
Diagram 6.4: Different sources of Total Solids along the Lakhya River
77

IlNDUSTRIAL AREA
I2408 kglday (0.07 %)
1 1 1S.P-5 S.P-7 S.P-4
348 kglday 867 kglday 1193 kglday(0.01%) (0.02%) (0.04%)
~ ~ LU/S
2179768 kglday(64.36%)
lAKHYA RIVERDIS
3386845 kglday(100%)
t tRESIDENTIAL AREA1204669 kglday (35.57%)
i
Diagram 6.5: Different sources of Total Suspended Solids along the Lakhya River
IlNDUSTRIAL AREA
I6296 kglday (0.04 %)
1 ! !SP-5 S.P-7 S.P-4
1560 kglday 1784 kglday 2952 kglday(0.01%) (0.01%) (0.02%)
L ! !U/S
11822740 kglday(76.55%)
lAKHYA RIVERDIS
---t 15444538 kglday(100%)
t fRESIDENTIAL AREA3615502 kglday (23.41%)
i
Diagram 6.6: Different sources of Total Dissolved Solids along the Lakhya River
78

CHAPTER 7
SURFACE WATER QUALITY MODELLING
7.1 Surface Water Quality Modelling for the Lakhya River
The objective of modeling is to find out the relationship between various parameters of the
river. In this study, only distance and concentration are considered, taking all other
parameters constant. From this 1st order prediction model the concentration at any distance,
which can satisfy the standard limit, or even the distance at which the concentration will be
zero can be obtained.
The substance decays with time due to chemical reactions, bacterial degradation, radioactive
decay, or settling of particulates out of the water column. Substance decays according to a
first-order reaction, i.e., the rate ofloss of the substance is proportional at any time.
Then the mass balance equation, at steady state, for non-conservative substance is a first-
order linear differential equation.
ds-=-Ksdx
S ds x=> f -=-K fdx
So s 0
=> InS-lnSo=-Kx, S
=> In-=-KxSo
S .Kx.=> -=eSo
S=So e'Kx
79

SIn-So
1~ Distane (x)
7.2 Effects on river water quality
7.2.1 Biochemical Oxygen Demand (BODs)
Highest amount of BODs (12 mg/I) was found at the discharging point of waste into the
Lakhya river and was found decreasing with distance at the down streams. The decay rate
was found 0.14/km. According to Bangladesh standards the BOD concentration limit is 0.2
mg/I for drinking purpose and 10 mg/I for industrial and irrigation purposes. This implies that
the concentration of BOD of the Lakhya River water is not suitable for drinking, industrial or
irrigation purposes.
Dstance in krn
__._~~:==::~::=~.J~~-~_=:~~~_._.t :~:~=J:~:=~::~:. ..__L ~:~:~~:~:==::~:J
............_--___ __ !.._ _ .
....................015 _ 0.75 _ + 1.25
: ~:~~.~~~0~1:;:;]............... .:-
........................... t ..............................•
o-0.02
-0.04
~ -0.06(J,o~ -0.08.>; -0.1
-0.12
-0.14
-0.16
Figure 7.1: Decay constant for BOD5 with distance
7.2.2 Chemical Oxygen Demand (COD)
Highest amount of COD (21 mg/I) was found at the discharging point of waste into the
Lakhya River and was found decreasing with distance at the down streams. The decay rate
was found 0.12/km. According to Bangladesh standards for drinking purpose the COD
80

concentration limit is 4 mg/1. This implies that the concentration of COD of the Lakhya
River water is not suitable for drinking, industrial or irrigation purposes.
Qstance in km
.................+.. _ i- •••••••
1.25
••••••••••• j ••••••_-_ - .•.• _••••_.. _ .....• _ ••_ •••• ~
0.75
... _-+
...............................?l~._ .
............... _ ;..._ .
.......... __ .....•...• _ ..-•....... ;._---_ .....,
..•..•_.. _........... . __•...__ .. j............. . __•.•..•••.•••.•_. __ +
o-0.02
-0.04
-;;r -0.06enSi -008
.0.1
-0.12
-0.14,
.............................•.....
Figure 7.2: Decay constant for CODwith distance
7.2.3 Total Ammonia (NBJ-N+ NRt-N)
Highest amount of Total Ammonia (1.2 mg/I) was found at the discharging point of waste
into the river Lakhya River and was found decreasing with distance at the down streams. The
decay rate was found 0.17/km. Ammonia as nitrogen (NH3-N) should be 5 mg/I before
discharging into inland water but for drinking purpose the limit is 0.5 mg/1. Fertilizer
factories are the major sources of Ammonia as nitrogen (NHrN) in our study area; so the
Polash and Ghorasal fertilizer factories dominate the concentration of Ammonia as nitrogen
(NH3-N) of the Lakhya River water.
Qstance in km
............ _._ ,:-.... . _ _-_ ......•....• _._ ;.._........ . _._ .._._ _ _ ......•_.~j ! !.............._ t _ _..i -- - _ ~
.........! ~
11,25......... -f- .•.......•.. _ .•.••......••........... __ +. . j •••••••••••• a 1756 ..{
i.................-i.. .... _...........;. y; ~ 0.811 ;.1...0;5 0.{'5..
o-0.02 .
-0.04
-0.06
'<> -0.08en~ -0.1.£ -0.12
-0.14
-0.16-0.18-0.2
Figure 7.3: Decay constant for NH3-Nwith distance
81

7.3 Relationship between River flow and Concentration of Total Ammonia
Up stream (Sampling point-I)The flow ofLakhya River at sampling point-l varied 581. 732-1032.429 m3/s (824:t155 m3/s)
and the concentration of total Ammonia varied 0.685-0.71 mg/1. From the figure 7.4 it is seen
that the relationship between up stream river flow and concentration of total Ammonia is
inversely proportional. Monthly average concentration of Total Ammonia generated from this
equation (Table A7.1).
..•.. +
,...........).. . ; y = -6E-05x + 0.7482
R2 = 0.9082
0.75E'Cl.s 0.73~2••~ 0.71CD
•••0::'0 0.69.1Il<::og 0.67«
,
..__.....+
.....•.... ,
........•...•••.•...•••••••••.••.•.•.•. -- .. f
,.........•..•••...••.••................... ,....
....... f
..................................f ..
,. .,.
,. .. 1 .....•...•... _ .. _ .••••• _ ••_ •.....•. -1"
: 0
.............................! + ..............•.
,,................• -............... _ ...-. __ ..._-_._. __ ...
j ....• m •••••••••••••••••••••••••••••••••
iii~ 0.65
SOO 600 700 800River flow (rri'ls)
900 1000 1100
Figure 7.4: Relationship between River flow and Total Ammonia concentration at samplingpoint-l
Down stream (Sampling point-9)
The flow of Lakhya River at sampling point-9 varied 583.266-1034.22 m3/s (826:t155 m3/s)
and the concentration of total Ammonia varied 0.95-1.15 mg/1. From the figure 7.5 it is seen
that the relationship between down stream river flow and concentration of total Ammonia is
inversely proportional. Monthly average concentration of Total Ammonia generated from this
equation (Table A7.2).
~ 1.2""OlE';:' 1.15CD
~ 1.1CD
•••e: 1.05o.1Il<::
~E« 0.95Cii
~ 0.9500 600 700
,
.............1 .
800 900River flow (rri'ls)
...............y = -O.OOO4x+ 1.4218'
R2 = 0.9771
1000 1100
Figure 7.5: Relationship between River flow and Total Ammonia concentration at samplingpoint-9
82
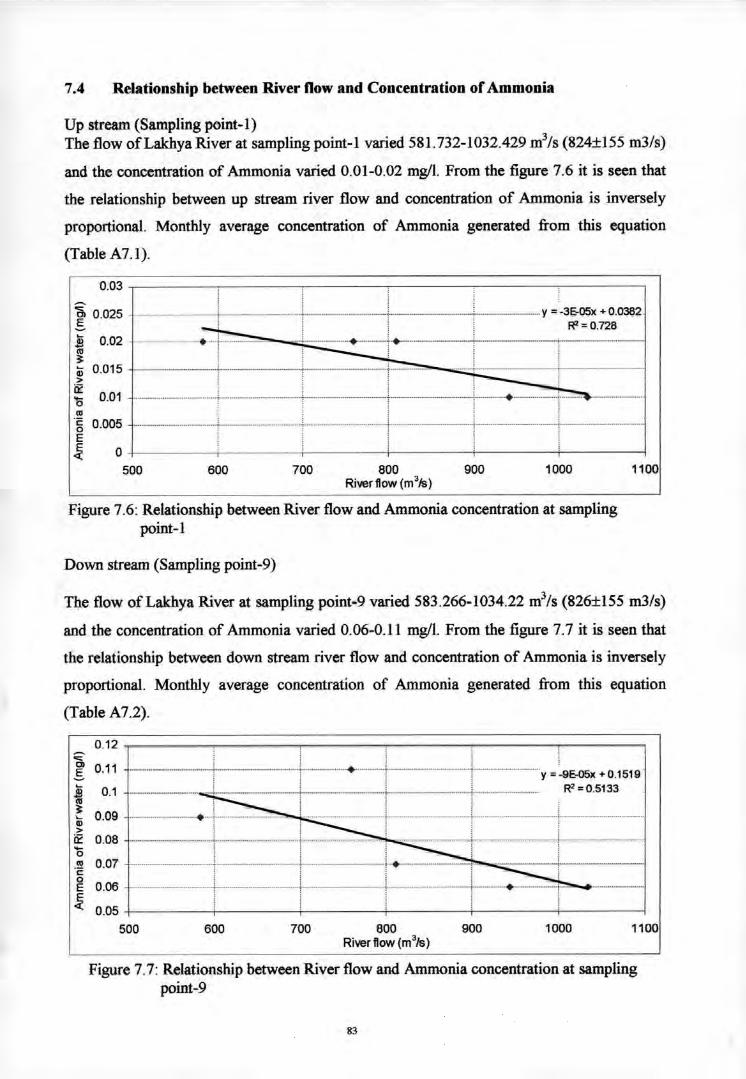
7.4 Relationship between River flow and Concentration of Ammonia
Up stream (Sampling point-I)The flow of Lakhya River at sampling point-I varied 581.732-1032.429 m3/s (824:t155 m3/s)
and the concentration of Ammonia varied 0.01-0.02 mg/1. From the figure 7.6 it is seen that
the relationship between up stream river flow and concentration of Ammonia is inversely
proportional. Monthly average concentration of Ammonia generated from this equation
(Table A7.1).
11001000900
••••••• _._ •••••••••••••••••••••••••••• __ •••• ••• 1••• _ •• _ ••••••••••• _ ••••••••• _ •••••• -
i
. ':" j .
,......................+ i _ _ j ..•..
700
""'-"----f'"
600
,_.._--~.._..__ _.._..-. . ..- ..-- --f.---- - ..--- ---.-..... "''1" ••••••_._ •••••
............1 -:- .
,......_ ..;-............ .•..._ •........ .;.. _ ..•.• j.......•......._ _ --;- ....................•.... y = .3E-05x + 0.0382
R" = 0.728
~~ 0.025
0.03
~ 0.02.2l'"~;;; 0.015>Ii:
0.01•...0
'"'1: 0.0050E
~ 0500 800
River flow (m31s)
Figure 7.6: Relationship between River flow and Ammonia concentration at samplingpoint-l
Down stream (Sampling point-9)
The flow of Lakhya River at sampling point-9 varied 583.266-1034.22 m3/s (826:t155 m3/s)
and the concentration of Ammonia varied 0.06-0.11 mg/1. From the figure 7.7 it is seen that
the relationship between down stream river flow and concentration of Ammonia is inversely
proportional. Monthly average concentration of Ammonia generated from this equation
(Table A7.2).
0.12
1000 1100
y =.9E.05x +0.1519R2 = 0.5133
.............. ;..•.....
......._ + _ +.- _-_.•......
700
......._.1 _ .
.._.~----_._.._-_ _._ _ .._~._.
600
--... -t--- ... ----..-
".-.----------------------- -----------+-------------_ ..,.- ... -_._..-------1
..._ _.......•.+..0.1
0.05500
0.06
0.08
800 900River flow (m3/s)
Figure 7.7: Relationship between River flow and Ammonia concentration at samplingpoint-9
'0'" 0.07'1:oEE«
::;:g 0.11
I;;; 0.09>Ii:
83

7.5 Relationship between River flow and Concentration of Ammonium
Up stream (Sampling point-I)The flow ofLakhya River at sampling point-l varied 581. 732-1032.429 m3/s (824:t155 m3/s)
and the concentration of Ammonium varied 0.67-0.69 mg/1. From the figure 7.8 it is seen that
the relationship between up stream river flow and concentration of Ammonium is inversely
proportional. Monthly average concentration of Ammonium generated from this equation
(Table A7.1).
0.7 -r-----~----.,------~---~----_,----___,
.........._ ,......................•......_ _....................................•............_ _..y = -4&05x + 0.7174R2 - 0.7913
..... __ _ ; _ _ _ _. ....•._ __ . ~......... . _ __ .
~oS 0.69~~~ 0.68 .W>0::0.67..
-J......•.•••••••.••.•.. - •.••..•.. t .....
. + •...... ... ,._ .._ ......•- , ._-_ __ _ - .
-..........•...... _ .
11001000900700600
.......... _ _ ; -_ 1. _-_ _ ..........•............... - .
800River flow (m3/s)
Figure 7.8: Relationship between River flow and Ammonium concentration at samplingpoint-l
0.65-l-----+-----+-----f-----+-----+t------i500
(;E::> 0.66'coEE<{
Down stream (Sampling point-9)
The flow of Lakhya River at sampling point-9 varied 583.266-1034.22 m3/s (826:t155 m3/s)
and the concentration of Ammonium varied 0.89-1.06 mg/1. From the figure 7.9, it is seen
that the relationship between down stream river flow and concentration of Ammonium is
inversely proportional. Monthly average concentration of Ammonium generated from this
equation (Table A7.2).
1.1
1000 1100
y = .0.OO04x + 1.2699 ....R2 = 0.9875
900700600 800River flow (m3/s)
Figure 7.9: Relationship between River flow and Ammonium concentration at samplingpoint-9
~2'"3:~ 0.950::~ 0.9::>.~0.85E~ 0.8
500
~Ol.s 1.05
84

7.6 Relationship between River flow and Concentration of BODs
Up stream (Sampling point-1)
The flow of Lakhya River at sampling point-l varied 581.732-1032.429 m3/s (824:t155 m3/s)
and the concentration of BODs varied 8-11 mg/l. From the figure 7.10, it is seen that the
relationship between up stream river flow and concentration of BOD~ is inversely
proportional. Monthly average concentration of BODs generated from this equation (Table
A7.1).
12
'a; 11.s~~ 10~Q;.:.: 9a::'0r::f' 8oaJ
,•••••••••••••••••••••••••••• 1•••••• _ ••••••••••• .... f
....•.. f
.................................l......... . y = .0.0073x + 15.205.If' = 0.9381
............. i.................... . ~ .
I I_ .._.--f .._._._....._...-_....-_...-- ..f ...•.. _._._ ... __ 0._.__ •.•-
110010009007006007500 800
River flow (rri'/s)
Figure 7.10: Relationship between River flow and BODs concentration at sampling point-I
Down stream (Sampling point-9)
The flow of Lakhya River at sampling point-9 varied 583.266-1034.22 m3/s (826:t155 m3/s)
and the concentration of BODs varied 0.89-1.06 mg/!. From the figure 7.11, it is seen that the
relationship between down stream river flow and concentration of Ammonium is inversely
proportional. Monthly average concentration of BODs generated from this equation (Table
A7.2).
14
y = -0.0056x + 15.989R2 = 0.7157
9
500 600 700 800River flow (m3/s)
900 1000 1100
Figure 7.11: Relationship between River flow and BODs concentration at sampling point-9
85
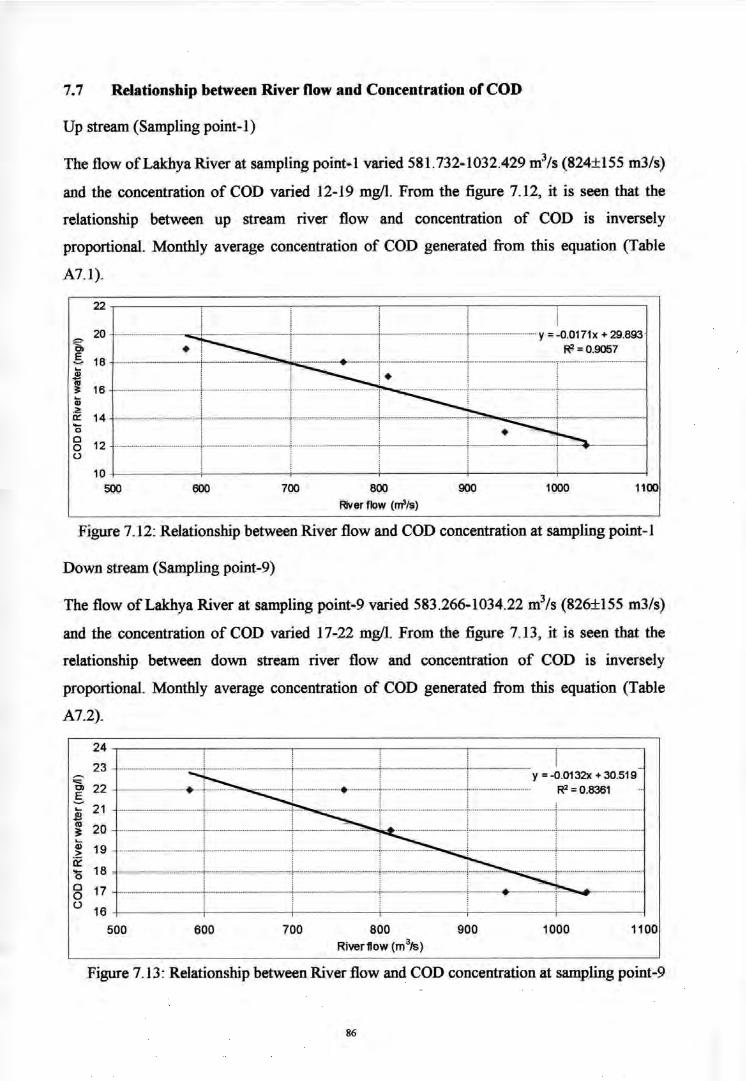
7.7 Relationship between River flow and Concentration orCOD
Up stream (Sampling point-I)
The flow of Lakhya River at sampling point-l varied 581.732-1032.429 m3/s (824:t155 m3/s)
and the concentration of COD varied ]2-]9 mg/1.From the figure 7.12, it is seen that the
relationship between up stream river flow and concentration of COD is inversely
proportional. Monthly average concentration of COD generated from this equation (Table
A7.1).
22
11001000
y = -0.0171 x + 29.893R2 = 0.9057
900700 800River flow (m'/s)
Figure 7.12: Relationship between River flow and COD concentration at sampling point-I
20~ •.s 18 ................. _---_ ....._-~2'";: 16Q;.<!:n: 14'00 120()
10500 600
Down stream (Sampling point-9)
The flow of Lakhya River at sampling point-9 varied 583.266-1034.22 m3/s (826:tl55 m3/s)
and the concentration of COD varied] 7-22 mg/1.From the figure 7.13, it is seen that the
relationship between down stream river flow and concentration of COD is inversely
proportional. Monthly average concentration of COD generated from this equation (Table
y = -0.0132x + 30.519R2 = 0.8361
A7.2).
2423
"" 22Clg~ 212'" 20;:Q; 19>ii:.•... 180
0 170() 16
500 600 700 800River flow (m3/s)
900 1000 1100
Figure 7.13: Relationship between River flow and COD concentration at sampling point-9
86

7.8 Relationship between River flow and Concentration of Total Solids
Up stream (Sampling point-])
The flow of Lakhya River at sampling point-] varied 581.732-1032.429 m3/s (824:t]55 m3/s)
and the concentration of TS varied 179-247 mg/I. From the figure 7.14, it is seen that the
relationship between up stream river flow and concentration of TS is inversely proportional.
Monthly average concentration of TS generated from this equation (Table A7.1).
= -0.1413x + 317.12-R2 = 0.7756
250 •240
12: 230Ol
.5-~ 220 ............•....•..••.2lU;: 210~.2: 2000::b 190 ...........................enI-
180
170500 600 700 800
River flow (m'/s)
900 1000 1100
Figure 7.14: Relationship between River flow and TS concentration at sampling point-I
Down stream (Sampling point-9)
The flow of Lakhya River at sampling point-9 varied 583.266-1034.22 m3/s (826:tl55 m3/s)
and the concentration of TS varied 237-298 mg/I. From the figure 7.] 5, it is seen that the
relationship between down stream river flow and concentration of TS is inversely
proportional. Monthly average concentration of TS generated from this equation (Table
A7.2).
310
300
240
230500
y = -0.1318x + 376.52........ -+ R2 = 0.8594
11001000
................................ _-_ ...•,
900800River flow (m3/s)
700600
~E 290
~ 2802~ 270~~ 260~'0 250(f)I-
Figure 7.15: Relationship between River flow and TS concentration at sampling point-9
87

7.9 Relationship between River flow and Concentration of Total Dissolved Solids
Up stream (Sampling point-I)
The flow of Lakhya River at sampling point-l varied 581.732-1032.429 m3/s (824:tl55 m3/s)
and the concentration of IDS varied 141-228 mg/1. From the figure 7.16, it is seen that the
relationship between up stream river flow and concentration ofTDS is inversely proportional.
Monthly average concentration ofTDS generated from this equation (Table A7.1).
235•
y = -0.1613x + 303.67R2=0.6583
E" 215g~ 195••~Ii;.2: 175a::'0:g 155•....
135
500 600 700
•800
River flow (rn'/s)
900 1000
•1100
Figure 7.16: Relationship between River flow and TDS concentration at sampling point-1
Down stream (Sampling point-9)
The flow of Lakhya River at sampling point-9 varied 583.266-1034.22 m3/s (826:t155 m3/s)
and the concentration ofTDS varied 192-271 mg/l. From the figure 7.17, it is seen that the
relationship between down stream river flow and concentration of IDS is inversely
proportional. Monthly average concentration of IDS generated from this equation (Table
y=-0.181x+371.14.R2 = 0.9589
A7.2).
280•~ 260'".s~
E 240'";;::;; 220>0:::.•..0(/) 2000f-
180500 600 700 800
River flow (m3/s)900 1000 1100
Figure 7.17: Relationship between River flow and TDS concentration at sampling point-9
88

7.10 Comparision of Correlation co-efficient of Different Water Quality Parameters
Sampling Water Quality Parameters
Location point Total NH3-N NH4-N BODs COD TS TDSNH3-N
Up stream 1 0.90 0.73 0.79 0.94 0.90 0.78 0.66
Down stream 9 0.97 0.51 0.98 0.72 0.84 0.86 0.96
From the above comparision it is noted that generated equation best suited in the up stream
for Total Ammonia, Ammonia, Biochemical Oxygen Demand (BOD), and Chemical Oxygen
Demand and in the down stream for Ammonium. Total Solids, and Total Dissolved Solids.
7.11 Comparision between up stream and down stream water quality parameters
7.11.1 Total Ammonia (NH3-N)
The Total Ammonia concentration varied 0.67-0.75 mg/I in sampling point-l and 0.87-1.42
mg/l in sampling point-9. Maximum concentration occurred in February (0.75 mg/l in point-l
and 1.42 mg/I in point-9) and minimum in August (0.67 mg/I in point-I and 0.87 mg/I). The
maximum impact occurred in February where the increase of Total Ammonia concentration
is 0.67 mg/l and the minimum in August where the increase of Ammonia concentration is
0.21 mg/l. The comparision of Total Ammonia concentration between up stream (sampling
point-I) and down stream (sampling point-9) are shown in Figure 7.18 and 7.19
19Up stream (sarTl'ling point-1) II Dow n stream (sarTl'ling point-9)
1.50
'0c 1.35.g~E'"E Cl 1.20'" E0-8 .~1.05
'" g1? ~ 0.90'"~~ 0.75.c"E~ 0.60
..... .........
I
..........
......... .........•.
L ,.......... ......
r r I, ~ ~.f
~ r r r r rOct-06 Nov-06 !Rc-06 Jan-07 Feb-07 Mu-07 Apr-07 May-07 Jun-07 Ju~07 Aug-07 Sep-07
Ivt:>nth
Figure 7.18: Comparision of Total Ammonia concentration (simulated) between up streamand down stream
89

1:1Upstream (salllliing point-1) • Down stream (salllliing point-9)
~ 1.50I-ac: 1.35B'" ~~ g. 1.20g~8 .~1.05
'" EOlE~« 0.90
~~ 0.75.c:~::;; 0.60
n ROct-06 Nov-06 Dec-06 Jan-07 Fetr07 M!r-07 Apr-07 M!y-07 Jun-07 JuI-07 Aug-07 Sep-07
Month
Figure 7.19: Comparision of Total Ammonia concentration (observed) between up streamand down stream
7.11.2 Ammonia (NHrN)
The Ammonia concentration varied 0-0.04 mg/l in sampling point-l and 0.03-0.15 mg/l in
sampling point-9. Maximum concentration occurred in February (0.04 mg/l in point-l and
0.15 mg/I in point-9) and minimum in August (0 mg/I in point-l and 0.03 mg/I in point-9).
The maximum impact occurred in February where the increase of Ammonia concentration is
0.11 mg/I and the minimum in August where the increase of Ammonia concentration is 0.03
mg/L The comparision of Ammonia concentration between up stream (sampling point-I) and
down stream (sampling point-9) are shown in Figure 7.20 and 7.21
IJ Upstream (salllling pont-1) • Down stream (salllling point-9)
ac:
~"E~",,,,g 11'0-o .!!l'" c:010
'" E:;;E~«~Co::;;
0.16
0.14
0.12
0.10
0.08
0.06
0.04
0.02
0.00
I......> ••• _ ••••
...•._ ... I................
.......... ...... .........
•• __ 0 ••
........
:j ..1..IJj......
JL ...... -m •j I
Oct-Q6 Nov-06 Dec-06 Jan-07 Fetr07 M!r-07 Apr-07 M!y-07 Jun-Q7 Ju~07 Aug-07 Sep-07Month
Figure 7.20: Comparision of Ammonia concentration (simulated) between up stream anddownstream
90

CUp slream(salll>ling point-l) • Qlw n stream(salll>ling point-g)
0.16
0.14
0.12
0.10
0.08
0.06
0.04
0.02
0.00r~ fl
Oct-06 Nov-06 Dec-06 Jan-07 Feb-07 Mar-07 Apr-07 May-07 Jun-07 Jul-07 Aug-07 Sep-07MJnth
Figure 7.21: Comparision of Ammonia concentration (observed) between up stream anddown streanl
7.11.3 Ammonium (NH4-N)
The Ammonium concentration varied 0.66-0.72 mg/l in sampling point-1 and 0.72-1.27 mg/l
in sampling point-9. Ma:<imum concentration occurred in February (0.72 mg/l in point-1 and
1.27 mg/l in point-9) and minimum in August (0.66 mg/l in point-1 and 0.72 mg/l in point-9).
The maximum impact occurred in February where the increase of Ammonium concentration
is 0.55 mg/l and the minimum in August whcre the increase of Ammonium concentration is
0.06 mg/I. The comparision of Ammonium concentration between up stream (sampling point-
1) and down stream (sampling point-9) are shown in Figure 7.21 and 7.22........................ _ - -_.- ..__ _ - _ -..__ .-_ ...................................................................................•..... ,
cUp stream(salll>ling point-l) • Qlwn stream(safllliing poinl-g)...................•.••. ........ ...................... ...._ .. ........ __ ..... -_ ...................... _-_ .._-_ .............. .............. ......... ........ .............•...••••••.• ........ .............•. ........ ..............
I::::::::::...... .
.... .........
..._ .... ..•.. .....•.... ._.. ..._ ....
....... - ......- ....• ........
...•..... .....•. _ ......
......•..
..... j , ......
ITr; r;;] r:I j ....... ..1 • ......
Iii T' ~I bl 1:1 I~ r1 R
1.32 ;
0.60
"0<:: 1.24,g£: ~ 1.16<:: '"1l g' 1.08<:: ~8 E 1.00Q) .;;1~ ~ 0.92Q) E~ « 0.84
~ 0.76~~ 0.68
Ocl-06 Nov-OS Dec-OS Jan-07 Feb.07 Mar-07 Apr-07 May-07 Jun-07 Ju~07 Aug-07 Sep-07MJnth
Figure 7.21: Comparision of Ammonium concentration (simulated) between up stream anddown stream
91
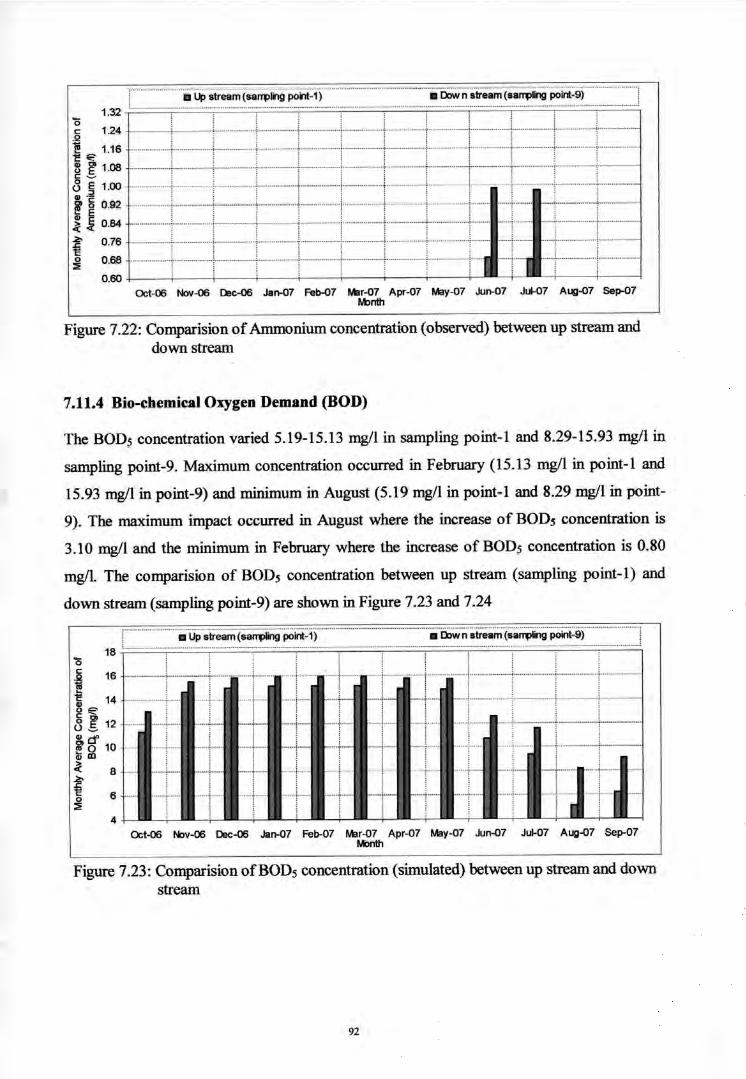
1.32(;c 1.24t E' 1.16~ g' 1.08c _o~ .~ 1.00
lir a 0.92~ E~ ~ 0.84
~ 0.76"E~ 0.68
0.60
13Up stream (salTllling point-1) • Down stream (sampling point-9)
........... .. ..........
....__ .. ....
IIIOCt-06 Nov-Q6 Dac-06 Jan-07 Feb-07 Mar-07 Apr-07 May-07 Jun-07 Jul-07 Aug-07 sep-07
Mlnth
Figure 7.22: Comparision of Ammonium concentration (observed) between up stream anddown stream
7.11.4 Bio-chemical Oxygen Demand (BOD)
The BODs concentration varied 5.19-15.13 mg/I in sampling point-I and 8.29-15.93 mg/I in
sampling point-9. Maximum concentration occurred in February (15.13 mg/I in point-I and
15.93 mg/I in point-9) and minimum in August (5.19 mg/I in point-I and 8.29 mg/I in point-
9). The maximum impact occurred in August where the increase of BODs concentration is
3.10 mg/I and the minimum in February where the increase of BODs concentration is 0.80
mg/L The cornparision of BODs concentration between up stream (sampling point-I) and
down stream (sampling point-9) are shown in Figure 7.23 and 7.24
8
6
14
............ ................. _ .... ............................. ... ..__ ........................••....
....... ....... ....... .......rt.....................•• ...... ...... ....... ...... ...... ..._.
...... ...... ....... ....... ....... ....... ...... r-.....- •..... ....... ........ ,I...... ..... ..... ....... ....•. ..•.... ....... ..... ..... 1 .. -
...... ....... ....•.. ........ ...... ...... [ ....•. ......
W._ .."
, ~-
• Down stream (salTllling point-9)III Upstream (sarrpling point-1)
4
18 '(;
.~ 16~"E••0=c -o g' 120_
~ go 10~ lD
J:.;,.
~o~
OCt-Q6 Nov-06 Dac-06 Jan-07 Feb-07 Mar-07 Apr-07 May-07 Jun-07 Jul-07 Aug-07 Sep-07Mlnth
Figure 7.23: Comparision of BODs concentration (simulated) between up stream and downstream
92

D Upstream (sarTllling point-1) • Down stream (sarTllling point-9)d' 182'0 16c0~ 14~,,~
12gl::::o ~()~
10"C>I!!" 8~.b 6.c1::0:E 4
•-~
IOct..Q6 Nov-Q6 Dec-OS Jan-{)7 Feb-07 Mar-{)7 Apr-07 May-{)7 Jun-07 Jul-07 Aug-07 Sep-{)7
Month
Figure 7.24: Comparision of BODs concentration (observed) between up stream and downstream
7.11.5 Chemical Oxygen Demand (COD)
The COD concentration varied 6.43-29.71 mg/l in sampling point-l and 12.36-30.38 mg/l in
sampling point-9. Maximum concentration occurred in February (29.71 mg/I in point-l and
30.38 mg/l in point-9) and minimum in August (6.43 mg/l in point-l and 12.36 mg/l in point-
9). The maximum impact occurred in August where the increase of COD concentration is
5.93 mg/l and the minimum in February where the increase of COD concentration is 0.67
mg/L The comparision of COD concentration between up stream (sampling point-I) and
down stream (sampling point-9) are shown in Figure 7.25 and 7.26
a Upstream (sampling point-1) • stream (sarTlling point-9)
Oct-OS Nov-OS Dec-OS Jan-07 Feb-07 Mar-{)7 Apr-07 May-{)7 Jun-07 Jul-07 Aug-07 Sep-{)7Month
Figure 7.25: Comparision of COD concentration (simulated) between up stream and downstream
93
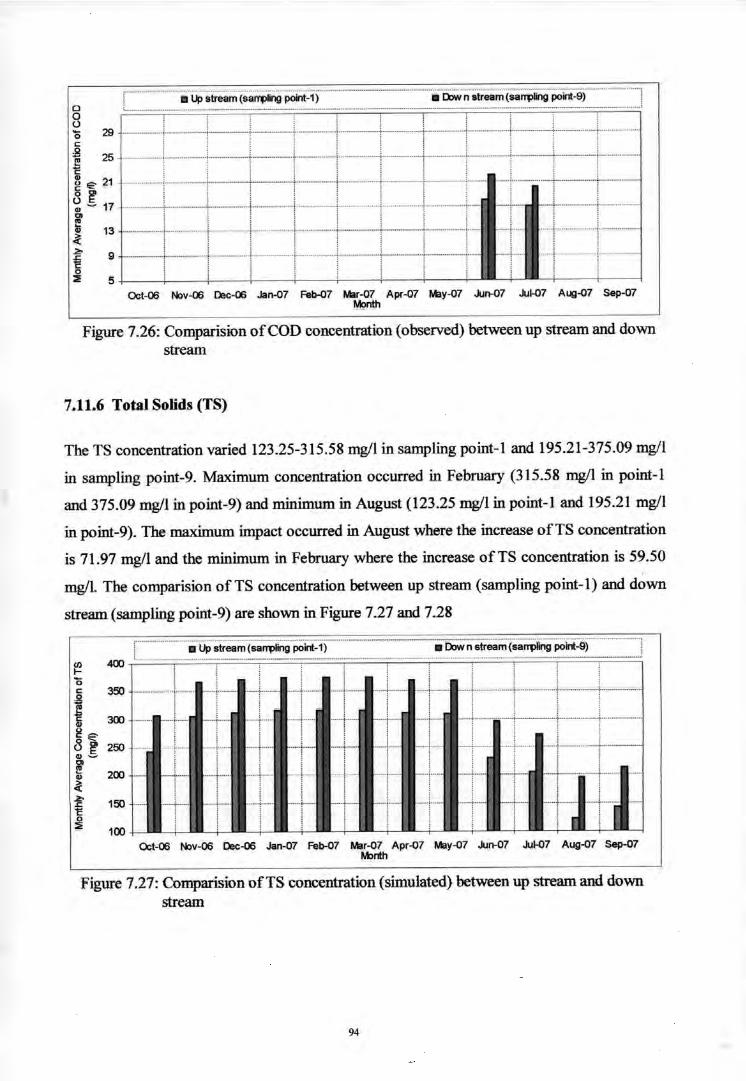
5
9
oo()'0 29c::B 25E"E8 c:- 21c:-o ~~ ~ 1701
E'" 13~""'~o::;:
l:l Upslream (sarrplingpoinl-1) II Down slream (sarrptingpoint-9)
.......... ........
.............•.••.•.. .•................ ...._ .._ ..•..._---
.•.•...•. ...__ ....•...•-
OcI.06 Nov-06 IRc-06 Jan-Q7 Feb-Q7 Mar-07 Apr-07 May-07 Jun-07 Jul-07 Aug-Q7 Sep-07Monlh
Figure 7.26: Comparision of COD concentration (observed) between up stream and downstream
7.11.6 Total Solids (TS)
The TS concentration varied 123.25-315.58 mg/l in sampling point-l and 195.21-375.09 mg/I
in sampling point-9. Maximum concentration occurred in February (315.58 mgll in point-l
and 375.09 mg/I in point-9) and minimum in August (123.25 mg/I in point-l and 195.21 mg/I
in point-9). The maximum impact occurred in August where the increase ofTS concentration
is 71.97 mg/I and the minimum in February where the increase ofTS concentration is 59.50
mg/I. The comparision of TS concentration between up stream (sampling point-I) and down
stream (sampling point-9) are shown in Figure 7.27 and 7.28.................. -_ .._----_ _ _ -•....._- .
Il Upslream (sarrpling poinl-1)
400
350
300
250
200
150
100
t •._. ..••. _ .•.....•.•..•........... _._ ..... _ •.•_
OcI-06 Nov-06 IRc-Q6 Jan-07 Feb-07 Mar-07 Apr-Q7 May-Q7 Jun-07 Jul-07 Aug-Q7 Sep-07Monlh
Figure 7.27: Comparision ofTS concentration (simulated) between up stream and downstream
94

en 400l-ec: 350:B~1: 300.,0c: c:-8g. 250.,~Cl
~ 200.,~2:- 150.c1:0::. 100
D Up stream (sarT1ling point-1) •Down stream (sarT1lling point-9)
.... ..........
........... ........ .......... _ ......- .............. __ ...
..................... ....... ...... " .. ........... __ ..
'-+--Oct-Q6 Nov-06 Dec-06 Jan-07 Feb-07 Miu-07 Apr-07 May-07 Jun-07 Jut-07 Aug-07 Sep-07
M:lnth
Figure 7.28: Comparision ofTS concentration (observed) between up stream and downstream
7.11.7 Total Dissolved Solids (TDS)
The TDS concentration varied 82.35-301.91 mg/l in sampling point-l and 122.15-369.17
mg/I in sampling point-9. Maximum concentration occurred in February (301.91 mg/l in
point-l and 369.17 mgll in point-9) and minimum in August (82.35 mgll in point-l and
122.15 mg/l in point-9). The maximum impact occurred in February where the increase ofTS
concentration is 67.26 mgll and the minimum in August where the increase of TDS
concentration is 39.80 mg/l. The comparision of TDS concentration between up stream
(sampling point-I) and down stream (sampling point-9) are shown in Figure 7.29 and 7.30
50
~ 400l-e 350c:
~ 3001:.,g E' 2508 ~~~2oo~~ 150
{ 100o::.
EI Up stream (sarT1lling point) • Dow n stream (sampling point-9)
Oct-06 Nov-06 Dec-06 Jan-07 Feb-07 Mar-07 Apr-07 May-07 Jun-07 Jut-07 Aug-07 Sep-07M:lnth
Figure 7.29: Comparision ofTDS concentration (simulated) between up stream and downstream
95

CUp stream(sa""ling point-l) • Down stream(samplingpoint-9)
CIl 4000I-'0 350c:.Il~ 300C'"o ~ 250c:"'"8 g'"'~ 200'"!!'" 150~2-
100£c:0::;; 50
............ ....... .......
.............•••.... ,.........•.•••.......•....
~
~ ~, II I
OCt-Q6 Nov-Q6 Dec-06 Jan-O? Feb-O? Mar-O? Apr-O? May-O? Jun-O? Ju~O? Aug-O? Sep-O?Month
Figure 7.30: Comparision ofTDS concentration (observed) between up stream and downstream
7.12 Relationship between Temperature and Dissolved Oxygen along the LakbyaRiver
Oxygen is both added and removed from water. Water gains oxygen from the atmosphere and
from plants as a result of photosynthesis. In addition, the churning of running water helps add
dissolved oxygen. Respiration (breathing) by aquatic animals, decomposition, and various
chemical reactions, consume oxygen from the water body. If more oxygen is consumed than
is produced, dissolved oxygen levels decline and some sensitive animals may move away,
weaken or die. Dossolved oxygen levels vary with water temperature, altitude, depth, daily
and seasonal cycles and discharge. For example, water at high altitudes holds less oxygen due
to lower atmospheric pressure_ Warm water holds less oxygen than cold water. Dissolved
oxygen levels change with the seasons as the temperature of the changes. Relationship
between temperature and Dissolved Oxygen are shown in Figure 7.31
--Sampling point-l --Sampling point-6 --Samp~ng point-8 --Sampling point-9
.............•'.!.......... l............ . __.!.......... . !.._.._.... . _.-1... . _..-}.......... . _-_.._ _-
.•...•.•..•••••• j .•••••••...........•••••• ; ••.•.•..........•..••••• l i . ....~ _ f .
32.532
.... + .
,-_ .:. ..__ .._----_ _ .._-
31.5
...............1
3129.5 30 30.5Temperature ('C)
2926.5
5
4.8 ............ ,
~ 4.6!....... +
c:'"'" 4.4,..cS1l 4.2.2:0
'" 4.!Il0
3.8
3.62?5 28
Figure 7.31: Relationship between Temperature and Dissolved Oxygen along the Lakhya
River
%

7.13 Percent Saturation of Dissolved Oxygen along the Lakhya River
The percent saturation of Dissolved Oxygen was 54-60 % (57.8:1:2.039 %) in the sampling
point-I. In the sampling point-6 it was 52.5-56 % (54.3:1:1.16 %) due to pollution load
discharged from sampling point-5. In the sampling point-8 it was 50-53 % (51.8:1:0.98 %) due
to pollution load discharged from sampling point-4 and 7. For the dilution factor the pollution
load reduced in the sampling point-9, the percent saturation of DO increase in that point and
it was 52-54 % (52.9:1:0.73%). The percent saturation of Dissolved Oxygen along the Lakhya
River are shown in Figure 7.32 and Table A7.4....__ __ .__ __ __ -_ _.............. .............•..... . ..............•........... _ -_ .._--_ _--_ _--,
-+- 15/0612007 __ 22/0612007 __ 29/0612007 -.- 0610712007 -+-13/07/2007!63!--------------....------------------------------------------------------------------------------------------ .1
4 5 6 7 8 9 10SarJllling point I
Figure 7.32: Variation of percent saturation of Dissolved Oxygen along 'the Lakhya
River
~60
8 57'0l:_2i! 54
"8l51
480 2 3
97

7.13 Development oflndustrial Policy from Impact of Emuent
7.13.1 Ammonia
Minimum impact of effiuent occurred in August where Ammonia load discharged from
industry is 0.23 times of upstream load of Ammonia. On the other hand maximum impact
occurred in February where Ammonia load discharged from industry in 25.86 times of
upstream load of Ammonia. From this analysis it is easy to determine the load of Ammonia at
the down stream. From the expected load at the downstream the authority could formulate the
policy I) to permit the maximum load of Ammonia discharged from industry 2) The number
of industry will permit for sustainable developement in respect of Ammonia
Contribution ofTotal Jlmmonia from fertili:rer fac1Dries in1Dthe Lakhya River
2800
~2400
-c 2000'"0...J.!!l 1800c0E 1200E<{
~ 800I-
400
0
-'--/' ~
/ \/ \
..__ ............ J ,\ ..........._._.-
/ \ ...__ ......_--/ ,
./
~~
...._-----
i"""-..,~
Oct..Q6 Nov..Q6 Dec-Q6 Jan-O? Feb-O? Mar-o? Apr-o? May-O? Jun-O? Ju~O? Aug-O? Sep-Q?Month
Figure 7.33: The load of Ammonia as percent of upstream load discharged from fertilizerfactories into the Lakhya River
7.13.2 Ammonium
Minimum impact of effiuent occurred in August where Ammonium load discharged from
industry is 0.11 times of upstream load of Ammonium. On the other hand maximum impact
occurred in February where Ammonium load discharged from industry in 13.35 times of
upstream load of Ammonium. From this analysis it is easy to determine the load of
Ammonium at the down stream. From the expected load at the downstream the authority
could formulate the policy I) to permit the maximum load of Ammonium discharged from
industry 2) The number of industry will permit for sustainable developement in respect of
Ammonium
98

Contribution of Ammonium from fertilizer factories into the Lakhya River1400
1200~~ 1000"0
'".9 800E:J"E 6000E~ 400
200
a
i/ '\L \
:1 \
) \
I \././ \.
~ '~•.••.....:Oct-06 Nov-OS Dec-OS Jan-D? Feb-a? Mar-a? Apr-D? May-a? Jun-O? Jul-O? Aug-a? Sep-O?
Mlnth
Figure 7.34: The load of Ammonia as percent of upstream load discharged from fertilizerfactories into the Lakhya River
7.13.2 Biochemical Oxygen Demand (BOD)
Minimum impact of effiuent occurred in September where BODs load discharged from
industry is 0.0047 times of upstream load of BODs. On the other hand maximum impact
occurred in February where BODs load discharged from industry is 0.22 times of upstream
load of BODs. From this analysis it is easy to determine the load of BODs at the down
stream. From the expected load at the downstream the authority could formulate the policy 1)
to permit the maximum load of BODs discharged from industry 2) The number of industry
will permit for sustainable developement in respect of BODs
Contribution of BODs from fertilizer factories into the Lakhya River24
21
18
~ 15"0
'"0 12--'d' 90CD
6
3
a
.-...- .....••..
/ \/ \// i\/ \
./~ ~....••..
----('" :'""-...Oct-06 Nov-Q6 Dec-OS Jan-D? Feb-a? Mar-D? Apr-a? May-a? Jun-O? Jul-O? Aug-a? Sep-Q?
M:>nth
Figure 7.35: The load of BODs as percent of upstream load discharged from fertilizerfactories into the Lakhya River
99
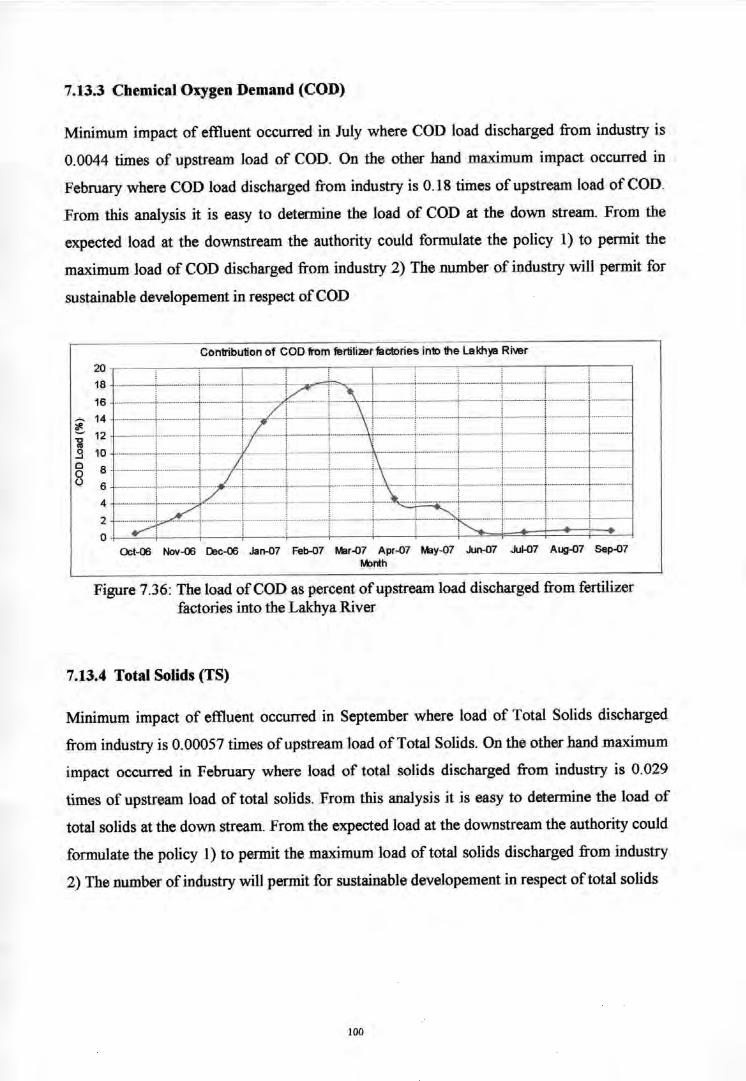
7.13.3 Chemical Oxygen Demand (COD)
Minimum impact of eftluent occurred in July where COD load discharged from industry is
0.0044 times of upstream load of COD. On the other hand maximum impact occurred in
February where COD load discharged from industry is 0.18 times of upstream load of COD.
From this analysis it is easy to determine the load of COD at the down stream. From the
expected load at the downstream the authority could formulate the policy 1) to permit the
maximum load of COD discharged from industry 2) The number of industry will permit for
sustainable developement in respect of COD
Contribution of COD from fertili2Br fac1Dries inlD the Lakhya River2018
16
14~-0 12
'".3 10o 8oo 6
4
2
a
/ "/ \I' \// \
j \/
._.-..._-_ ... ._ .....;....-
/: "---: , ,""-...
0<:1-06 Nov-06 Dec-06 Jan-07 Feb-D7 Mar-D7 Apr-07 May-07 Jun-D7 Jul-07 Aug-D7 Sep-D7Month
Figure 7.36: The load of COD as percent of upstream load discharged from fertilizerfactories into the Lakhya River
7.13.4 Total Solids (TS)
Minimum impact of eftluent occurred in September where load of Total Solids discharged
from industry is 0.00057 times of upstream load of Total Solids. On the other hand maximum
impact occurred in February where load of total solids discharged from industry is 0.029
times of upstream load of total solids. From this analysis it is easy to determine the load of
total solids at the down stream. From the expected load at the downstream the authority could
formulate the policy l) to permit the maximum load of total solids discharged from industry
2) The number of industry will permit for sustainable developement in respect of total solids
100
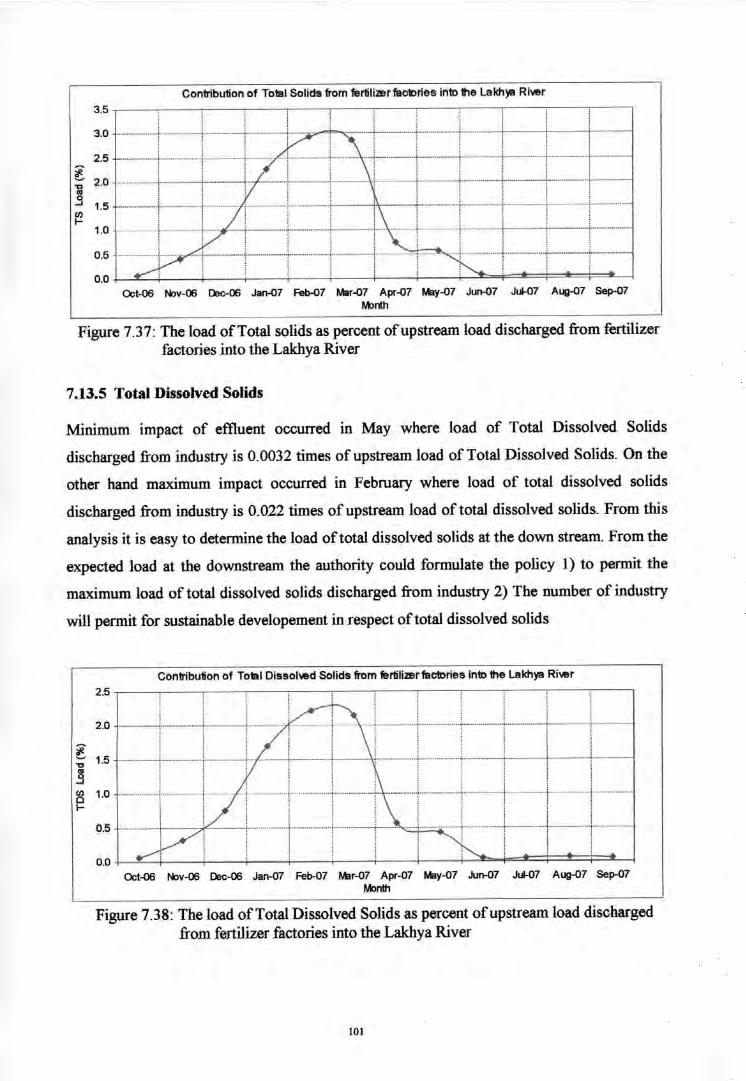
Contribution of Tolal Solids from fertili:zerfactories in1Dthe Lakhya River3.5
3.0
2.5
~ 2.0"11la-' 1.5CIlI-
1.0
0.5
0.0
,
// '\
/ \/
/\_ ... _ ..........._ ....
./' ~....-
~"- ,""-....
Oct-06 Nov-06 IRc-06 Jan-D7 Feb-D7 Mar-D7 Apr-D7 May-D7 Jun-D7 JuJ-07 Aug-D7 Sep-07~nth
Figure 7.37: The load of Total solids as percent of upstream load discharged from fertilizerfactories into the Lakhya River
7.13.5 Total Dissolved Solids
Minimum impact of effiuent occurred in May where load of Total Dissolved Solids
discharged from industry is 0.0032 times of upstream load of Total Dissolved Solids. On the
other hand maximum impact occurred in February where load of total dissolved solids
discharged from industry is 0.022 times of upstream load of total dissolved solids. From this
analysis it is easy to determine the load of total dissolved solids at the down stream. From the
expected load at the downstream the authority could formulate the poHcy 1) to permit the
maximum load of total dissolved solids discharged from industry 2) The number of industry
will permit for sustainable developement in respect of total dissolved solids
Contribution of Tolal Dissolved Solids from fertili:zer factories in1Dthe Lakhya River2.5
2.0
~ 1.5"11l.9CIl 1.0aI-
0.5
0.0Oct-06 Nov-06 IRc-06 Jan-07 Feb-07 Mar-07 Apr-07 May-07 JurHl7 Jut-07 Aug-D7 Sep-07
~nth
Figure 7.38: The load of Total Dissolved Solids as percent of upstream load dischargedfrom fertilizer factories into the Lakhya River
101
CHAPTER 8
CONCLUSION AND RECOMMENDATIONS
8.1 Conclusion
The main focus of this study was Characterization of effluent from fertilizer factories,
Estimation of water pollution load discharged from fertilizer factories, Analysis of water
quality along the Lakhya River to assess impact of fertilizer factories effluent,
Recommending interventions to minimize impact
Following are the major findings from this study: The values of effluent parameters shows inrange.
• The levels of Biochemical Oxygen Demand (BOD) were 43-60 mg/l, 24-46 mg/l,
120-148 mg/l, 21-31 mg/l, 19-53 mg/l in the effluent from sampling point-2, 3, 4, 5
and 7 respectively. The levels of Chemical Oxygen Demand (COD) were 78-86 mg/l,
43-69 mg/l, 198-234 mg/l, 37-53 mg/l, and 52-64 mg/l in the effluent from sampling
point-2, 3, 4, 5 and 7 respectively. The levels of Dissolved Oxygen (DO) were 0.65-
0.78 mg/l, 2.86-2.96 mg/l, 2.81-2.91 mg/l, 2.64-2.89 mg/l, and 2.8-3 mg/l in the
effluent from sampling point-2, 3, 4, 5 and 7 respectively. The levels of pH were 8.4-
8.9 mg/l, 8.2-8.5 mg/l, 8.8-9.3 mg/l, and 9.2-9.8 mg/l, 8.2-8.8 mg/l in the effluent
from sampling point-2, 3, 4, 5 and 7 respectively. The value of Temperature were
30.4-31 DC,33-36 DC,31-34.ic, 42-46.5°C, 38-38.6°C in the effluent from sampling
point-2, 3, 4, 5 and 7 respectively. The concentrations of Total Ammonia (NH3-N)
were 685-697.5 mg/l, 85-120 mg/l, 434-460 mg/l, 997.5-1230 mg/l, 95-147 mg/l in
the effluent from sampling point-2, 3, 4, 5 and 7 respectively. The concentrations of
Ammonia as Nitrogen (NH3-N) were 83.09-211.95 mg/l, 8.4-17.03 mg/l,112.77-
235.35 mg/l, 464.35-954.67 mg/l, and 7.61-37.85 mg/l in the effluent from sampling
point-2, 3, 4, 5 and 7 respectively. The concentrations of Ammonium as Nitrogen
(NH4-N) were 485.55-610.7 mgll, 76.6-105.44 mgll, 214.65-325.23 mg/l, 275.33-
533.14 mgll, and 87.39-110.28 mgll in the effluent from sampling point-2, 3, 4, 5 and
7 respecti:rely. The concentrations of Total Solids (TS) were 112-183 mgll, 45-90
mgll, 154-247 mgll, 215-274 mgll, and 389-459 mgll in the effluent from sampling
point-2, 3, 4, 5 and 7 respectively. The concentrations of Total Suspended Solids
(TSS) were 27-47 mgll, 13-23 mgll, 30-84 mgll, 17-67 mgll, and 129-179 mgll in the
102

effluent from sampling point-2, 3, 4, 5 and 7 respectively. The concentrations of Total
Dissoved Solids (TDS) were 85-136 mg/l, 26-69 mg/l, 111-190 mg/1, 176-211 mg/1,
and 252-303 mg/l in the effluent from sampling point-2, 3, 4, 5 and 7 respectively.
• From the experimental data it' was observed that among all of the wastewater
characteristics DO, Total Ammonia, Ammonia, Ammonium exit the standard limit
and pH, Temperature, BOD5, COD, TS, TSS, and TDS near or within the standard
limit.
• By the analyses of effluent of sampling point-3 and 7, it was shown that the effluent
treatment process of Polash and Ghorasal Urea Fertilizer Factories was not
satisfactory. It is also noted that the effluent treatment process of Polash Urea
Fertilizer Factory was better than Ghorasal Urea Fertilizer Factory.
• By the analyses of effluent of sampling point-2, it was shown that the efficiency of
Lagoon was not sufficient and the capacity of the lagoon needs to be increased.
• By the analyses of effluent of sampling point-4 and 5, it was shown that huge amounts
of untreated effluent with high concentration of physical and chemical parameters
were discharged on the Lakhya River.
• The amount of pollution load discharged from sampling point-4 into the Lakhya River
were Bi0<ihemical Oxygen Demand (BODs) were 2291-2903 kg/day, Chemical
Oxygen Demand (COD) were 4124-4286 kg/day, Total Ammonia were 7911-9681
kg/day, Ammonia as Nitrogen (NH3-N) were 2279.94-5063.22 kg/day, Ammonium as
Nitrogen (NH4-N) were 4617.89-6575.37 kg/day, Total Solids (TS) were 2997-5258
kg/day, Total Suspended Solids (TSS) were 572-1536 kg/day, Total Dissolved Solids
(TDS) were 2329-3857 kg/day, The amount of pollution load discharged from
sampling point-5 into the Lakhya River were Biochemical Oxygen Demand (BODs)
were 146-348 kg/day, Chemical Oxygen Demand (COD) were 258-595 kg/day, Total
Ammonia (NH3-N) were 7368-11203 kg/day, Ammonia as Nitrogen (NH3-N) were
4975.23-6598.68 kg/day, Ammonium as Nitrogen (NH4-N) were 1903.08-5988.22
kg/day, Total Solids (TS) were 1523-3077 kg/day, Total Suspended Solids (TSS)
103

Iwere 118-752 kg/day, Total Dissolved Solids (TDS) were 1216-2325 kg/day, The
amount of pollution load discharged from sampling point-7 into the Lakhya River
were Biochemical Oxygen Demand (BODs) were 106-323 kg/day, CJemical OxygenI
Demand (COD) were 292-359 kg/day, Total Ammonia (NH3-N) were 531-896
kg/day, Ammonia as Nitrogen (NH3-N) were 42.60-230.88 kg/day, Ammonium as
Nitrogen (NH4-N) were 489.27-665.79 kg/day, Total Solids (TS) were 2184-3263
kg/day, Total Suspended Solids (TSS) were 769-1091 kg/day, Total Bissolved Solids
(TDS) were 1415-2441 kg/day I
• The total amount of pollution load discharged from fertilizer factories into the Lakhya
River were Biochemical Oxygen Demand (BODs) were 2665-3369 kg/day, Chemical
Oxygen Demand (COD) were 4714-5221 kg/day, Total AmmoniJ (NH3-N) wereI
17425-20012 kg/day, Ammonia as Nitrogen (NH3-N) were 7850.68-10671.21 kg/day,
Ammonium as Nitrogen (NH4-N) were 7164.34-12161.79 kg/day, T~tal Solids (TS)I
were 7449-10380 kg/day, Total Suspended Solids (TSS) were 1513-3375 kg/day,
Total Dissolved Solids (TDS) were 5467-7004 kg/day
• The level of Biochemical Oxygen Demand (BODs) was 8-11 mg/l, 9-11 mg/l, and 11-. . I
l4mg/1 in sampling point-I, 6 and 8 respectively. For the dilution factor the BODsI
reduced in the sampling point-9 and it was 10-13 mg/l. The level of Chemical Oxygen
g/. I I' . 6Demand (COD) was 12-19 mg/l, 15-21 mg/I, and 18-23 m 1111samp 111gp0111t-l,
and 8 respectively. For the dilution factor the COD reduced in the Jampling point-9
and it was 17-22 mg/l. The level of Dissolved Oxygen (DO) was 4-4.8 mg/l, 3.9-4.4
mg/l, 3.78-4.1 mg/l in sampling point-I, 6 and 8 respectively. For tl~e dilution factor
pollution load reduced so those DO increased in the sampling pOint-9land it was 3.81-
4.2 mg/l. The level of pH was 7.5-7.8, 7.9-8.3, 8-8.4 in sampling point-I, 6 and 8
respectively. For the dilution factor pollution load reduced in sampling point-9, so theI
pH decreased in that point and it was 8.1-8.3. The level of Temperature was 28-31.4I
DC, 28-32 DC, 28.2-31.7 DC, and 28.1-30.5 DC in sampling point-I, 6, 8 and 9I
respectively. The concentration of Total Ammonia was 0.685-0,71 mg/l in theI
sampling point-I. In the sampling point-6 it was 0.97-1.19 mg/l. In the sampling
point-8 it was 1.09-1.30 mg/l. For the dilution factor the total Amrbonia reduced in
the sampling point-9 and it was 0.95-1.15 ~lg/l. The concentration] of Ammonia as
104

Nitrogen (NH3-N) was 0.01-0.02 mg/l in the sampling point-I. In the sampling point-
6 it was 0.08-0.11 mg/l. In the sampling point-8 it was 0.06-0.15 mgll. For the
dilution factor the NH3-N reduced in the sampling point-9 and it was 0.06-0.11 mg/l.
The concentration of Ammonium as Nitrogen (NH4-N) was 0.67-0.69 mg/l in the
sampling point-I. In the sampling point-6 it was 0.93-1.11 mg/l. In the sampling
point-8 it was 1.03-1.20 mg/l. For the dilution factor the NH4-N reduced in the
sampling point-9 and it was 0.89-1.06 mg/l. The concentration of Total Solids (TS)
was 179-247 mg/l, 193-261 mg/l, and 220-286 mg/l in sampling point-I, 6 and 8
respectively. Total solids were accumulated in the downstream, for this, the value of
TS were increased in the sampling point-9 and it were 237-298 mg/l. The
concentration of Total Suspended Solids (TSS) was 19-41 mg/l, 20-45 mg/l, 26-58
mg/l in sampling point-I, 6 and 8 respectively. Total suspended solids were
accumulated in the downstream, for this, the value of TSS were increased in the
sampling point-9 and it were 27-62 mg/l (46:1:12.55mg/l). The concentration of Total
Dissolved Solids (TDS) was 141-228 mg/l, 162-245 mg/l, and 181-257 mg/l in
sampling point-I, 6 and 8 respectively. Total Dissolved solids were accumulated in
the downstream, for this, the value ofTDS were increased in the sampling point-9 and
it were 192-271 mg/l.
• The concentration of most of the water quality parameters in down stream (sampling
point-9) is greater than the concentration in up stream (sampling point-I). So it is
obviously true that there was a lateral flow between this point either industrial or
residential. Different sources are for total Ammonia: u/s 67.08%, fertilizer factories
24.59%, residential area 8.33% ; BODs: uls 79.83%, fertilizer factories 0.39%,
residential area 19.78%; COD: u/s 79.49%, fertilizer factories 0.36%, residential area
20.15%; TS: u/s 74.36%, fertilizer factories 0.04%, residential area 25.60%; TSS: u/s
64.36%, fertilizer factories 0.07%, residential area 35.57%; TSS: uls 76.55%,
fertilizer factories 0.04%, residential area 23.41 %;
• The level bf pollution load along the Lakhya River of Biochemical Oxygen Demand
(BODs) was 552878-713615 kg/day, 553607-803513 kg/day and 705054-982497
kg/day in the sampling point-I, 6 and 8 respectively. For the dilution factor the BODs
load reduced in the sampling point-9 and it was 655124-982923 kg/day. Chemical
lOS

Oxygen Demand (COD) was 954971-1188933 kg/day, 1056886-1339188 kg/day and
1158303-1607722 kg/day in the sampling point-I, 6 and 8 respectively. For the
dilution factor the COD load reduced in the sampling point-9 and it was 1108672-
1519062 kg/I. Total Ammonia was 35686-61103 kg/day in the sampling point-I. In
the sampling point-6 it was 59890-86601 kg/day. In the sampling point-8 it was
65469-97357 kg/day. For the dilution factor the total Ammonia reduced in the
sampling point-9 and it was 57953-84889 kg/day. Ammonia as Nitrogen (NH3-N) was
814-1399 kg/day in the sampling point-I. In the sampling point-6 it was 3571-7215
kg/day. In the sampling point-8 it was 5036-9840 kg/day. For the dilution factor the
NH3-N reduced in the sampling point-9 and it was 4535-7217 kg/day. The pollution
load of Ammonium as Nitrogen (NH4-N) was 34681-59765 kg/day in the sampling
point-I. In, the sampling point-6 it was 55864-83030 kg/day. In the sampling point-8 it
was 60433-91997 kg/day. For the dilution factor the NH4-N reduced in the sampling
point-9 and it was 53418-79527 kg/day. Total Solids (TS) was 12414626-15967134
kg/day, 13135585-17230884 kg/day and 14403247-19649938 kg/day in the sampling
point-I, 6 and 8 respectively. Total solids were accumulated in the downstream, for
this, the load of TS were increased in the sampling point-9 and it were 15017466-
21177516 kg/day. Total Suspended Solids (TSS) was 954971-2867428 kg/day,
1006558-3257035 kg/day and 1309386-4398998 kg/day in the sampling point-I, 6
and 8 respectively. Total suspended solids were accumulated in the downstream, for
this, the load of TSS were increased in the sampling point-9 and it were 1360643-
4645510 kg/day. Total Dissolved Solids (TDS) was 9861153-13558684 kg/day,
12256499-14463229 kg/day and 12942778-16166540 kg/day in the sampling point-I,
6 and 8 respectively. Total suspended solids were accumulated in the downstream, for
this, the load of TDS were increased in the sampling point-9 and it were 13656823-
17156469 kg/day.
• It was observed that fertilizer factories are the major sources of Total Ammonia load
discharged into the Lakhya River in the study area. The amount of total Ammonia
load in sampling point-9 is greater than the load of Total Ammonia in sampling point-
1. This increment occurred due to the Ammonia load discharged from fertilizer
factories. So the Ammonia load discharged from fertilizer factories has a large impact
on the Lakhya River water quality. It was also shown that the pollution load of BOD,
106

COD and TS discharged from sampling point 5, 4 and 7 were negligible as compared
to the load discharged from residential area on the right bank of the Lakhya River. So
it can be concluded that there was insignificant impact of BOD, COD and TS load
discharged from fertilizer factories.
• Highest amount of BODs, COD and NH)-N was found at the discharging point of
waste into the river Lakhya and was found decreasing with distance at the down
streams. The decay rate was found 0.14/km, 0.12/km and 0.17/km respectively.
• According to the simulated value during the period October'06 to September'07, the
concentration varied 0.67-0.75 mg/l, 0-0.04 mg/l, 0.66-0.72 mg/l, 5.19-15.13 mg/l,
6.43-29.71 mg/l, 123.25-315.58 mg/l, 82.35-301.91 mg/l in sampling point-l and in
sampling point-9, it varied 0.87-1.42 mg/l, 0.03-0.15 mg/l, 0.72-1.27 mg/l, 8.29-15.93
mg/l, 12.36-30.38 mg/l, 195.21-375.09 mg/l, and 122.15-369.17 mg/l in case of Total
Ammonia, Ammonia, Ammonium, BOD, COD, TS, and TDS respectively for both
the points. Maximum concentration occurred in February and minimum in August.
• The percent saturation of Dissolved Oxygen was 54-60 %, 52.5-56 %, 50-53 % in
sampling point-I, 6 and 8 respactively. For the dilution factor the pollution load
reduced in the sampling point-9, the percent of saturation DO increase in that point
and it was 52-54 %.
• Equation generated from the relationship between river flow and concentration of
water quality parameters is best suited in the up stream for Total Ammonia,
Ammonia, Biochemical Oxygen Demand (BOD), and Chemical Oxygen Demand and
in the down stream for Ammonium, Total Solids, and Total Dissolved Solids.
• From the expected load at the downstream the authority could formulate the policy 1)
to permit the maximum load of Ammonia discharged from industry 2) The number of
industry will pemlit for sustainable developement in respect of Ammonia
107

8.2 Recommendations
8.2.1 Introduction
Waste minimization is one of the most important interventions that can help sustain industrial
production without compounding onslaughts due to pollution on environmental sinks. One of
the chief problems in Bangladesh today concerns its precarious water supply. Water is
contaminated by two prime sources: human waste, typical along rivers which attract
population settlements upstream and down stream; and industrial and agrochemical wastes,
often dumped untreated into lakes and rivers. The latter is noticeable where there is advanced
industrial development, as at the Lakhya River located near the Dhaka in Bangladesh.
Ecological balance and enviromnental protection are among the most critical issues on the
agenda of the world community. In many respects, Bangladesh's enviromnental problem is
more severe because of the imbalance between its enormous population and its limited
resources. These issues have a tremendous impact at the regional and local levels and demand
urgent policy responses from national governments. The water in our oceans, lakes, rivers,
and streams supports a wide range of uses. Water can be withdrawn for drinking and other
domestic purposes, for industrial processes, or for irrigation. It can support fish populations
for commercial exploitation and recreational fishing. To varying degrees, most of these uses
depend on the quality of the water. Yet the use of a body of water as a waste receptor can
seriously degrade water quality and impair--even preclude--other uses.
All developing countries are confronted with the conflict between development and
enviromnent. Economic development requires rapid industrial expansion at minimal cost; but
this often leads to detrimental effects on the environment, such as liquid, gaseous, and solid
waste pollution. But industrialization without adequate environmen is meaningless. How to
reconcile this contradiction is a great challenge to the developing countries especially in
Bangladesh.
8.2.2 Recommending Interventions to Minimize Impact
• For the greater interest of the industry as well as for enviromnental pollution it is
necessary to control ammonia contamination of river water up to the allowable limit. For
that purpose occasionally released urea plant process condensate instead of direct discharge
108
into the sruface drain should be stored in a lagoon or pond where ammonia will partially
evaporate and partially converted to nitric by bacteria. After a certain period water from
that lagoon will be discharged to the river by pumping.
• The quality of treatment process must be updated as high value of Ammonia was
found on the test result. Untreated effluent discharged from fertilizer factories through
the sampling point-5 and 4 must be stopped.
• The pH of waste water should be checked and should be made neutral regarding basic
properties before discharge into the river water. For that purposes required those of
Alum or sulfuric acid or lime soda may be added at the final pH adjustment basin of the
existing system.
• The retaining period of effluent in lagoon was not sufficient as the effluent enters in
the lagoon on one side and exit on the other side. So it is necessary to increase
retaining period. It is also noted that the capacity of lagoon should be increased as in
the rainy season flooding were occurd in the lagoon.
• Leakage from pipeline, valves or ammonia storage tank should be prevented through
regular maintenance.
• Public involvement and awareness should be built up about the health hazard that may
cause due to industrial activities.
• The ground water quality in and around the factory should be checked periodically in order
to ensure no adverse effect on the ground water quality.
• It is known that numerous authorities and laws exist simultaneously in Bangladesh to
control industrial pollution. Unfortunately, the authority and jurisdiction of various
agencies in this respect is not clearly defined, creating confusion in application of the
laws and regulations. There are also a pressing need for summarising the various laws
and regulations for (i) smooth and effective implementation/enforcement of the
laws/regulations/authority (ii) to establish coordination in tenns of taking punitive
actions against the polluters and c) to persuade the polluters to comply with the rules
and regulations.
109

• Introduce pollution charges/ permits system. Most environmental experts agree that
the best way to tackle pollution is through something called the polluter pays
principle. This means that whoever causes pollution should have to pay to clean it up,
one way or another
• Ensuring effective environmental assessment of industries
• Industrial wastewater must be treated to the specified standards before discharge into
a sewer or watercourse. These standards are set to protect the sewerage infrastructure
and workers maintaining the sewerage system, to prevent adverse effects on treatment
processes at the downstream sewage treatment works, and to protect aquatic life.
• Waste minimization in industrial processes including avoidance of generation of
wastes and productive utilization of generated wastes
• Industrial waste water should be treated by physico-chemical treatment followed by
biological treatment. Segregation of process wastewater containing recoverable
chemicals from storm water and domestic sewage and treating them separately
8.2.3 Limitations of the Study
• Water quality sample were collected from the mid point between the banks of the
nver
• Residential effluent discharged from the right bank of the river were not tested in the
laboratory
• Effluent discharged from fertilizer factories were measured by float velocity method
• For better test results it was necessary to conduct the tests every months round the year. But
due to lack of sufficient time the tests were conducted in the period ofJune-July'2007
• During the experiment the tests were conducted on samples from limited points of river. If
some more points were included the test results would be more perfect and more reliable.
110

8.2.4 Recommendations for further study
The present study cannot be considered as an ideal one covering all aspects of envirorunental
impacts because this study conducted for the period of June-July, 2007. However, within
limitations and scope this study has certainly provided a basis and has focused on various
important envirorunental issues, which should be considered for detailed study in future. Further
detailed study in this field is required.
The following recommendations are made for further study in the relevant field:
• A detailed study and investigation may be carried out over the whole year (dry season
and wet season) upon the fluctuation of the quality and the quantity of Polash and Ghorasal
Urea Fertilizer Factories effiuent with time.
• A further study of the water quality of Lakhya River may be performed at different points
to identify how extent of the water quality have been affected by the industry
• A study regarding the pollution of air due to Polash and Ghorasal Urea Fertilizer Factories
activities may be considered to identify the affected area and the degree of pollution.
• A detail stUdyabout ground water quality of the surrounding area of Polash and Ghorasal
Urea Fertilizer Factories may have to be under taken to identify the impacts of industrial
pollution on ground water.
• A detailed study on how the aquatic habitats were adversely affected by the industry.
• A further study on the effect on plant species and how crop yield has been affected by the
industry.
111

REFERENCES
1. Ahmed, A.D. and Reazuddin, M. (2000), "Industrial Pollution of Water Systems inBangladesh ", University Press Limited, Dhaka, Bangladesh pp 175-178
2. Ahmed, M.F, (1975); "Clarification of Buriganga river by sedimentation with alamcoagulation", Journal of the institution of Engineers Bangladesh, vol.3., BUET, Dhaka
3. Alam, R. (2006); "A study on removal of ammonia from the waste water ofFenchuganj natural gas fertilizer factory", M.Sc. Engineering Thesis, Department ofCivil engineering, BUET, Dhaka
4. Altman S. J. and Parizek R. R., (1995). "Dilution of nonpoint source nitrate in groundwater", J. Environ. Quality, 24, 707-717.
5. American Public Health Association, American Water Works Association, Waterpollution control Federation, (APHA, AWWA, WPFC) (1985); "The standard methodsfor the examination of water and wastewater", 16th Edition.
6. American Society for Testing and Materials (ASTM) "Annual book of ASTMstandard", D1293-84, Vol. 11.01Water-(l) part-I,
7. BKH Consulting Engineers (1994); "Industrial Pollution Control Management,Interim Report (ADB TA 1769-BAN) ", Asian Development Banle
8. Bridgewater AV, Mumfod C.J, (1979); "Waste Recycling and Pollution ControlHandbook", 26 -29.Eniola K.IT
9. Chapman, D. (1996); "Water Quality Assessments, A guide to the use of Biota,Sediments and Water in Environmental Engineering ", Second edition, E&EN SPON.
10. Chindah A c., Braide AS. and Sibeudu O. c., (2004); "Distribution of hydrocarbonsand heavy metals in sediment and a crustacean (shrimps-Penaeus notialis) from thebonny/new calabar river estuary", Niger Delta. Ajeam-Ragee, 9, 1-14.
11. Department of Environment (DOE) (1991); "Environmental quality standards forBangladesh", Government ofthe People's Republic of Bangladesh.
12. Department of Environment (DOE) (1993); "Water Quality Data of RiversBuriganga, Meghna, Balu, Shitalakhya, JamwlG (1981-90)", Department ofEnvironment, Dhaka, Bangladesh.
13. Emongor V., Kealotswe E., Koorapetse 1., Sankwasa S. and Keikanetswe S., (2005)."Pollution indicators in Gaberone effluent", J. Appl. Sci., 5, 147-150.
14. Fakayode 'S. 0, (2005). "Impact of industrial effluents on water quality of thereceiving Alaro River in Ibadan ", Nigeria, Ajeam-Ragee, 10, 1-13.
112
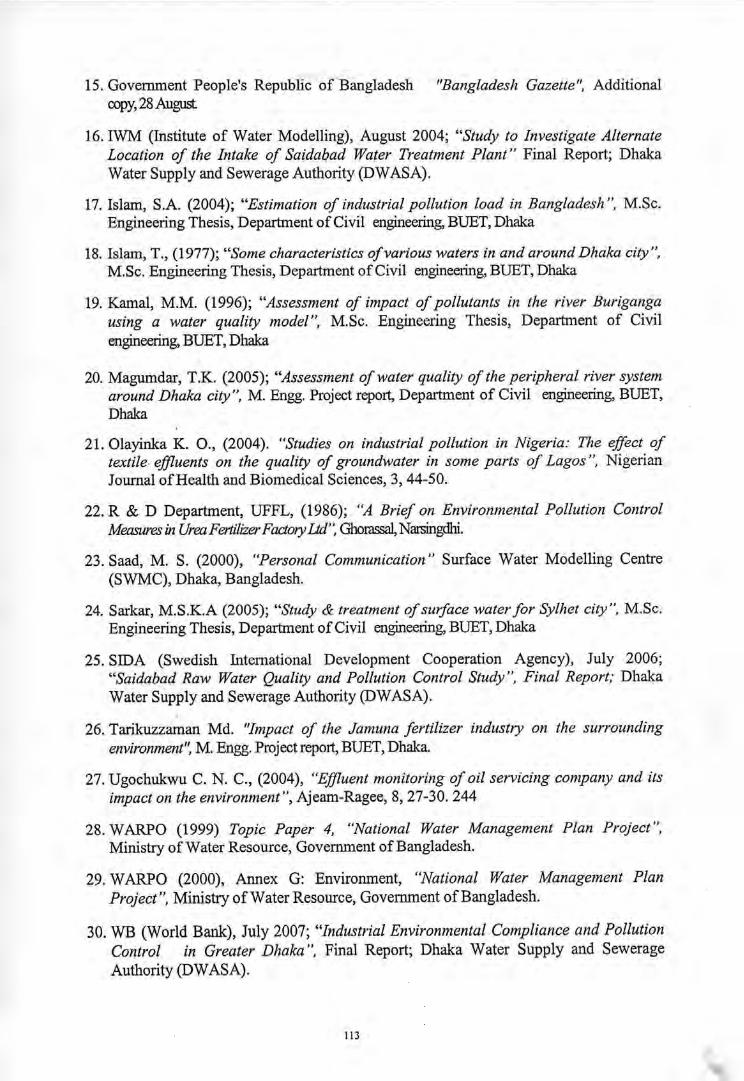
15. Government People's Republic of Bangladesh "Bangladesh Gazette", Additionalcopy,28August
16. IWM (Institute of Water Modelling), August 2004; "Study to Investigate AlternateLocation of the Intake of Saidabad Water Treatment Plant" Final Report; DhakaWater Supply and Sewerage Authority (DWASA).
17. Islam, S.A. (2004); "Estimation of industrial pollution load in Bangladesh ", M.Sc.Engineering Thesis, Department of Civil engineering, BUET, Dhaka
18. Islam, T., (1977); "Some characteristics of various waters in and around Dhaka city",M.Sc. Engineering Thesis, Department of Civil engineering, BUET, Dhaka
19. Kamal, M.M. (1996); "Assessment of impact of pollutants in the river Burigangausing a water quality model", M.Sc. Engineering Thesis, Department of Civilengineering,BUET, Dhaka
20. Magumdar, T.K. (2005); "Assessment of water quality of the peripheral river systemaround Dhaka city", M. Engg. Project report, Department of Civil engineering, BUET,Dhaka
21. Olayinka K. 0., (2004). "Studies on industrial pollution in Nigeria: The effect oftextile effluents on the quality of groundwater in some parts of Lagos ", NigerianJournal of Health and Biomedical Sciences, 3, 44-50.
22. R&D Department, UFFL, (1986); "A Brief on Environmental Pollution ControlMeasuresin UreaFertilizerFadory Ltd", Ghorassal,Narsingdhi.
23. Saad, M. S. (2000), "Personal Communication" Surface Water Modelling Centre(SWMC), Dhaka, Bangladesh.
24. Sarkar, M.S.K.A (2005); "Study & treatment of surface water for Sylhet city", M.Sc.Engineering Thesis, Department of Civil engineering,BUET, Dhaka
25. SIDA (Swedish International Development Cooperation Agency), July 2006;"Saidabad Raw Water Quality and Pollution Control Study", Final Report; DhakaWater Supply and Sewerage Authority (DWASA).
26. Tarikuzzaman Md. "Impact of the Jamuna fertilizer industly on the surroundingenvironment", M. Engg. Project report, BUET, Dhaka.
27. Ugochukwu C. N. c., (2004), "Effluent monitoring of oil servicing company and itsimpact on the environment ", Ajeam-Ragee, 8,27-30. 244
28. WARPO (1999) Topic Paper 4, "National Water Management Plan Project ",Ministry of Water Resource, Government of Bangladesh.
29. WARPO (2000), Annex G: Environment, "National Water Management PlanProject ", Ministry of Water Resource, Government of Bangladesh.
30. WB (World Bank), July 2007; "Industrial Environmental Compliance and PollutionControl in Greater Dhaka ", Final Report; Dhaka Water Supply and SewerageAuthority (DWASA).
113

APPENDIX

APPENDIX
Table A4.1: BODs (mg/l) of effluent from Polash and Ghorasal Urea Fertilizer Factories
Date Sampling Sampling Sampling Sampling Samplingpoint-2 point-3 point-4 point-S point-7
15/06/2007 51 24 148 31 5322/06/2007 60 29 135 30 1929/06/2007 50 31 120 21 3706/07/2007 43 46 143 30 3413/07/2007 46 41 130 29 41
Table A4.2: COD (mg/l) of effluent from Polash and Ghorasal Urea Fertilizer Factories
Date Sampling Sampling Sampling Sampling Samplingpoint-2 point-3 point-4 point-S point-7
15/06/2007 79 43 234 53 5922/06/2007 86 47 212 49 6429/06/2007 78 53 216 37 5406/07/2007 82 69 211 49 5213/07/2007 83 64 198 41 59
Table A4.3: DO (mg/l) of effluent from Polash and Ghorasal Urea Fertilizer Factories
Date Sampling Sampling Sampling Sampling Samplingpoint-2 point-3 point-4 point-S point-7
15/06/2007 0.76 2.88 2.90 2.89 2.8022/06/2007 0.7 2.96 2.91 2.69 3.0029/06/2007 0.65 2.87 2.83 2.75 2.8706/07/2007 0.78 2.92 2.81 2.64 2.9013/07/2007 0.75 2.86 2.84 2.70 2.91
Table A4.4: pH of effluent from Polash and Ghorasal Urea Fertilizer Factories
Date Sampling Sampling Sampling Sampling Samplingpoint-2 point-3 point-4 point-S point-7
15/06/2007 8.5 8.3 8.9 9.2 8.822/06/2007 8.4 8.3 8.8 9.7 8.229/06/2007 8.9 8.5 9.2 9.5 8.606/07/2007 8.4 8.4 9.0 9.8 8.413/07/2007 8,4 8.2 9.3 9.7 8.8
A.I
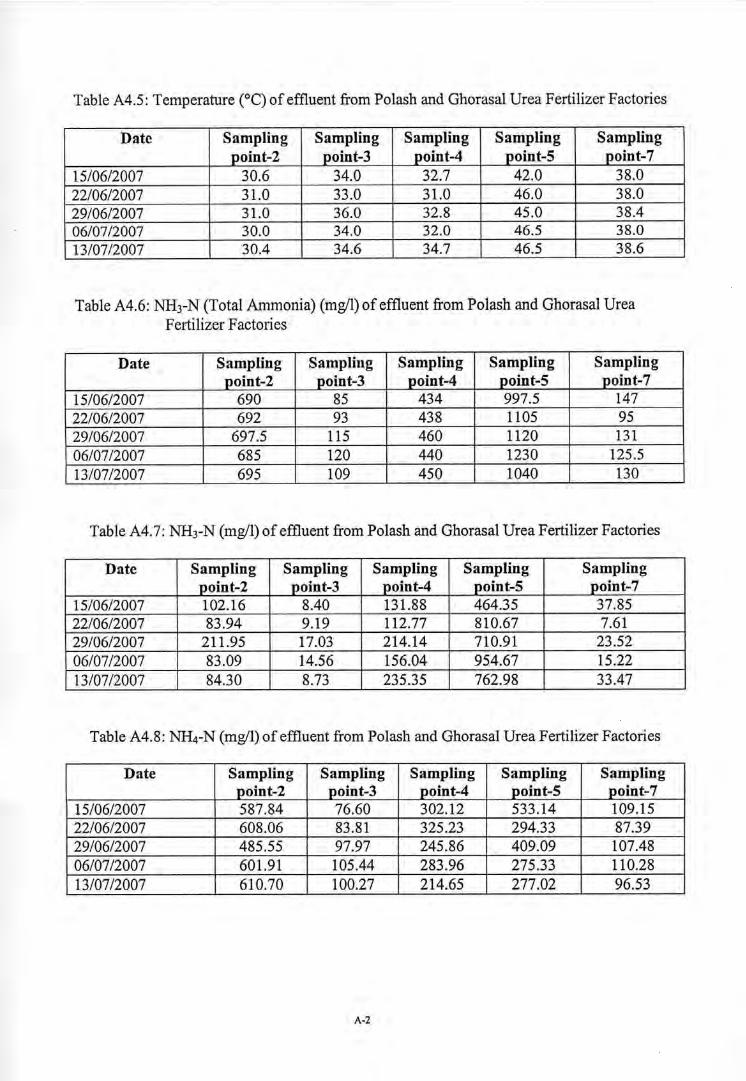
Table A4.5: Temperature (0C) of effluent from Polash and Ghorasal Urea Fertilizer Factories
Date Sampling Sampling Sampling Sampling Samplingpoint-2 point-3 point-4 point-S point-7
15/06/2007 30.6 34.0 32.7 42.0 38.022/06/2007 31.0 33.0 31.0 .46.0 38.029/06/2007 31.0 36.0 32.8 45.0 38.406/07/2007 30.0 34.0 32.0 46.5 38.013/07/2007 30.4 34.6 34.7 46.5 38.6
Table A4.6: NH3-N (Total Ammonia) (mg/l) of effluent from Pol ash and Ghorasal UreaFertilizer Factories
Date Sampling Sampling Sampling Sampling Samplingpoint-2 point-3 point-4 point-S point-7
15/06/2007 690 85 434 997.5 14722/06/2007 692 93 438 1105 9529/06/2007 697.5 115 460 1120 13106/07/2007 685 120 440 1230 125.513/07/2007 695 109 450 1040 130
Table A4.7: NH3-N (mg/l) of effluent from Polash and Ghorasal Urea Fertilizer Factories
Date Sampling Sampling Sampling Sampling Samplingpoint-2 point-3 point-4 point-S point-7
15/06/2007 102.16 8.40 131.88 464.35 37.8522/06/2007 83.94 9.19 112.77 810.67 7.6129/06/2007 211.95 17.03 214.14 710.91 23.5206/07/2007 83.09 14.56 156.04 954.67 15.2213/07/2007 84.30 8.73 235.35 762.98 33.47
Table A4.8: NH4-N (mg/l) of effluent from Polash and Ghorasal Urea Fertilizer Factories
Date Sampling Sampling Sampling Sampling Samplingpoint-2 point-3 point-4 point-S point-7
15/06/2007 587.84 76.60 302.12 533.14 109.1522/06/2007 608.06 83.81 325.23 294.33 87.3929/06/2007 485.55 97.97 245.86 409.09 107.4806/07/2007 601.91 105.44 283.96 275.33 110.2813/07/2007 610.70 100.27 214.65 277.02 96.53
A.2

Table A4.9: Total Solids (mg/I) of effluent from Polash and Ghorasal Urea FertilizerFactories
Date Sampling Sampling Sampling Sampling Samplingpoint-2 point-3 point-4 point-S point-7
15/06/2007 183 90 247 274 45922/06/2007 145 75 235 245 42829/06/2007 128 67 157 228 53206/07/2007 170 45 259 221 38913/07/2007 112 69 154 215 432
Table A4.1 0: Total Suspended Solids (mg/I) of effluent from Polash and Ghorasal UreaFertilizer Factories
Date Sampling Sampling Sampling Sampling Samplingpoint-2 point-3 point-4 point-S point-7
15/06/2007 47 21 84 67 17922/06/2007 39 15 76 38 15629/06/2007 34 23 30 17 13406/07/2007 43 19 69 45 13713/07/2007 27 13 43 39 129
Table A4.11: Total Dissolved Solids (mg/I) of effluent from Polash and Ghorasal UreaFertilizer Factories
Date Sampling Sampling Sampling Sampling Samplingpoint-2 point-3 point-4 point-5 point-7
15/06/2007 136 69 163 207 28022/06/2007 106 60 159 207 27229/06/2007 94 44 122 211 39806/07/2007 127 26 190 176 25213/07/2007 85 56 111 176 303
Table A5.1: Flow rate (m3/S) of effluent from Polash and Ghorasal Urea Fertilizer Factories
Date Sampling Sampling Sampling Sampling Samplingpoint-2 point-3 point-4 point-S point-7
15/06/2007 0.125 0.0263 0.211 0.130 0.070622/06/2007 0.140 0.0265 0.234 0.086 0.064829/06/2007 0.130 0.0262 0.221 0.081 0.07106/07/2007 0.140 0.0266 0.235 0.080 0.06513/07/2007 0.150 0.0266 0.249 0.082 0.070
A.3

Table A5.2: Pollution load in kg/day (Industrial and Residential) discharged from samplingpoint-4
Date BODs COD Total NH3-N NH4_N TS TSS TDSAmmonia
15/0612007 2698 4266 7912 2404.24 5507.76 4503 1531 297222/0612007 2729 4286 8855 2279.63 6575.37 4751 1536 321529/0612007 2291 4124 8783 4088.45 4694.55 2998 573 233006/07/2007 2903 4284 8934 3168.48 5765.52 5259 1401 385713/0712007 2797 4260 9681 5063.11 4617.89 3313 925 2388
Table A5.3: Pollution load in kg/day (Residential) discharged from sampling point-4
Date BODs COD Total TS TSS TDSAmmonia
15/0612007 2092.76 3315.00 266.85 2322.00 976.03 1345.9722/0612007 1937.22 3138.26 271.94 2825.50 1030.45 1795.0529/06/2007 1659.55 3128.32 688.78 1408.46 138.88 1174.1106/0712007 2277.62 3133.69 372.21 3099.00 837.18 2261.8113/0712007 2106.38 3036.93 423.41 1703.00 545.29 1157.71
Table A5.4: Pollution load in kg/day discharged from sampling point-5
Date BODs COD Total NH3-N NH4_N TS TSS TDSAmmonia
15/0612007 348 595 11204 5215.78 5988.22 3078 753 232522/06/2007 223 364 8211 6024.01 2186.99 1820 282 153829/0612007 147 259 7838 4975.02 2862.98 1596 118 147606/07/2007 207 339 8502 6598.92 1903.08 1528 311 121713/07/2007 205 290 7368 5405.37 1962.63 1523 276 1247
Table A5.5: Pollution load in kg/day discharged from sampling point-7
Date BODs COD NH3-N NH4_N TS TSS TDS15/0612007 323 360 897 665.79 2800 1092 170822/06/2007 106 358 532 489.27 2396 873 152229/06/2007 227 331 804 659.32 3264 822 244106/07/2007 191 292 705 619.33 2185 769 141513/07/2007 248 357 786 583.81 2613 780 1833
A-4

Table A5.6: Total Pollution load in kg/day discharged from Polash and Ghorasal FertilizerFactories
Date BODs COD Total NH3-N NH4.N TS TSS TDSAmmonia
.
15/06/2007 3370 5221 20013 7851.21 12161.79 10380 3376 700522/06/2007 3059 5009 17598 8346.37 9251.63 8968 2692 627629/06/2007 2665 4715 17425 9208.15 8216.85 7857 1514 624806/07/2007 3302 4915 18140 9852.06 8287.94 8971 2481 649013/07/2007 3250 4907 17835 10670.7 7164.34 7449 1981 5467
Table A6.1: Flow rate (m3/S) in different points along the Lakhya River
Date Sampling Sampling Sampling Samplingpoint-l point-6 point-8 point-9
15/06/2007 759.106 759.201 759.261 759.33122/06/2007 941.576 942.429 942.858 943.28929/06/2007 1032.429 1033.324 1033.772 1034.22006/07/2007 809.459 810.615 811.185 811.75013/07/2007 581.732 582.499 582.882 583.266
Table A6.2: The levels of BODs (mg/l) at different points along the Lakhya River
Date Sampling Sampling Sampling Samplingpoint-l point-6 point-8 point-9
15/06/2007 10 11 13 1222/06/2007 8 9 12 1029/06/2007 8 9 11 1106/07/2007 9 10 12 1113/07/2007 11 11 14 13
Table A6.3: The levels of COD (mg/I) at different points along the Lakhya River
Date Sampling Sampling Sampling Samplingpoint-l point-6 point-8 point-9
15/06/2007 18 20 23 2222/06/2007 13 15 18 1729/06/2007 12 15 18 1706/07/2007 17 19 21 2013/07/2007 19 21 23 22
Table A6.4: The levels of DO (mg/I) at different points along the Lakhya River
Date Sampling Sampling Sampling Samplingpoint-l point-6 point-8 point-9
15/06/2007 4.80 4.40 4.10 4.2022/06/2007 4.56 4.20 4.00 4.0029/06/2007 4.52 4.00 3.84 3.9006/07/2007 4.50 3.90 3.78 3.8313/07/2007 4.00 3.90 3.80 3.81
A.S

Tabie A6.5: The levels of pH at different points along the Lakhya River
Date Sampling Sampling Sampling Samplingpoint-l point-6 point-8 point-9
15/06/2007 7.7 8.3 8.4 8.322/06/2007 7.6 8.1 8.2 8.129/06/2007 7.5 7.9 8 8.106/07/2007 7.8 8.1 8.1 8.113/07/2007 7.7 8.1 8.2 8.2
Table A6.6: The levels of Temperature (DC) at different points along the Lakhya River
Date Sampling Sampling Sampling Samplingpoint-l point-6 point-8 point-9
15/06/2007 28 28 28.2 28.122/06/2007 29 29.7 29.2 2929/06/2007 30 30.7 30.6 3006/07/2007 30 32 31 30.513/07/2007 31.4 31.6 31.7 31
Table A6.7: The levels ofNH3-N (Total Ammonia) at different points along Lakhya River
Date Sampling Sampling Sampling Samplingpoint-l point-6 point-8 Doint-9
15/06/2007 0.708 1.15 1.25 1.1022/06/2007 0.69 1.03 1.16 1.0029/06/2007 0.685 0.97 1.09 0.9506/07/2007 0.70 1.09 1.20 1.0513/07/2007 0.71 1.19 1.30 1.15
Table A6.8: The levels ofNH3-N (mg/1) at different points along the Lakhya River
Date Sampling Sampling Sampling Samplingpoint-l point-6 point-8 Doint-9
15/06/2007 0.02 0.11 0.15 0.1122/06/2007 0.01 0.07 0.09 0.0629/06/2007 0.01 0.04 0.06 0.0606/07/2007 0.02 0.07 0.08 0.0713/07/2007 0.02 0.08 0.10 0.09
Table A6.9: The levels ofNH4-N (mg/l) at different points along the Lakhya River
Date Sampling Sampling Sampling Samplingpoint-l point-6 Doint-8 Doint-9
15/06/2007 0.69 1.04 1.10 0.9922/06/2007 0.68 0.96 1.07 0.9429/06/2007 0.67 0.93 1.03 0.8906/07/2007 0.68 1.02 1.12 0.9813/07/2007 0.69 1.11 1.20 1.06
A-6

Table A6.1 0: The levels of Total Solids (mg/I) at different points along the Lakhya River
Date Sampling Sampling Sampling Samplingpoint-l point-6 point-8 ~oint-9
15/06/2007 205 223 257 26722/06/2007 190 207 241 25129/06/2007 179 193 220 23706/07/2007 182 216 255 28513/07/2007 247 261 286 298
Table A6.11 : The levels of Total Suspended Solids at different points along Lakhya River
Date Sampling Sampling Sampling Samplingpoint-l point-6 point-8 point-9
15/06/2007 29 30 38 3922/06/2007 34 40 54 5729/06/2007 27 31 40 4506/07/2007 41 45 58 6213/07/2007 19 20 26 27
Table A6.12: The levels of Total Dissolved Solids at different points along Lakhya River
Date Sampling Sampling Sampling Samplingpoint-l point-6 point-8 jJoint-9
15/06/2007 176 203 218 22822/06/2007 156 166 187 19429/06/2007 152 162 181 19206/07/2007 141 175 194 22313/07/2007 228 245 257 271
Table A6.13: BODs load in kg/day at different points along the Lakhya River
Date Sampling Sampling ,Sampling Samplingpoint-l point-6 point-8 point-9
15/06/2007 655867 721545 852802 78727422/06/2007 650817 732833 977555 81500229/06/2007 713615 803513 982497 98292306/07/2007 629435 700371 841037 77148713/07/2007 552878 553607 705054 655124
Table A6.14: COD load in kg/day at different points along the Lakhya River
Date Sampling Sampling Sampling Samplingpoint-l point-6 point-8 point-9
15/06/2007 1180562 1311899 1508803 144333622/06/2007 1057578 1221388 1466333 138550329/06/2007 1070422 1339188 1607722 151906206/07/2007 1188933 1330706 1471814 140270413/07/2007 954971 1056886 1158303 1108672
/\-7

Table A6.15: Total Ammonia load in kg/day at different points along the Lakhya River
Date Sampling Sampling Sampling Samplingpoint-l point-6 point-8 point-9
15/06/2007 46435 75434 82000 7216722/06/2007 56133 83869 94497 8150029/06/2007 61103 86601 97357 8488906/07/2007 48956 76340 84104 7364213/07/2007 35686 59890 65469 57953
Table A6.16: NH3-N (kg/day) load at different points along the Lakhya River
Date Sampling Sampling Sampling Samplingpoint-l point-6 point-8 point-9
15/06/2007 1312 7215 9840 721722/06/2007 814 5700 7332 489029/06/2007 892 3571 5359 536106/07/2007 1399 4903 5607 490913/07/2007 1005 4026 5036 4535
Table A6.17: NH4-N (kg/day) load at different points along the Lakhya River
Date Sampling Sampling Sampling Samplingpoint-l point-6 point-8 point-9
15/06/2007 45255 68219 72160 6495022/06/2007 55319 78169 87165 7661029/06/2007 59765 83030 91997 7952706/07/2007 47557 71438 78497 6873213/07/2007 34681 55864 60433 53418
Table A6.18: ,Total Solids load in kg/day at different points along the Lakhya River
Date Sampling Sampling Sampling Samplingpoint-l point-6 point-8 point-9
15/06/2007 13445285 14627678 16859239 1751685522/06/2007 15456912 16855154 19632566 2045654329/06/2007 15967134 17230884 19649938 2117751606/07/2007 12728581 15128021 17872028 1998853213/07/2007 12414626 13135585 14403247 15017466
Table A6.19: Total Suspended Solids load in kg/day at different points along the LakhyaRiver
Date Sampling Sampling Sampling Samplingpoint-l point-6 point-8 point-9
15/06/2007 1902016 1967849 2492806 255864222/06/2007 2765974 3257035 4398998 464551029/06/2007 2408450 2767655 352716 402104706/07/2007 2867428 3151671 4065010 434838213/07/2007 954971 1006558 1309386 1360643
A-8

Table A6.20: Total Dissolved Solids load in kg/day at different points along the Lakhya
River
Date Sampling Sampling Sampling Samplingpoint-l point-6 point-8 point-9
15/06/2007 11543269 13315778 14300833 1495821322/06/2007 12690938 13516694 15233568 1581103329/06/2007 13558684 14463229 16166540 1715646906/07/2007 9861153 12256499 13596758 1564015013/07/2007 11459655 12330339 12942778 13656823
Table A7.1: Lakhya River flow (m3/s) and water quality parameters in mg/l at samplingpoint-l
Month River Total NH3-N NH4-N BODs COD TS TDSflow NH3-N
Oct-06 525.38 0.72 0.02 0.70 11.37 20.91 242.88 218.93Nov-06 77.26 0.74 0.04 0.71 14.64 28.57 306.20 291.21Dec-06 32.37 0.75 0.04 0.72 14.97 29.34 312.55 298.45Jan-07 14.15 0.75 0.04 0.72 15.10 29.65 315.12 301.39Feb-07 10.90 0.75 0.04 0.72 15.13 29.71 315.58 301.91Mar-07 11.22 0.75 0.04 0.72 15.12 29.70 315.53 301.86Apr-07 43.76 0.75 0.04 0.72 14.89 29.14 310.94 296.61May-07 56.61 0.74 0.04 0.72 14.79 28.92 309.12 294.54Jun-07 610.60 0.71 0.02 0.69 10.75 19.45 230.84 205.18Jul-07 790.98 0.70 0.01 0.69 9.43 16.37 205.35 176.08Aug-07 1372.08 0.67 0.00 0.66 5.19 6.43 123.25 82.35Sep-07 1227.75 0.67 0.00 0.67 6.24 8.90 143.64 105.63
Table A7.2: Lakhya River flow (m3/s) and water quality parameters in mg/l at samplingpoint-9
Month River Total NH3-N NH4-N BODs COD TS TDSflow NH3-N
Oct-06 527.26 1.21 0.10 1.06 13.04 23.56 307.03 275.71Nov-06 77.49 1.39 0.14 1.24 15.56 29.50 366.31 357.11Dec-06 32.37 1.41 0.15 1.26 15.81 30.09 372.25 365.28Jan-07 14.13 1.42 0.15 1.26 15.91 30.33 374.66 368.58Feb-07 10.88 1.42 0.15 1.27 15.93 30.38 375.09 369.17Mar-07 11.18 1.42 0.15 1.27 15.93 30.37 375.05 369.12Apr-07 43.81 1.40 0.15 1.25 15.74 29.94 370.75 363.21May-07 56.65 1.40 0.15 1.25 15.67 29.77 369.05 360.89Jun-07 611.29 1.18 0.10 1.03 12.57 24.45 295.95 260.50Jul-07 792.74 1.10 0.08 0.95 11.55 20.05 272.04 227.65Aug-07 1375.63 0.87 0.03 0.72 8.29 12.36 195.21 122.15Sep-07 1229.65 0.93 0.04 0.78 9.10 14.29 214.45 148.57
A-9

Table A7.3: Concentration of water quality parameters in mg/l at 500m apart from samplingPoint-9
Date Total Ammonia BODs COD06/07/2007 1.03 10.5 18.5
Table A7.4: Percent saturation of Dissolved Oxygen (DO) along the Lakhya River
Date Sampling Sampling Sampling Samplingpoint-l point-6 point-8 point-9
15/06/2007 60 56 52 5422/06/2007 59 55 53 53.529/06/2007 58 54 52 52.506/07/2007 58 54 50 5213/07/2007 54 52.5 52 52.5
A-lO
Related Documents