Articles Basic Science Investigation nature publishing group BACKGROUND: Caffeine is widely used to treat apnea of pre- maturity, but the standard dosing regimen is not always suffi- cient to prevent apnea. Before higher doses of caffeine can be used, their effects on the immature brain need to be carefully evaluated. Our aim was to determine the impact of daily high- dose caffeine administration on the developing white matter of the immature ovine brain. METHODS: High-dose caffeine (25 mg/kg caffeine base load- ing dose; 20 mg/kg daily maintenance dose; n = 9) or saline (n = 8) were administered to pregnant sheep from 0.7 to 0.8 of term, equivalent to approximately 27–34 wk in humans. At 0.8 of term, the white and gray matter were assessed histologically and immunohistochemically. RESULTS: Daily caffeine administration led to peak caffeine concentration of 32 mg/l in fetal plasma at 1 h, followed by a gradual decline, with no effects on mean arterial pressure and heart rate. Initial caffeine exposure led to transient, mild alka- losis in the fetus but did not alter oxygenation. At necropsy, there was no effect of daily high-dose caffeine on brain weight, oligodendrocyte density, myelination, axonal integrity, microg- liosis, astrogliosis, apoptosis, or neuronal density. CONCLUSION: Daily high-dose caffeine administration does not appear to adversely affect the developing white matter at the microstructural level. C affeine is used to stimulate breathing in very preterm infants, especially those who develop apnea of prematu- rity (AOP). AOP occurs in approximately 85% of infants born prior to 34 wk (1), and its incidence is inversely related to gesta- tional age (2). Typically, AOP is treated with caffeine (or other methylxanthines) for 4–6 wk, until at least 32–34-wk postmen- strual age, or until the apnea has abated (3). An international randomized-controlled trial has confirmed that caffeine is an effective treatment for AOP, leading to reduced morbidity and mortality (4,5). In treating AOP, the standard dosing regimen of caffeine is a loading dose of 20 mg/kg (caffeine citrate) fol- lowed by a daily maintenance dose of 5–10 mg/kg (4). e standard clinical dose of caffeine is not always sufficient to abolish AOP (6,7), potentially leading to the use of higher doses. However, little is known regarding the effects of higher doses of caffeine on the immature brain, in particular its effects on the development of white matter (WM), a brain compo- nent that is very vulnerable to injury in preterm infants (7,8). Although several studies have assessed the effects of high-dose caffeine on the developing brain, these studies show both ben- eficial (9,10) and detrimental (11,12) effects. e majority of previous studies have been conducted in rats and mice (9–12), species in which white to gray matter (GM) ratio is not compa- rable to humans and in which brain development occurs pre- dominantly postnatally. Furthermore, previous studies have used widely differing dosing regimens. Given the conflicting experimental data on the effects of caffeine on the developing brain, it is difficult to draw unequivocal conclusions about the likely effects of high-dose caffeine on the developing WM of preterm infants. We have undertaken experiments in sheep, a species in which the timing of major developmental events in the brain, including WM development, aligns with human brain devel- opment. In order to expose the developing brain to caffeine at a similar stage of WM development as in preterm infants, we have used fetal sheep at 0.7–0.8 of term; at this age, WM devel- opment is similar to that of preterm infants at about 27–34-wks postmenstrual age (13–15), and thus represents the typical age at which preterm babies are exposed to caffeine (5) and when the cerebral WM is still developing (14). Our objective was to determine whether or not repeated daily high-dose caffeine administration causes structural alterations to the developing WM and GM in the immature ovine brain; we also assessed the effects on organ growth and physiological status. Potential effects of caffeine on the developing WM were assessed using oligodendrocyte transcription factor 2 (Olig2) to identify the entire pool of oligodendrocytes, myelin basic protein (MBP) to identify mature myelin, and the pan-axonal neurofilament marker (SMI-312) for axonal integrity. e nature of the glial cell response (microgliosis and astrogliosis), an indicator of Received 20 August 2013; accepted 16 January 2014; advance online publication 14 May 2014. doi:10.1038/pr.2014.55 The last two authors are co-senior authors and contributed equally to this work. 1 Department of Anatomy and Developmental Biology, Monash University, Clayton, Victoria, Australia; 2 Department of Neonatal Services, Royal Women’s Hospital, Victorian Infant Brain Studies, Murdoch Children’s Research Institute, University of Melbourne, Melbourne, Victoria, Australia; 3 Department of Obstetrics and Gynecology, University of Melbourne, Melbourne, Victoria, Australia; 4 Department of Anatomy and Neuroscience, University of Melbourne, Melbourne, Victoria, Australia; 5 The Ritchie Centre, MIMR-PHI Institute of Medical Research and Monash University, Clayton, Victoria, Australia. Correspondence: Mary Tolcos ([email protected]) Impact of daily high-dose caffeine exposure on developing white matter of the immature ovine brain Anzari Atik 1 , Jeanie Cheong 2,3 , Richard Harding 1 , Sandra Rees 4 , Robert De Matteo 1 and Mary Tolcos 5 Pediatric RESEARCH 1 Copyright © 2014 International Pediatric Research Foundation, Inc.

Welcome message from author
This document is posted to help you gain knowledge. Please leave a comment to let me know what you think about it! Share it to your friends and learn new things together.
Transcript
ArticlesBasic Science Investigationnature publishing group
Background: Caffeine is widely used to treat apnea of pre-maturity, but the standard dosing regimen is not always suffi-cient to prevent apnea. Before higher doses of caffeine can be used, their effects on the immature brain need to be carefully evaluated. Our aim was to determine the impact of daily high-dose caffeine administration on the developing white matter of the immature ovine brain.Methods: High-dose caffeine (25 mg/kg caffeine base load-ing dose; 20 mg/kg daily maintenance dose; n = 9) or saline (n = 8) were administered to pregnant sheep from 0.7 to 0.8 of term, equivalent to approximately 27–34 wk in humans. At 0.8 of term, the white and gray matter were assessed histologically and immunohistochemically.results: Daily caffeine administration led to peak caffeine concentration of 32 mg/l in fetal plasma at 1 h, followed by a gradual decline, with no effects on mean arterial pressure and heart rate. Initial caffeine exposure led to transient, mild alka-losis in the fetus but did not alter oxygenation. At necropsy, there was no effect of daily high-dose caffeine on brain weight, oligodendrocyte density, myelination, axonal integrity, microg-liosis, astrogliosis, apoptosis, or neuronal density.conclusion: Daily high-dose caffeine administration does not appear to adversely affect the developing white matter at the microstructural level.
caffeine is used to stimulate breathing in very preterm infants, especially those who develop apnea of prematu-
rity (AOP). AOP occurs in approximately 85% of infants born prior to 34 wk (1), and its incidence is inversely related to gesta-tional age (2). Typically, AOP is treated with caffeine (or other methylxanthines) for 4–6 wk, until at least 32–34-wk postmen-strual age, or until the apnea has abated (3). An international randomized-controlled trial has confirmed that caffeine is an effective treatment for AOP, leading to reduced morbidity and mortality (4,5). In treating AOP, the standard dosing regimen of caffeine is a loading dose of 20 mg/kg (caffeine citrate) fol-lowed by a daily maintenance dose of 5–10 mg/kg (4).
The standard clinical dose of caffeine is not always sufficient to abolish AOP (6,7), potentially leading to the use of higher doses. However, little is known regarding the effects of higher doses of caffeine on the immature brain, in particular its effects on the development of white matter (WM), a brain compo-nent that is very vulnerable to injury in preterm infants (7,8). Although several studies have assessed the effects of high-dose caffeine on the developing brain, these studies show both ben-eficial (9,10) and detrimental (11,12) effects. The majority of previous studies have been conducted in rats and mice (9–12), species in which white to gray matter (GM) ratio is not compa-rable to humans and in which brain development occurs pre-dominantly postnatally. Furthermore, previous studies have used widely differing dosing regimens. Given the conflicting experimental data on the effects of caffeine on the developing brain, it is difficult to draw unequivocal conclusions about the likely effects of high-dose caffeine on the developing WM of preterm infants.
We have undertaken experiments in sheep, a species in which the timing of major developmental events in the brain, including WM development, aligns with human brain devel-opment. In order to expose the developing brain to caffeine at a similar stage of WM development as in preterm infants, we have used fetal sheep at 0.7–0.8 of term; at this age, WM devel-opment is similar to that of preterm infants at about 27–34-wks postmenstrual age (13–15), and thus represents the typical age at which preterm babies are exposed to caffeine (5) and when the cerebral WM is still developing (14). Our objective was to determine whether or not repeated daily high-dose caffeine administration causes structural alterations to the developing WM and GM in the immature ovine brain; we also assessed the effects on organ growth and physiological status. Potential effects of caffeine on the developing WM were assessed using oligodendrocyte transcription factor 2 (Olig2) to identify the entire pool of oligodendrocytes, myelin basic protein (MBP) to identify mature myelin, and the pan-axonal neurofilament marker (SMI-312) for axonal integrity. The nature of the glial cell response (microgliosis and astrogliosis), an indicator of
Received 20 August 2013; accepted 16 January 2014; advance online publication 14 May 2014. doi:10.1038/pr.2014.55
The last two authors are co-senior authors and contributed equally to this work.1Department of Anatomy and Developmental Biology, Monash University, Clayton, Victoria, Australia; 2Department of Neonatal Services, Royal Women’s Hospital, Victorian Infant Brain Studies, Murdoch Children’s Research Institute, University of Melbourne, Melbourne, Victoria, Australia; 3Department of Obstetrics and Gynecology, University of Melbourne, Melbourne, Victoria, Australia; 4Department of Anatomy and Neuroscience, University of Melbourne, Melbourne, Victoria, Australia; 5The Ritchie Centre, MIMR-PHI Institute of Medical Research and Monash University, Clayton, Victoria, Australia. Correspondence: Mary Tolcos ([email protected])
impact of daily high-dose caffeine exposure on developing white matter of the immature ovine brainAnzari Atik1, Jeanie Cheong2,3, Richard Harding1, Sandra Rees4, Robert De Matteo1 and Mary Tolcos5
Pediatr Res
00
00
2014
Pediatric Research
10.1038/pr.2014.55
14May2014
00
00
20August2013
16January2014
Copyright © 2014 International Pediatric Research Foundation, Inc.
Caffeine and developing white matter
Atik et al.
Basic Science Investigation
Articles
Pediatric ReseARCH 1Copyright © 2014 International Pediatric Research Foundation, Inc.
Articles Atik et al.
WM injury (16,17), was assessed using ionized binding adap-tor molecule-1 (Iba-1) for microglia and glial fibrillary acidic protein (GFAP) for astrocytes. Apoptosis in the developing WM, cortical GM, and striatum was assessed using terminal deoxynucleotidyl transferase 2′-deoxyuridine, 5′-triphosphate nick end labeling (TUNEL). Finally, we assessed neuronal density in the cortical GM using the neuron-specific protein NEUronal nuclei (NeuN).
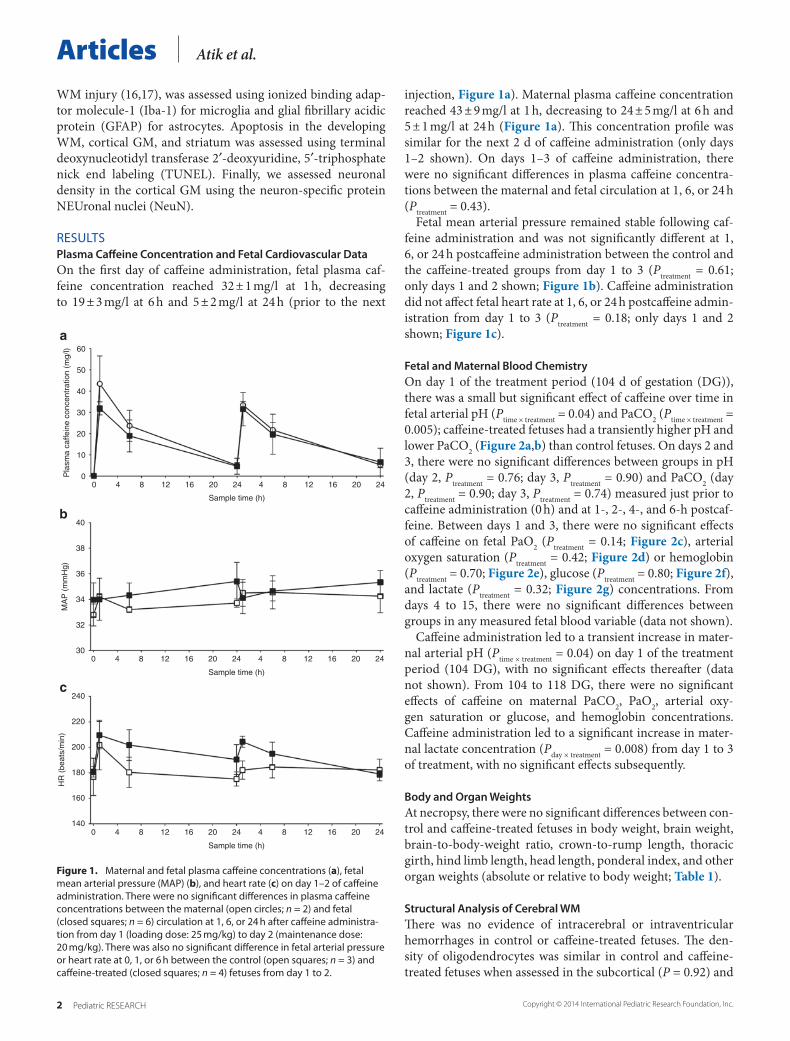
RESULTSPlasma Caffeine Concentration and Fetal Cardiovascular DataOn the first day of caffeine administration, fetal plasma caf-feine concentration reached 32 ± 1 mg/l at 1 h, decreasing to 19 ± 3 mg/l at 6 h and 5 ± 2 mg/l at 24 h (prior to the next
injection, Figure 1a). Maternal plasma caffeine concentration reached 43 ± 9 mg/l at 1 h, decreasing to 24 ± 5 mg/l at 6 h and 5 ± 1 mg/l at 24 h (Figure 1a). This concentration profile was similar for the next 2 d of caffeine administration (only days 1–2 shown). On days 1–3 of caffeine administration, there were no significant differences in plasma caffeine concentra-tions between the maternal and fetal circulation at 1, 6, or 24 h (Ptreatment = 0.43).
Fetal mean arterial pressure remained stable following caf-feine administration and was not significantly different at 1, 6, or 24 h postcaffeine administration between the control and the caffeine-treated groups from day 1 to 3 (Ptreatment = 0.61; only days 1 and 2 shown; Figure 1b). Caffeine administration did not affect fetal heart rate at 1, 6, or 24 h postcaffeine admin-istration from day 1 to 3 (Ptreatment = 0.18; only days 1 and 2 shown; Figure 1c).
Fetal and Maternal Blood ChemistryOn day 1 of the treatment period (104 d of gestation (DG)), there was a small but significant effect of caffeine over time in fetal arterial pH (Ptime × treatment = 0.04) and PaCO2 (Ptime × treatment = 0.005); caffeine-treated fetuses had a transiently higher pH and lower PaCO2 (Figure 2a,b) than control fetuses. On days 2 and 3, there were no significant differences between groups in pH (day 2, Ptreatment = 0.76; day 3, Ptreatment = 0.90) and PaCO2 (day 2, Ptreatment = 0.90; day 3, Ptreatment = 0.74) measured just prior to caffeine administration (0 h) and at 1-, 2-, 4-, and 6-h postcaf-feine. Between days 1 and 3, there were no significant effects of caffeine on fetal PaO2 (Ptreatment = 0.14; Figure 2c), arterial oxygen saturation (Ptreatment = 0.42; Figure 2d) or hemoglobin (Ptreatment = 0.70; Figure 2e), glucose (Ptreatment = 0.80; Figure 2f), and lactate (Ptreatment = 0.32; Figure 2g) concentrations. From days 4 to 15, there were no significant differences between groups in any measured fetal blood variable (data not shown).
Caffeine administration led to a transient increase in mater-nal arterial pH (Ptime × treatment = 0.04) on day 1 of the treatment period (104 DG), with no significant effects thereafter (data not shown). From 104 to 118 DG, there were no significant effects of caffeine on maternal PaCO2, PaO2, arterial oxy-gen saturation or glucose, and hemoglobin concentrations. Caffeine administration led to a significant increase in mater-nal lactate concentration (Pday × treatment = 0.008) from day 1 to 3 of treatment, with no significant effects subsequently.
Body and Organ WeightsAt necropsy, there were no significant differences between con-trol and caffeine-treated fetuses in body weight, brain weight, brain-to-body-weight ratio, crown-to-rump length, thoracic girth, hind limb length, head length, ponderal index, and other organ weights (absolute or relative to body weight; Table 1).
Structural Analysis of Cerebral WMThere was no evidence of intracerebral or intraventricular hemorrhages in control or caffeine-treated fetuses. The den-sity of oligodendrocytes was similar in control and caffeine-treated fetuses when assessed in the subcortical (P = 0.92) and
Figure 1. Maternal and fetal plasma caffeine concentrations (a), fetal mean arterial pressure (MAP) (b), and heart rate (c) on day 1–2 of caffeine administration. There were no significant differences in plasma caffeine concentrations between the maternal (open circles; n = 2) and fetal (closed squares; n = 6) circulation at 1, 6, or 24 h after caffeine administra-tion from day 1 (loading dose: 25 mg/kg) to day 2 (maintenance dose: 20 mg/kg). There was also no significant difference in fetal arterial pressure or heart rate at 0, 1, or 6 h between the control (open squares; n = 3) and caffeine-treated (closed squares; n = 4) fetuses from day 1 to 2.
00 4 8 12 16 20 24 4 8 12 16 20 24
10
20
30
Pla
sma
caffe
ine
conc
entr
atio
n (m
g/l)
30
32
34
36
38
40
0 4 8 12 16 20 24
Sample time (h)
Sample time (h)
4 8 12 16 20 24
MA
P (
mm
Hg)
140
160
180
200
220
240
0 4 8 12 16 20 24
Sample time (h)
4 8 12 16 20 24
HR
(be
ats/
min
)
40
50
60
a
b
c
2 Pediatric ReseARCH Copyright © 2014 International Pediatric Research Foundation, Inc.

Caffeine and developing white matter Articles
Figure 2. Arterial pH (a), PaCO2 (b), PaO2 (c), arterial oxygen saturation (SaO2; d), total hemoglobin (tHb; e), glucose (Glu; f), and lactate (Lac; g) in control (open circles; n = 5) and caffeine-treated (closed squares; n = 6) fetuses. On day 1 of treatment (104 d of gestation (DG)), there was an effect of caffeine over time for arterial pH (Ptime × treatment = 0.04); caffeine-treated fetuses had a transiently higher pH, with no significant differences from 105 to 118 DG. There was a significant effect of caffeine over time for arterial PaCO2 (Ptime × treatment = 0.005) on day 1 of treatment (104 DG); caffeine-treated fetuses had a lower PaCO2 compared with controls, with no significant differences from 105 to 118 DG. There were no significant differences in the fetal PaO2, SaO2, tHb, Glu, and Lac concentrations from 104 to 118 DG.
7.32
Day 1 Day 2
Sample time (d)
Day 3
16
18
20
22
24
26
28
30
Day 1 Day 2
Sample time (d)
Day 3 Day 1
40
45
50
55
60
65
SaO
2 (%
)
70
75
80
Day 2
Sample time (d)
Day 3
Day 1 Day 2
Sample time (d)
Day 3 Day 1 Day 2
Sample time (d)
Day 3
7.34
7.36
pH
40
42
44
46
48
50
52
54
56
Day 1 Day 2
Sample time (d)
Day 3
PaC
O2
(mm
Hg)
PaO
2 (m
mH
g)
6
7
8
9
10
11
12
tHb
(g/d
l)
Day 1 Day 2
Sample time (d)
Day 3
0.0
0.5
1.0
1.5
2.0
2.5
Lac
(mm
ol/l)
0.0
0.5
1.0
1.5
2.0
Glu
(m
mol
/l)
7.38
7.40a b
c d
e
g
f
Pediatric ReseARCH 3Copyright © 2014 International Pediatric Research Foundation, Inc.
Articles Atik et al.
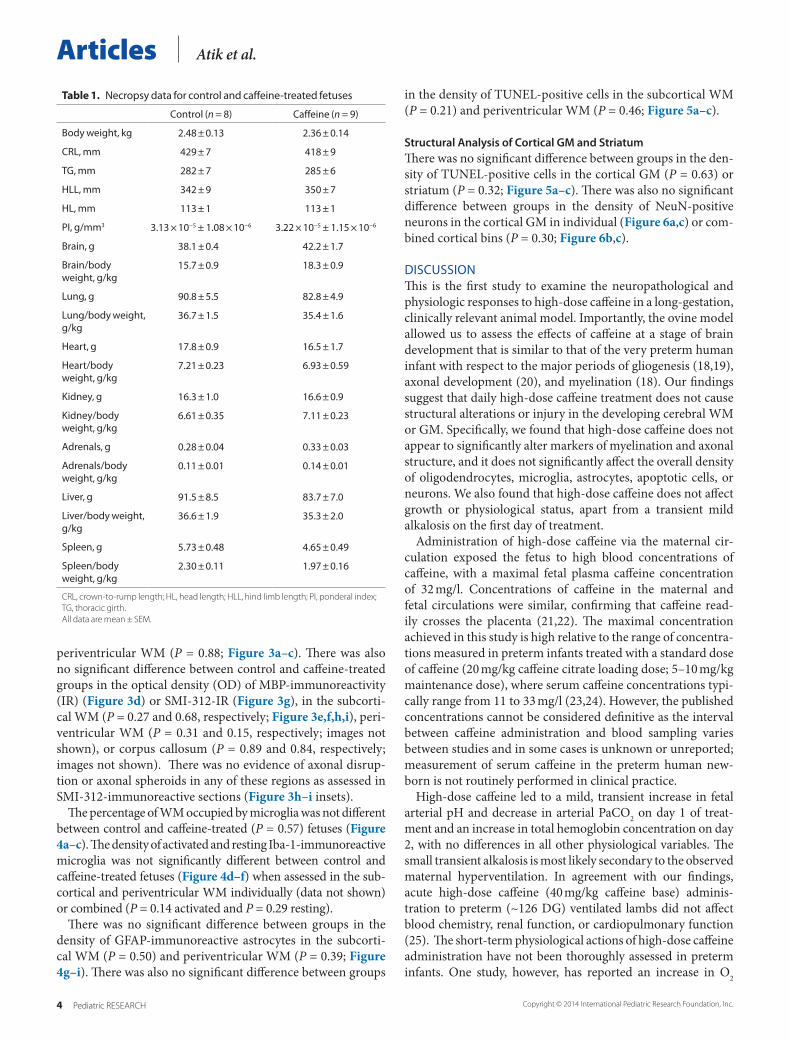
periventricular WM (P = 0.88; Figure 3a–c). There was also no significant difference between control and caffeine-treated groups in the optical density (OD) of MBP-immunoreactivity (IR) (Figure 3d) or SMI-312-IR (Figure 3g), in the subcorti-cal WM (P = 0.27 and 0.68, respectively; Figure 3e,f,h,i), peri-ventricular WM (P = 0.31 and 0.15, respectively; images not shown), or corpus callosum (P = 0.89 and 0.84, respectively; images not shown). There was no evidence of axonal disrup-tion or axonal spheroids in any of these regions as assessed in SMI-312-immunoreactive sections (Figure 3h–i insets).
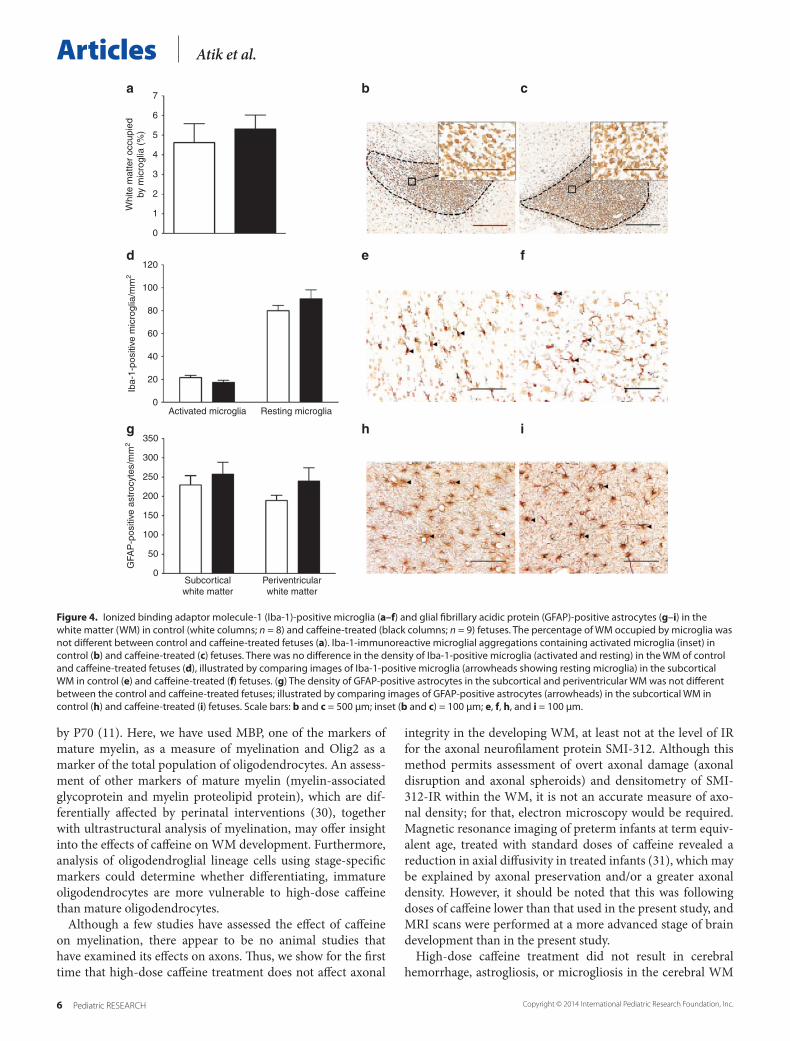
The percentage of WM occupied by microglia was not different between control and caffeine-treated (P = 0.57) fetuses (Figure 4a–c). The density of activated and resting Iba-1-immunoreactive microglia was not significantly different between control and caffeine-treated fetuses (Figure 4d–f) when assessed in the sub-cortical and periventricular WM individually (data not shown) or combined (P = 0.14 activated and P = 0.29 resting).
There was no significant difference between groups in the density of GFAP-immunoreactive astrocytes in the subcorti-cal WM (P = 0.50) and periventricular WM (P = 0.39; Figure 4g–i). There was also no significant difference between groups
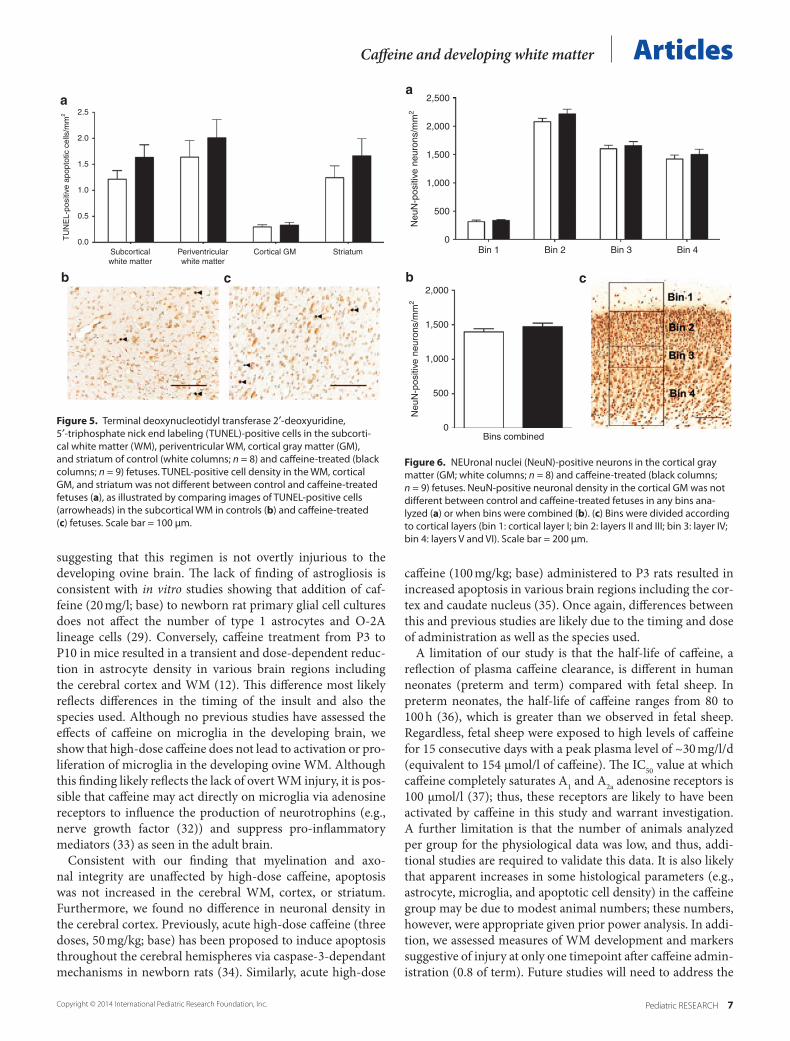
in the density of TUNEL-positive cells in the subcortical WM (P = 0.21) and periventricular WM (P = 0.46; Figure 5a–c).
Structural Analysis of Cortical GM and StriatumThere was no significant difference between groups in the den-sity of TUNEL-positive cells in the cortical GM (P = 0.63) or striatum (P = 0.32; Figure 5a–c). There was also no significant difference between groups in the density of NeuN-positive neurons in the cortical GM in individual (Figure 6a,c) or com-bined cortical bins (P = 0.30; Figure 6b,c).
DISCUSSIONThis is the first study to examine the neuropathological and physiologic responses to high-dose caffeine in a long-gestation, clinically relevant animal model. Importantly, the ovine model allowed us to assess the effects of caffeine at a stage of brain development that is similar to that of the very preterm human infant with respect to the major periods of gliogenesis (18,19), axonal development (20), and myelination (18). Our findings suggest that daily high-dose caffeine treatment does not cause structural alterations or injury in the developing cerebral WM or GM. Specifically, we found that high-dose caffeine does not appear to significantly alter markers of myelination and axonal structure, and it does not significantly affect the overall density of oligodendrocytes, microglia, astrocytes, apoptotic cells, or neurons. We also found that high-dose caffeine does not affect growth or physiological status, apart from a transient mild alkalosis on the first day of treatment.
Administration of high-dose caffeine via the maternal cir-culation exposed the fetus to high blood concentrations of caffeine, with a maximal fetal plasma caffeine concentration of 32 mg/l. Concentrations of caffeine in the maternal and fetal circulations were similar, confirming that caffeine read-ily crosses the placenta (21,22). The maximal concentration achieved in this study is high relative to the range of concentra-tions measured in preterm infants treated with a standard dose of caffeine (20 mg/kg caffeine citrate loading dose; 5–10 mg/kg maintenance dose), where serum caffeine concentrations typi-cally range from 11 to 33 mg/l (23,24). However, the published concentrations cannot be considered definitive as the interval between caffeine administration and blood sampling varies between studies and in some cases is unknown or unreported; measurement of serum caffeine in the preterm human new-born is not routinely performed in clinical practice.
High-dose caffeine led to a mild, transient increase in fetal arterial pH and decrease in arterial PaCO2 on day 1 of treat-ment and an increase in total hemoglobin concentration on day 2, with no differences in all other physiological variables. The small transient alkalosis is most likely secondary to the observed maternal hyperventilation. In agreement with our findings, acute high-dose caffeine (40 mg/kg caffeine base) adminis-tration to preterm (~126 DG) ventilated lambs did not affect blood chemistry, renal function, or cardiopulmonary function (25). The short-term physiological actions of high-dose caffeine administration have not been thoroughly assessed in preterm infants. One study, however, has reported an increase in O2
table 1. Necropsy data for control and caffeine-treated fetuses
Control (n = 8) Caffeine (n = 9)
Body weight, kg 2.48 ± 0.13 2.36 ± 0.14
CRL, mm 429 ± 7 418 ± 9
TG, mm 282 ± 7 285 ± 6
HLL, mm 342 ± 9 350 ± 7
HL, mm 113 ± 1 113 ± 1
PI, g/mm3 3.13 × 10⁻⁵ ± 1.08 × 10⁻⁶ 3.22 × 10⁻⁵ ± 1.15 × 10⁻⁶
Brain, g 38.1 ± 0.4 42.2 ± 1.7
Brain/body weight, g/kg
15.7 ± 0.9 18.3 ± 0.9
Lung, g 90.8 ± 5.5 82.8 ± 4.9
Lung/body weight, g/kg
36.7 ± 1.5 35.4 ± 1.6
Heart, g 17.8 ± 0.9 16.5 ± 1.7
Heart/body weight, g/kg
7.21 ± 0.23 6.93 ± 0.59
Kidney, g 16.3 ± 1.0 16.6 ± 0.9
Kidney/body weight, g/kg
6.61 ± 0.35 7.11 ± 0.23
Adrenals, g 0.28 ± 0.04 0.33 ± 0.03
Adrenals/body weight, g/kg
0.11 ± 0.01 0.14 ± 0.01
Liver, g 91.5 ± 8.5 83.7 ± 7.0
Liver/body weight, g/kg
36.6 ± 1.9 35.3 ± 2.0
Spleen, g 5.73 ± 0.48 4.65 ± 0.49
Spleen/body weight, g/kg
2.30 ± 0.11 1.97 ± 0.16
CRL, crown-to-rump length; HL, head length; HLL, hind limb length; PI, ponderal index; TG, thoracic girth.All data are mean ± seM.
4 Pediatric ReseARCH Copyright © 2014 International Pediatric Research Foundation, Inc.
Caffeine and developing white matter Articles
consumption and a reduction in weight gain in preterm infants born at 28–33 wk of gestation when treated with standard doses of caffeine citrate, with no differences in arterial oxygen satu-ration 4 wk after caffeine therapy (26). Furthermore, Hoecker et al (27) reported an increase in arterial pressure in preterm infants, 1 and 20 h after day 2 of caffeine administration, and an increase in heart rate 20 h after day 2 of caffeine exposure. However, these increases were compared with measurements taken just prior to caffeine administration and not to a control group. When caffeine-treated preterm infants were compared with controls, mean arterial pressure increased on the first 3 days of administration; no differences in heart rate were found for measurements taken 1 h before and 1 h after caffeine (28).
High-dose caffeine treatment did not affect myelination in the brain; more specifically, there was no change in the areal density of oligodendrocytes or densitometry of MBP-IR in the cerebral WM. Our findings are consistent with an in vitro study, which showed that treatment with 20 mg/l of caffeine (base), a concentration similar to the mean blood concentra-tion achieved in the present study, did not affect the density of oligodendroglial lineage cells or the secretion of hyaluronic acid (29), a factor known to inhibit myelination. This is in con-trast to a study in postnatal mice, in which high-dose caffeine administration (40 or 80 mg/kg; base) from postnatal days (P) 1–17 resulted in a dose dependent and transient decrease in myelin concentration at P30 with full recovery and overshoot
Figure 3. Oligodendrocyte transcription factor 2 (Olig2-), myelin basic protein (MBP-), and SMI-312-IR in the WM and corpus callosum of control (white columns; n = 8) and caffeine-treated (black columns; n = 9) fetuses. There was no significant difference between groups in the density of Olig2-immunoreactive oligodendrocytes (a), optical density (OD) of MBP-IR (d), or OD of SMI-312-IR (g) in the subcortical WM, periventricular WM, or corpus cal-losum. For the subcortical WM, this is illustrated by comparing images of Olig2-, MBP-, and SMI-312-IR in control (b, e, and h) and caffeine-treated fetuses (c, f, and i). In SMI-312-immunostained sections, we found no evidence of axonal disruption or axonal spheroids (black boxes in h–i represent high-power insets). Scale bars: b and c = 100 μm; e, f, h, and i = 500 μm; inset (h and i) = 100 μm.
0Subcorticalwhite matter
Periventricularwhite matter
500
1,000
1,500
2,000O
lig2-
posi
tive
olig
oden
droc
ytes
/mm
2
0.00
0.05
0.10
0.15
Subcorticalwhite matter
Periventricularwhite matter
Corpuscallosum
MB
P-I
R o
ptic
al d
ensi
ty
0.00
0.02
0.04
0.06
0.08
Subcorticalwhite matter
Periventricularwhite matter
Corpuscallosum
SM
I-31
2-IR
opt
ical
den
sity
a b c
d e f
g h i
Pediatric ReseARCH 5Copyright © 2014 International Pediatric Research Foundation, Inc.
Articles Atik et al.
by P70 (11). Here, we have used MBP, one of the markers of mature myelin, as a measure of myelination and Olig2 as a marker of the total population of oligodendrocytes. An assess-ment of other markers of mature myelin (myelin-associated glycoprotein and myelin proteolipid protein), which are dif-ferentially affected by perinatal interventions (30), together with ultrastructural analysis of myelination, may offer insight into the effects of caffeine on WM development. Furthermore, analysis of oligodendroglial lineage cells using stage-specific markers could determine whether differentiating, immature oligodendrocytes are more vulnerable to high-dose caffeine than mature oligodendrocytes.
Although a few studies have assessed the effect of caffeine on myelination, there appear to be no animal studies that have examined its effects on axons. Thus, we show for the first time that high-dose caffeine treatment does not affect axonal
integrity in the developing WM, at least not at the level of IR for the axonal neurofilament protein SMI-312. Although this method permits assessment of overt axonal damage (axonal disruption and axonal spheroids) and densitometry of SMI-312-IR within the WM, it is not an accurate measure of axo-nal density; for that, electron microscopy would be required. Magnetic resonance imaging of preterm infants at term equiv-alent age, treated with standard doses of caffeine revealed a reduction in axial diffusivity in treated infants (31), which may be explained by axonal preservation and/or a greater axonal density. However, it should be noted that this was following doses of caffeine lower than that used in the present study, and MRI scans were performed at a more advanced stage of brain development than in the present study.
High-dose caffeine treatment did not result in cerebral hemorrhage, astrogliosis, or microgliosis in the cerebral WM
Figure 4. Ionized binding adaptor molecule-1 (Iba-1)-positive microglia (a–f) and glial fibrillary acidic protein (GFAP)-positive astrocytes (g–i) in the white matter (WM) in control (white columns; n = 8) and caffeine-treated (black columns; n = 9) fetuses. The percentage of WM occupied by microglia was not different between control and caffeine-treated fetuses (a). Iba-1-immunoreactive microglial aggregations containing activated microglia (inset) in control (b) and caffeine-treated (c) fetuses. There was no difference in the density of Iba-1-positive microglia (activated and resting) in the WM of control and caffeine-treated fetuses (d), illustrated by comparing images of Iba-1-positive microglia (arrowheads showing resting microglia) in the subcortical WM in control (e) and caffeine-treated (f) fetuses. (g) The density of GFAP-positive astrocytes in the subcortical and periventricular WM was not different between the control and caffeine-treated fetuses; illustrated by comparing images of GFAP-positive astrocytes (arrowheads) in the subcortical WM in control (h) and caffeine-treated (i) fetuses. Scale bars: b and c = 500 μm; inset (b and c) = 100 μm; e, f, h, and i = 100 μm.
0
1
2
3
4
5
6
Whi
te m
atte
r oc
cupi
edby
mic
rogl
ia (
%)
0Activated microglia Resting microglia
20
40
60
80
100
120
Iba-
1-po
sitiv
e m
icro
glia
/mm
2
0
50
100
150
200
250
300
350
Subcorticalwhite matter
Periventricularwhite matter
GFA
P-p
ositi
ve a
stro
cyte
s/m
m2
7a b c
d e f
g h i
6 Pediatric ReseARCH Copyright © 2014 International Pediatric Research Foundation, Inc.
Caffeine and developing white matter Articles
suggesting that this regimen is not overtly injurious to the developing ovine brain. The lack of finding of astrogliosis is consistent with in vitro studies showing that addition of caf-feine (20 mg/l; base) to newborn rat primary glial cell cultures does not affect the number of type 1 astrocytes and O-2A lineage cells (29). Conversely, caffeine treatment from P3 to P10 in mice resulted in a transient and dose-dependent reduc-tion in astrocyte density in various brain regions including the cerebral cortex and WM (12). This difference most likely reflects differences in the timing of the insult and also the species used. Although no previous studies have assessed the effects of caffeine on microglia in the developing brain, we show that high-dose caffeine does not lead to activation or pro-liferation of microglia in the developing ovine WM. Although this finding likely reflects the lack of overt WM injury, it is pos-sible that caffeine may act directly on microglia via adenosine receptors to influence the production of neurotrophins (e.g., nerve growth factor (32)) and suppress pro-inflammatory mediators (33) as seen in the adult brain.
Consistent with our finding that myelination and axo-nal integrity are unaffected by high-dose caffeine, apoptosis was not increased in the cerebral WM, cortex, or striatum. Furthermore, we found no difference in neuronal density in the cerebral cortex. Previously, acute high-dose caffeine (three doses, 50 mg/kg; base) has been proposed to induce apoptosis throughout the cerebral hemispheres via caspase-3-dependant mechanisms in newborn rats (34). Similarly, acute high-dose
caffeine (100 mg/kg; base) administered to P3 rats resulted in increased apoptosis in various brain regions including the cor-tex and caudate nucleus (35). Once again, differences between this and previous studies are likely due to the timing and dose of administration as well as the species used.
A limitation of our study is that the half-life of caffeine, a reflection of plasma caffeine clearance, is different in human neonates (preterm and term) compared with fetal sheep. In preterm neonates, the half-life of caffeine ranges from 80 to 100 h (36), which is greater than we observed in fetal sheep. Regardless, fetal sheep were exposed to high levels of caffeine for 15 consecutive days with a peak plasma level of ~30 mg/l/d (equivalent to 154 μmol/l of caffeine). The IC50 value at which caffeine completely saturates A1 and A2a adenosine receptors is 100 μmol/l (37); thus, these receptors are likely to have been activated by caffeine in this study and warrant investigation. A further limitation is that the number of animals analyzed per group for the physiological data was low, and thus, addi-tional studies are required to validate this data. It is also likely that apparent increases in some histological parameters (e.g., astrocyte, microglia, and apoptotic cell density) in the caffeine group may be due to modest animal numbers; these numbers, however, were appropriate given prior power analysis. In addi-tion, we assessed measures of WM development and markers suggestive of injury at only one timepoint after caffeine admin-istration (0.8 of term). Future studies will need to address the
Figure 5. Terminal deoxynucleotidyl transferase 2′-deoxyuridine, 5′-triphosphate nick end labeling (TUNEL)-positive cells in the subcorti-cal white matter (WM), periventricular WM, cortical gray matter (GM), and striatum of control (white columns; n = 8) and caffeine-treated (black columns; n = 9) fetuses. TUNEL-positive cell density in the WM, cortical GM, and striatum was not different between control and caffeine-treated fetuses (a), as illustrated by comparing images of TUNEL-positive cells (arrowheads) in the subcortical WM in controls (b) and caffeine-treated (c) fetuses. Scale bar = 100 μm.
0.0Subcorticalwhite matter
Periventricularwhite matter
Cortical GM Striatum
0.5
1.0
TU
NE
L-po
sitiv
e ap
opto
tic c
ells
/mm
2
1.5
2.0
2.5a
b c
Figure 6. NEUronal nuclei (NeuN)-positive neurons in the cortical gray matter (GM; white columns; n = 8) and caffeine-treated (black columns; n = 9) fetuses. NeuN-positive neuronal density in the cortical GM was not different between control and caffeine-treated fetuses in any bins ana-lyzed (a) or when bins were combined (b). (c) Bins were divided according to cortical layers (bin 1: cortical layer I; bin 2: layers II and III; bin 3: layer IV; bin 4: layers V and VI). Scale bar = 200 μm.
0Bin 1
Bins combined0
500
1,000
1,500
2,000
Bin 2 Bin 3 Bin 4
500
1,000
1,500
Neu
N-p
ositi
ve n
euro
ns/m
m2
Neu
N-p
ositi
ve n
euro
ns/m
m2
2,000
2,500a
b c
Pediatric ReseARCH 7Copyright © 2014 International Pediatric Research Foundation, Inc.
Articles Atik et al.
effects of daily high-dose caffeine treatment on the ultrastruc-ture of the WM, both in the short- and long-term.
ConclusionDaily high-dose caffeine does not overtly injure the develop-ing ovine WM or GM, or affect physiological status or growth at a stage of brain development that is similar to that of pre-term infants receiving caffeine for AOP. Before definitive con-clusions can be drawn about the safety of high-dose caffeine for the treatment of AOP, the possible effects of caffeine on other parameters of brain development such as process growth and connectivity, previously shown to be affected by caffeine (9), need to be studied. Furthermore, the potential impact of high-dose caffeine on other brain regions and the long-term consequences of high-dose caffeine treatment require further investigation.
METHODSAll experimental procedures were approved by the Monash University Animal Ethics Committee.
SurgeryUsing established techniques, aseptic surgery was conducted at 99 DG (term is ~147 DG) on 14 date-mated ewes (Merino × Border Leicester (13)). Catheters were chronically implanted into a fetal femoral artery for blood sampling and recording arterial pressure, a fetal femoral vein and the amniotic sac for the administration of antibiotics, a maternal jugular vein for drug infusions, and a maternal carotid artery for monitoring maternal physiological status includ-ing arterial pressure and heart rate. Antibiotics (Engemycin (100 mg/ml, i.v.; fetus: 0.2 ml and ewe: 4.8 ml) and ampicillin (1 g/5 ml; fetus: 1 ml, intravenous and amniotic sac: 4 ml)) were administered for 3 d after surgery. Postoperatively, sheep were held in individual pens with access to food and water.
Experimental ProtocolA daily bolus dose (loading dose, 25 mg/kg; maintenance dose, 20 mg/kg) of caffeine base (Sigma-Aldrich, St Louis, MO; n = 9) or an equivalent volume of saline (n = 8) was administered intravenously to the ewe between 104 and 118 DG (0.7–0.8 of term). We admin-istered caffeine base rather than caffeine citrate to minimize the vol-ume required. Caffeine citrate contains anhydrous citric acid and 50% anhydrous caffeine base; thus, the dose of caffeine base is approxi-mately half that of caffeine citrate (36). On the first 3 d of the caffeine administration (104–106 DG), fetal and maternal arterial pressures were monitored for 1 h before and for 5 h after each daily caffeine administration. Blood samples were collected hourly for 6 h from 104–106 DG and then 3 times/d (just prior to caffeine administration (0 h), 1 and 6 h postcaffeine administration) until 118 DG; these were used to measure plasma caffeine concentrations (maternal and fetal) and to assess physiological status.
NecropsyAt 119 DG (0.8 of term), the ewe and fetus were euthanized using sodium pentobarbitone (130 mg/kg intravenous), and the fetus was delivered via cesarean section. Fetal weight and body dimensions were measured, and the ponderal index was calculated (body weight/crown-to-rump length3). The fetuses (control, n = 8 and caffeine, n = 9) were transcardially perfused with isotonic saline and 4% parafor-maldehyde in 0.1 M phosphate buffer (pH 7.4). Cerebral hemisphere, whole brain, and major organs were weighed.
HistologyThe entire forebrain was cut coronally into blocks 5 mm thick (8–10/animal). Blocks of the entire right hemisphere were then postfixed in 4% paraformaldehyde (4 d, 4 °C) and embedded in paraffin. Serial sections (8 µm thick) were cut from each block, and 1 section/block stained with thionin and examined for hemorrhages and gross struc-tural alterations.
ImmunohistochemistrySections from equivalent sites from each lobe of the right cerebral hemisphere were reacted with the following antibodies: rabbit anti-Olig2 (1:500, AB9610; Millipore, Billerica, MA) to identify the entire population of oligodendrocytes, rat anti-MBP (1:100, MAB395; Millipore) to identify mature oligodendrocytes and myelin, mouse anti-SMI-312 (1:1,000, SMI-312; Covance, Princeton, NJ) to iden-tify axonal neurofilaments, rabbit anti-Iba-1 (1:1,500, 019-19741; WAKO Pure Chemical Industries, Osaka, Japan) to identify microg-lia, rabbit anti-GFAP (1:1,000, ZO2334; DAKO, Carpinteria, CA) to identify astrocytes, and mouse anti-NeuN (1:200, MAB377; Millipore) to identify neurons. Sections were incubated in the appropriate biotinylated secondary antibodies (1:200), reacted using the avidin–biotin complex elite kit (Vector Laboratories, Burlingame, CA), and counterstained with 0.1% thionin (Iba-1 and GFAP only) as previously described (13). Prior to incubation with anti-Olig2, -MBP, -Iba-1, -GFAP, and -NeuN, antigen retrieval in sodium citrate buffer (pH 6.0) was performed using a microwave oven. For SMI-312, the sections were pretreated with 0.02% pro-teinase K (30 min, 37 °C). Sections from each lobe were stained with DeadEnd Colorimetric TUNEL system (Promega, Madison, WI) to identify apoptotic and necrotic cell death (38). Identical staining parameters were used for each antibody, and sections from control and caffeine-treated animals were simultaneously reacted to reduce
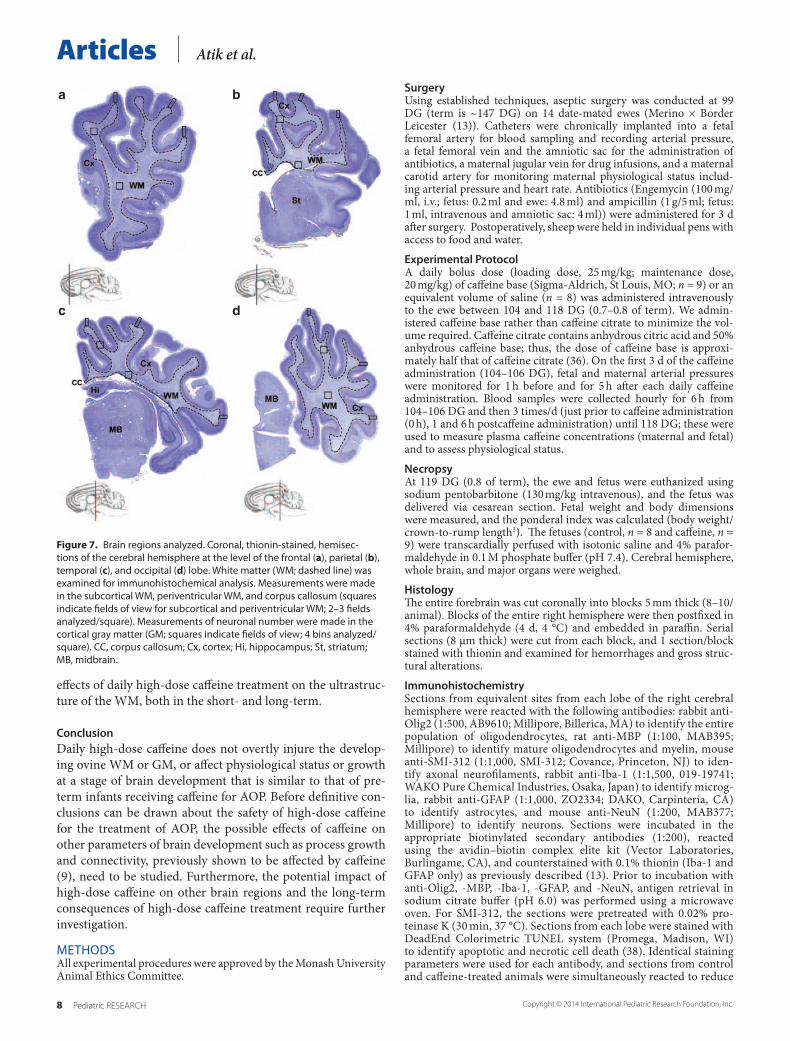
Figure 7. Brain regions analyzed. Coronal, thionin-stained, hemisec-tions of the cerebral hemisphere at the level of the frontal (a), parietal (b), temporal (c), and occipital (d) lobe. White matter (WM; dashed line) was examined for immunohistochemical analysis. Measurements were made in the subcortical WM, periventricular WM, and corpus callosum (squares indicate fields of view for subcortical and periventricular WM; 2–3 fields analyzed/square). Measurements of neuronal number were made in the cortical gray matter (GM; squares indicate fields of view; 4 bins analyzed/square). CC, corpus callosum; Cx, cortex; Hi, hippocampus; St, striatum; MB, midbrain.
a b
c d
8 Pediatric ReseARCH Copyright © 2014 International Pediatric Research Foundation, Inc.

Caffeine and developing white matter Articlesstaining variability. There was no staining when the primary anti-bodies were omitted.
Quantitative AnalysisAnalyses were performed on coded slides (observer blinded to group) from the right cerebral hemisphere using an image analysis system (Image-Pro Plus v6.2; Media Cybernetics, Rockville, MD). Immunohistochemical analyses were performed on one section from each of the frontal, parietal, temporal, and occipital lobe from each fetus at equivalent areas within the WM and GM (TUNEL and NeuN only; Figure 7). All areal densities are expressed as cells per square millimeter, and OD is expressed in arbitrary units.
OD of MBP- and SMI-312. The intensity of MBP- and SMI-312-IR in the cerebral WM was determined using an OD analysis as vali-dated by us (30). Prior to measuring, the image analysis system was calibrated using an image of a blank section of the glass slide (inci-dent light) and obscured section of the slide (infinite OD). From each section, OD was assessed in three fields from equivalent regions of each of the subcortical WM, periventricular WM, and corpus callo-sum, with a total of 6–9 fields from each section (field 0.093 mm2). A correction was applied to each of these images by subtracting the OD measurement from a region of background staining. The mean OD was then calculated within each region, for each animal, and a mean of means determined for control and caffeine-treated animals. Imaging and analysis of each of the immunostains were performed in a single day using identical parameters to maintain consistency and eliminate error.
Percentage WM occupied by Iba-1-immunoreactive microg-lia. The proportion of WM area occupied by Iba-1-immunoreactive microglia was assessed in every 625th section throughout the entire right cerebral hemisphere (n = 8 sections/animal) using a digitizer interfaced to image analysis software. The area of each aggregation within a section was totaled and divided by the area of the WM of that section; data were expressed as a percentage (%). The mean was then calculated for each animal, and a mean of means for control and caffeine-treated groups was determined.
Areal density of Iba-1-, GFAP-, Olig2-, TUNEL-, and NeuN-positive cells. Resting (ramified) and activated (amoeboid) Iba-1-positive microglia (distinguished by morphology), GFAP-positive astrocytes, and Olig2-positive oligodendrocytes were counted in 2–3 fields from both the subcortical and periventricular WM, with a total of 4–6 fields/section (field: 0.093 mm2). TUNEL-positive cells were counted throughout the subcortical WM, periventricular WM, corti-cal GM, and striatum (including the internal capsule); the area of each region was also measured to determine the areal cell density. NeuN-positive neurons in the cortical GM were counted in one field (field: 0.56 mm2) in three gyri; each field was then divided into four bins (bin 1: cortical layer I; bin 2: layers II and III; bin 3: layer IV; bin 4: layers V and VI). For each immunostain, the mean cell density was calculated for each animal and for each region or bin, and a mean of means for control and caffeine-treated groups was determined.
Qualitative AnalysisAll SMI-312-immunoreactive sections were qualitatively assessed for the presence of disrupted axons and axonal spheroids.
StatisticsPower analysis was performed using the software package G*Power3. Using data (microglial cell density) from a previous study (13), we determined that 7 animals/group would enable us to detect 1.8 SD difference between group means (80% power, 5% type 1 error rate). Differences between treatment groups in body mor-phometry, organ weights, and histological data were analyzed by the Student’s t-test for parametric data or a Mann−Whitney U-test for nonparametric data. For physiological data (days 1–3), separate one-way repeated measures ANOVA (factors: treatment and time of day (repeated factor)) was used for each day. For physiologi-cal data (days 4–15) and cardiovascular data (days 1–2), a single two-way repeated measures ANOVA (factors: day, treatment, and
time of day (repeated factor)) was used. Data are presented as mean of means ± SEM (histology) or mean ± SEM (all other data) with P < 0.05 considered significant.
ACKNOWLEDGMENTSWe thank Prof L. Doyle for his support and Ms N. Blasch for her technical assistance.
STATEMENT OF FINANCIAL SUPPORTThis work was funded by the National Health and Medical Research Council of Australia (ID 628312 to M.T., J.C., R.D., S.R., and R.H.), Early Career Fellow-ship (ID 1053787 to J.C.), and the Victorian Government’s Operational Infra-structure Support Program (Government of Victoria).
Disclosure: The authors certify that there are no potential perceived conflicts of interest or financial disclosures related to this work.
REFERENCES 1. Martin RJ, Abu-Shaweesh JM, Baird TM. Apnoea of prematurity. Paediatr
Respir Rev 2004;5 Suppl A:S377–S82. 2. Henderson-Smart DJ. The effect of gestational age on the incidence
and duration of recurrent apnoea in newborn babies. Aust Paediatr J 1981;17:273–6.
3. Abu-Shaweesh JM, Martin RJ. Neonatal apnea: what’s new? Pediatr Pulm-onol 2008;43:937–44.
4. Schmidt B, Roberts RS, Davis P, et al. Caffeine therapy for apnea of prema-turity. N Engl J Med 2006;354:2112–21.
5. Schmidt B, Roberts RS, Davis P, et al. Long-term effects of caffeine therapy for apnea of prematurity. N Engl J Med 2007;357:1893–902.
6. Scanlon JE, Chin KC, Morgan ME, Durbin GM, Hale KA, Brown SS. Caf-feine or theophylline for neonatal apnoea? Arch Dis Child 1992;67:425–8.
7. Steer PA, Flenady VJ, Shearman A, Lee TC, Tudehope DI, Charles BG. Periextubation caffeine in preterm neonates: a randomized dose response trial. J Paediatr Child Health 2003;39:511–5.
8. Gray PH, Flenady VJ, Charles BG, Steer PA. Caffeine citrate for very pre-term infants: effects on development, temperament and behaviour. J Pae-diatr Child Health 2011;47:167–72.
9. Juárez-Méndez S, Carretero R, Martínez-Tellez R, Silva-Gómez AB, Flores G. Neonatal caffeine administration causes a permanent increase in the dendritic length of prefrontal cortical neurons of rats. Synapse 2006;60:450–5.
10. Connolly S, Kingsbury TJ. Caffeine modulates CREB-dependent gene expression in developing cortical neurons. Biochem Biophys Res Commun 2010;397:152–6.
11. Fuller GN, Divakaran P, Wiggins RC. The effect of postnatal caffeine administration on brain myelination. Brain Res 1982;249:189–91.
12. Desfrere L, Olivier P, Schwendimann L, Verney C, Gressens P. Transient inhibition of astrocytogenesis in developing mouse brain following post-natal caffeine exposure. Pediatr Res 2007;62:604–9.
13. Rees S, Hale N, De Matteo R, et al. Erythropoietin is neuroprotective in a preterm ovine model of endotoxin-induced brain injury. J Neuropathol Exp Neurol 2010;69:306–19.
14. Back SA, Luo NL, Borenstein NS, Volpe JJ, Kinney HC. Arrested oligoden-drocyte lineage progression during human cerebral white matter develop-ment: dissociation between the timing of progenitor differentiation and myelinogenesis. J Neuropathol Exp Neurol 2002;61:197–211.
15. Back SA, Riddle A, Hohimer AR. Role of instrumented fetal sheep prepa-rations in defining the pathogenesis of human periventricular white-mat-ter injury. J Child Neurol 2006;21:582–9.
16. Roessmann U, Gambetti P. Pathological reaction of astrocytes in peri-natal brain injury. Immunohistochemical study. Acta Neuropathol 1986;70:302–7.
17. Billiards SS, Haynes RL, Folkerth RD, et al. Development of microglia in the cerebral white matter of the human fetus and infant. J Comp Neurol 2006;497:199–208.
18. Back SA, Luo NL, Borenstein NS, Levine JM, Volpe JJ, Kinney HC. Late oligodendrocyte progenitors coincide with the developmental window of vulnerability for human perinatal white matter injury. J Neurosci 2001;21:1302–12.
Pediatric ReseARCH 9Copyright © 2014 International Pediatric Research Foundation, Inc.
Articles Atik et al.
19. Roessmann U, Gambetti P. Astrocytes in the developing human brain. An immunohistochemical study. Acta Neuropathol 1986;70:308–13.
20. Haynes RL, Borenstein NS, Desilva TM, et al. Axonal development in the cerebral white matter of the human fetus and infant. J Comp Neurol 2005;484:156–67.
21. Wilson SJ, Ayromlooi J, Errick JK. Pharmacokinetic and hemo-dynamic effects of caffeine in the pregnant sheep. Obstet Gynecol 1983;61:486–92.
22. Ikeda GJ, Sapienza PP, McGinnis ML, Bragg LE, Walsh JJ, Collins TF. Blood levels of caffeine and results of fetal examination after oral administration of caffeine to pregnant rats. J Appl Toxicol 1982;2:307–14.
23. Natarajan G, Botica ML, Thomas R, Aranda JV. Therapeutic drug monitor-ing for caffeine in preterm neonates: an unnecessary exercise? Pediatrics 2007;119:936–40.
24. Leon AE, Michienzi K, Ma CX, Hutchison AA. Serum caffeine concentra-tions in preterm neonates. Am J Perinatol 2007;24:39–47.
25. Crossley KJ, Allison BJ, Polglase G, et al. Effects of caffeine on renal and pulmonary function in preterm newborn lambs. Pediatr Res 2012;72:19–25.
26. Bauer J, Maier K, Linderkamp O, Hentschel R. Effect of caffeine on oxygen consumption and metabolic rate in very low birth weight infants with idio-pathic apnea. Pediatrics 2001;107:660–3.
27. Hoecker C, Nelle M, Beedgen B, Rengelshausen J, Linderkamp O. Effects of a divided high loading dose of caffeine on circulatory variables in preterm infants. Arch Dis Child Fetal Neonatal Ed 2006;91:F61–F4.
28. Walther FJ, Erickson R, Sims ME. Cardiovascular effects of caffeine ther-apy in preterm infants. Am J Dis Child 1990;144:1164–6.
29. Marret S, Delpech B, Girard N, et al. Caffeine decreases glial cell number and increases hyaluronan secretion in newborn rat brain cultures. Pediatr Res 1993;34:716–9.
30. Tolcos M, Bateman E, O’Dowd R, et al. Intrauterine growth restriction affects the maturation of myelin. Exp Neurol 2011;232:53–65.
31. Doyle LW, Cheong J, Hunt RW, et al. Caffeine and brain development in very preterm infants. Ann Neurol 2010;68:734–42.
32. Heese K, Fiebich BL, Bauer J, Otten U. Nerve growth factor (NGF) expres-sion in rat microglia is induced by adenosine A2a-receptors. Neurosci Lett 1997;231:83–6.
33. Kang CH, Jayasooriya RG, Dilshara MG, et al. Caffeine suppresses lipo-polysaccharide-stimulated BV2 microglial cells by suppressing Akt-medi-ated NF-κB activation and ERK phosphorylation. Food Chem Toxicol 2012;50:4270–6.
34. Kang SH, Lee YA, Won SJ, Rhee KH, Gwag BJ. Caffeine-induced neu-ronal death in neonatal rat brain and cortical cell cultures. Neuroreport 2002;13:1945–50.
35. Black AM, Pandya S, Clark D, Armstrong EA, Yager JY. Effects of caf-feine and morphine on the developing pre-mature brain. Brain Res 2008;1219:136–42.
36. Aranda JV, Cook CE, Gorman W, et al. Pharmacokinetic profile of caffeine in the premature newborn infant with apnea. J Pediatr 1979;94:663–8.
37. Fredholm BB. Astra Award Lecture. Adenosine, adenosine receptors and the actions of caffeine. Pharmacol Toxicol 1995;76:93–101.
38. Stadelmann C, Lassmann H. Detection of apoptosis in tissue sections. Cell Tissue Res 2000;301:19–31.
10 Pediatric ReseARCH Copyright © 2014 International Pediatric Research Foundation, Inc.
Related Documents

![Strategie Ovine [Compatibility Mode]](https://static.cupdf.com/doc/110x72/577cd4611a28ab9e78985bbf/strategie-ovine-compatibility-mode.jpg)