Jay Patel, Chief Executive Officer Mike Jefferies, Chief Financial Officer November 2018 IMImobile PLC Interim Results Overview Six Months Ended 30 September 2018

Welcome message from author
This document is posted to help you gain knowledge. Please leave a comment to let me know what you think about it! Share it to your friends and learn new things together.
Transcript

Jay Patel, Chief Executive Officer
Mike Jefferies, Chief Financial Officer
November 2018
IMImobile PLCInterim Results Overview Six Months Ended 30 September 2018
Interim Results Presentation FY19, 30 September 2018
H1 Group highlights - continued growth and strategic progress
2
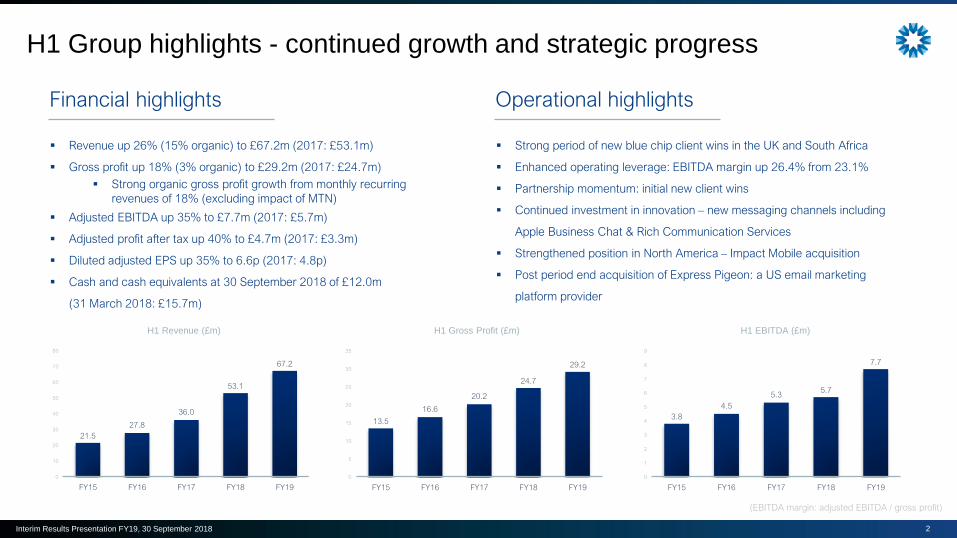
Financial highlights Operational highlights
▪ Strong period of new blue chip client wins in the UK and South Africa
▪ Enhanced operating leverage: EBITDA margin up 26.4% from 23.1%
▪ Partnership momentum: initial new client wins
▪ Continued investment in innovation – new messaging channels including
Apple Business Chat & Rich Communication Services
▪ Strengthened position in North America – Impact Mobile acquisition
▪ Post period end acquisition of Express Pigeon: a US email marketing
platform provider
▪ Revenue up 26% (15% organic) to £67.2m (2017: £53.1m)
▪ Gross profit up 18% (3% organic) to £29.2m (2017: £24.7m)
▪ Strong organic gross profit growth from monthly recurring
revenues of 18% (excluding impact of MTN)
▪ Adjusted EBITDA up 35% to £7.7m (2017: £5.7m)
▪ Adjusted profit after tax up 40% to £4.7m (2017: £3.3m)
▪ Diluted adjusted EPS up 35% to 6.6p (2017: 4.8p)
▪ Cash and cash equivalents at 30 September 2018 of £12.0m
(31 March 2018: £15.7m)
21.5
27.8
36.0
53.1
67.2
0
10
20
30
40
50
60
70
80
FY15 FY16 FY17 FY18 FY19
13.5
16.6
20.2
24.7
29.2
0
5
10
15
20
25
30
35
FY15 FY16 FY17 FY18 FY19
3.8
4.5
5.35.7
7.7
0
1
2
3
4
5
6
7
8
9
FY15 FY16 FY17 FY18 FY19
H1 Revenue (£m) H1 Gross Profit (£m) H1 EBITDA (£m)
(EBITDA margin: adjusted EBITDA / gross profit)

Interim Results Presentation FY19, 30 September 2018
A global cloud communications software and solutions provider
3
▪ #1 in UK, South African and Canadian markets
▪ 1,100+ employees globally, HQ in London, offices in Dubai, Hyderabad, Johannesburg and Toronto
▪ Listed on London Stock Exchange’s AIM Market
▪ Track record of profitable and cash generative growth for more than 16 years
A world in which consumers are
delivered great customer experiences
through continuous, seamless
engagement, powered by best in
class software and automation.
Our vision
Our customers
Who we are
CLLOGO
CLLOGO
CLLOGO
CLLOGO
CLLOGO
CLLOGO
CLLOGO
CLLOGO
CLLOGO
CLLOGO
At scale

Interim Results Presentation FY19, 30 September 2018
Market opportunity and positioning

Interim Results Presentation FY19, 30 September 2018
There is a global B2C communications opportunity driven by technology
5
BETTER
NETWORKS
BETTER
DEVICES BETTER
SOFTWARE+ + = DISRUPTION
Person to person communications have already changed
Businesses face challenges in creating seamless customer experience
1.3 billion users on FB Messenger
1.5 billion users on Whatsapp
1.3 billion active Apple devices
Legacy systems
Complex integrations
Regulations
Existing contracts
Businesses will communicate with consumers as easily as people communicate with each other
Interim Results Presentation FY19, 30 September 2018
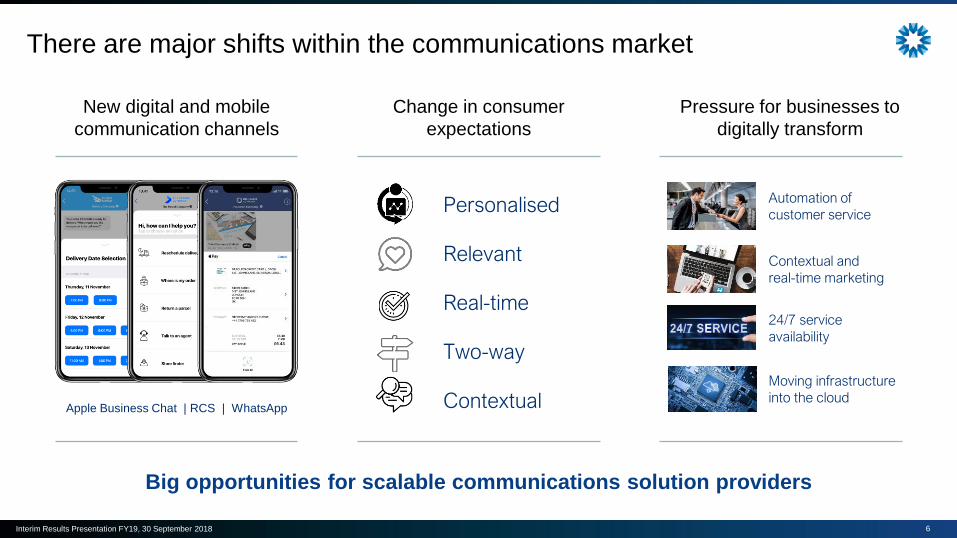
Personalised
Relevant
Real-time
Two-way
Contextual
There are major shifts within the communications market
6
Automation of
customer service
New digital and mobile
communication channels
Change in consumer
expectations
Pressure for businesses to
digitally transform
Apple Business Chat | RCS | WhatsApp
Contextual and
real-time marketing
24/7 service
availability
Moving infrastructure
into the cloud
Big opportunities for scalable communications solution providers

Interim Results Presentation FY19, 30 September 2018
The CPaaS market opportunity
7
End-user spending on CPaaS expected
to grow at a CAGR rate of nearly 50%
between 2016 and 2021.
50% CAGR
The CPaaS market is forecast to grow
from $2bn in 2017 to $10.9bn in 2022.
$10.9bn by 2022
CPaaS (Communications Platform as a Service) is a cloud-based middleware on which you can develop, run
and distribute communications software.
A CPaaS platform offers APIs that simplify the integration of communications capabilities into any app, service or
business process. It is a flexible solution that gives greater scalability while reducing time to implementation,
meaning a faster route to enhanced customer experience.
By 2020, 30% of enterprises will deploy
CPaaS use cases from 5% in 2017.
30% by 2020
Interim Results Presentation FY19, 30 September 2018
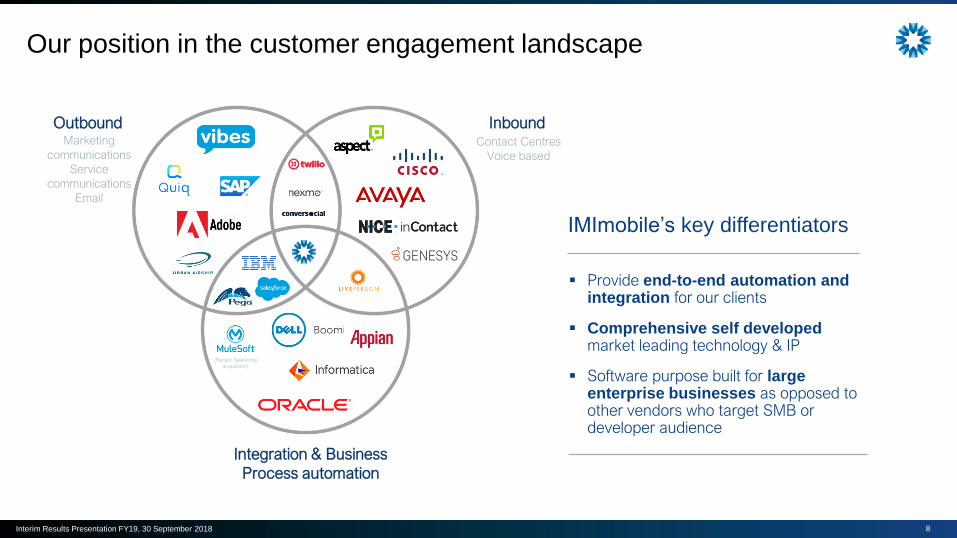
Our position in the customer engagement landscape
8
IMImobile’s key differentiators
▪ Provide end-to-end automation and integration for our clients
▪ Comprehensive self developed market leading technology & IP
▪ Software purpose built for large enterprise businesses as opposed to other vendors who target SMB or developer audience
Integration & Business
Process automation
InboundOutboundMarketing
communications
Service
communications
Contact Centres
Voice based
(Recent Salesforce
acquisition)

9
Customer Updates

Interim Results Presentation FY19, 30 September 2018
Improving the parcel delivery experience
10
Deployed in less than 3 months
▪ Hermes deployed IMIconnect as part of their
‘Digital Futures’ programme
▪ IMIconnect will enhance millions of delivery
notifications each month of behalf of
Hermes’s retail clients
▪ Customer journeys currently built include:
1. Geo fencing – provides a location for each parcel
with delivery updates sent over a choice of
channels
2. ‘SafePlace’ photo – photographic evidence that
parcels have been deposited, providing
increased confidence of successful delivery
IMImobile has been instrumental in helping to
deliver our ‘Digital Futures’ programme that
prioritises customer experience through
investment in innovation and technology.
Chris Ashworth, Chief Information Officer at Hermes
“”

Interim Results Presentation FY19, 30 September 2018 11
Delivery
NotificationsHermes

Interim Results Presentation FY19, 30 September 2018
Powering marketing communications automation
12
▪ Capitec is South Africa’s fastest growing bank
▪ IMImobile delivers a centralised client
communications hub to create a more
personalised digital banking experience for
Capitec’s 10 million customers
▪ IMIconnect speeds up the delivery of new
innovative banking services such as:
› Account & transaction notifications
› Credit status checks
› Customer feedback surveys We are pleased to work with IMImobile,
a partner with proven experience and
track record in the financial services
sector.
“”Francois Viviers, Executive: Marketing & Communications

Interim Results Presentation FY19, 30 September 2018
UK’s first Apple Business Chat service
13
▪ npower became the first client for IMImobile
using Apple Business Chat
▪ A new way for consumers to connect directly
with businesses using the Messages app on
Apple devices
▪ Using the new messaging capability to improve
customer experience for customers looking to
switch to a smart meter
› Send rich media messages to customers
illustrating smart meter benefits and installation
process
› Customer service agents can trigger a post-chat
survey for feedback using emojis

Interim Results Presentation FY19, 30 September 2018 14
Apple Business Chat
IMImobile is one of 18 approved providers
globally to offer Apple Business Chat
First to offer new channels to our customers
Google RCS
IMImobile is one of 23 companies globally
that joined Google’s Early Access Program
Interim Results Presentation FY19, 30 September 2018
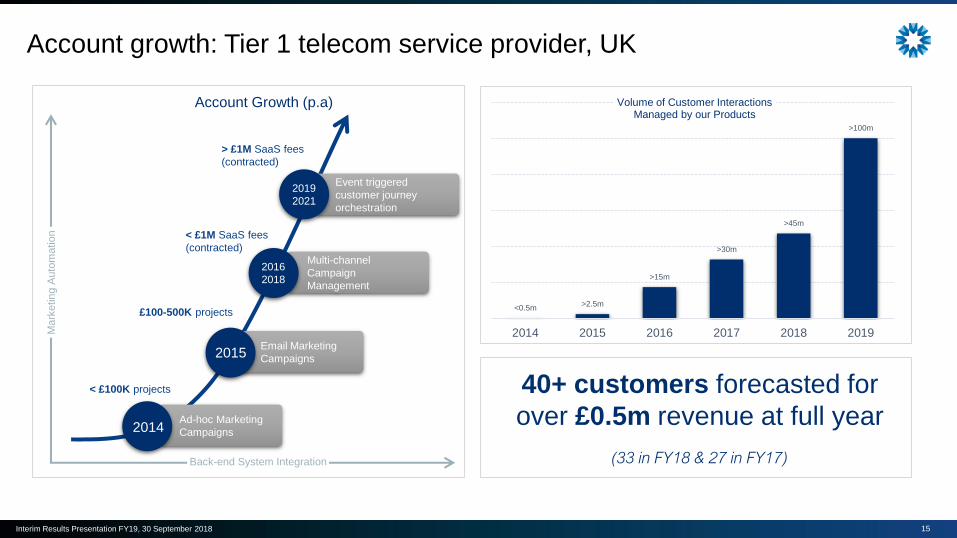
Account growth: Tier 1 telecom service provider, UK
15
< £1M SaaS fees
(contracted)
> £1M SaaS fees
(contracted)
Mark
etin
g A
uto
matio
n
Back-end System Integration
Ad-hoc Marketing
Campaigns
Email Marketing
Campaigns
Multi-channel
Campaign
Management
Event triggered
customer journey
orchestration
2019
2021
2016
2018
2015
2014
Account Growth (p.a)
< £100K projects
£100-500K projects<0.5m
>2.5m
>15m
>30m
>45m
>100m
2014 2015 2016 2017 2018 2019
Volume of Customer Interactions Managed by our Products
40+ customers forecasted for
over £0.5m revenue at full year
(33 in FY18 & 27 in FY17)

Interim Results Presentation FY19, 30 September 2018Unaudited Preliminary Results Year End March 2018
16
Financial Results

Interim Results Presentation FY19, 30 September 2018
Commercial Model
17
Volume of e-mail, SMS, MMS,
push notification, sessions etc.Licences & one-off professional
services
Contracted revenues
25% 40% 20% 15%Fixed fees Usage based Transactional Non
recurring
Monthly Recurring Revenue(MRR)
Gross Profit Split*
Fees based on revenue transactions
~85%
*Indicative gross profit split

Interim Results Presentation FY19, 30 September 2018
Adjusted trading performance
18
Year endedSep-18
£m
Sep-17
£m
Growth
%
Revenue 67.2 53.1 +26%
Gross profit 29.2 24.7 +18%
Administrative expenses
(excluding D&A)(21.5) (19.0) +13%
Adjusted EBITDA 7.7 5.7 +35%
EBITDA margin 26.4% 23.1%
Adjusted profit after tax 4.7 3.3 +40%
Diluted adjusted EPS 6.6p 4.8p +35%
Gross profit split

Interim Results Presentation FY19, 30 September 2018
0
5
10
15
20
25
FY15 FY16 FY17 FY18 FY19
H1 Gross Profit in £m
MRR License & professional services
Regional overview – Europe & Americas
19
Operational highlightsFinancial highlights
▪ Revenue £51.0m (2017: £35.2m)
▪ Gross profit £20.3m (2017: £13.8m)
▪ Gross margin 39.8% (2017: 39.1%)
The AA The AA The AA The AAThe AA The AA The AA
6.6
9.9 10.6
13.8
20.3
▪ Contributed 70% of Group gross profit, representing year on year gross
profit growth of 48%, of which 21% is organic
▪ Significant new blue chip client wins across multiple sectors including
Hermes and npower
▪ Continued to generate substantial upsell revenue from established clients
e.g. renewed substantial contract with tier one UK mobile operator
▪ Partner programme has gained momentum in the region
▪ Acquisition update:
▪ Healthcare Communications – meeting significant growth
expectations
▪ Impact Mobile acquisition expanded North American operations
▪ Post period end acquisition of Express Pigeon

Interim Results Presentation FY19, 30 September 2018
0
1
2
3
4
5
6
7
8
FY15 FY16 FY17 FY18 FY19
MRR License & professional services
0
1
2
3
4
5
6
FY15 FY16 FY17 FY18 FY19
MRR License & professional services
Regional overview – MEA and India & SEA
20
Middle East & Africa India & South East AsiaGross Profit £4.6m (2017: £5.6m) Gross Profit £4.3m (2017: £5.3m)
▪ Continued to experience headwinds due to trading
conditions in Nigeria and new group policies with our
largest client in the region
▪ Expanded our footprint in the region, deploying new
projects in Jordan and Palestine.
▪ 20% gross profit growth in enterprise revenues
▪ Significant new client wins in the banking sector
▪ Experienced a decline due to recognition of
deployments for Telenor in the first half of last year
▪ Expanded telecom service offering into new territories
e.g. Sri Lanka and Myanmar
▪ Textlocal India has onboarded over 6,000 new
customers during the period
4.4 4.5
6.7
5.6
2.52.2
2.9
5.3
4.6
4.3

Interim Results Presentation FY19, 30 September 2018
Balance sheet
21
AssetsSep-18
£m
Mar-18
£m
Cash
Trade receivables
Pass through revenues
Other current assets
12.0
34.7
4.5
5.2
15.7
28.8
5.2
6.1
Current assets 56.4 55.8
Goodwill
Acquired intangibles
Other intangible assets
PPE
Other non-current assets
41.6
19.9
11.0
4.3
0.6
33.3
12.3
8.1
4.6
0.5
Non-current assets 77.4 58.8
Total assets 133.8 114.6
Net Assets 56.2 54.2
LiabilitiesSep-18
£m
Mar-18
£m
Trade payables and accruals
Pass through revenues
Other current liabilities
28.3
5.1
18.9
27.6
5.7
12.7
Current liabilities 52.3 46.0
Non-current liabilities 25.3 14.4
Total liabilities 77.6 60.4
High quality receivables
Strong balance sheet

Interim Results Presentation FY19, 30 September 2018
Adjusted cashflow
22
Period endedSep-18
£m
Sep-17
£m
Cash generated from operations 5.5 5.7
Net cash from operations 5.0 5.4
Investing activities (20.1) (2.9)
Financing activities 11.3 (0.1)
Cash and cash equivalents at
beginning of period15.7 14.7
Foreign exchange on opening
balances0.1 (1.7)
Cash and cash equivalents at end
of period12.0 15.4
Cash conversion of 80%
Period endedSep-18
£m
Mar-18
£m
Cash 12.0 15.7
Borrowings (21.3) (11.4)
Net (debt)/cash (9.3) 4.3
Net cash
Additional debt facility of £10m

Interim Results Presentation FY19, 30 September 2018
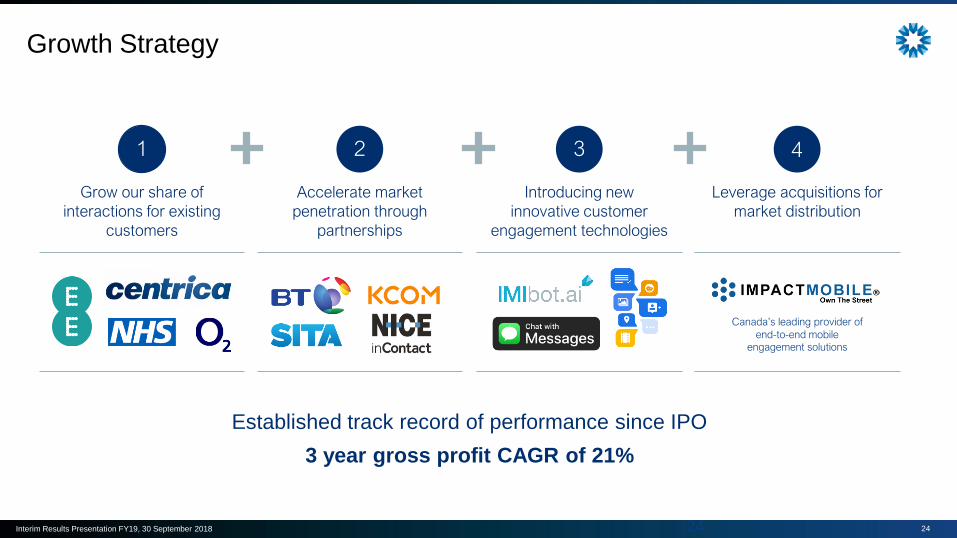
Growth Strategy
Interim Results Presentation FY19, 30 September 2018 2424
Growth Strategy
1 2 3 4
Accelerate market
penetration through
partnerships
Grow our share of
interactions for existing
customers
Introducing new
innovative customer
engagement technologies
Leverage acquisitions for
market distribution
+ +
Established track record of performance since IPO
3 year gross profit CAGR of 21%
Canada’s leading provider of
end-to-end mobile engagement solutions
Interim Results Presentation FY19, 30 September 2018
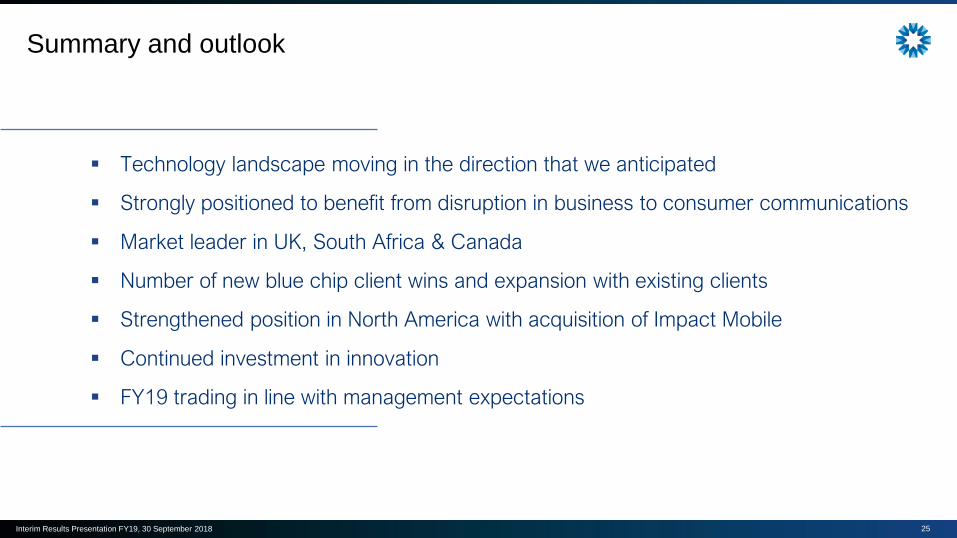
Summary and outlook
25
▪ Technology landscape moving in the direction that we anticipated
▪ Strongly positioned to benefit from disruption in business to consumer communications
▪ Market leader in UK, South Africa & Canada
▪ Number of new blue chip client wins and expansion with existing clients
▪ Strengthened position in North America with acquisition of Impact Mobile
▪ Continued investment in innovation
▪ FY19 trading in line with management expectations

Interim Results Presentation FY19, 30 September 2018
London
IMImobile Europe Ltd.
5 St John’s Lane
London
EC1M 4BH
United Kingdom
Hyderabad
IMI Mobile Pvt. Ltd
Plot No. 770
Road No. 44
Jubilee Hills
Hyderabad – 500 033
Dubai
IMImobile VAS Ltd. FZE
P.O. Box 293593
Office # 624, Building 5EA
Dubai Airport Free Zone,
Dubai, U.A.E
Little Rock
IMImobile North America
201 E. Markham,
Suite 150
Little Rock,
AR 72201
USA
Johannesburg
IMImobile South Africa
Clearwater Office Park,
Building no. 3, First Floor.
Corner Christiaan De Wet and
Millennium Boulevard,
Strubensvalley,
Roodepoort, Gauteng,
South Africa
Theale
IMImobile Intelligent
Networks
Abbey House
1650 Arlington Business
Park, Theale
RG7 4SA
United Kingdom
High Wycombe
Swan House
White Hart Street
High Wycombe
HP11 2HL
United Kingdom
Toronto
IMImobile Canada
4 King Street West
Suite 1700
Toronto, Ontario
M5H 1B6
Canada
Thank you
Related Documents


