Imaging Acute Stroke and Cerebral Ischemia John R. Hesselink, M.D. Department of Radiology University of California San Diego

Welcome message from author
This document is posted to help you gain knowledge. Please leave a comment to let me know what you think about it! Share it to your friends and learn new things together.
Transcript
Imaging Acute Stroke
and Cerebral Ischemia
John R. Hesselink, M.D.
Department of Radiology
University of California
San Diego
Causes of Stroke
Arterial stenosis
Thrombosis
Embolism
Dissection
Hypotension
Anoxia / hypoxia
Hypoglycemia
Imaging Acute Stroke
Abnormal vascular density / signal
Vascular enhancement
Loss of gray / white contrast
Cortical swelling
Sulcal effacement
Ventricular compression
MRA \ CTA
Conventional Imaging
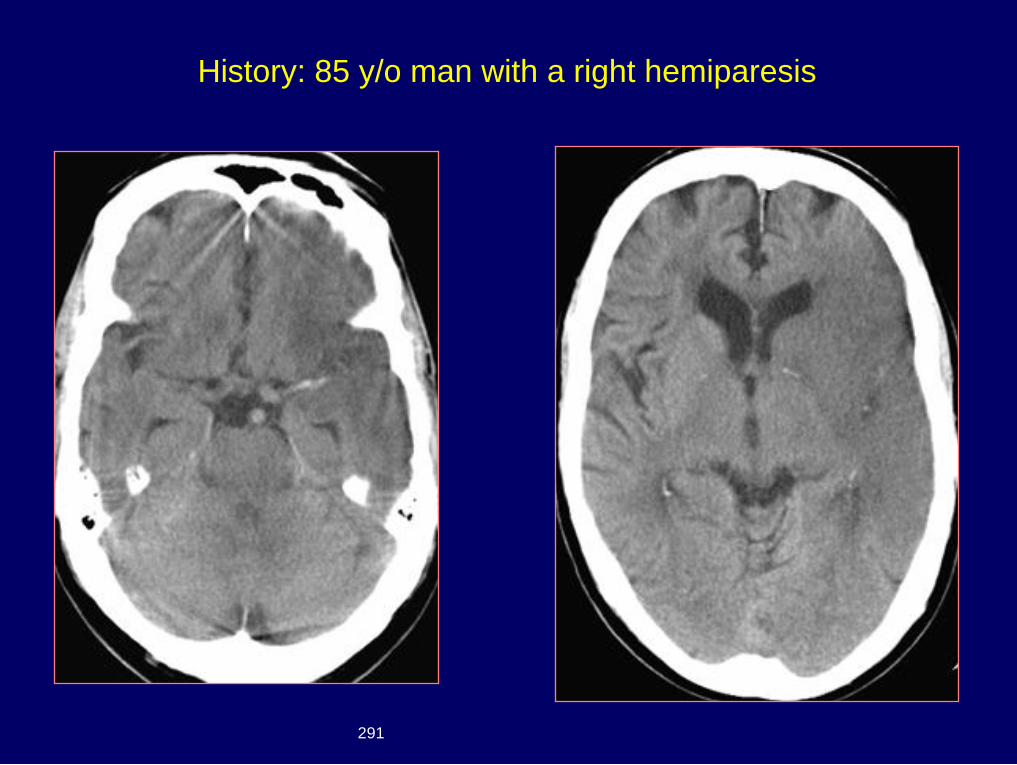
History: 85 y/o man with a right hemiparesis
291
Dx: MCA embolus with
cerebral infarction
{Page 2}
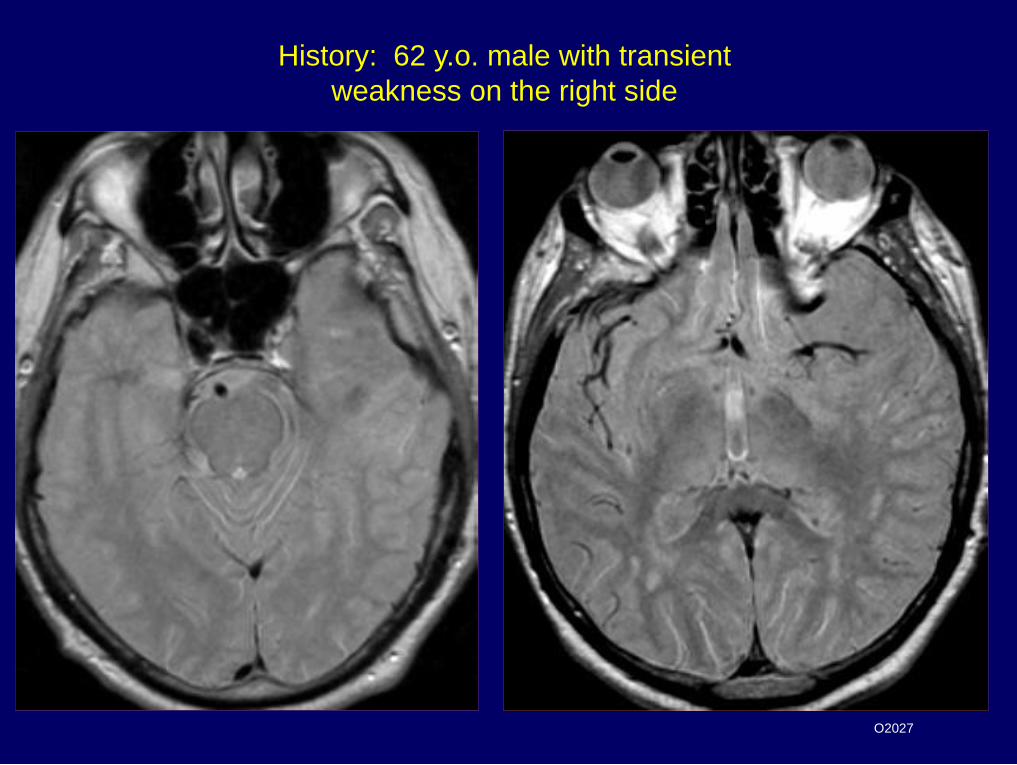
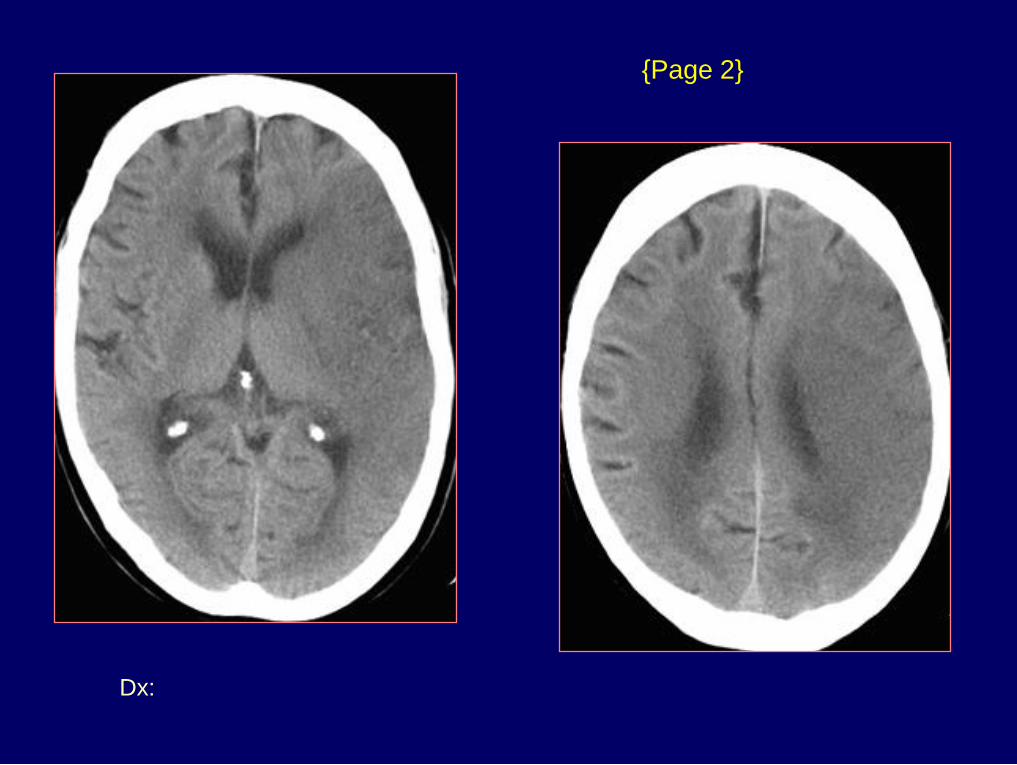
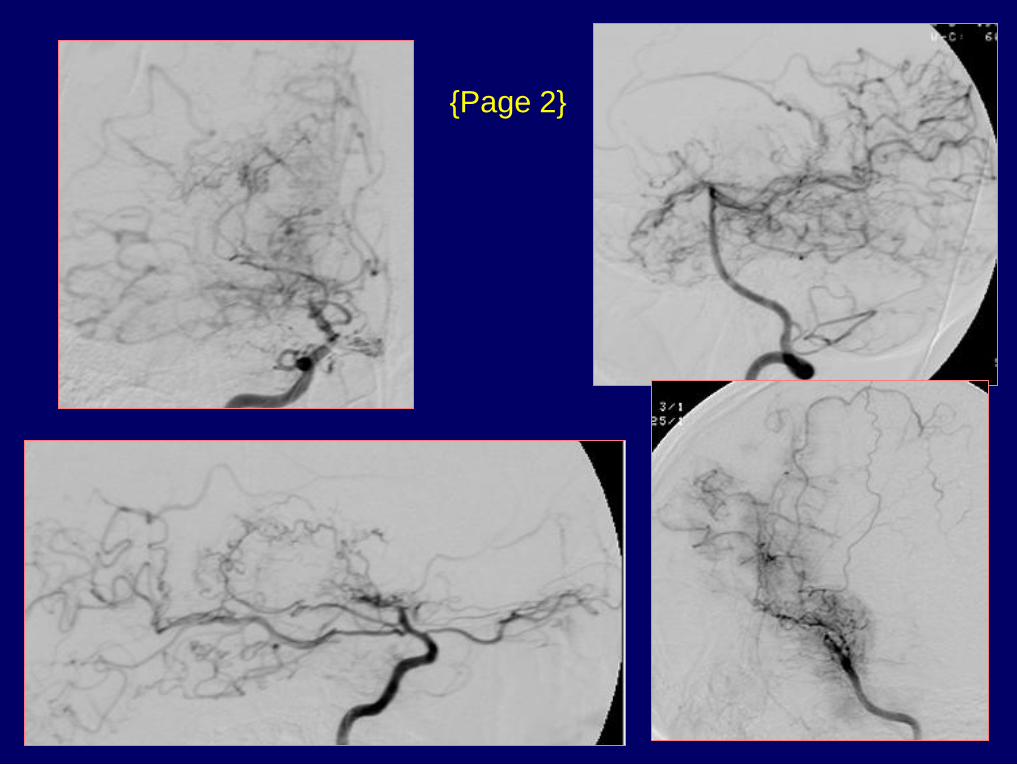
History: 62 y.o. male with transient
weakness on the right side
O2027
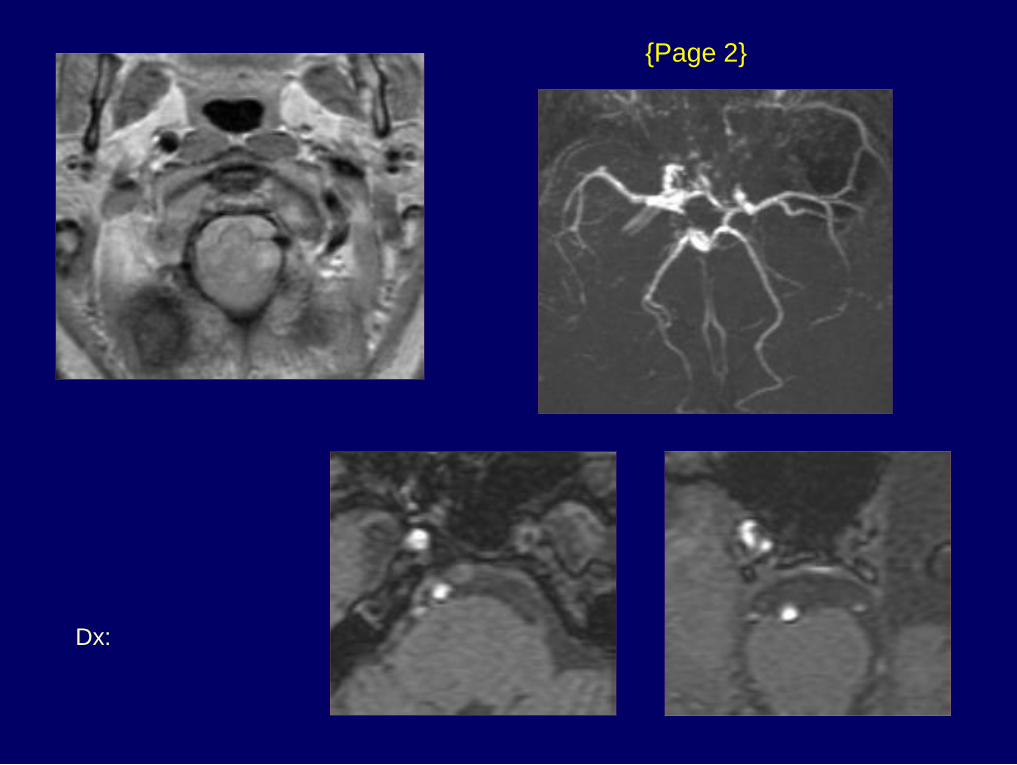
Dx: Left carotid occlusion
{Page 2}
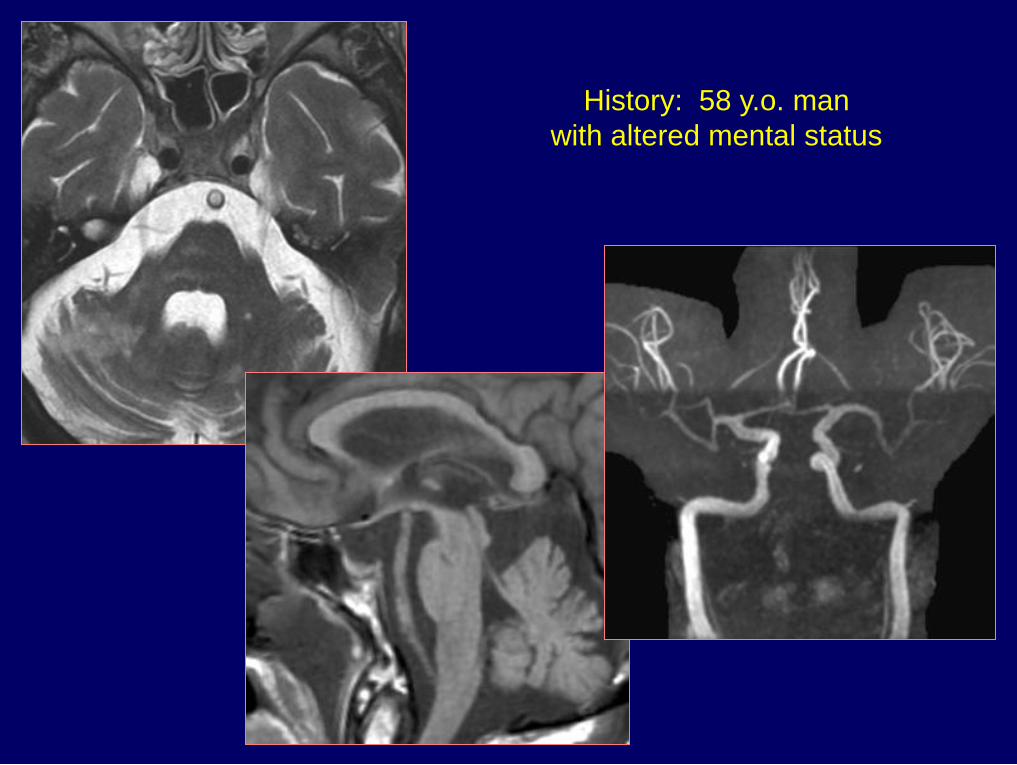
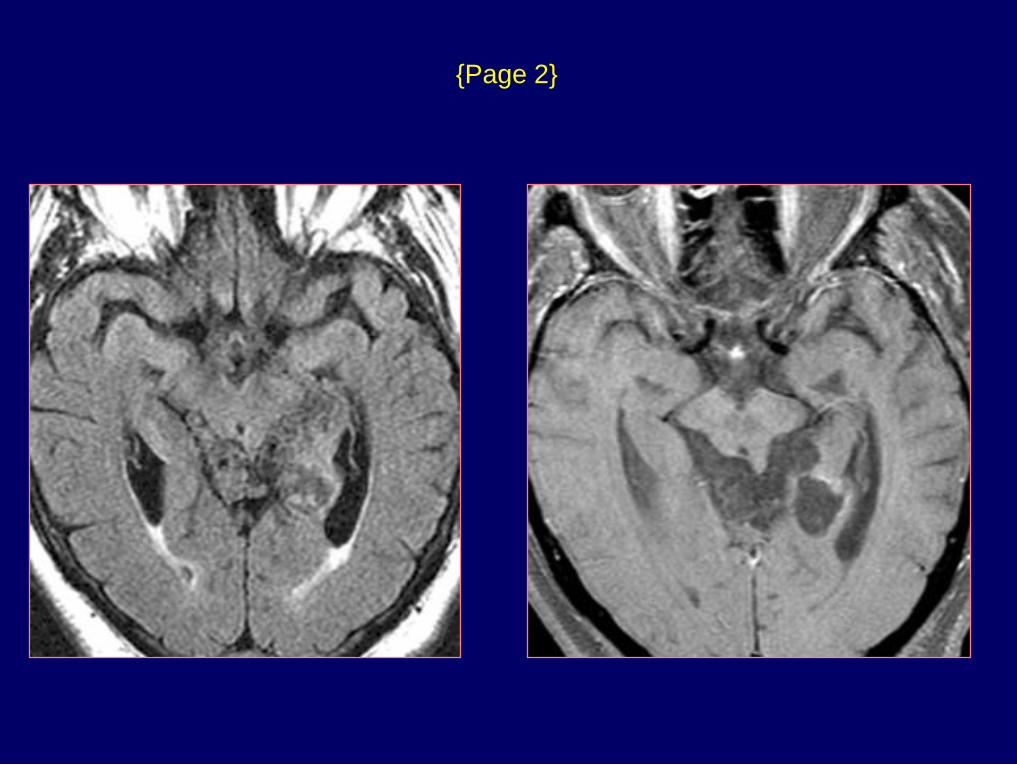
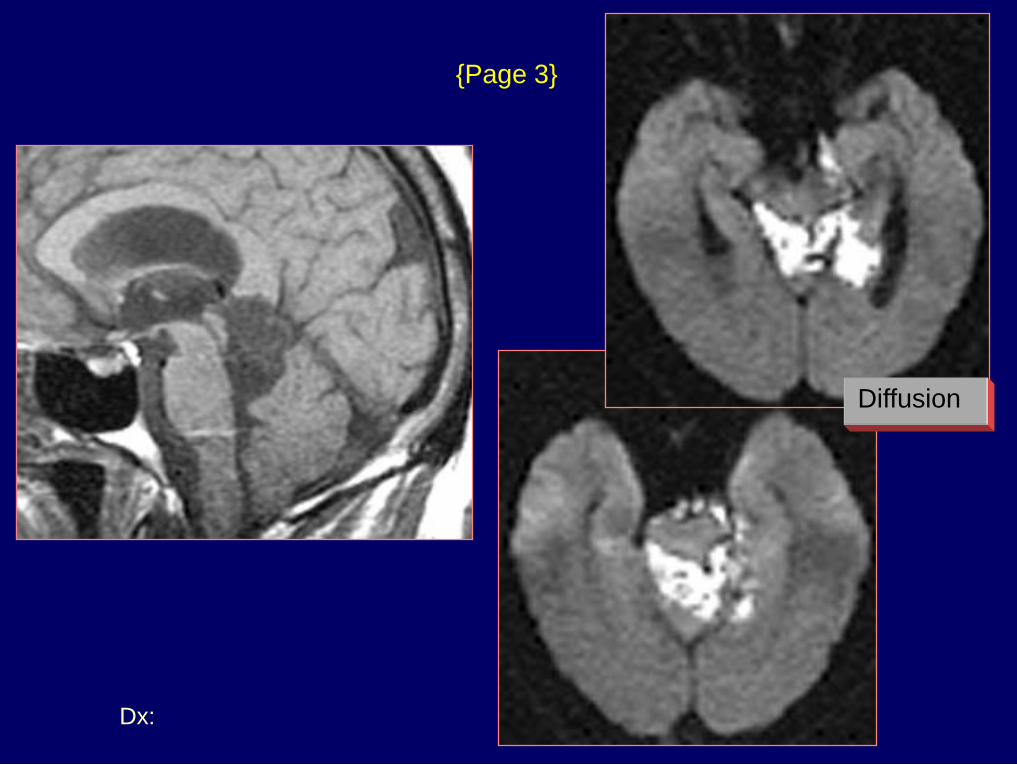
History: 58 y.o. man
with altered mental status
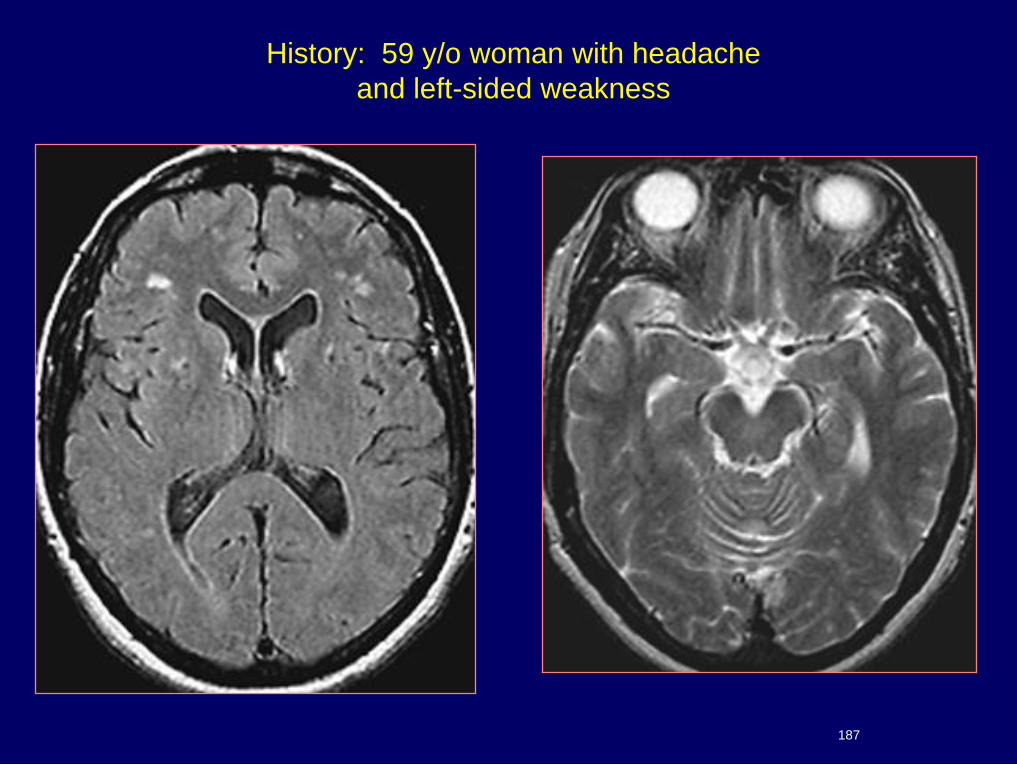
History: 59 y/o woman with headache
and left-sided weakness
187
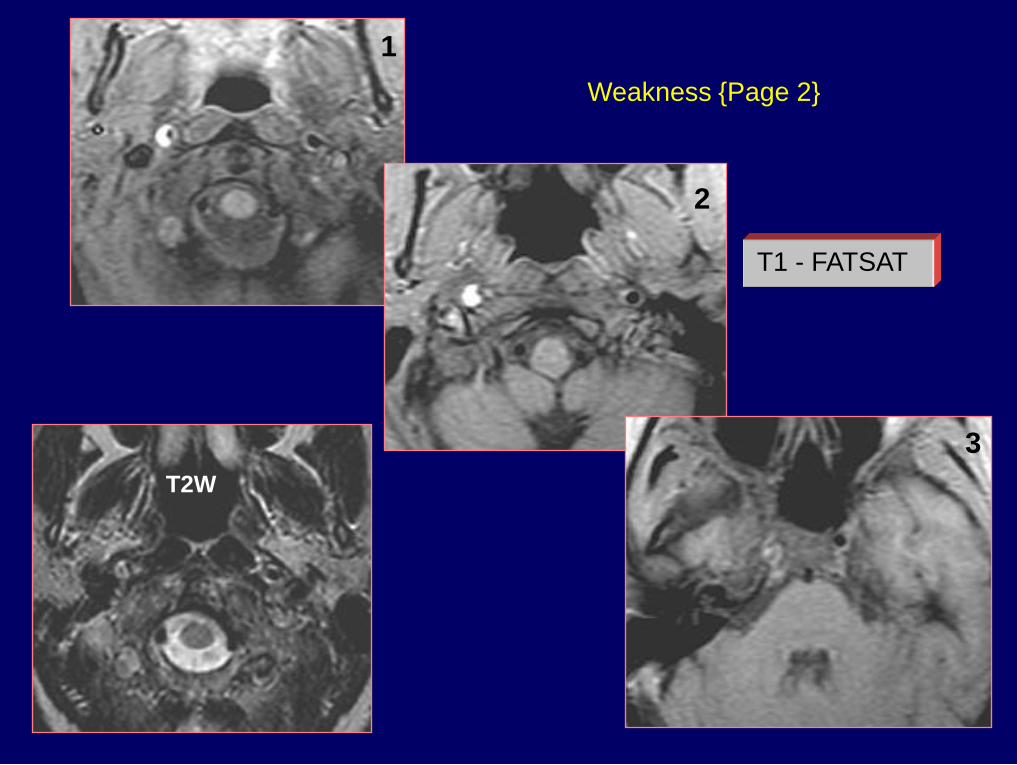
Weakness {Page 2}
T1 - FATSAT
1
2
3
T2W
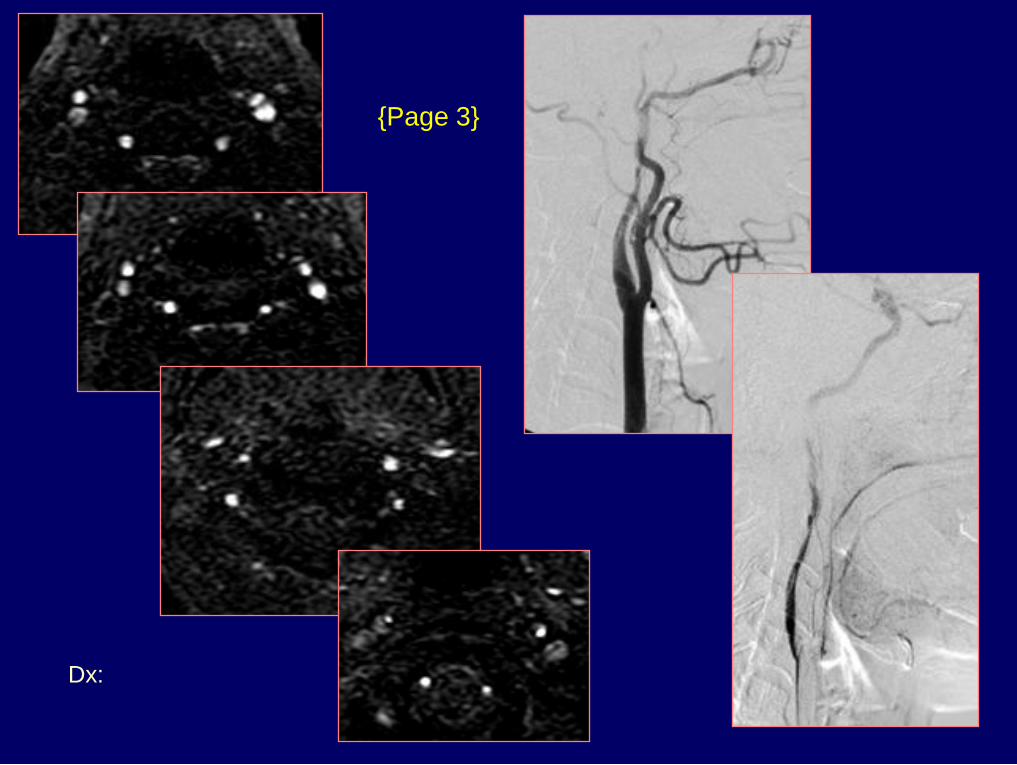
Dx: Right ICA dissection
{Page 3}
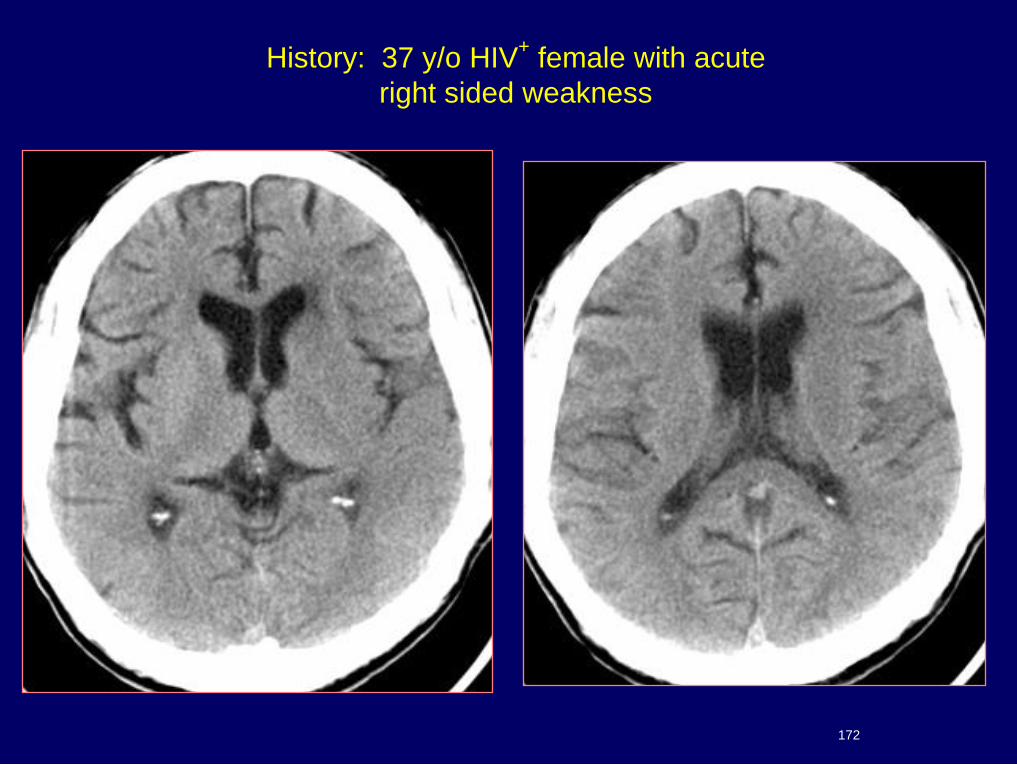
History: 37 y/o HIV+ female with acute
right sided weakness
172
Dx: Acute MCA infarct
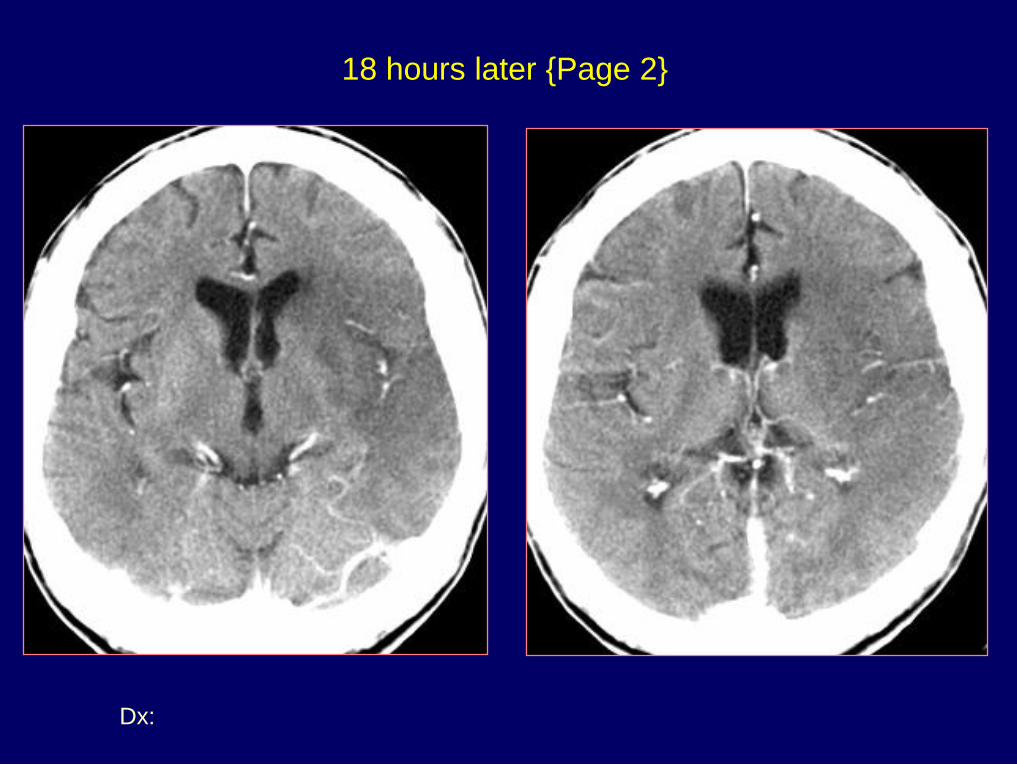
18 hours later {Page 2}
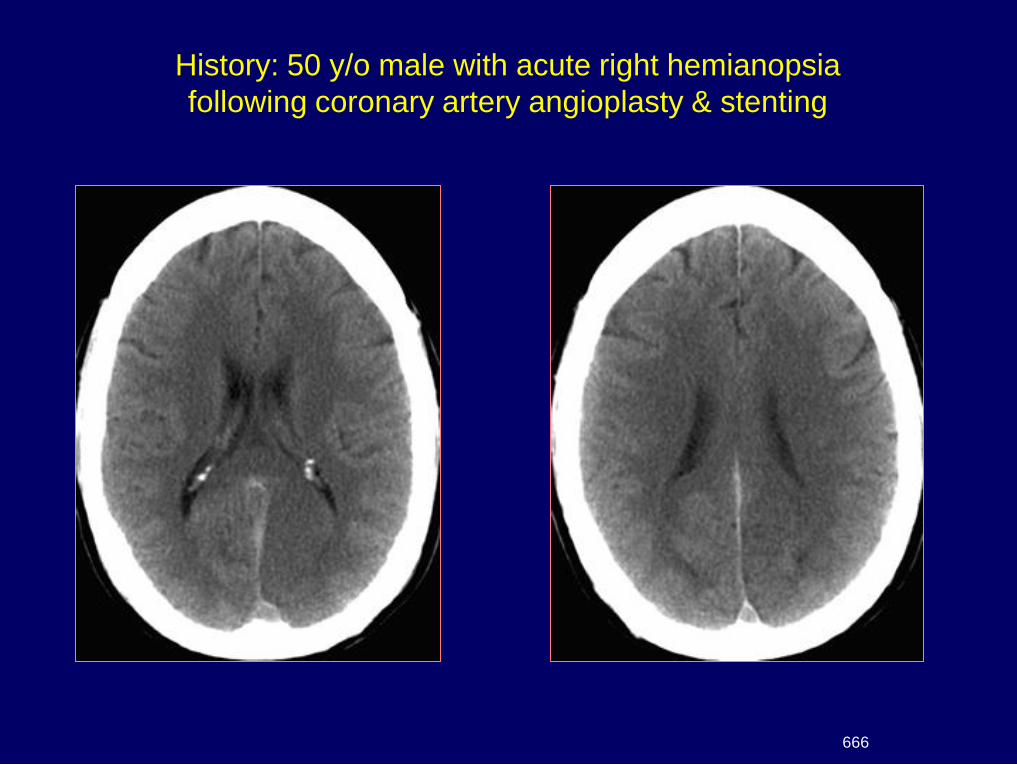
History: 50 y/o male with acute right hemianopsia
following coronary artery angioplasty & stenting
666
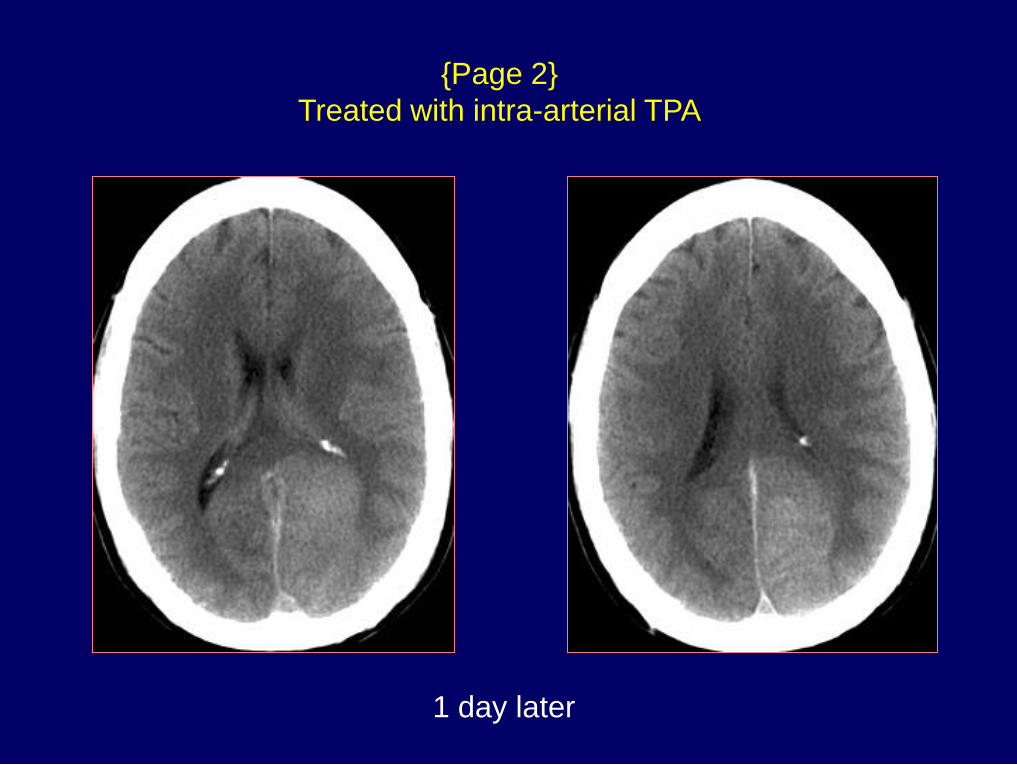
{Page 2}
Treated with intra-arterial TPA
1 day later
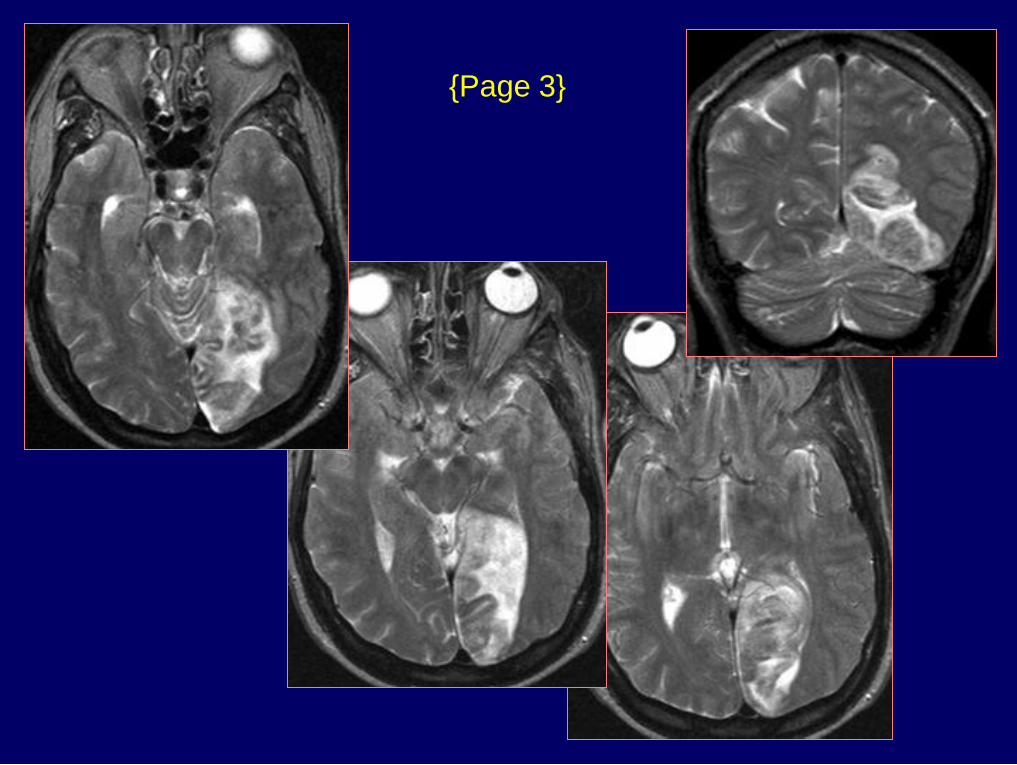
{Page 3}
Dx: Hemorrhagic occipital infarct
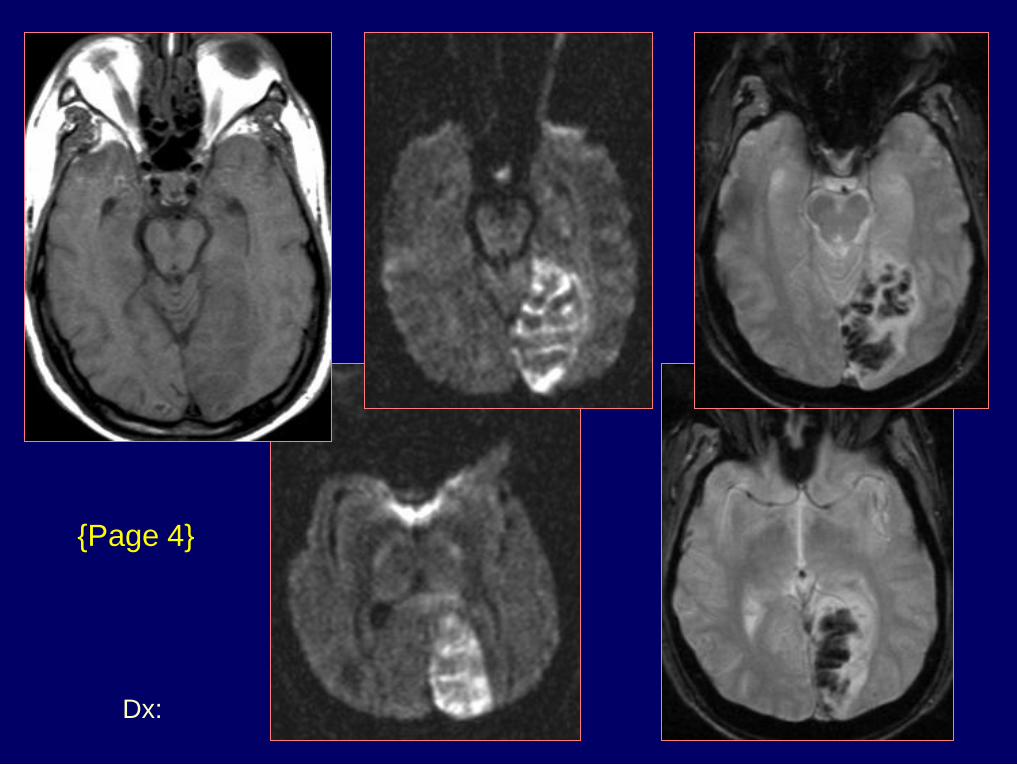
{Page 4}
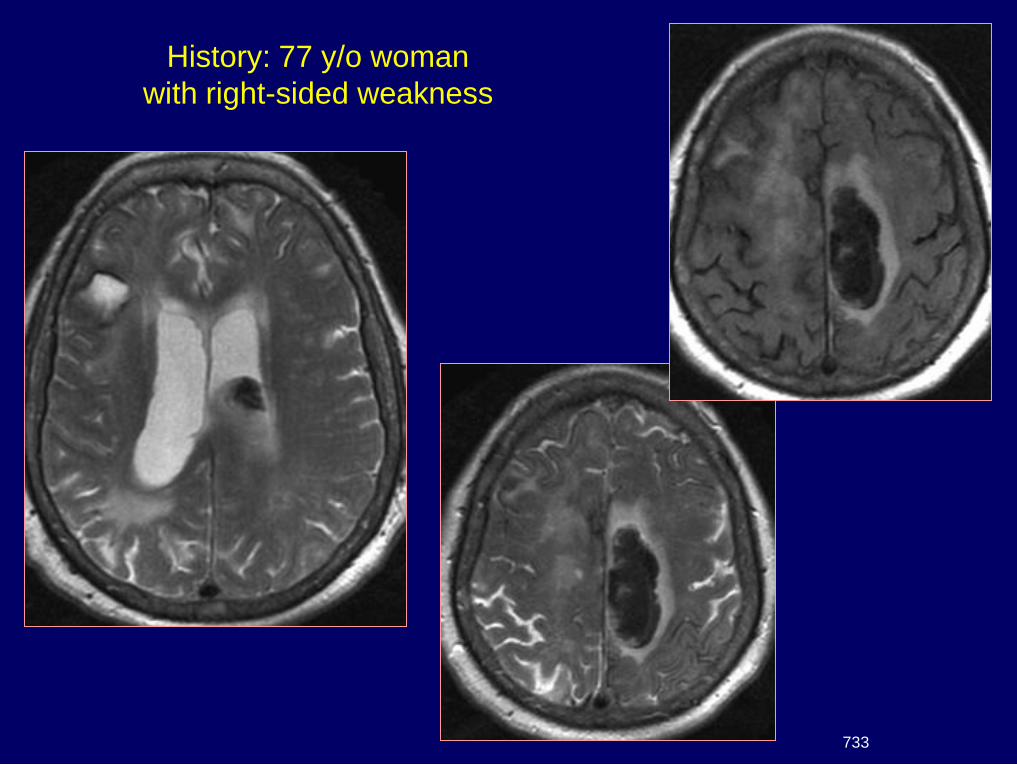
History: 77 y/o woman
with right-sided weakness
733
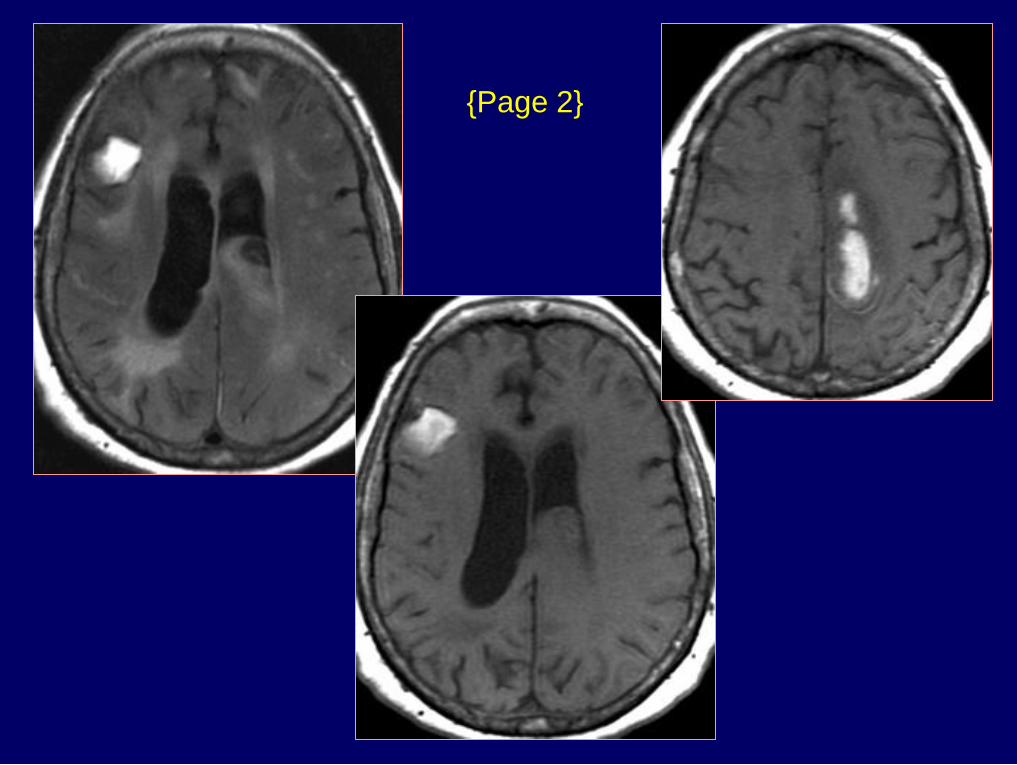
{Page 2}
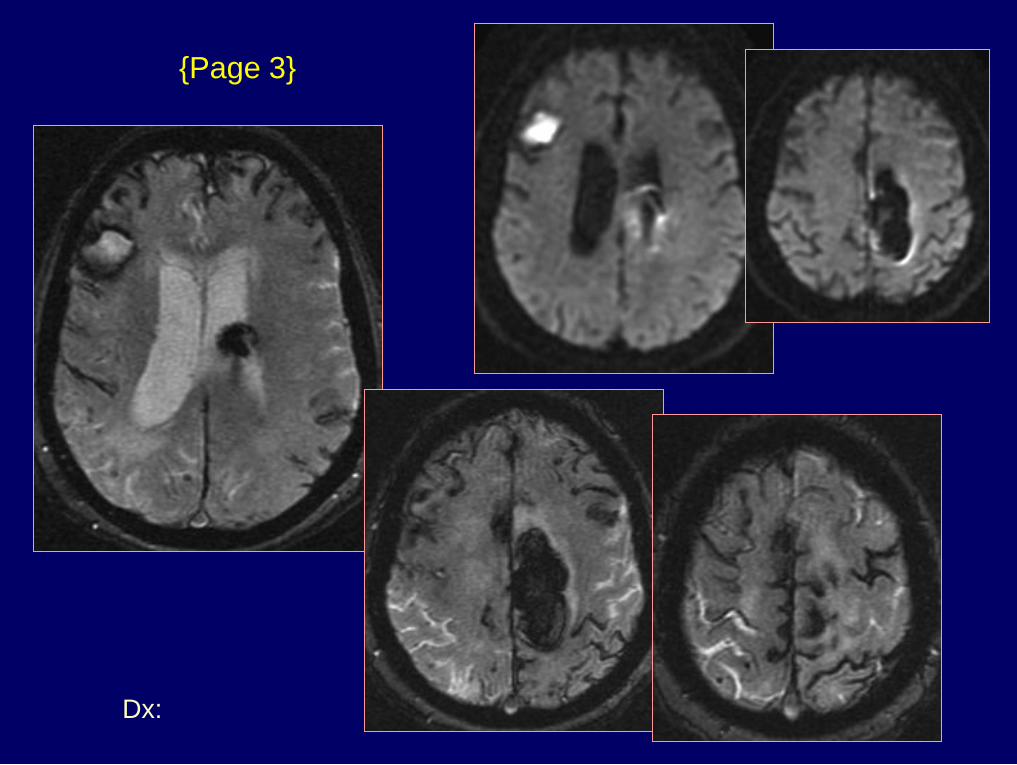
Dx: Amyloid angiopathy
{Page 3}
Diffusion and
Perfusion Imaging
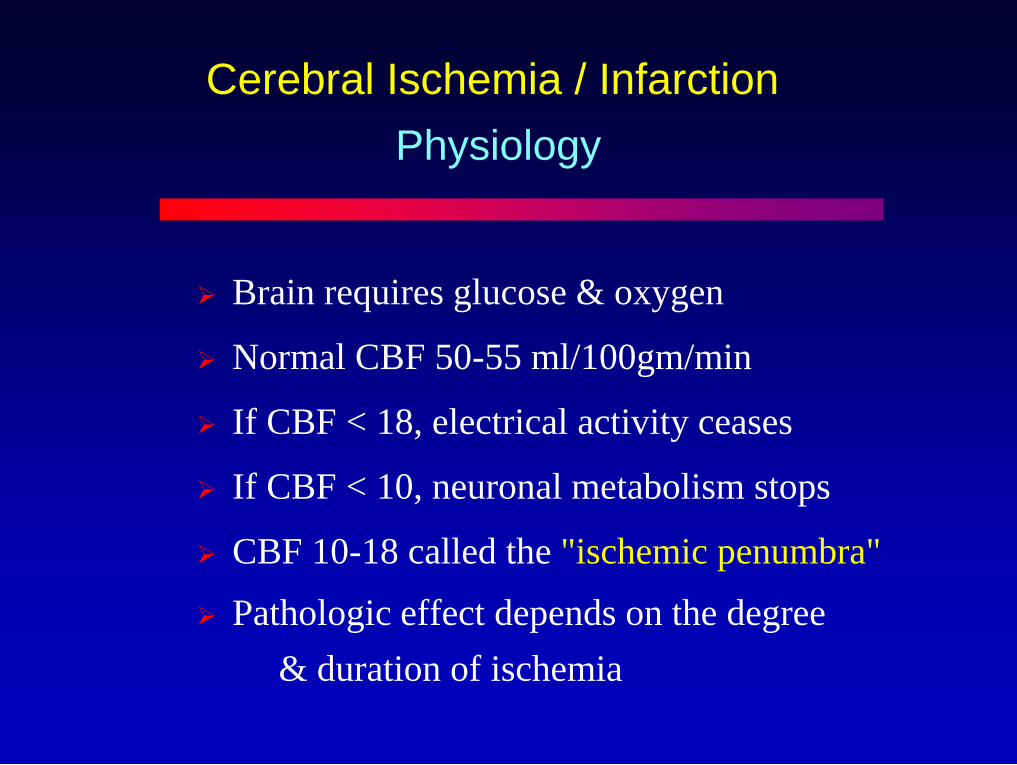
Cerebral Ischemia / Infarction
Brain requires glucose & oxygen
Normal CBF 50-55 ml/100gm/min
If CBF < 18, electrical activity ceases
If CBF < 10, neuronal metabolism stops
CBF 10-18 called the "ischemic penumbra"
Pathologic effect depends on the degree
& duration of ischemia
Physiology
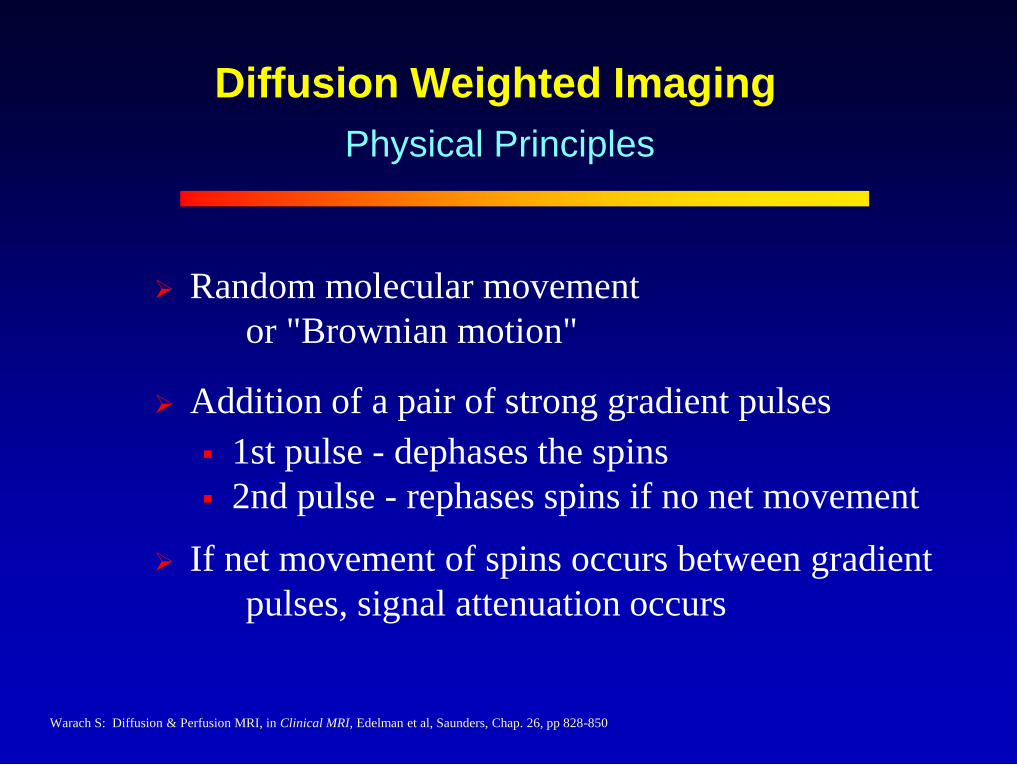
Diffusion Weighted Imaging
Random molecular movement
or "Brownian motion"
Addition of a pair of strong gradient pulses
1st pulse - dephases the spins
2nd pulse - rephases spins if no net movement
If net movement of spins occurs between gradient
pulses, signal attenuation occurs
Physical Principles
Warach S: Diffusion & Perfusion MRI, in Clinical MRI, Edelman et al, Saunders, Chap. 26, pp 828-850
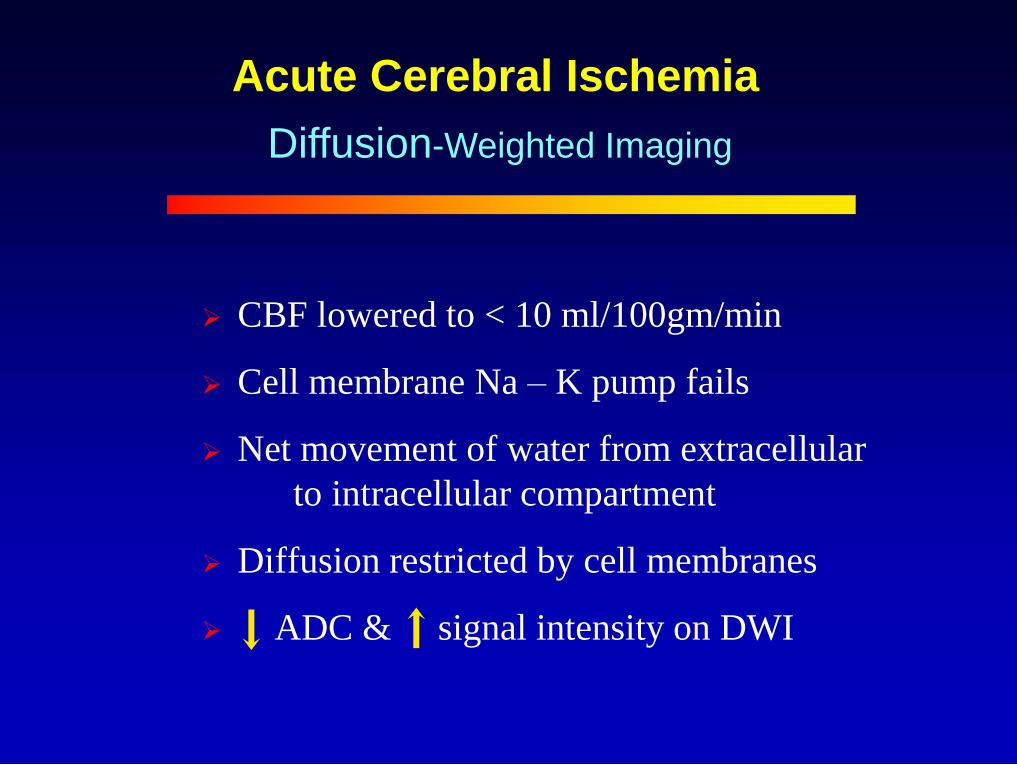
Acute Cerebral Ischemia
Diffusion-Weighted Imaging
CBF lowered to < 10 ml/100gm/min
Cell membrane Na – K pump fails
Net movement of water from extracellular
to intracellular compartment
Diffusion restricted by cell membranes
ADC & signal intensity on DWI
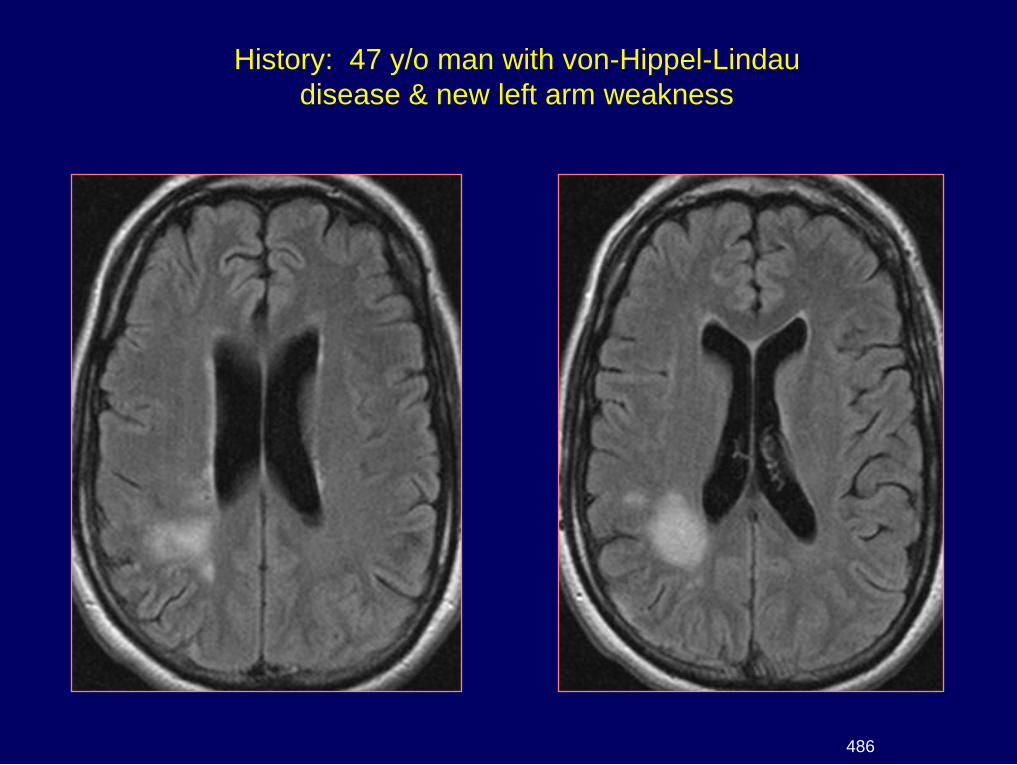
History: 47 y/o man with von-Hippel-Lindau
disease & new left arm weakness
486
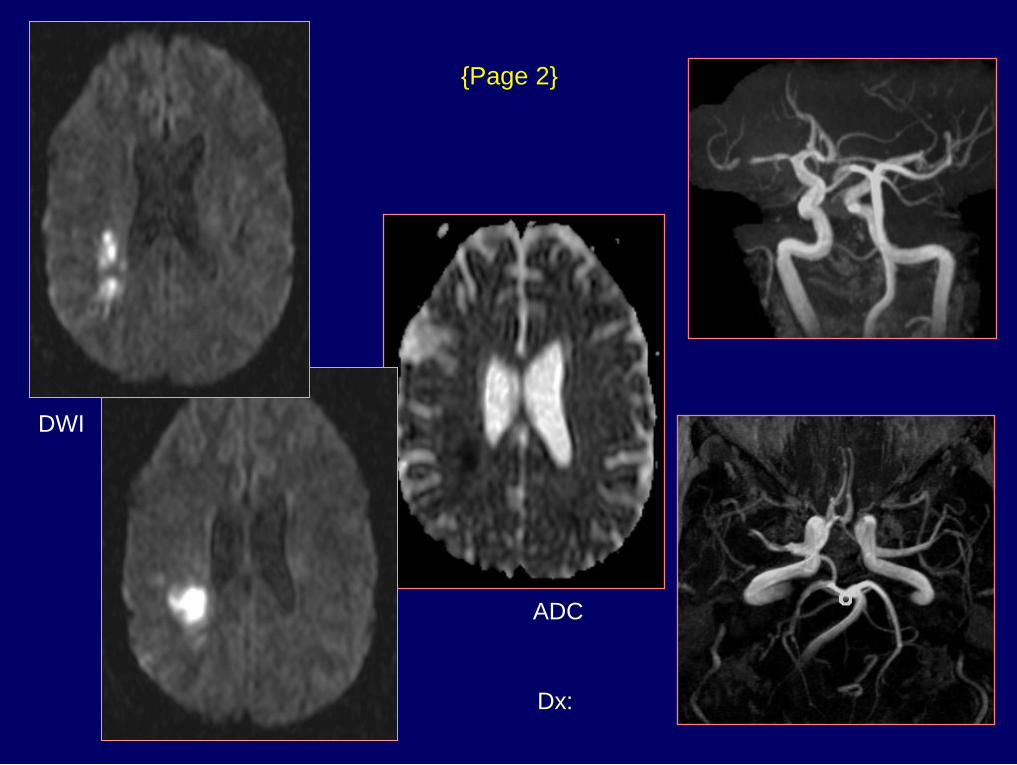
Dx: Infarct & MCA stenosis
{Page 2}
ADC
DWI
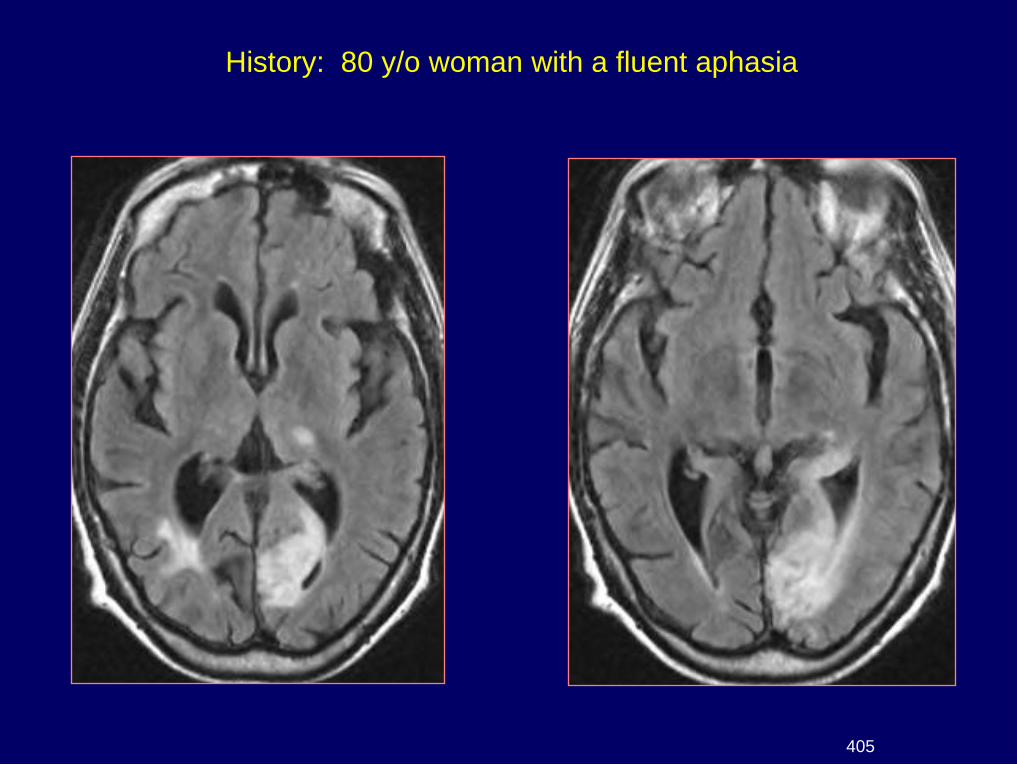
History: 80 y/o woman with a fluent aphasia
405
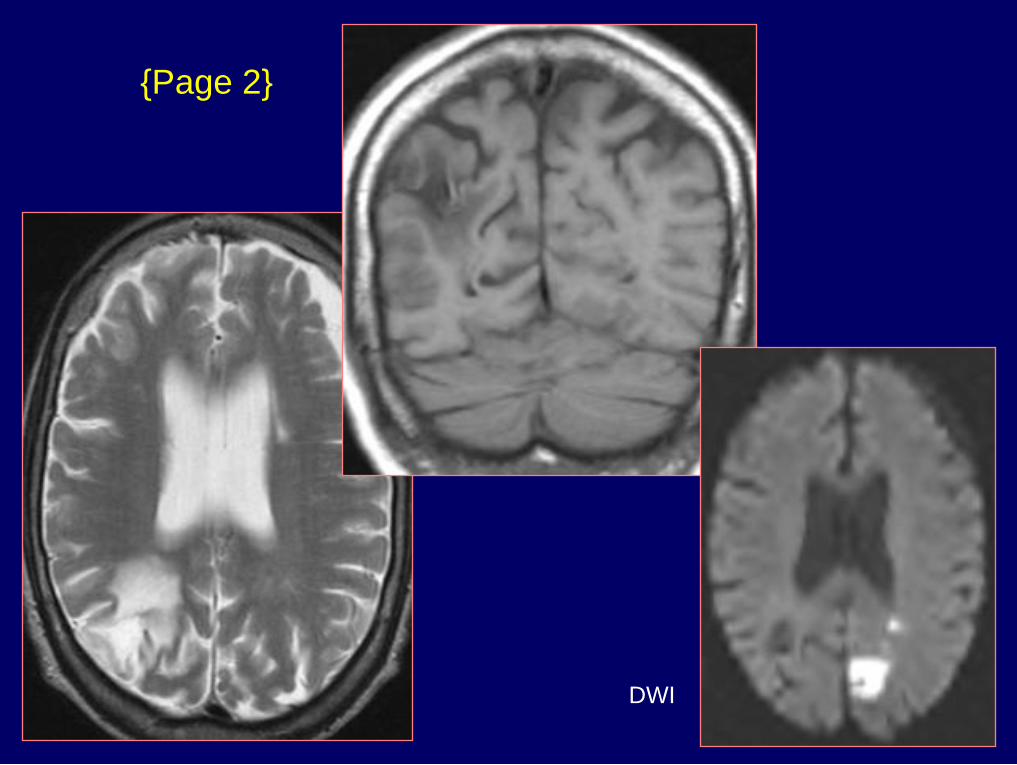
{Page 2}
DWI
Dx: Acute & chronic strokes
{Page 3}
DWI
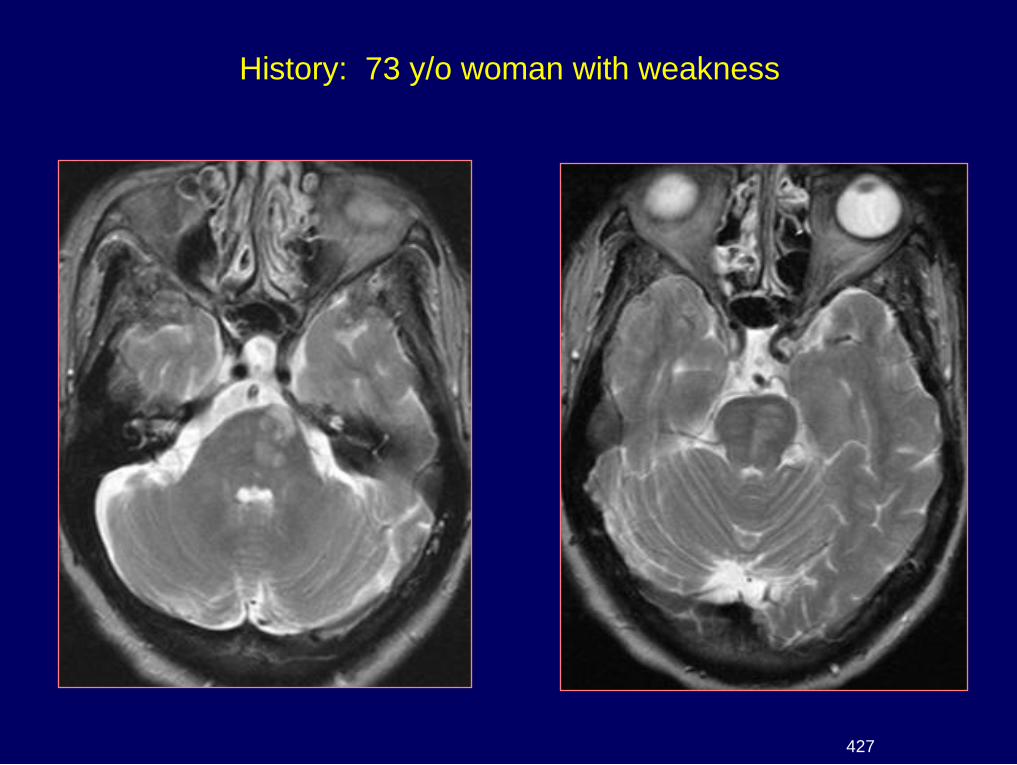
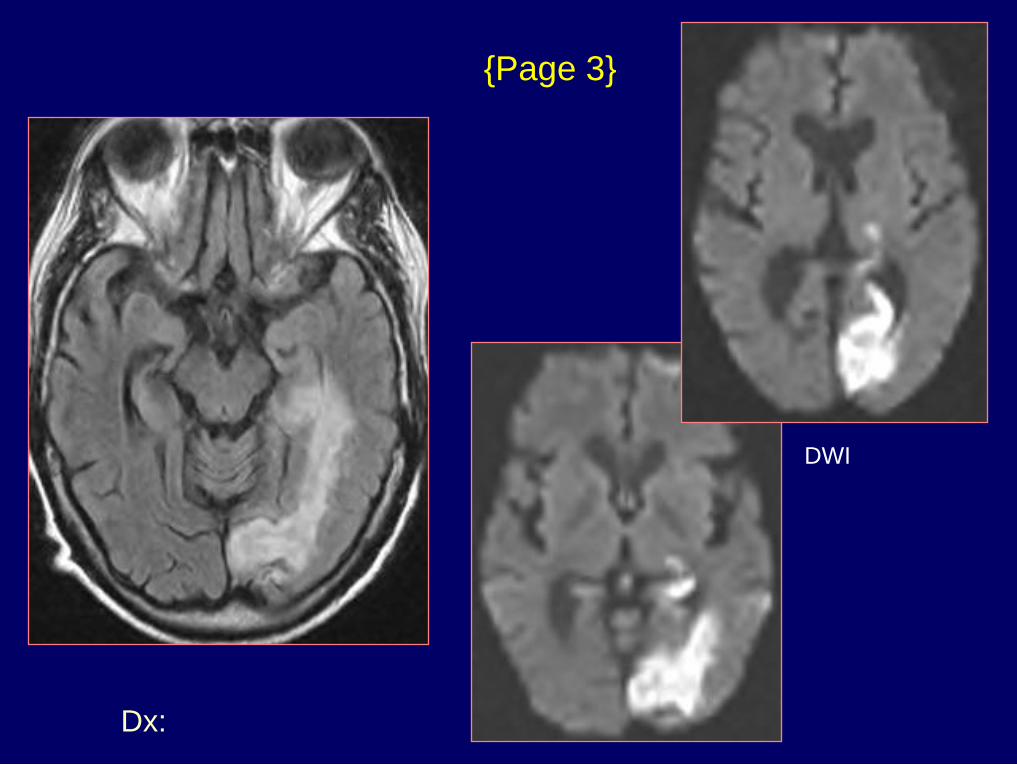
History: 73 y/o woman with weakness
427
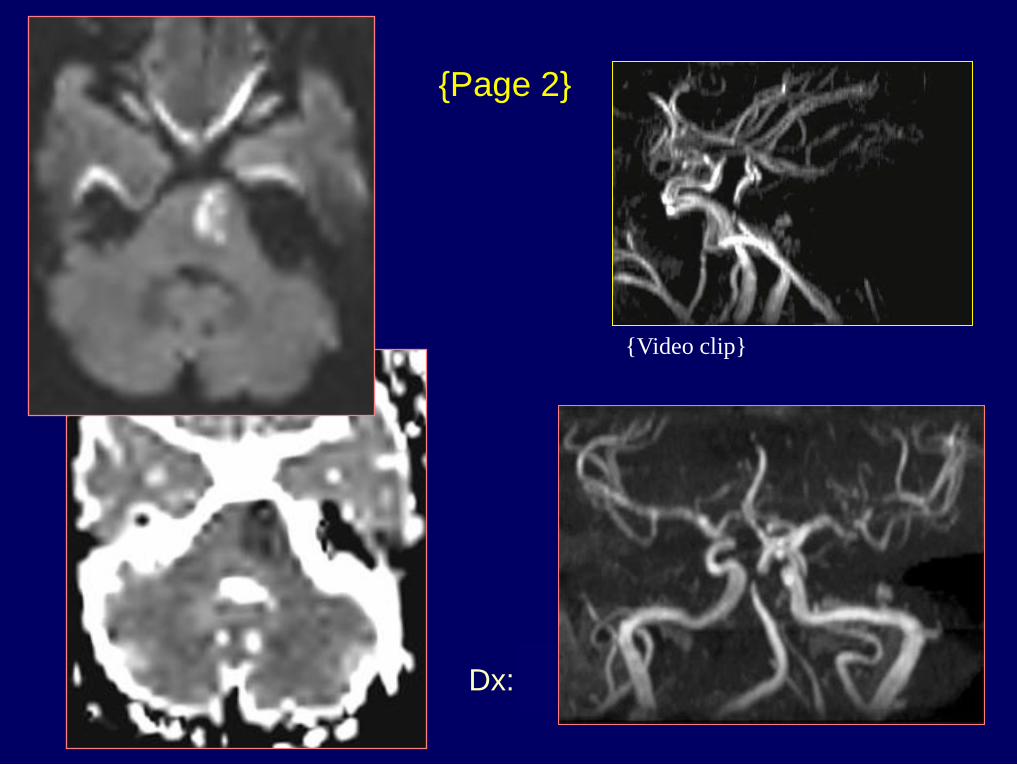
Dx: Acute pontine infarct
{Page 2}
{Video clip}
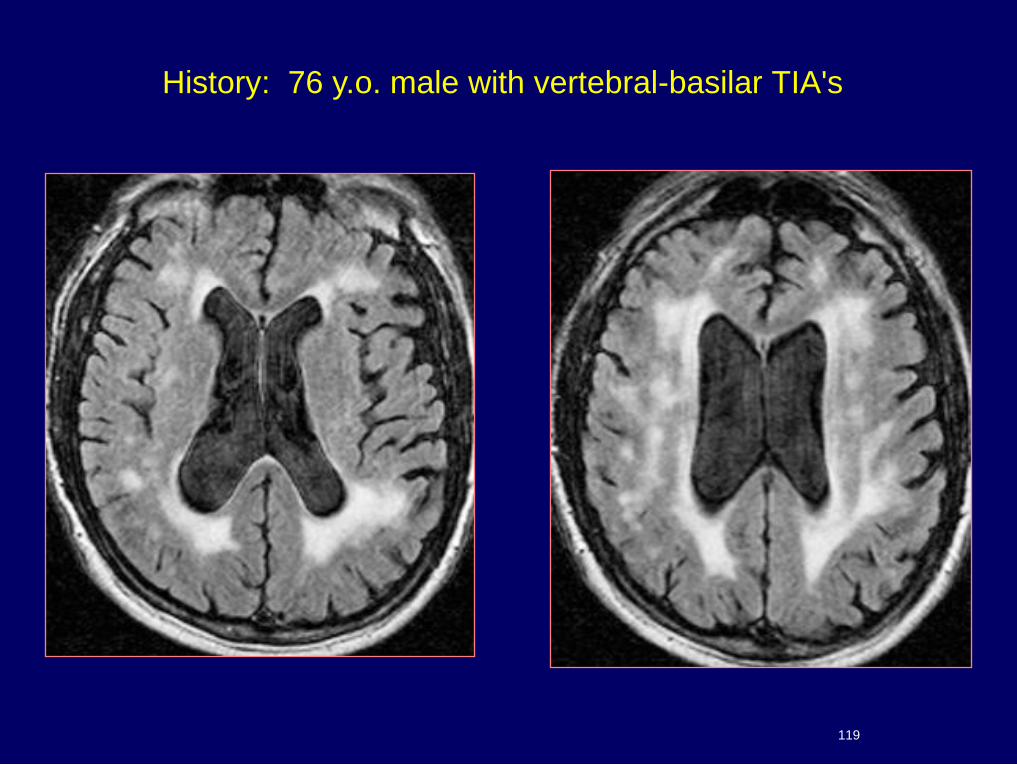
History: 76 y.o. male with vertebral-basilar TIA's
119
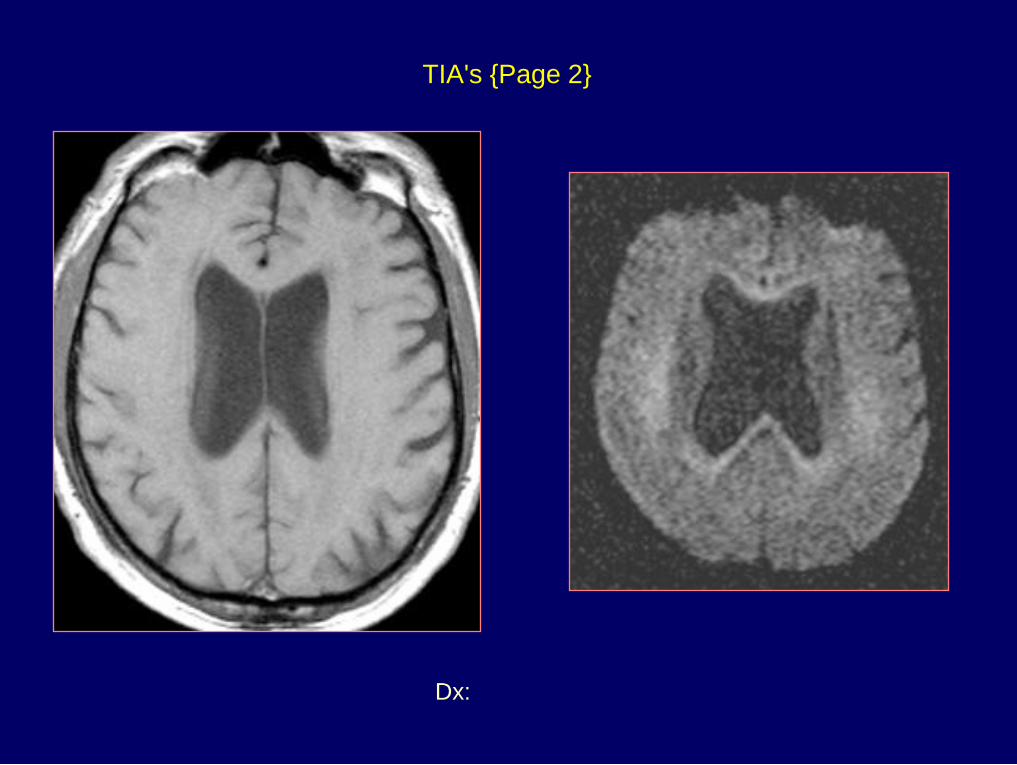
Dx: FLAIR & Diffusion - DWMI
TIA's {Page 2}
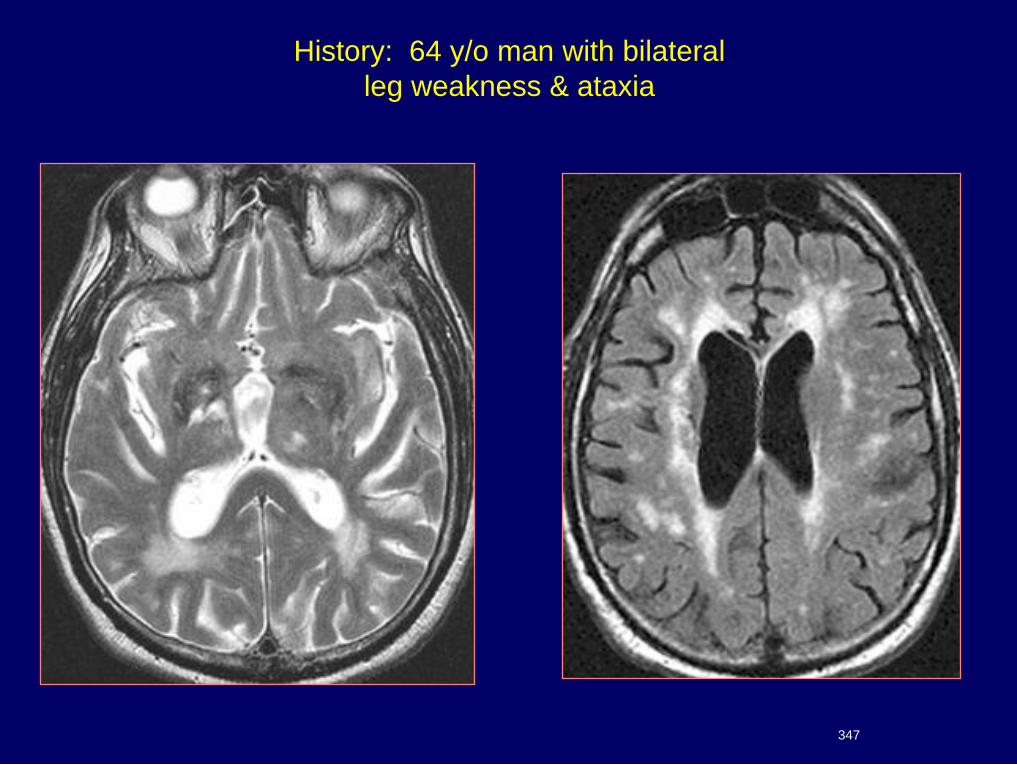
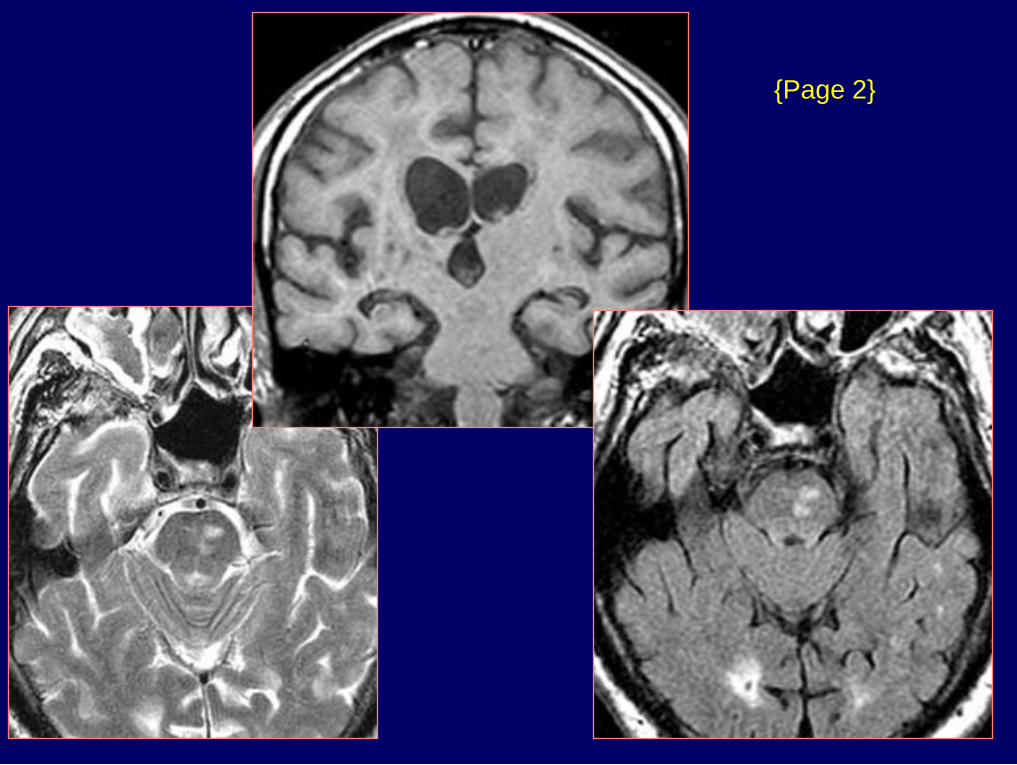
History: 64 y/o man with bilateral
leg weakness & ataxia
347
{Page 2}
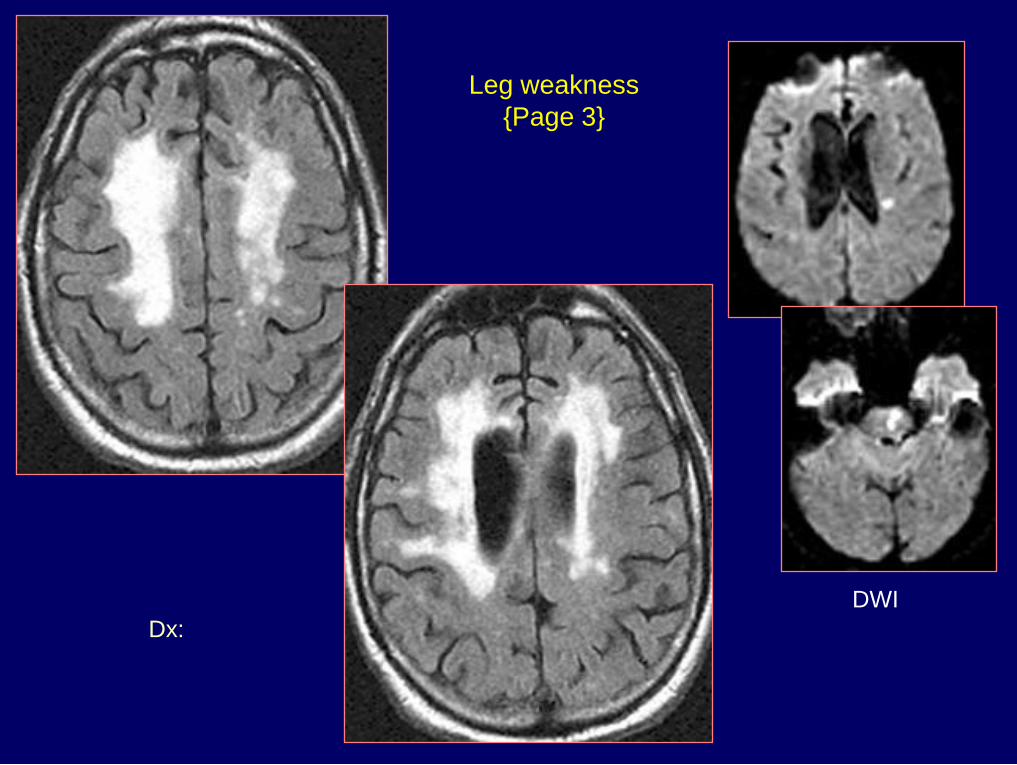
Dx: Acute infarcts in pons
& left corona radiata
Leg weakness
{Page 3}
DWI
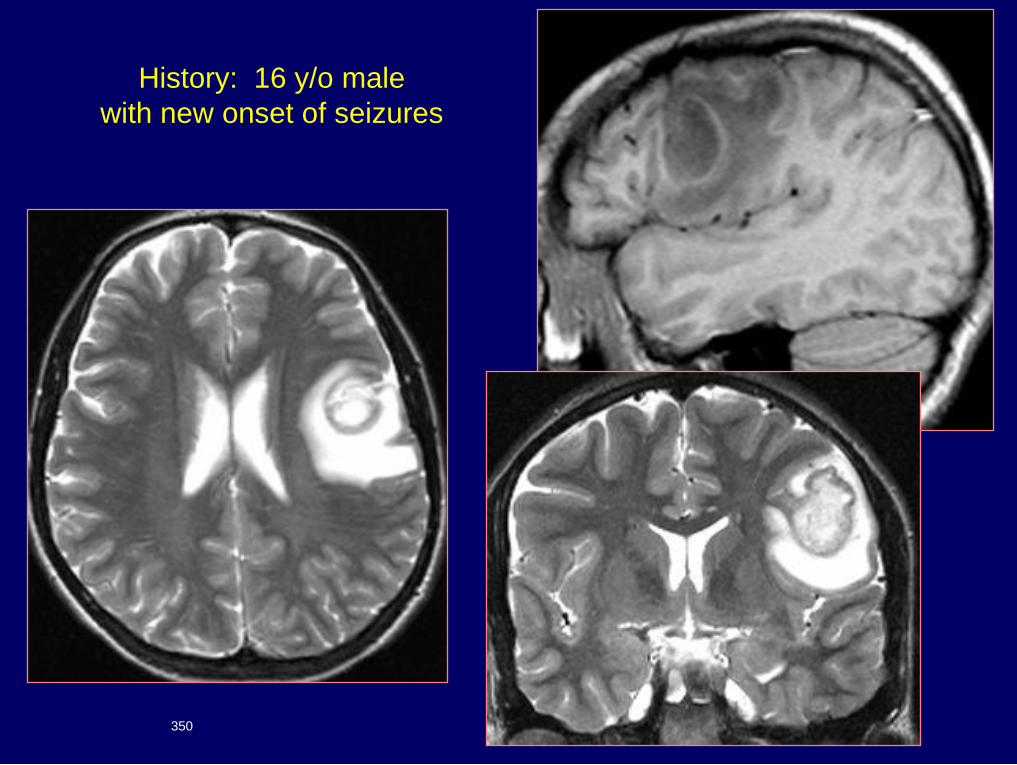
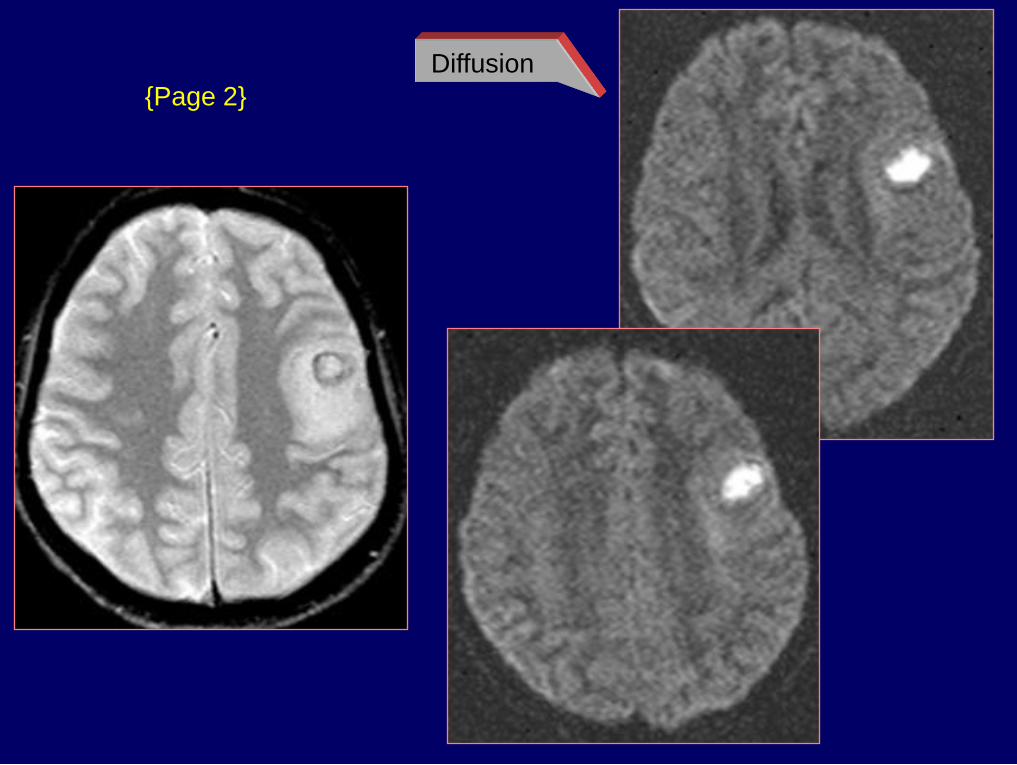
History: 16 y/o male
with new onset of seizures
350
{Page 2}
Diffusion
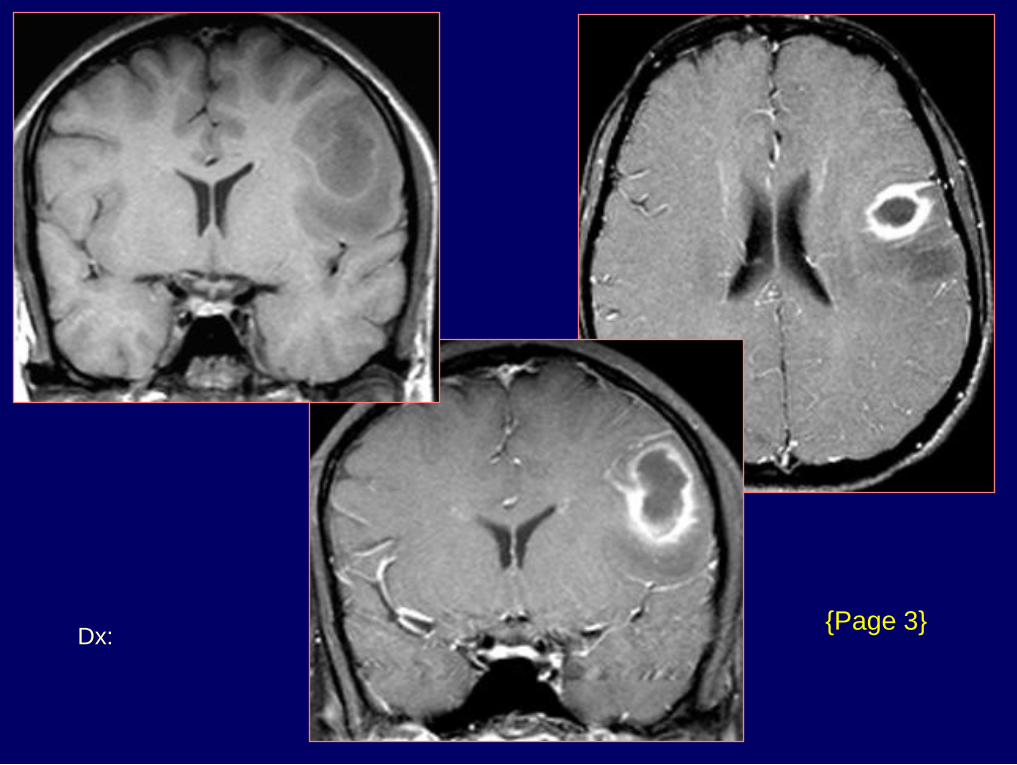
Dx: Brain abscess -
Streptococcus milleri
{Page 3}
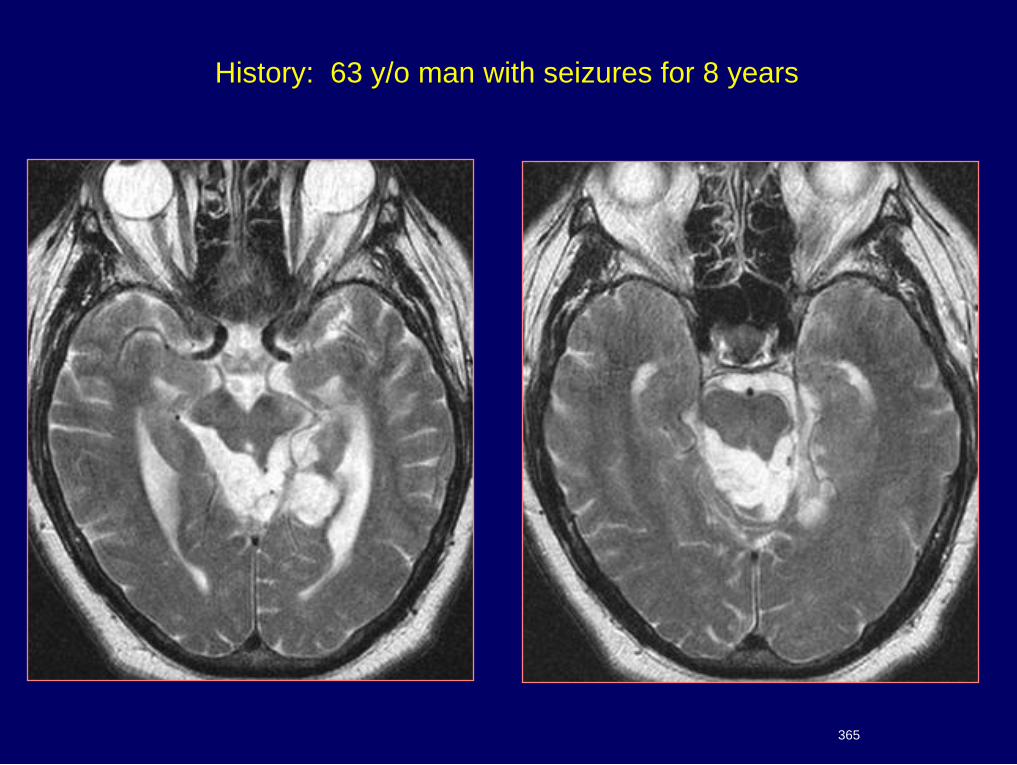
History: 63 y/o man with seizures for 8 years
365
{Page 2}
Dx: Epidermoid
{Page 3}
Diffusion
Other Causes of Positive DWI
Bacterial abscess, Epidermoid tumor
Acute demyelination
Acute encephalitis
Tumors undergoing central necrosis
Tumors with high nuclear:cytoplasmic ratios
Creutzfeldt-Jakob disease
Diffuse axonal injury
T2 shine-through (High ADC)
Perfusion Techniques
Cerebral blood flow PET
Xenon CT
CT and MRI Vascular transit time
Cerebral blood volume
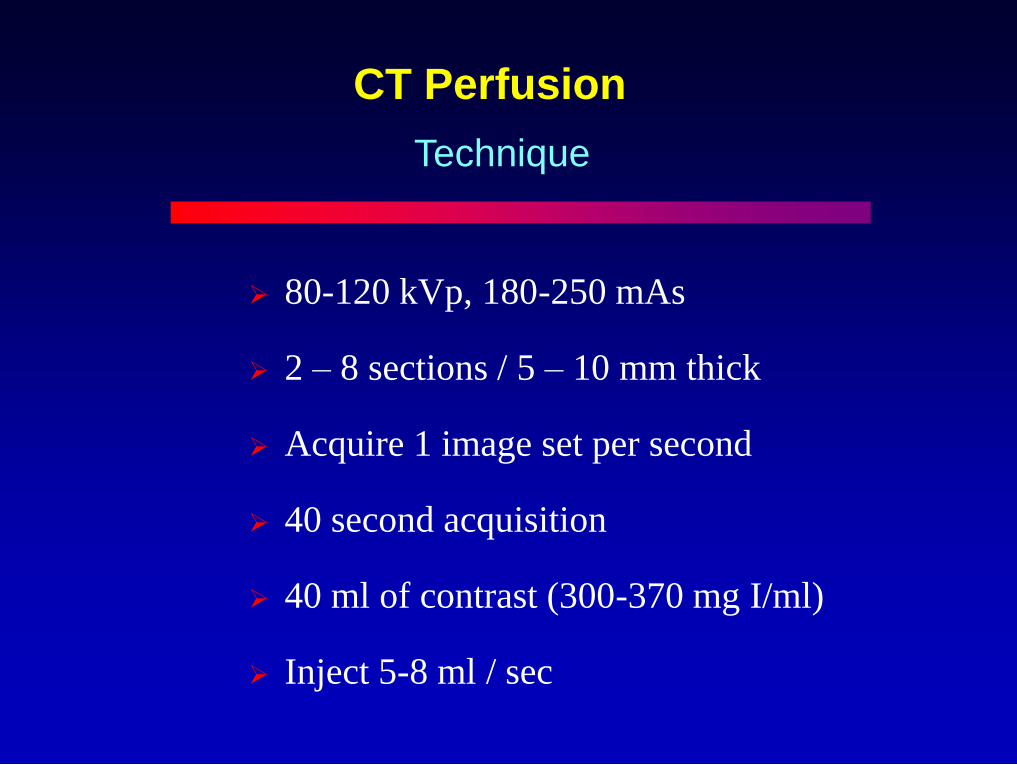
CT Perfusion
80-120 kVp, 180-250 mAs
2 – 8 sections / 5 – 10 mm thick
Acquire 1 image set per second
40 second acquisition
40 ml of contrast (300-370 mg I/ml)
Inject 5-8 ml / sec
Technique
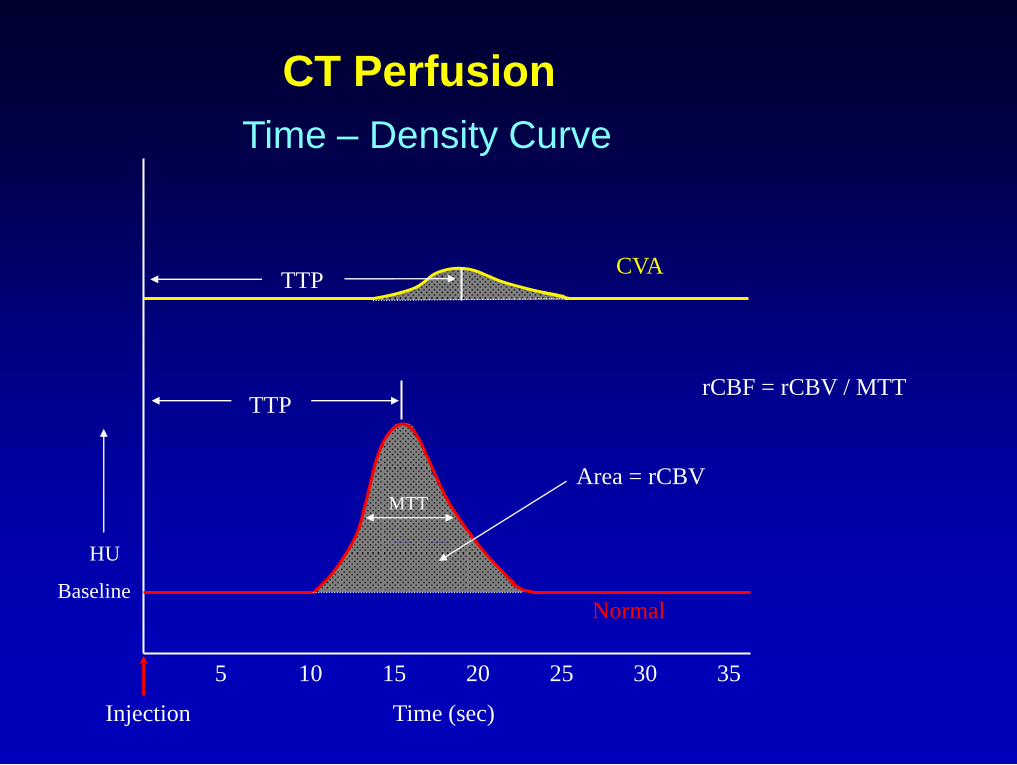
CT Perfusion
Time – Density Curve
5 10 15 20 25 30 35
Injection Time (sec)
rCBF = rCBV / MTT
HU
Baseline
TTP
Normal
Area = rCBV MTT
TTP CVA
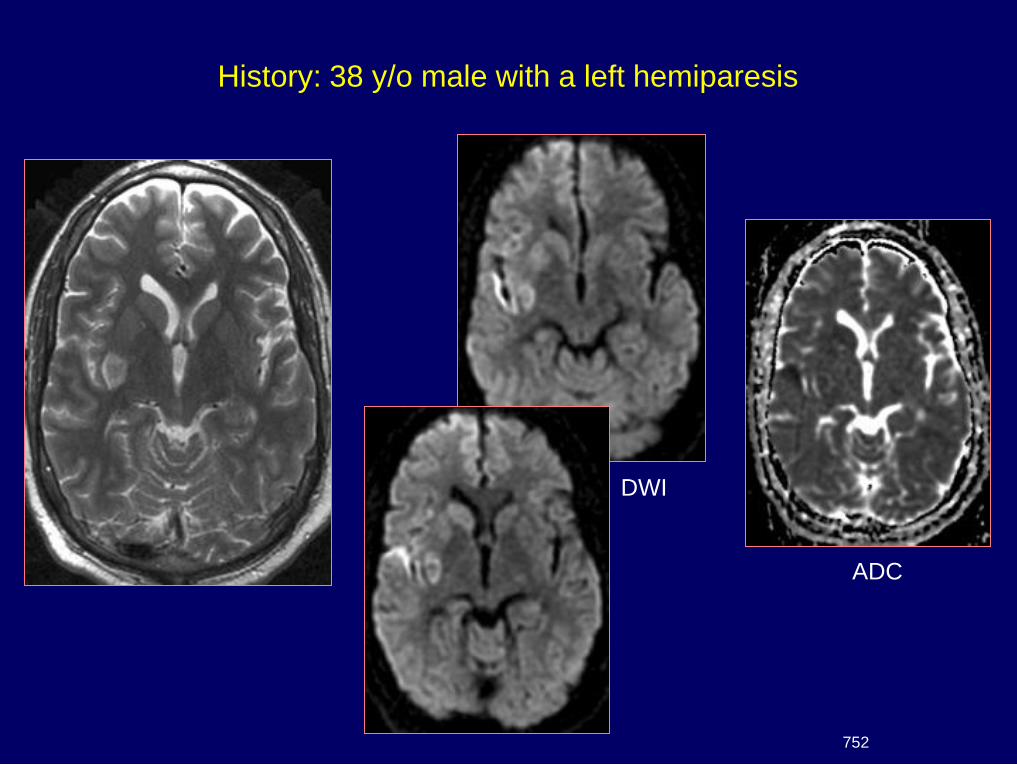
History: 38 y/o male with a left hemiparesis
752
DWI
ADC
{Page 2}
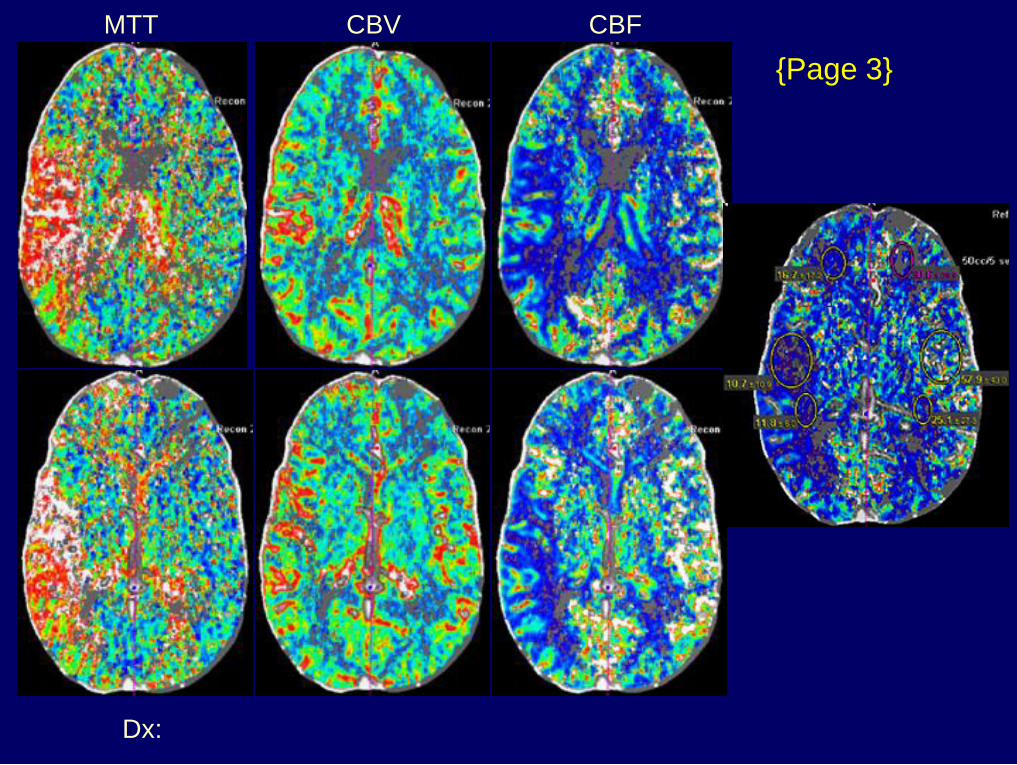
Dx: MCA embolus & stroke
{Page 3}
MTT CBV CBF
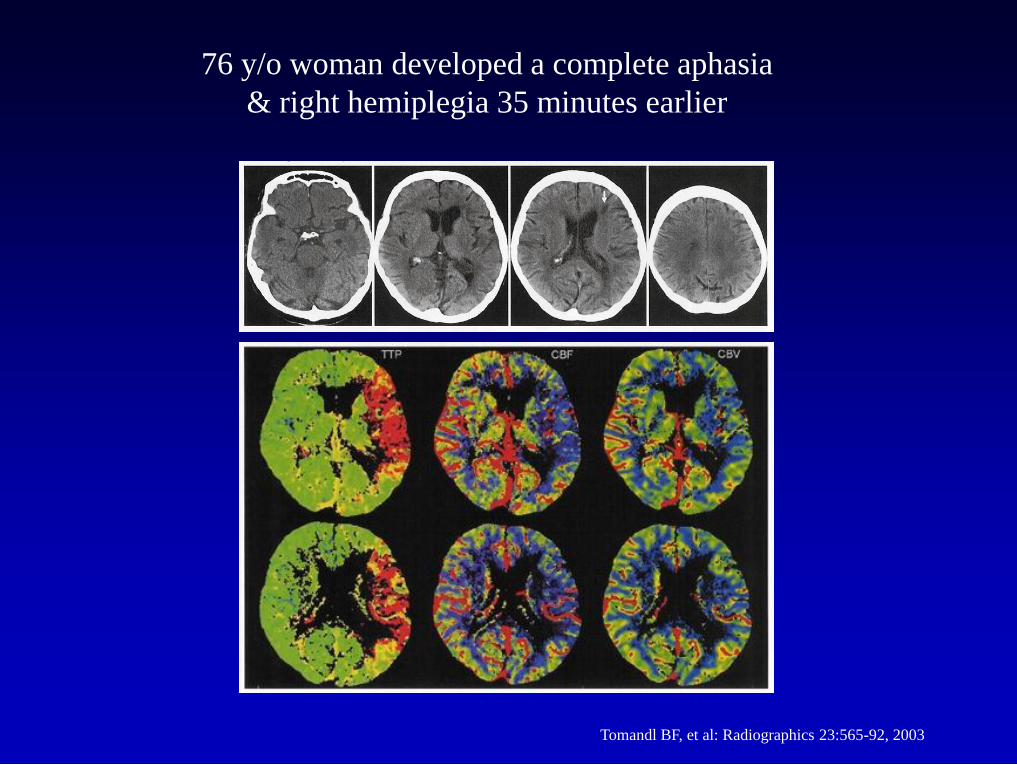
Tomandl BF, et al: Radiographics 23:565-92, 2003
76 y/o woman developed a complete aphasia
& right hemiplegia 35 minutes earlier
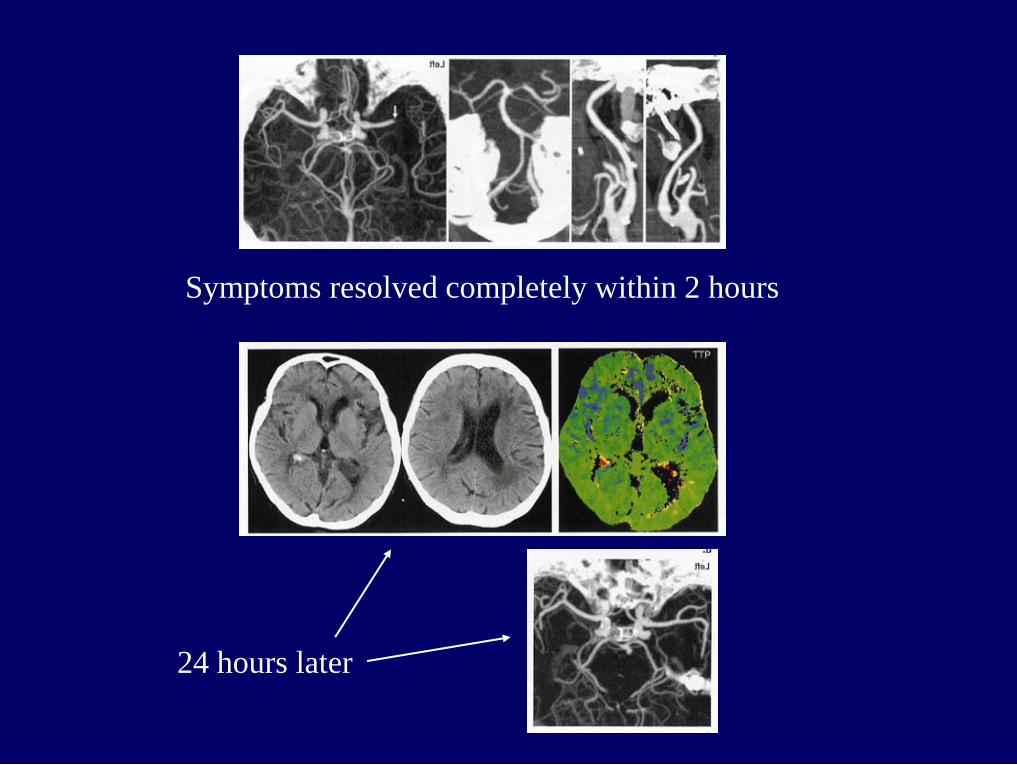
Symptoms resolved completely within 2 hours
24 hours later
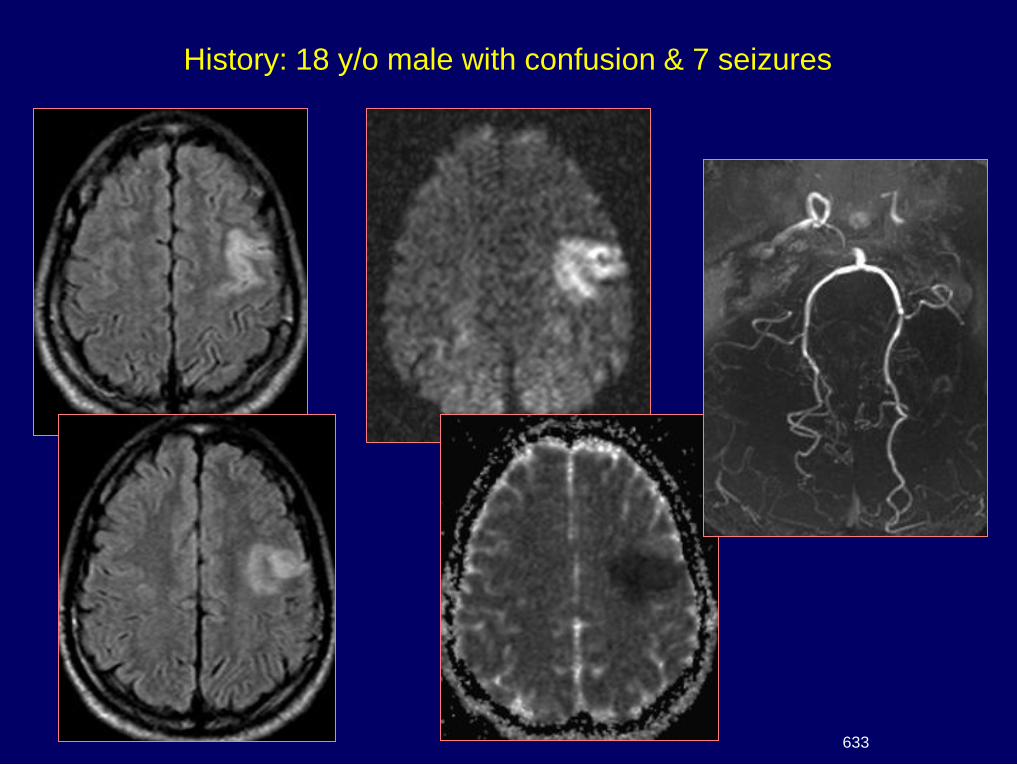
History: 18 y/o male with confusion & 7 seizures
633
{Page 2}
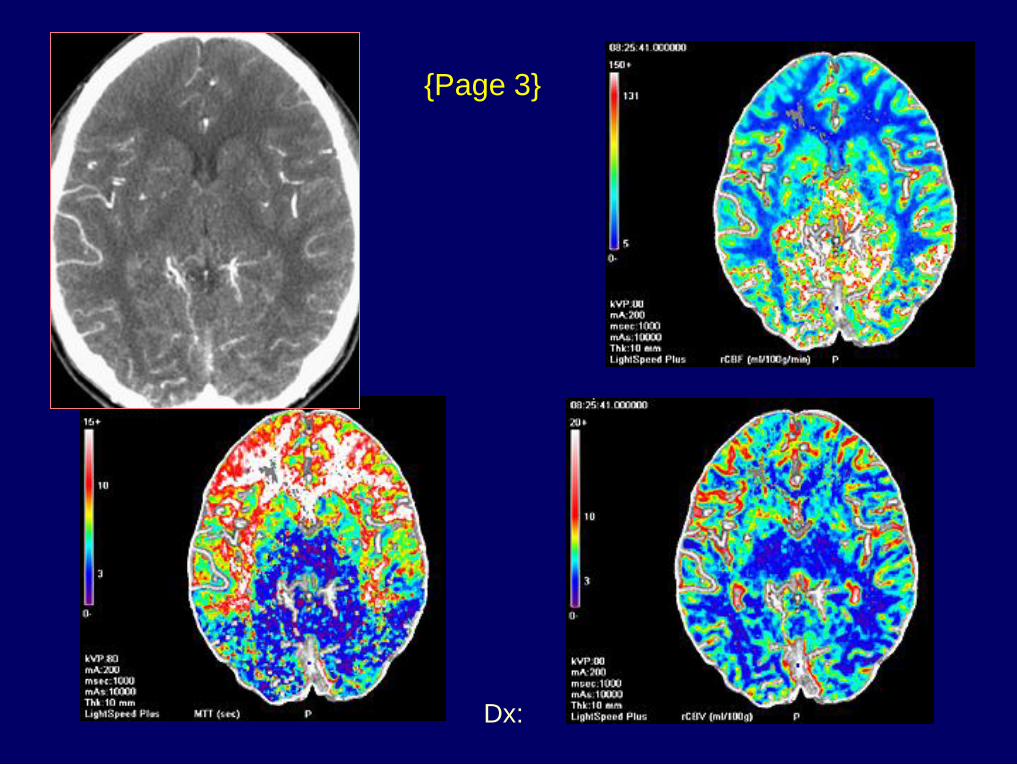
Dx: Moya Moya
{Page 3}
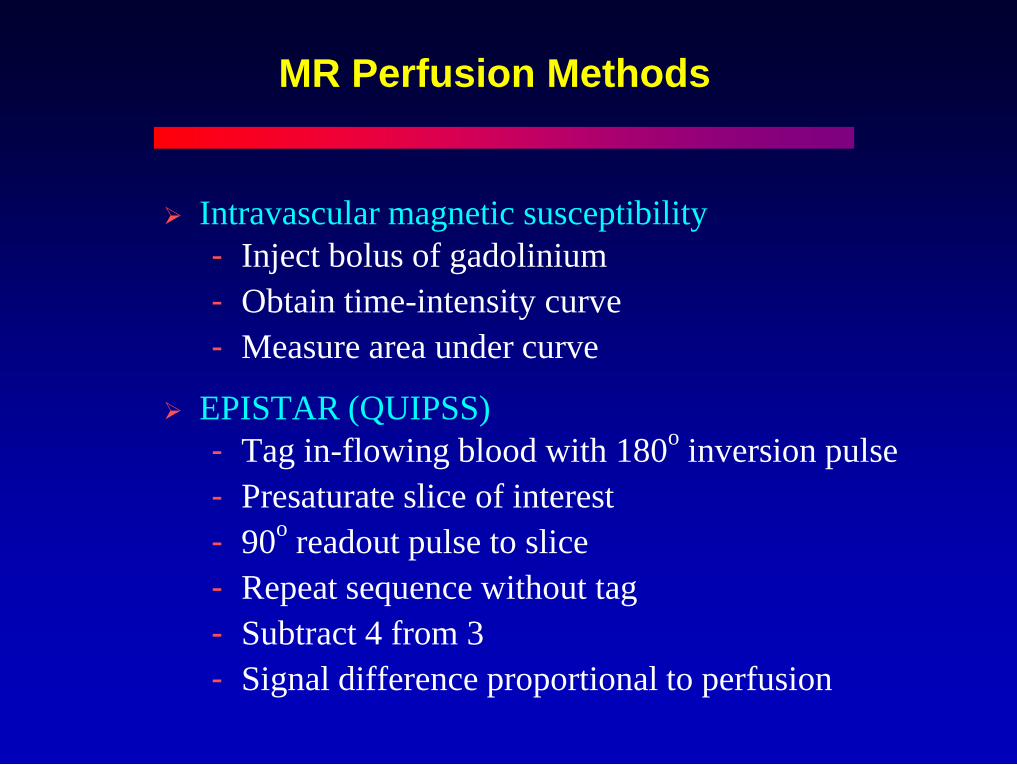
MR Perfusion Methods
Intravascular magnetic susceptibility
- Inject bolus of gadolinium
- Obtain time-intensity curve
- Measure area under curve
EPISTAR (QUIPSS)
- Tag in-flowing blood with 180o inversion pulse
- Presaturate slice of interest
- 90o readout pulse to slice
- Repeat sequence without tag
- Subtract 4 from 3
- Signal difference proportional to perfusion
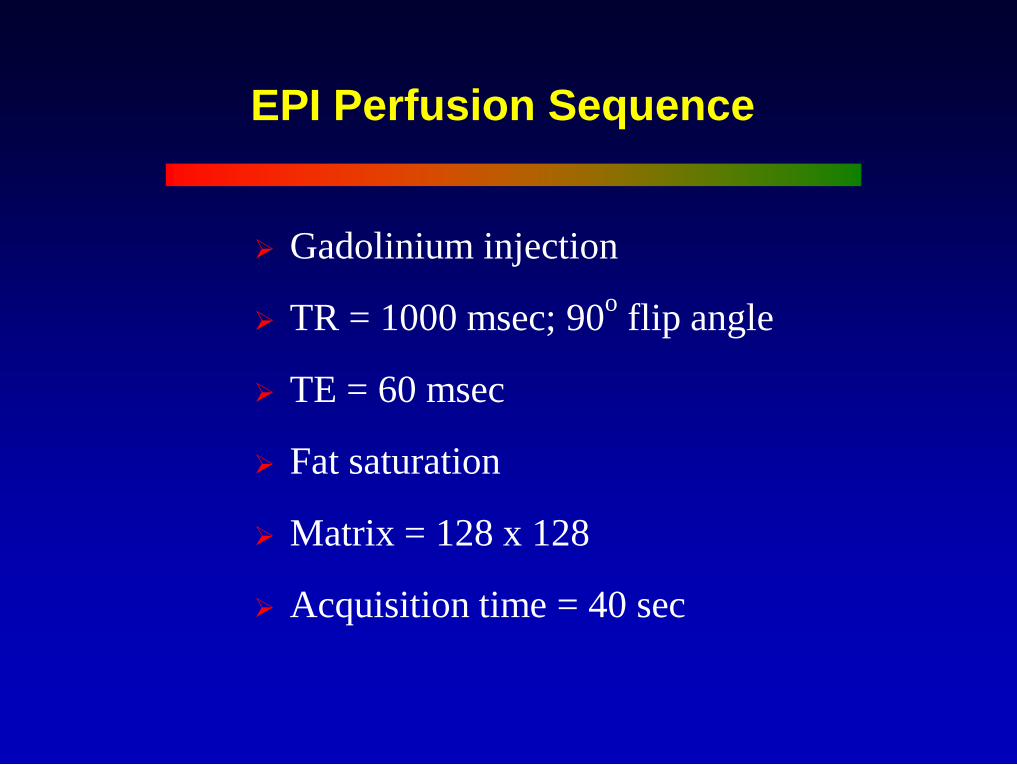
EPI Perfusion Sequence
Gadolinium injection
TR = 1000 msec; 90o flip angle
TE = 60 msec
Fat saturation
Matrix = 128 x 128
Acquisition time = 40 sec
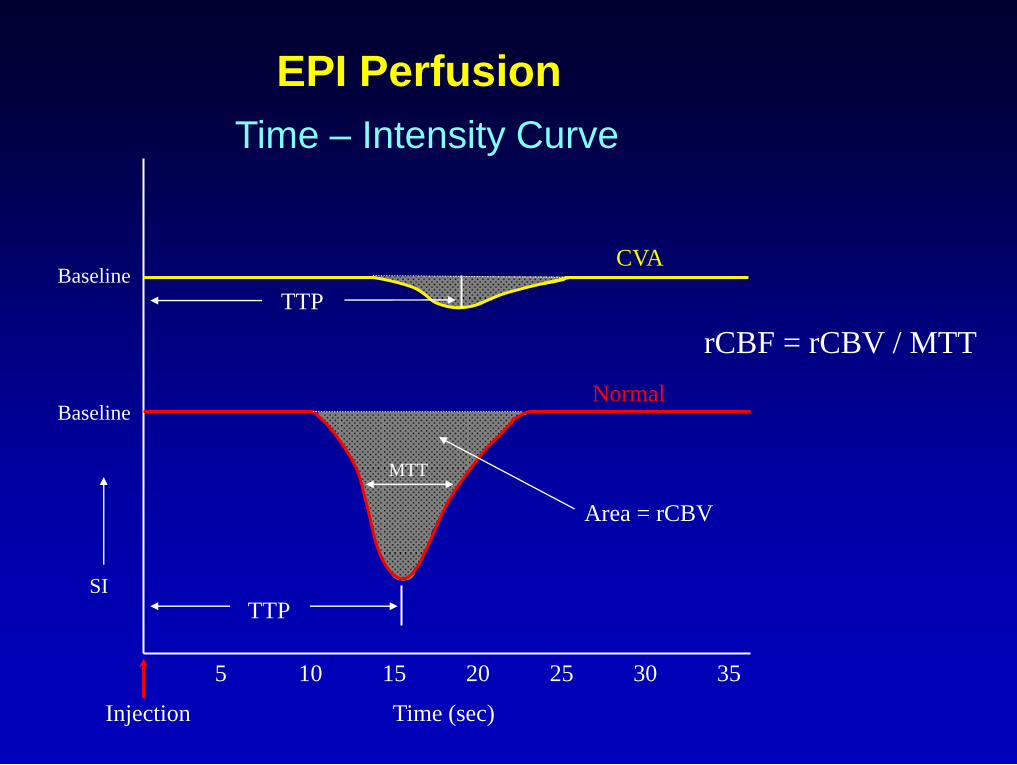
EPI Perfusion
Time – Intensity Curve
5 10 15 20 25 30 35
rCBF = rCBV / MTT
SI
Baseline Normal
Area = rCBV
TTP
MTT
Injection Time (sec)
Baseline
TTP
CVA
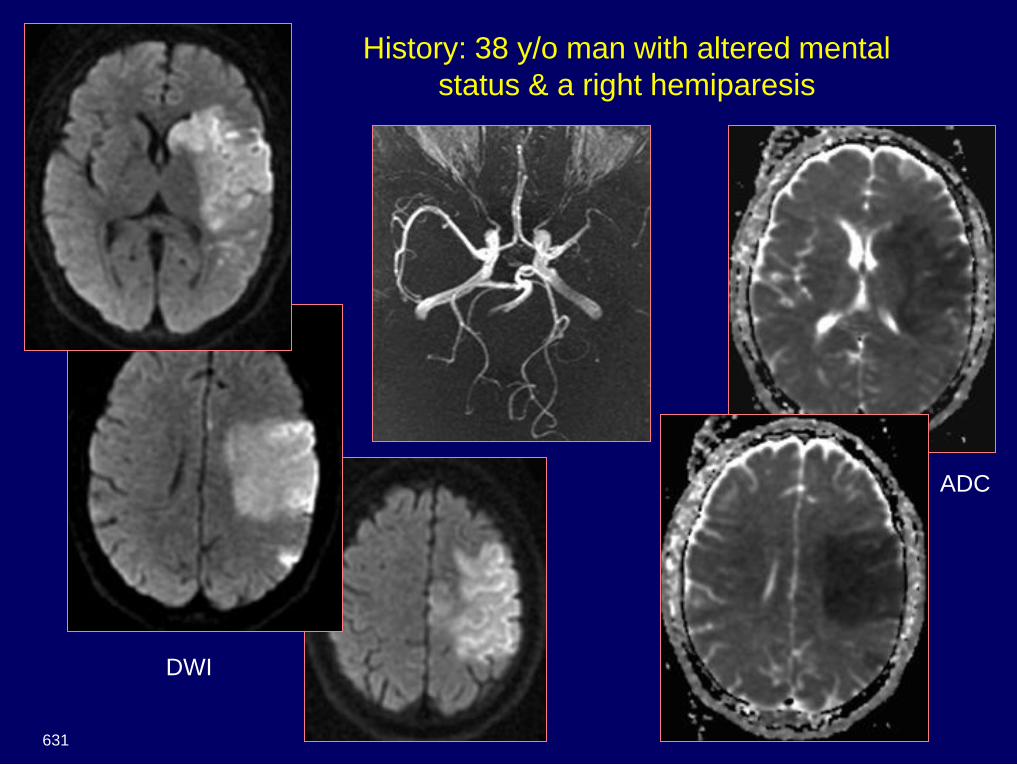
History: 38 y/o man with altered mental
status & a right hemiparesis
631
DWI
ADC
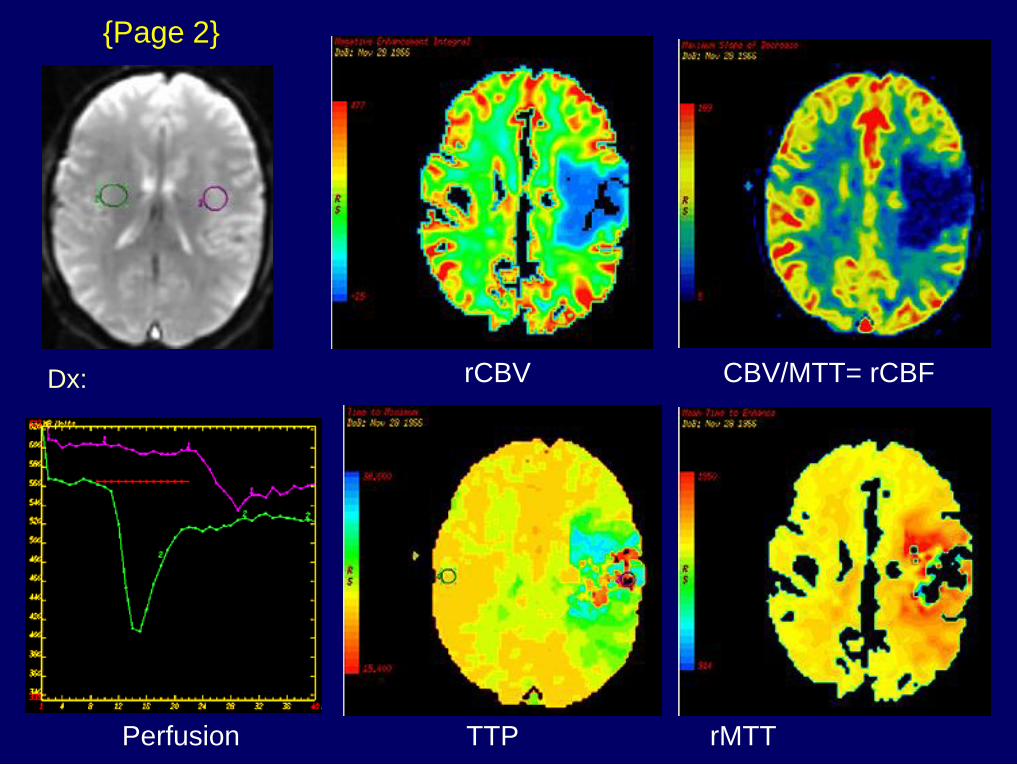
Dx: Embolic MCA infarct – right
ventricular cardiac thrombus
{Page 2}
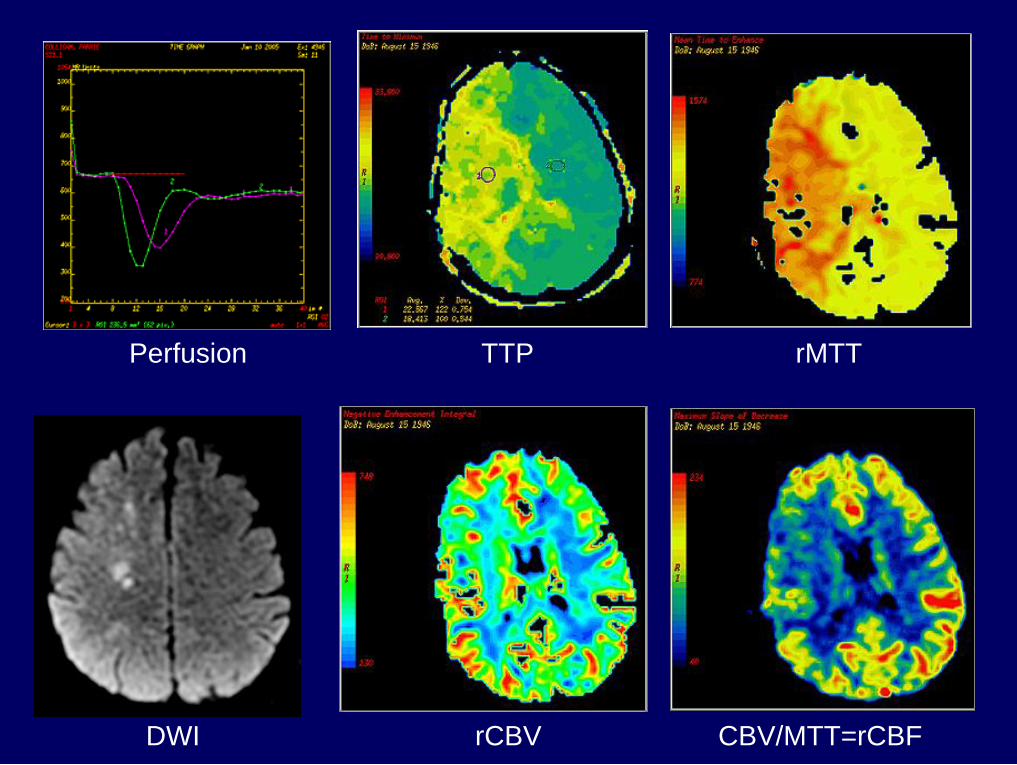
Perfusion TTP rMTT
rCBV CBV/MTT= rCBF
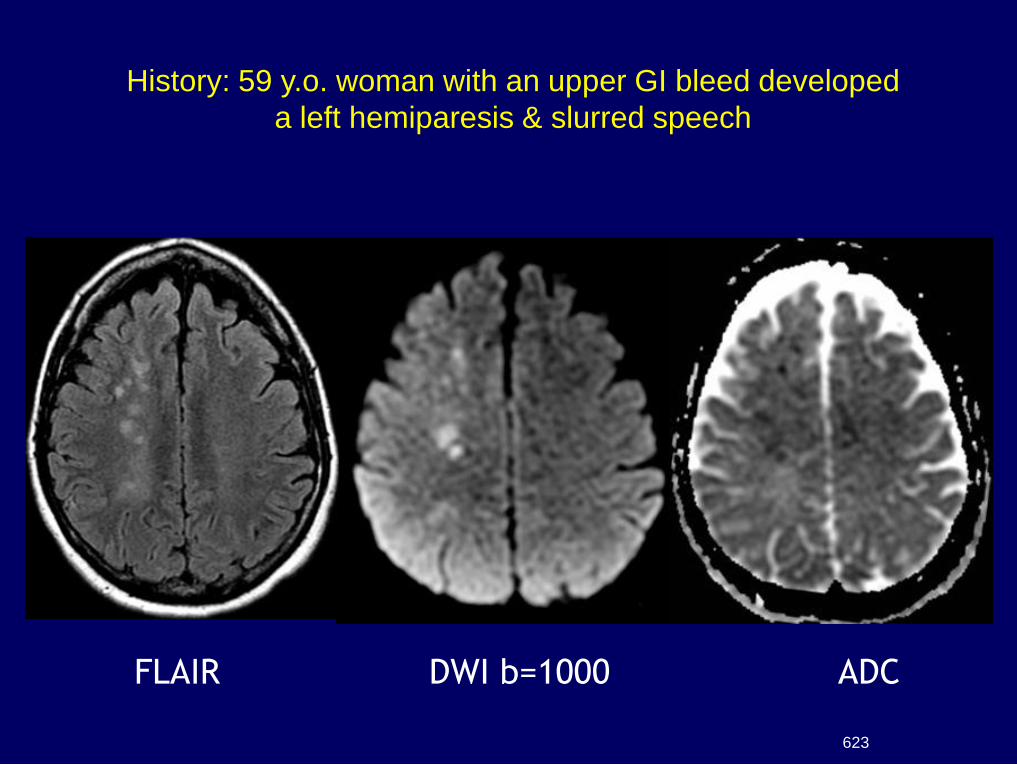
FLAIR DWI b=1000 ADC
History: 59 y.o. woman with an upper GI bleed developed
a left hemiparesis & slurred speech
623
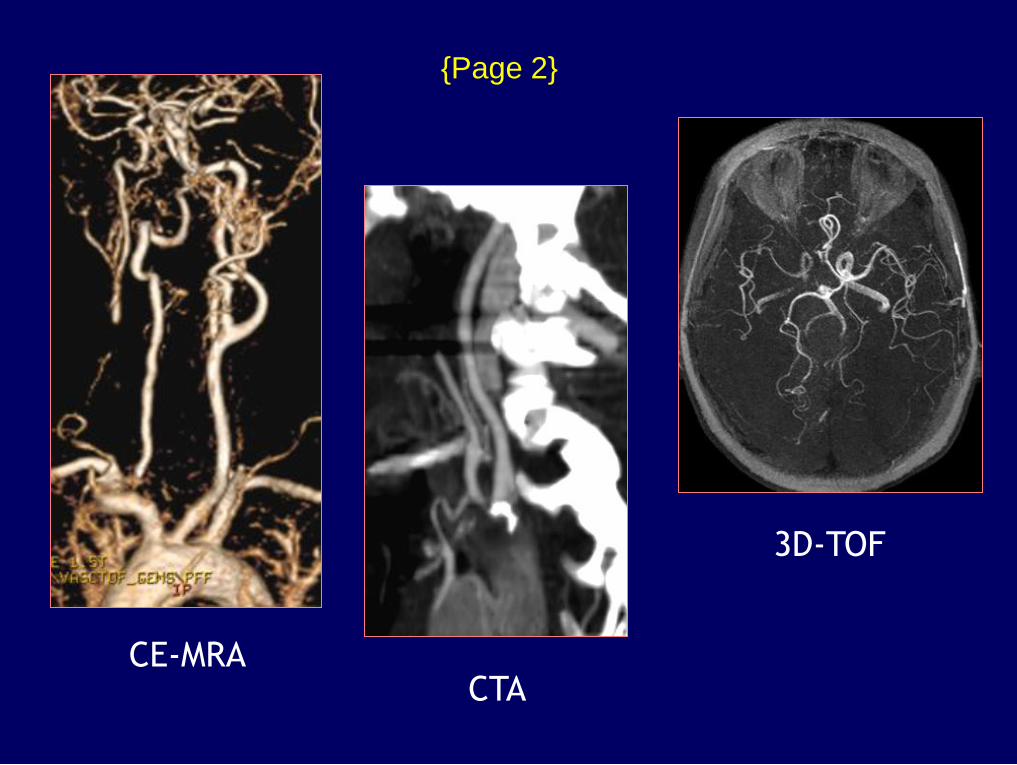
3D-TOF
CE-MRA CTA
{Page 2}
Perfusion TTP rMTT
DWI rCBV CBV/MTT=rCBF
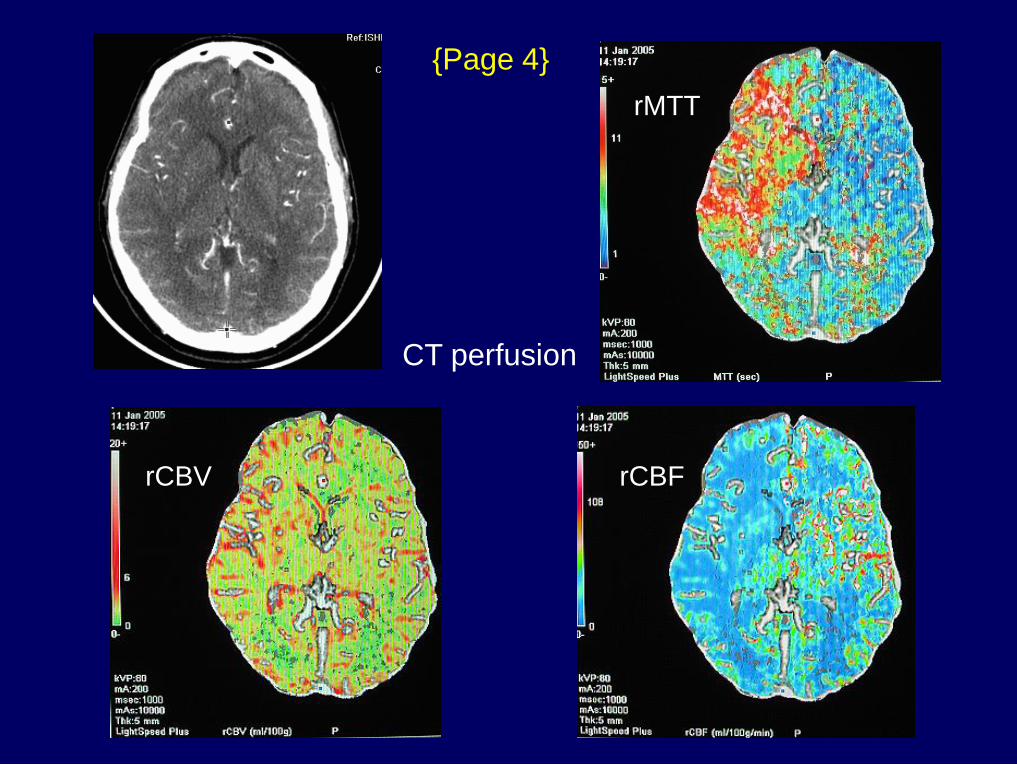
CT perfusion
{Page 4}
rCBV rCBF
rMTT
Dx: DWI/PWI mismatch
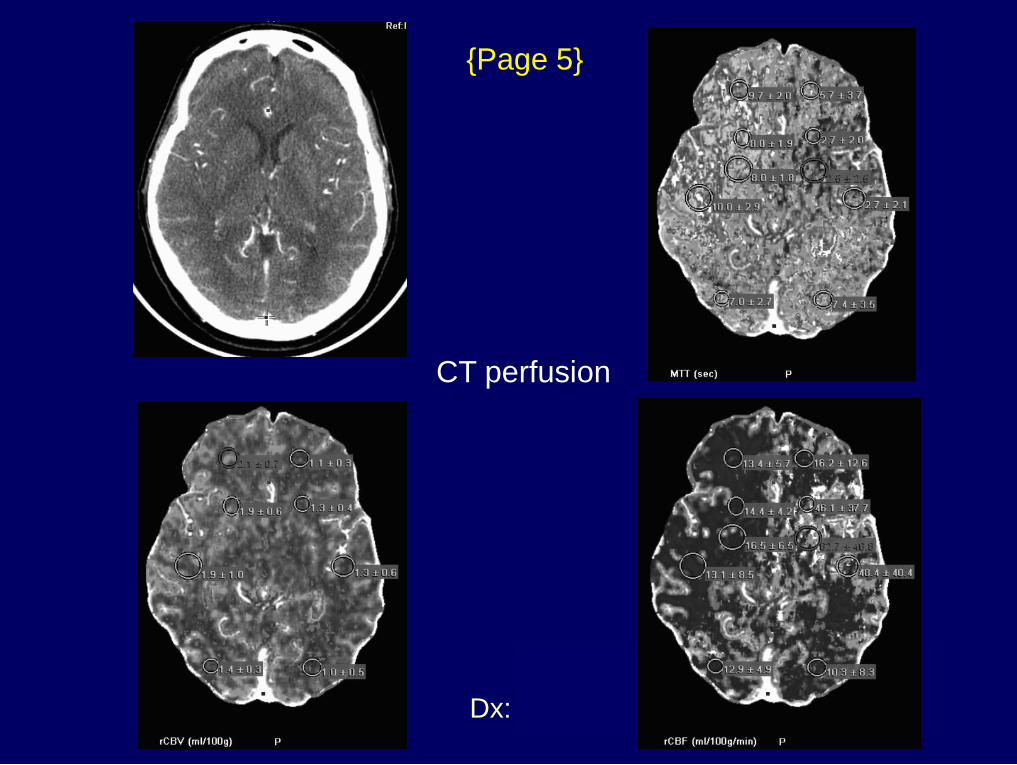
{Page 5}
CT perfusion
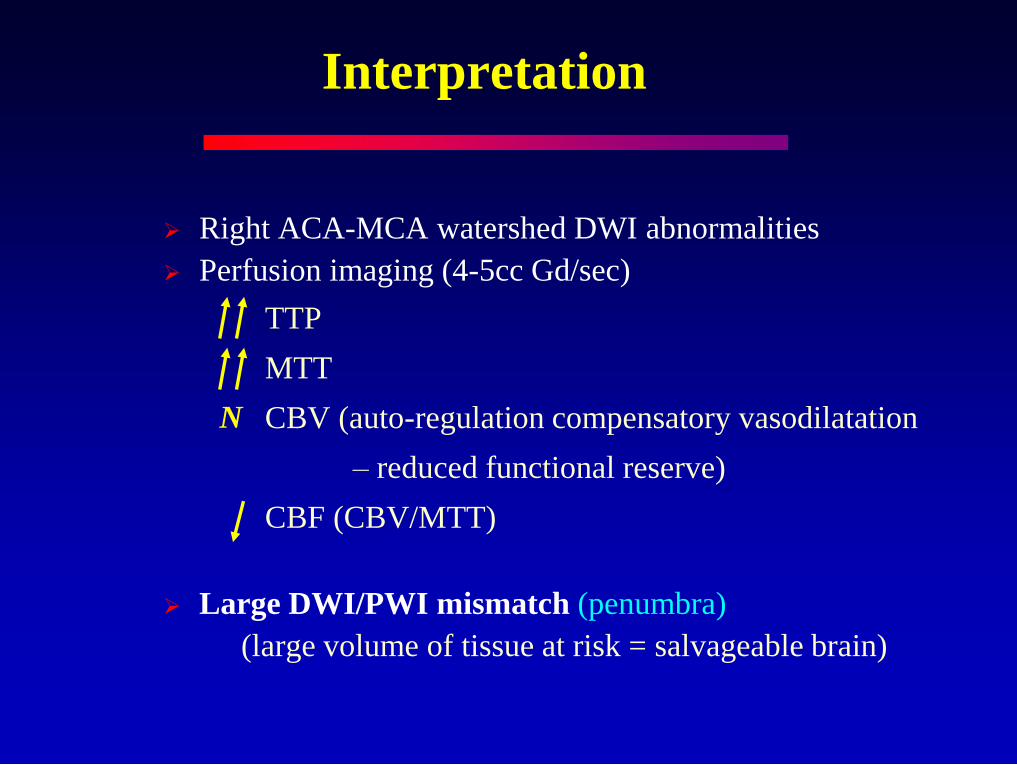
Interpretation
Right ACA-MCA watershed DWI abnormalities
Perfusion imaging (4-5cc Gd/sec)
TTP
MTT
CBV (auto-regulation compensatory vasodilatation
– reduced functional reserve)
CBF (CBV/MTT)
Large DWI/PWI mismatch (penumbra)
(large volume of tissue at risk = salvageable brain)
N

Ischemic Penumbra
DWI / PWI Mismatch
Diffusion Abnormality
CBF < 10 ml/100g/min
Cytotoxic edema
Irreversible ischemia
Perfusion Abnormality
CBF = 10-18 ml/100g/min
Neuronal paralysis
Reversible ischemia Penumbra
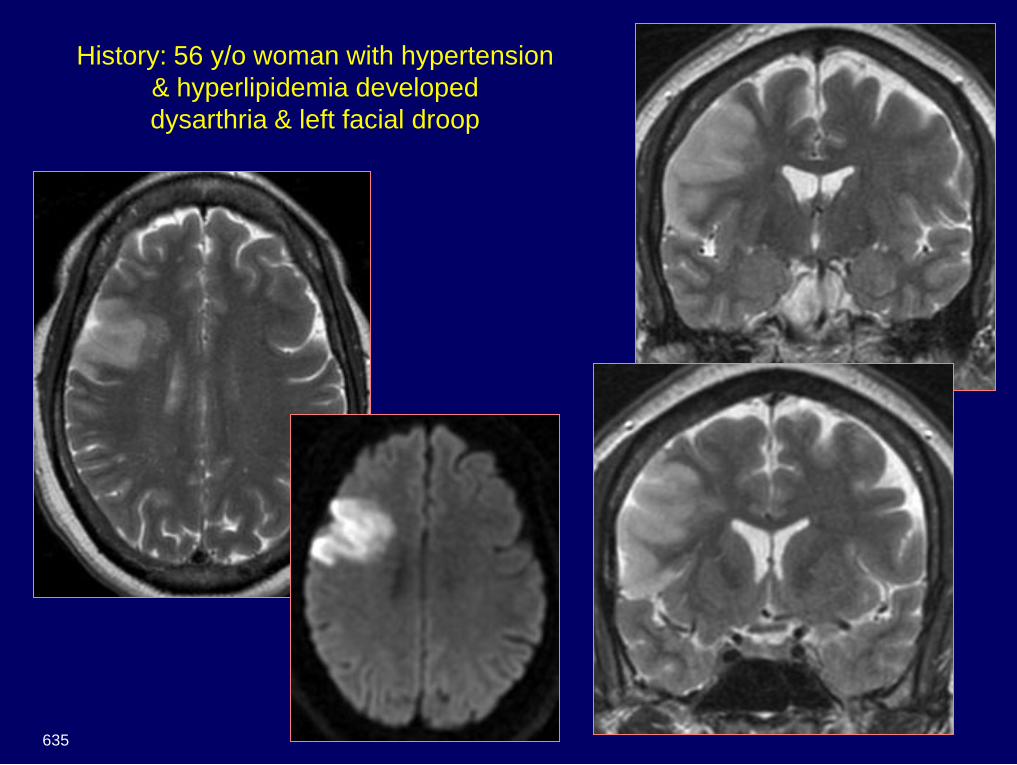
History: 56 y/o woman with hypertension
& hyperlipidemia developed
dysarthria & left facial droop
635
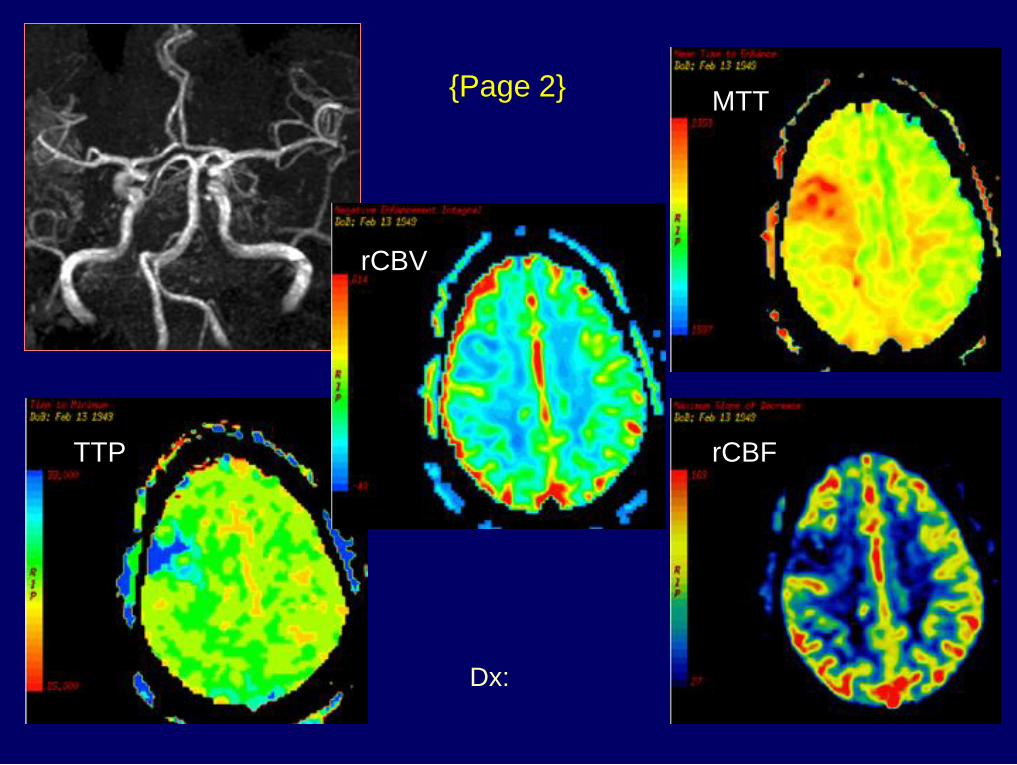
Dx: Acute infarct with matched
DWI and perfusion
{Page 2} MTT
rCBV
rCBF TTP
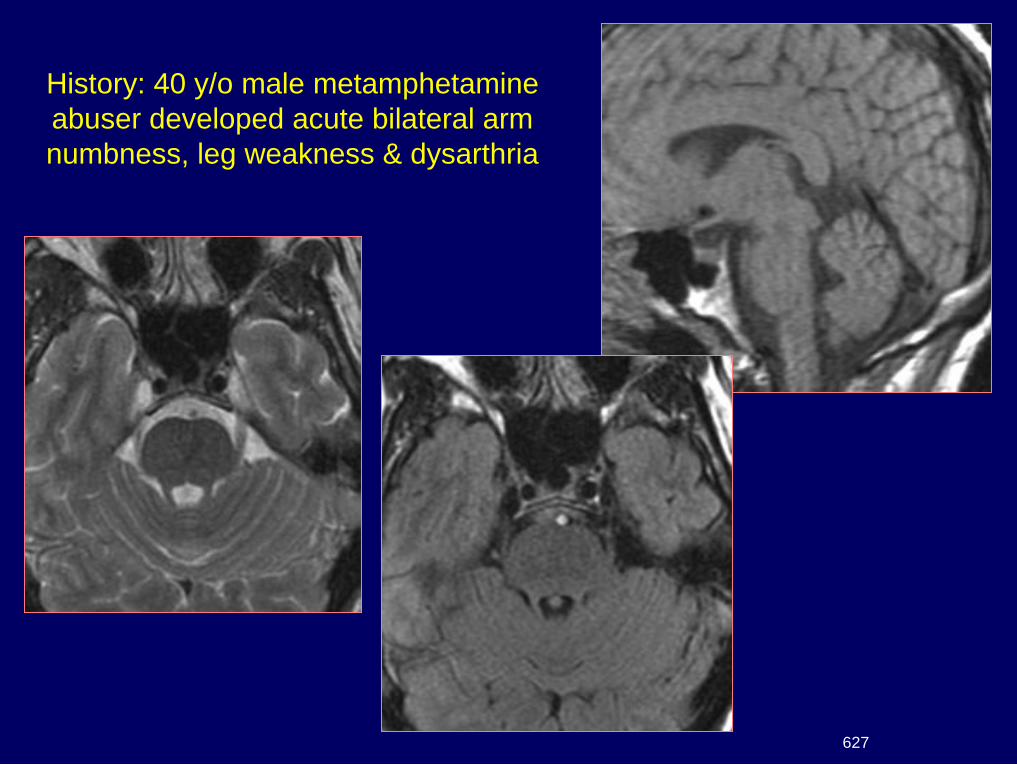
History: 40 y/o male metamphetamine
abuser developed acute bilateral arm
numbness, leg weakness & dysarthria
627
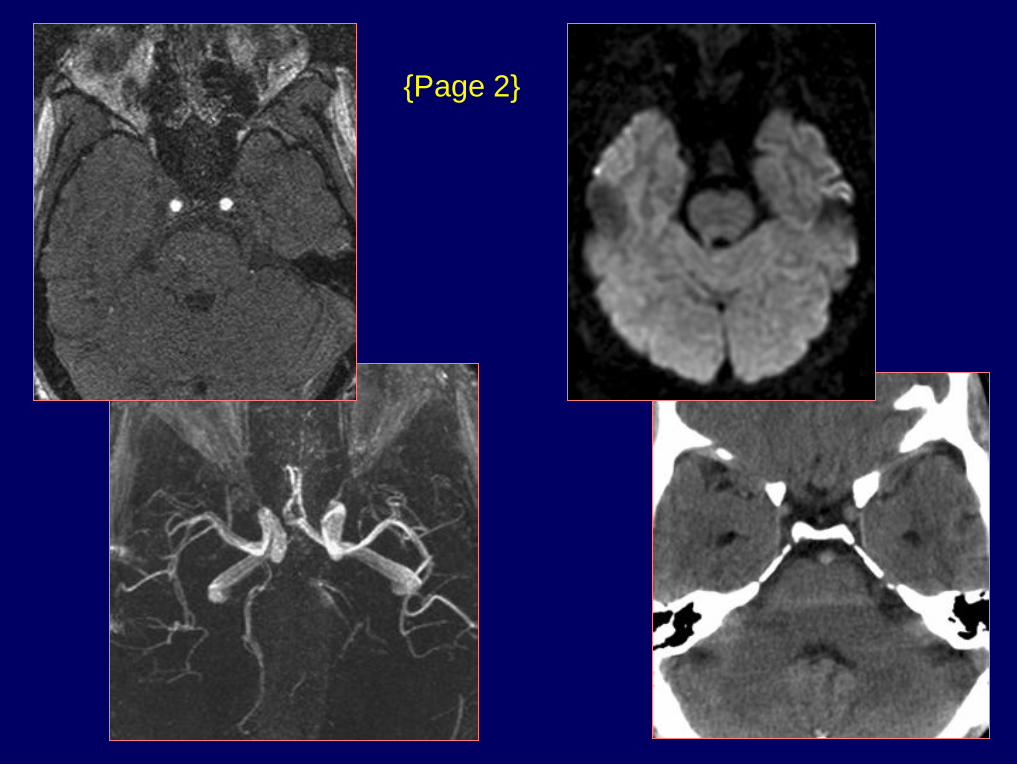
{Page 2}
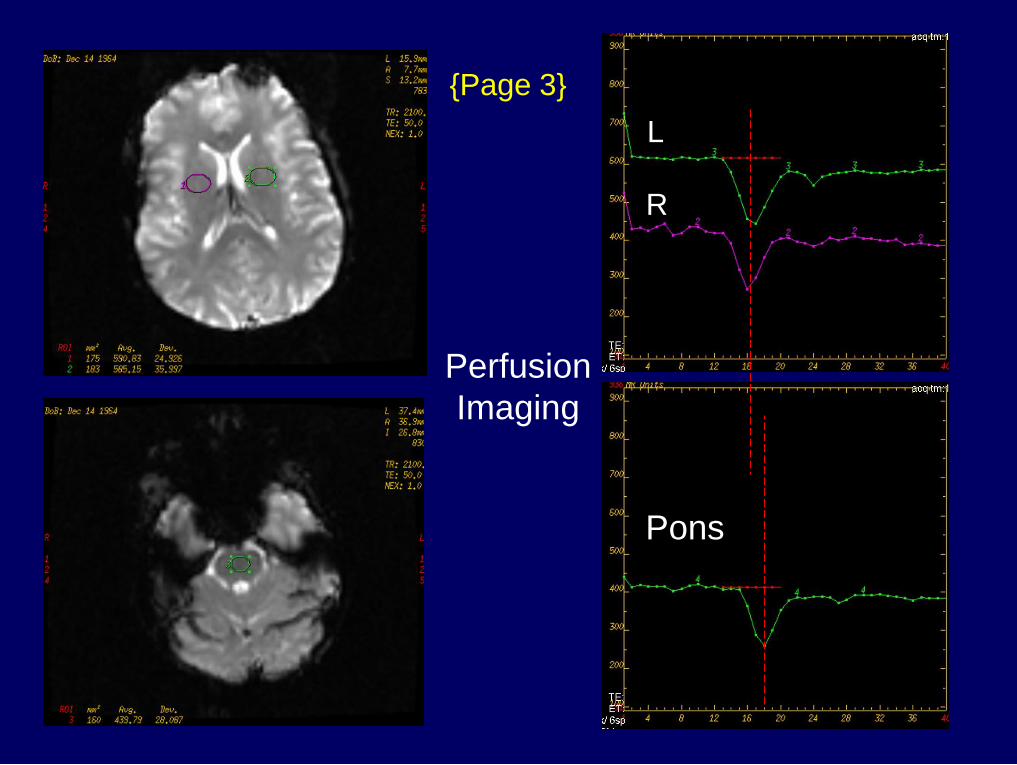
R
L
Pons
{Page 3}
Perfusion
Imaging
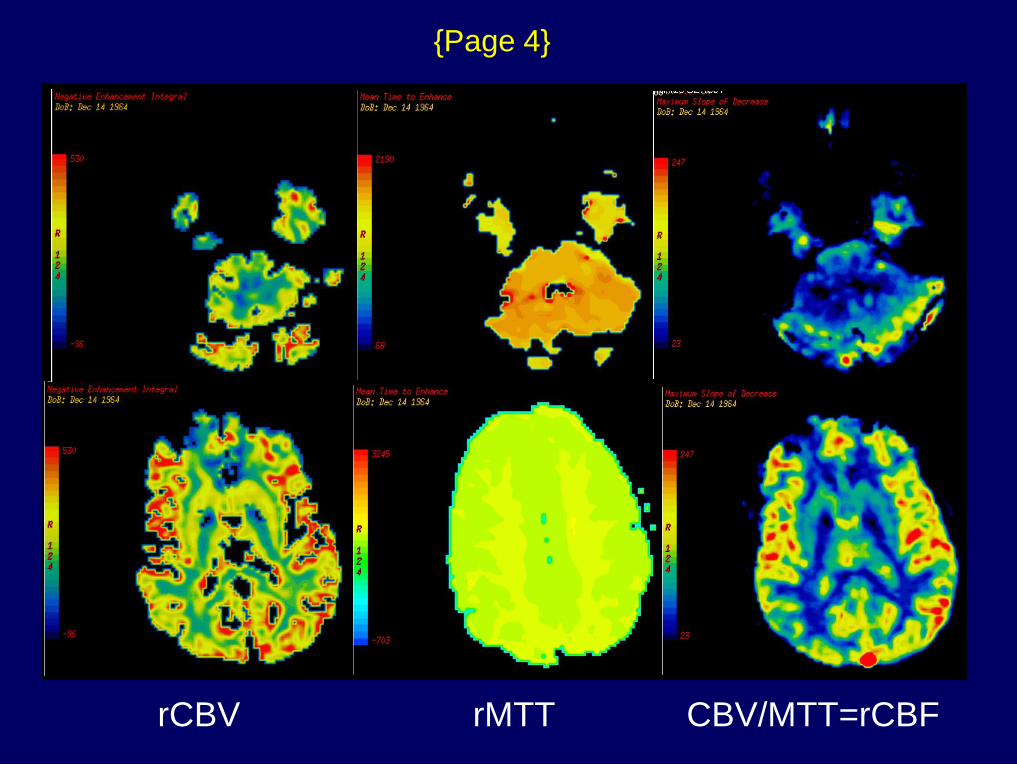
rCBV rMTT CBV/MTT=rCBF
{Page 4}
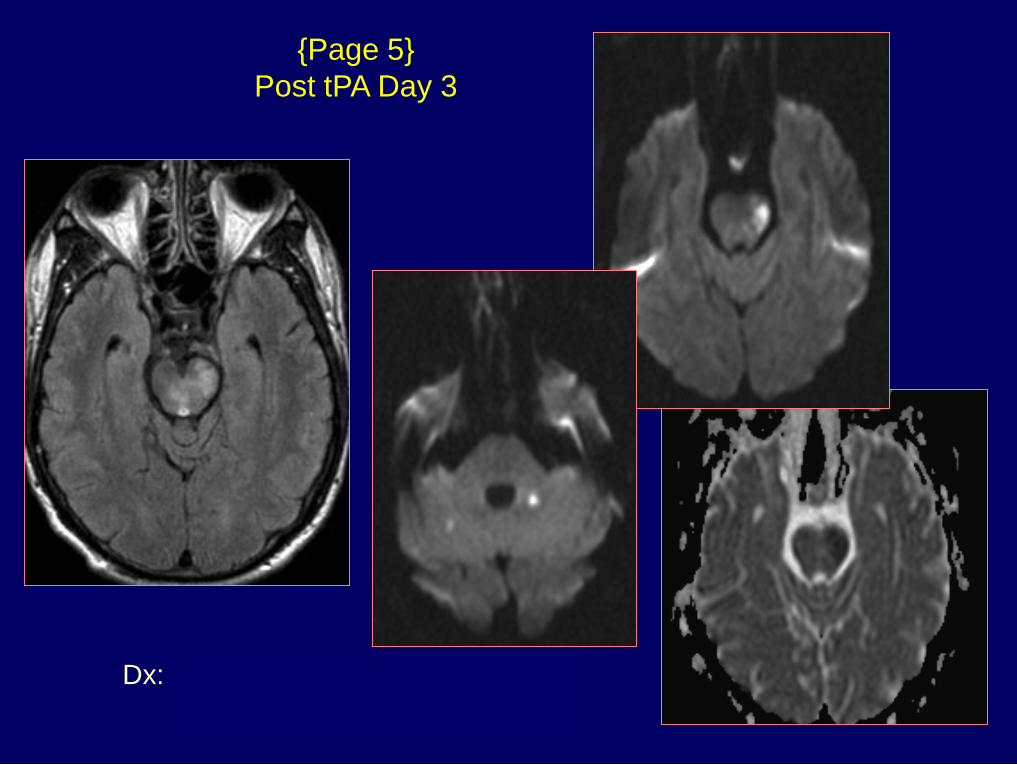
Dx: Basilar thrombosis &
posterior fossa ischemia
{Page 5}
Post tPA Day 3
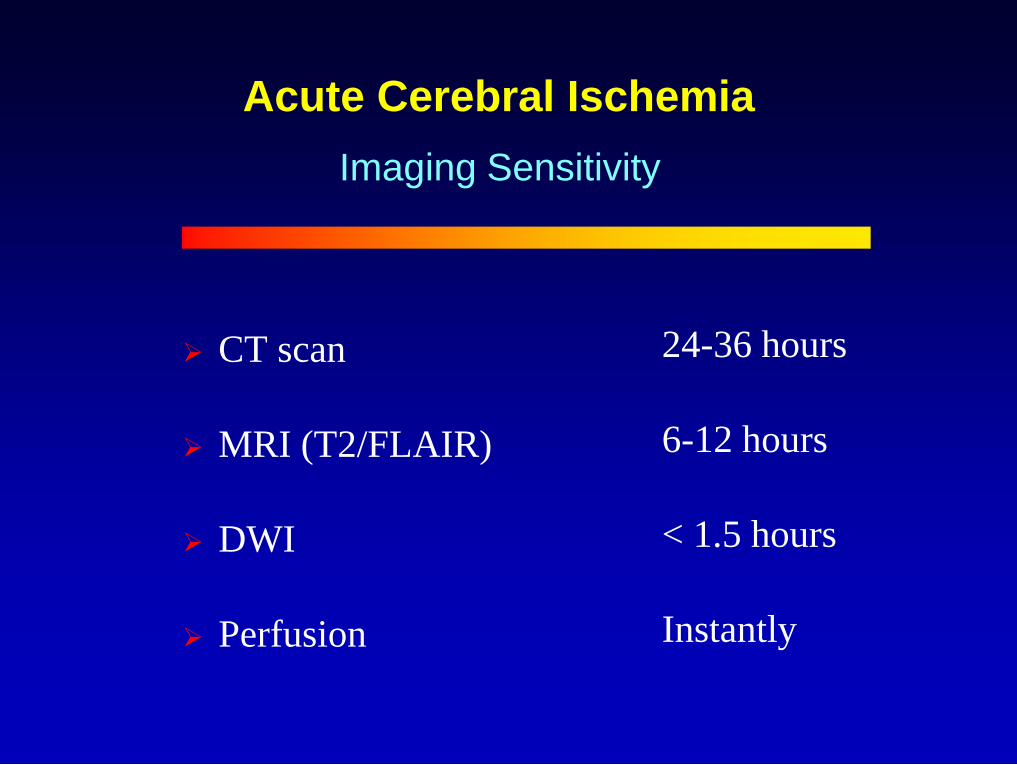
Acute Cerebral Ischemia
CT scan
MRI (T2/FLAIR)
DWI
Perfusion
Imaging Sensitivity
24-36 hours
6-12 hours
< 1.5 hours
Instantly
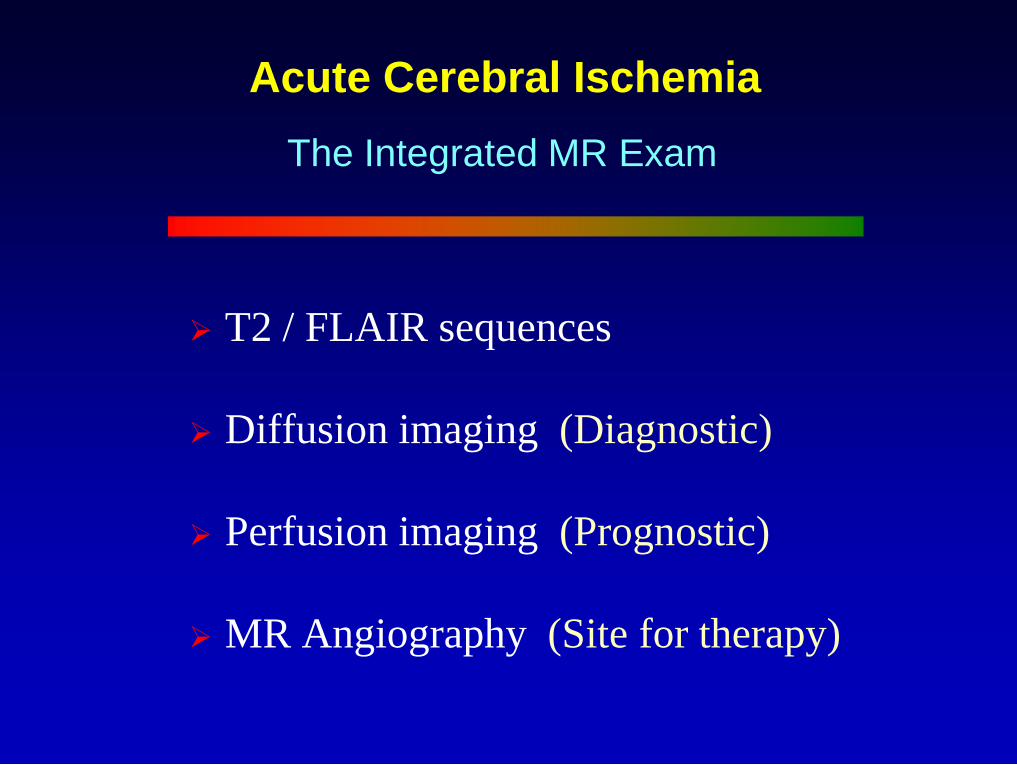
Acute Cerebral Ischemia
T2 / FLAIR sequences
Diffusion imaging (Diagnostic)
Perfusion imaging (Prognostic)
MR Angiography (Site for therapy)
The Integrated MR Exam
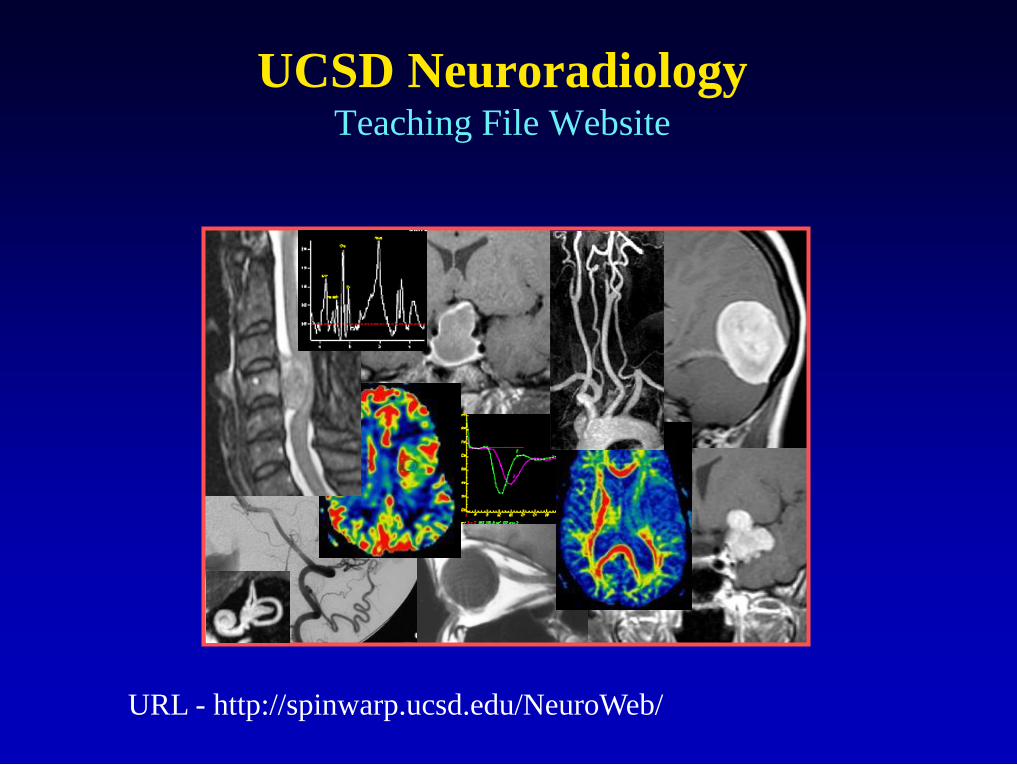
UCSD Neuroradiology Teaching File Website
URL - http://spinwarp.ucsd.edu/NeuroWeb/
Related Documents


