PRE PRINT IEEE TRANSACTIONS ON LEARNING TECHNOLOGIES, VOL. XX, NO. X, XX 2016 1 Widget, widget on the wall, am I performing well at all? Maren Scheffel, Hendrik Drachsler, Joop de Kraker, Karel Kreijns, Aad Slootmaker, Marcus Specht Abstract—In collaborative learning environments, students work together on assignments in virtual teams and depend on each other’s contribution to achieve their learning objectives. The online learning environment, however, may not only facilitate but also hamper group communication, coordination and collaboration. Group awareness widgets that visualise information about the different group members based on information collected from the individuals can foster awareness and reflection processes within the group. In this paper, we present a formative data study about the predictive power of several indicators of an awareness widget based on automatically logged user data from an online learning environment. In order to test whether the information visualised by the widget is in line with the study outcomes, we instantiated the widget indicators with data from four previous runs of the European Virtual Seminar on Sustainable Development (EVS). We analysed whether the tutor gradings in these previous years correlated with the students’ scores calculated for the widget indicators. Furthermore, we tested the predictive power of the widget indicators at various points in time with respect to the final grades of the students. The results of our analysis show that the grades and widget indicator scores are significantly and positively correlated, which provides a useful empirical basis for the development of guidelines for students and tutors on how to interpret the widget’s visualisations in live runs. Index Terms—learning analytics, visualisation, group awareness, correlation analysis, regression analysis. ✦ 1 I NTRODUCTION A LREADY from the early days of online education and e-learning, collaborative learning has been one of the prominent pedagogical approaches. Synchronous and asyn- chronous communication technologies are employed to en- able collaborative learning in small, virtual teams of stu- dents. However, mediating all communication, coordination and collaboration through online tools appears to result in suboptimal support of, in particular, the social interaction and the group dynamics among team members [1]. This can lower feelings of social presence [2] and can hamper cogni- tive processes. One solution is to provide group awareness to students as this might alleviate the problems encountered [3], i.e. to provide explicit information on the activity of group members and to stimulate awareness, reflection and social interaction. Very often, this information is based on data collected via questionnaires or similar forms filled in by the group members themselves [4] which can be time consuming, tedious and disruptive. This process, however, can be automated by including learning analytics based on interaction data automatically collected within the learning environment. While measurements based on behavioural data are not a one-to-one replacement for measurements based on subjective experience, i.e. proximal variables have indeed more predictive power than distal variables [5], learning analytics based on activity data can be used as an additional indication towards group activities that is non- M. Scheffel, H. Drachsler, J. de Kraker, K. Kreijns, A.Slootmaker and M. Specht are with the Open University of the Nether- lands, Valkenburgerweg 177, 6419 AT Heerlen, The Netherlands. E- mail: [email protected], [email protected], [email protected], [email protected], [email protected], [email protected]. H. Drachsler is also with the University of Applied Sciences Zuyd, Nieuw Eyckholt 300, 6419 AT Heerlen, The Netherlands. Email: hen- [email protected]. Manuscript received xx xx, 2016; revised xx xx, 2016. disruptive and covers the whole student population of a course. Learning analytics (LA) is ”the measurement, collection, analysis and reporting of data about learners and their contexts, for purposes of understanding and optimising learning and the environments in which it occurs” as de- fined in the call for papers of the first international confer- ence on learning analytics and knowledge (LAK) 2011 1 and subsequently taken up by [6]. The field has been growing steadily over the last few years as can be seen by the rising numbers of publications as well as events dedicated to learning analytics [7]. While the term learning analytics may evoke an im- pression of a field mainly geared towards computing and analysing the collected data to improve outcome, it is indeed about more than that, i.e. a holistic view on the different processes involved in the support and improvement of learning and teaching [8]. The generic framework for learn- ing analytics [9] also shows that the variety of issues in this field is quite diverse, i.e. it covers aspects from stakeholders, objectives, data and technologies to competences and con- straints. It is thus important to not simply reduce learning analytics to plain ’number crunching’ on an institutional level but to purposefully support the immediately involved stakeholders, i.e. teachers and learners. As Ferguson [10] explains, learning analytics offers ”ways for learners to improve and develop while a course is in progress. These analytics do not focus on things that are easy to measure. Instead, they support the development of crucial skills: reflection, collaboration, linking ideas and writing clearly”. A learning analytics widget can provide feedback by visualising the learners’ activities within a learning envi- 1. https://tekri.athabascau.ca/analytics/call-papers

Welcome message from author
This document is posted to help you gain knowledge. Please leave a comment to let me know what you think about it! Share it to your friends and learn new things together.
Transcript

PRE PRIN
T
IEEE TRANSACTIONS ON LEARNING TECHNOLOGIES, VOL. XX, NO. X, XX 2016 1
Widget, widget on the wall,am I performing well at all?
Maren Scheffel, Hendrik Drachsler, Joop de Kraker, Karel Kreijns, Aad Slootmaker, Marcus Specht
Abstract—In collaborative learning environments, students work together on assignments in virtual teams and depend on each other’scontribution to achieve their learning objectives. The online learning environment, however, may not only facilitate but also hampergroup communication, coordination and collaboration. Group awareness widgets that visualise information about the different groupmembers based on information collected from the individuals can foster awareness and reflection processes within the group. In thispaper, we present a formative data study about the predictive power of several indicators of an awareness widget based onautomatically logged user data from an online learning environment. In order to test whether the information visualised by the widget isin line with the study outcomes, we instantiated the widget indicators with data from four previous runs of the European Virtual Seminaron Sustainable Development (EVS). We analysed whether the tutor gradings in these previous years correlated with the students’scores calculated for the widget indicators. Furthermore, we tested the predictive power of the widget indicators at various points intime with respect to the final grades of the students. The results of our analysis show that the grades and widget indicator scores aresignificantly and positively correlated, which provides a useful empirical basis for the development of guidelines for students and tutorson how to interpret the widget’s visualisations in live runs.
Index Terms—learning analytics, visualisation, group awareness, correlation analysis, regression analysis.
F
1 INTRODUCTION
A LREADY from the early days of online education ande-learning, collaborative learning has been one of the
prominent pedagogical approaches. Synchronous and asyn-chronous communication technologies are employed to en-able collaborative learning in small, virtual teams of stu-dents. However, mediating all communication, coordinationand collaboration through online tools appears to result insuboptimal support of, in particular, the social interactionand the group dynamics among team members [1]. This canlower feelings of social presence [2] and can hamper cogni-tive processes. One solution is to provide group awarenessto students as this might alleviate the problems encountered[3], i.e. to provide explicit information on the activity ofgroup members and to stimulate awareness, reflection andsocial interaction. Very often, this information is based ondata collected via questionnaires or similar forms filled inby the group members themselves [4] which can be timeconsuming, tedious and disruptive. This process, however,can be automated by including learning analytics based oninteraction data automatically collected within the learningenvironment. While measurements based on behaviouraldata are not a one-to-one replacement for measurementsbased on subjective experience, i.e. proximal variables haveindeed more predictive power than distal variables [5],learning analytics based on activity data can be used as anadditional indication towards group activities that is non-
M. Scheffel, H. Drachsler, J. de Kraker, K. Kreijns, A.Slootmakerand M. Specht are with the Open University of the Nether-lands, Valkenburgerweg 177, 6419 AT Heerlen, The Netherlands. E-mail: [email protected], [email protected], [email protected],[email protected], [email protected], [email protected]. Drachsler is also with the University of Applied Sciences Zuyd,Nieuw Eyckholt 300, 6419 AT Heerlen, The Netherlands. Email: [email protected] received xx xx, 2016; revised xx xx, 2016.
disruptive and covers the whole student population of acourse.
Learning analytics (LA) is ”the measurement, collection,analysis and reporting of data about learners and theircontexts, for purposes of understanding and optimisinglearning and the environments in which it occurs” as de-fined in the call for papers of the first international confer-ence on learning analytics and knowledge (LAK) 20111 andsubsequently taken up by [6]. The field has been growingsteadily over the last few years as can be seen by the risingnumbers of publications as well as events dedicated tolearning analytics [7].
While the term learning analytics may evoke an im-pression of a field mainly geared towards computing andanalysing the collected data to improve outcome, it is indeedabout more than that, i.e. a holistic view on the differentprocesses involved in the support and improvement oflearning and teaching [8]. The generic framework for learn-ing analytics [9] also shows that the variety of issues in thisfield is quite diverse, i.e. it covers aspects from stakeholders,objectives, data and technologies to competences and con-straints. It is thus important to not simply reduce learninganalytics to plain ’number crunching’ on an institutionallevel but to purposefully support the immediately involvedstakeholders, i.e. teachers and learners. As Ferguson [10]explains, learning analytics offers ”ways for learners toimprove and develop while a course is in progress. Theseanalytics do not focus on things that are easy to measure.Instead, they support the development of crucial skills:reflection, collaboration, linking ideas and writing clearly”.
A learning analytics widget can provide feedback byvisualising the learners’ activities within a learning envi-
1. https://tekri.athabascau.ca/analytics/call-papers

PRE PRIN
T
IEEE TRANSACTIONS ON LEARNING TECHNOLOGIES, VOL. XX, NO. X, XX 2016 2
ronment and can thus support awareness and reflectionprocesses. It allows learners as well as teachers to see thelearners’ current situation and to adapt their behaviour, e.g.learners could decide to participate more while teacherscould decide to get in touch with a specific student. Beingable to not only project an immediate future status but toalso relate the visualised information to a learner’s overalloutcome of the course could increase the usefulness of sucha widget especially with regards to self-regulation as well ascollaborative learning.
1.1 Related WorkThis section reviews related research about the purpose andimpact of learning analytics widgets and dashboards aswell as research about the predictive power of students’behaviour during a course. The literature presented canroughly be divided into two sections: the theoretical per-spective and the practical perspective.
On the theoretical side there are the two crucial aspectsof ’awareness’ and ’reflection’ that need to be taken intoaccount when dealing with learning analytics dashboardsand widgets. The reflection on presented analytics results isnot possible without awareness which in turn depends onsome form of feedback to the user [11], [12]. According toEndsley [13], [14] being aware of one’s own situation is athree level process and a prerequisite for making decisionsand effectively performing tasks: the perception of elementsin the current situation is followed by the comprehensionof the current situation which then leads to the projectionof a future status. Once a learner is aware of his situa-tion, he ”reflects on the phenomenon before him, and onthe prior understandings which have been implicit in hisbehaviour” [15] to then engage in a process of continuouslearning. Reflection can promote insight about somethingthat previously went unnoticed [16] and lead to a change inlearning or teaching behaviour. Verbert et al. [17] emphasisethe importance of these aspects in their process model forlearning analytics applications: it consist of the four stagesawareness, reflection, sensemaking, and impact.
Awareness, however, is not the only aspect that influ-ences the process of feedback, reflection and behaviouralchange, i.e. of self-efficacy and self-directed learning [18].Winne [19] describes self-regulated learning as ”principallycomprised of knowledge, beliefs, and learned skills, [...]malleable in response to environmental influences” and assomething that learners inherently do. Zimmerman [20]adds to this that self-regulated learning is indeed aboutmore than knowledge and skill and that personal influencessuch as emotions, one’s behaviour and one’s social environ-ment play an important role. Learners thus have differentways to construct knowledge on the basis of the informationgiven to them when learning in a self-regulated way [21]and can act and react in different ways.
On the practical side there have been various studiesabout the positive or negative effect of different behaviourduring a course on study outcomes. For face-to-face classesin college, for example, Crede et al. [22] have shown ina meta-analytic review that there is a correlation betweenclass attendance and class grades and that class attendanceis a better predictor than other known predictors of perfor-mance. Bennett and Yalams [23] also report that attendance
and participation in class are positively and significantlyrelated with performance, with attendance achieving betterresults than participation. Whether class attendance can bean indicative predictor for student performance was alsotested and confirmed in a study by Stewart et al. [24]. Inan undergraduate statistics course Latif and Miles [25] alsoexplored the impact of class attendance on course outcomesand found that the impact was a significant and positiveone after controlling for factors related to ability and ef-fort. Louis et al. [26] also conducted studies to investigatewhether class attendance in face-to-face classes is signifi-cantly and positively related to the students’ performanceand found that in undergraduate psychology courses thiswas indeed the case. Thus, being present in a course can beseen as an important predictor for study success.
What has been confirmed in face-to-face classes has alsobeen observed in online and distance education as shown byKorkofingas and Macri [27]. The researchers revealed thatthe more time students spent online and are ’present’ on thecourse’s website the better their assessed performance was.Macfadyen and Dawson [28] on the other hand found thattime online only weakly correlated with course outcomeswhile the contribution to discussion forums received signif-icant results. While the recent findings of Strang [29] suggestthat course logins are significant in predicting student onlinelearning outcomes, Tempelaar et al. [30] on the other handinvestigated the predictive power of learning dispositions,formative assessment results and log data, and showed thatcomputer-supported formative assessment during a coursewas a better predictor than the collected LMS data. Theeffects of different types of behaviour and activities in onlineclasses are thus still under discussion and are most likelystrongly context-dependent.
As part of this discussion about effectiveness and con-textuality there are some recent studies that try to gofurther and investigate the impact of learning analyticsdashboards on aspects such as motivation and individualgoal attainment of learners. Lonn et al. [31] investigatedthe effect of a learning analytics dashboard on the mo-tivation of students that are in danger of failing. Theirfindings show that student goal perceptions and formativeperformance results need to be carefully considered in theapplication of learning analytics dashboards as the resultscan significantly affect the interpretation of the students’own academic chances. Beheshitha et al. [32] also focused oninvestigating the effect of visualisations on different factorsof learning. They showed that depending on the data usedfor the visualisations, positive as well as negative resultscan be found for the impact of visualisations on the learningprogress and suggest a structured methodology for thosetypes of studies. Khan and Pardo [33] also identified theneed to present different kinds of dashboards and widgetsdepending on the information needs of the learners as wellas the learning activity to make them effective.
All three studies thus emphasise the need to carefullyembed dashboards into instructional designs and to try totake the learners’ personal preferences into account. A goodlearning analytics system thus seems to need either goodmoderation or different analytics visualisations dependingon the learners’ different goals and performances to increasetheir motivation.

PRE PRIN
T
IEEE TRANSACTIONS ON LEARNING TECHNOLOGIES, VOL. XX, NO. X, XX 2016 3
1.2 Our Approach
Taking all this into account, we have designed a widgetbased on learning analytics within the learning environmentof the European Virtual Seminar on Sustainable Develop-ment (EVS), a joint course of about ten European univer-sities that is coordinated by the Open University of theNetherlands. The widget provides several types of feedbackbased on data automatically collected in the EVS platform,visualised in radar charts and bar charts. Its aim is to makestudents aware of their own platform activity relative to thatof the group and of differences in activity between the groupmembers. The widget also aims at fostering reflection abouthow their behaviour influences the their future status, i.e. inrelation to their position within the group and in relation totheir course outcome.
To achieve these goals, however, and before offering thelearning analytics widget in a live run of the course, wereport in this article the results of a formative data studymeasuring whether the widget indicators validly reflect theindividual students’ grades given by the tutors, i.e. thepurpose of this study is to find out whether and if so howthe different widget indicators relate to the grades given bythe tutors. Thus, before deploying the widget in a live run ofthe course, we tested whether the information visualised inthe widget is indeed valid and reliable in terms of outcomereflection and how it can be interpreted. We thus wantedto know: How do the widget indicators correlate with the tutorgradings and can they validly reflect them? To answer this ques-tion, we computed the widget indicator scores with datafrom four previous runs of EVS and analysed how the tutorgradings of individual students in those years correlatedwith the scores generated for the widget indicators withthe aim to establish the reflective, i.e. predictive, validityof the widget indicator scores for the students’ grades. Theanalysis was done for the whole run of the course as well asfor individual months in order to obtain results for differentlevels of granularity and for different points in time.
We analysed the data with the following research ques-tions in mind:
(RQ1) Do the widget indicator scores correlate with thetutor gradings of individual students?
(RQ2) Are the scores of some widget indicators betterpredictors for the students’ individual gradesthan others?
(RQ3) Do certain points in time produce indicatorscores that are better grade predictors than oth-ers?
Based on these questions the following hypotheses werethus tested in the experiment:
(H1) There is a significant positive correlation be-tween tutor gradings of individual students andthe widget indicator scores.
(H2) The scores of the widget indicator ’presence’are better predictors for the students’ individ-ual grades than those of the widget indicators’initiative’ and ’responsiveness’.
(H3) The widget indicator scores produced in thesecond half of the course are better predictorsthan those of the first half.
The next section describes the course as well as thewidget in more detail and elaborates on our method ofa two-step analysis, i.e. correlation analysis to uncoverpotential relationships between tutor grades and widgetindicator scores followed by structural equation modellingto determine the strength of the relationships as well asthe fit on the data. After the presentation of the analysisresults, the discussion section sets the results in relation tothe hypotheses and addresses some limitations of our study.The final section concludes the article.
2 METHOD
2.1 Participants and Materials
2.1.1 The EVS Course
The European Virtual Seminar on Sustainable Development(EVS)2 is a joint, web-based Master-level course offered bya partnership of about ten universities (regular as well asdistance) from across Europe. The aim of EVS is to fostercompetences for sustainable development through collab-orative learning in virtual, international, multidisciplinarystudent teams. Here, we provide a brief description of thecharacteristics of EVS, relevant to the study presented in thisarticle. An extensive description of EVS is provided in [34].
Each year, EVS runs from 1 November till 1 April of thenext year. During these five months, students from differentcountries and disciplines work together in teams of fourto seven persons on sustainability issues, such as wastemanagement, nature conservation, and climate adaptation.The students from the regular universities are usually be-tween 20 and 25 years of age while the students from thedistance universities are usually between 30 and 50 yearsold. Each run, there are about nine teams in EVS, working ondifferent topics. Coached by a tutor and guided by an issueexpert, the teams conduct a small-scale research project,mostly using secondary data that can be accessed throughthe internet.
The final grade of the students consists of a combinationof grades for several aspects of the course. 50% of the finalgrade is based on the grade for the quality of the researchreport a team produces, assessed by the expert; 20% of thefinal grade is based on the grade for the quality of the groupcollaboration process, assessed by the tutor; and 30% of thefinal grade is based on a grade for the individual student’scontribution to this collaboration process, also assessed bythe tutor. The individual student’s contribution grade, i.e.the ’individual-overall’ grade (T4 in Table 1) is determinedby taking the average of the three sub-grades ’T1 planning& progress’, ’T2 contribution to team’, and ’T3 support’.Each of them covers a range of aspects in the students’contributions (see Table 1).
The grades for the report and for the group collaborationprocess are strongly correlated, and the more team membershave low grades for their individual contribution, the lowerthe grade for the group collaboration will be [34]. A highlevel of participation of individual team members is thusimportant for a good collaboration process in the team,which in turn translates in high-quality group products.
2. http://www.ou.nl/evs

PRE PRIN
T
IEEE TRANSACTIONS ON LEARNING TECHNOLOGIES, VOL. XX, NO. X, XX 2016 4
TABLE 1Aspects of the individual grades (tutor-based) for students within EVS
grade aspects covered by grade
T1 planning & progress
planning a realistic own workloaddealing with deadlines and agreementsflexibility in making appointments/agreements/planningability to change roles and responsibilities
T2 contribution to teamdealing with feedback from the grouptaking initiative, helping the group to progressproductivity and quality of contributions
T3 supportbeing supportive (offering support and help others)encourage the learning of the other membersgiving feedback / reviewing contributions of others
T4 individual-overall overall grade (average of the three sub-grades)
In our experience, a common cause of poor group per-formance in EVS are large differences in individual con-tribution between the team members, which often resultsin gradual demotivation of the more active students oran increasing frequency of open conflicts. Visualisation ofindividual students’ activity could thus help to detect andopenly discuss such differences at an early stage, whichmay prevent conflicts and have a positive effect on teamperformance and group atmosphere.
The Elgg-based platform3 used by EVS since 2011 au-tomatically collects and generates data on student activity,which can be used to feed a learning analytics widget thatgives the students visual feedback on their own activityand how this compares to their team members and teamaverage. The next section provides a description of ourwidget.
2.1.2 The Widget
While this section describes the widget we developed andits indicators and functionalities, it is important to empha-sise that for the current study we did not test the widget
3. Elgg is a leading open source social networking engine, see:https://elgg.org/
Fig. 1. Cumulative view of the widget.
TABLE 2Calculation of the five widget indicator scores
widget indicator calculation of the widget indicator scores
W1 initiative # of posts (discussion, blog, files, pages)W2 responsiveness # of comments to posts (discussion, blog, files, pages)W3 presence # of page views (on EVS platform)W4 connectedness # of contacts madeW5 productivity (W1 initiative + W2 responsiveness) / W3 presence
with real users in a live run, but rather tested the reflec-tive and thus predictive validity of the widget indicators(see Table 2) with data gathered in previous course runs.Nevertheless, it is important to present the widget andits functionalities here to provide the reader with the ideabehind the developed tool and how it can be applied.
The widget, available for download under GNU GPLversion 2 [35], can be embedded within an Elgg environ-ment as a plugin to make students aware of and reflect ontheir activity level within the environment relative to othergroup members and the group average. The widget containsinformation about the users’ platform activities with twosubsections, i.e. the cumulative view and the periodic view.
Platform activity is expressed in five widget indicators:’W1 initiative’, ’W2 responsiveness’, ’W3 presence’, ’W4connectedness’, and ’W5 productivity’. The widget indica-tor scores are automatically calculated from activity datarecorded by the EVS platform (see Table 2). The students’activity is visualised in a radar chart, with five axes for thefive widget indicators. When hovering with the mouse overthe labels of the axes, the definition of the widget indicator isdisplayed. When pointing with the cursor at the dots in thechart, the corresponding widget indicator score is displayed.
The ’Cumulative activity’ radar chart (see Figure 1)presents the widget indicator scores for the whole run ofEVS, i.e. from the beginning of the course until the currentdate. In this and all other charts, orange is used for auser’s own scores (’Me’), and blue for the group average(’Group’). The scores in the radar chart are scaled from 0 to10. For each widget indicator, the group member with thehighest activity gets a score of 10 and the scores of the other
Fig. 2. Periodic view of the widget.

PRE PRIN
T
IEEE TRANSACTIONS ON LEARNING TECHNOLOGIES, VOL. XX, NO. X, XX 2016 5
members are scaled accordingly. The colour coding alsoapplies to the ’My activity’ bar chart. The orange bar showsa user’s average activity, i.e. average of the widget indicators’W1 initiative’, ’W2 responsiveness’, ’W3 presence’ and ’W4connectedness’, compared to the average of the entire group(blue bar). The ’Periodic activity’ radar chart presents thewidget indicator scores per month (see Figure 2). Users canchoose the specific month with a slider below the chart.
In order to facilitate group performance by enabling co-and self-regulation processes, the widget indicator scoresof the individual members of a group are visualised. Asexplained by Drachsler and Greller [36] in their article aboutprivacy and ethics in learning analytics, this information canbe classified as ’privacy sensitive’ information that needsto be handled according to the DELICATE checklist as notall students of a group might agree to share this ’privacy-sensitive’ information within the group. To deal with theseprivacy and ethical issues, the process suggested by theDELICATE checklist was followed. When the widget willbe used in a live run of an EVS course, a widget manualexplaining the intentions behind the learning analytics wid-get, making clear what data is being collected, how it ispresented in the widget, and what students can do to protecttheir privacy will be provided to all EVS users.
Catering to this last point, a Reciprocal Privacy Model(RPM) is implemented into the widget. The RPM enablesstudents to decide how they would like to share theiractivity data. A target student can only see the individualperformance of other students in his team if he also agreesto share his own data with the rest of the team. If a studentdisagrees with sharing his data, he will only see his ownperformance in comparison to the group average value inthe radar chart of the widget. When he agrees to sharing hisown activity data, he will also see the data shared by othermembers of the team. The RPM model is a very innovativeapproach that empowers the students to decide with whomand on which level they want to share their data.
2.2 ProcedureAs explained, data from the previous four runs of EVS wereused in order to obtain those years’ widget indicator scoresfor widget indicators ’W1 initiative’, ’W2 responsiveness’and ’W3 presence’4. The widget indicator scores for ’W4connectedness’ and ’W5 productivity’ were not included inthe analysis. ’W4 connectedness” was excluded as it turnedout that the number of contacts students made (similar to’friending’ in informal social networks) varied strongly andirregularly between EVS runs and teams within the samerun. The course manual advised students to make otherstudents contacts, in particular their team members, as thisallows them to receive notifications about their platformactivities. However, it seems that the number of contactsstudents in EVS made primarily depended on whetheror not the tutor of a group emphasised the need of thisfeature, rather than the internal motivation of the students toimprove communication. ’W5 productivity’ was excluded asit represents a combination of three other widget indicatorsand is thus not an independent variable. Gender, age and
4. Unfortunately, the ’W3 presence’ scores for the EVS run of 2011-2012 were not available.
nationality of the students were not taken into account inthe analysis. Table 3 shows the descriptive statistics of thethree widget indicators for all years pooled for all monthscombined as well as all individual months.
In a first step, the scores of the three widget indicators(W1, W2, W3) for the four runs were correlated with thestudents’ four individual grades (T1, T2, T3, T4) as given bytheir tutors. As the data from the widget indicators consist ofcount variables and thus have a Poisson distribution, Spear-man’s rank correlation was used, i.e. all widget scores aswell as all grades were ranked with 1 being assigned to thehighest ranking scores and grades and ties being assignedan average rank. Due to the ranking, differences in gradingstyle between tutors as well as differences in units and scaleswere thus corrected for. Spearman’s rank correlation coeffi-cient was calculated to determine the strength of associationbetween ranked grades and widget indicator scores as wellas the significance level. The correlation coefficients werecalculated for all runs pooled for the entire length of a runand for individual months.
In order to not only learn something about the strengthof association but also about predictive relations betweenwidget indicator scores and grades, more advanced statis-tical analysis on the data is necessary. For analyses suchas structural equation modelling, however, the data needsto be normally distributed. With the data from the widgetindicators having a Poisson distribution, this is thus theoret-ically not possible. However, if the collected count variabledata are nearly normally distributed, i.e. if their mean valueis far enough from 0, such analyses can be done5. As thisis the case for most of the means of the widget indicatordata (see Table 3), we assumed them to be nearly normallydistributed and thus, as the second step of our analysis,also conducted structural equation modelling between thethree widget indicators (W1, W2, W3) and the students’ fourindividual grades (T1, T2, T3, T4) on the basis of an entirerun as well as the individual months for all years pooled.
3 RESULTS
3.1 CorrelationsThe correlation calculations were conducted using IBM’sSPSS Statistics 23. The results of Spearman’s rank correlationfor all runs pooled (see Table 4) show that when studentactivity is measured during the entire length of the courserun, all four tutor-based grades (T1-T4) are significantlyand positively correlated with all widget indicators (W1-W3) except for the T1/W3 combination. For the widgetindicators, the highest correlation coefficients are obtainedfor the indicator ’W2 responsiveness’ and the lowest for the’W3 presence’ indicator.
This holds true for all grades. For the grade ’T1 planning& progress’ the correlation coefficient obtained with the’W2 responsiveness’ indicator is .338, for the grade ’T2contribution to team’ it is .415 and for the grade ’T3 support’it is .414. The ’T2 contribution to team’/’W2 responsiveness’combination is the highest scoring grade-widget indicator
5. The mean should be > 10 to be far enough from 0 ac-cording to https://www.umass.edu/wsp/resources/poisson/ andhttps://www.umass.edu/wsp/resources/poisson/poisson1.html andhttps://www.umass.edu/wsp/resources/poisson/poisson2.html.

PRE PRIN
T
IEEE TRANSACTIONS ON LEARNING TECHNOLOGIES, VOL. XX, NO. X, XX 2016 6
TABLE 3Descriptive statistics of the widget indicators ’W1 initiative’, ’W2 responsiveness’ and ’W3 presence’: all runs pooled, activity measured over the
entire length of a run as well as activity measured per month.
N Range Min Max Mean Std. Dev. Variance Skewness KurtosisStat. Stat. Stat. Stat. Stat. Std. Err. Stat. Stat. Stat. Std. Err. Stat. Std. Err.
W1 all months 172 124 0 124 17,30 1.323 17.346 300.888 3.182 .185 15.507 .368W2 all months 172 217 6 223 59.86 2.800 36.721 1348.448 1.414 .185 2.543 .368W3 all months 134 5239 240 5479 1291.88 85.539 990.186 980468.452 2.109 .209 4.780 .416
W1 month1 172 40 0 40 3.53 .393 5.151 26.531 3.513 .185 17.521 .368W2 month1 172 89 1 90 17.00 .922 12.097 146.327 2.328 .185 8.898 .368W3 month1 134 2409 35 2444 378.13 30.597 354.187 125448.583 2.967 .209 11.496 .416
W1 month2 172 74 0 74 3.44 .506 6.637 44.049 7.496 .185 75.248 .368W2 month2 172 54 0 54 11.30 .648 8.500 72.245 1.672 .185 4.064 .368W3 month2 134 1392 21 1413 227.98 18.692 216.371 46816.443 2.514 .209 8.909 .416
W1 month3 172 15 0 15 2.03 .196 2.574 6.625 2.118 .185 5.776 .368W2 month3 172 37 0 37 7.93 .469 6.153 37.855 1.750 .185 4.819 .368W3 month3 134 1093 6 1099 177.86 13.640 157.898 24931.671 2.411 .209 9.298 .416
W1 month4 168 60 0 60 3.82 .450 5.833 34.028 5.825 .187 51.470 .373W2 month4 172 50 0 50 11.20 .775 10.169 103.399 1.668 .185 2.696 .368W3 month4 134 1294 6 1300 243.81 21.002 243.113 59103.777 2.364 .209 6.251 .416
W1 month5 172 38 0 38 4.56 .372 4.875 23.769 2.478 .185 12.034 .368W2 month5 166 58 0 58 12.89 .841 10.841 117.520 1.654 .188 3.561 .375W3 month5 134 1216 18 1234 264.10 20.734 240.019 57609.186 1.919 .209 4.195 .416
TABLE 4Spearman correlation coefficients of the association between individual
grades (tutor-based) and widget indicator scores (widget-based): allruns pooled, activity measured over the entire length of a run.
W1 W2 W3initiative
responsiveness
presence
T1 planning&progress
Corr Coeff .267** .338** .084N 172 172 134
T2 contributionto team
Corr Coeff .316** .415** .192*N 172 172 134
T3 support Corr Coeff .299** .414** .216*N 172 172 134
T4 individualoverall
Corr Coeff .313** .414** .182*N 172 172 134
**. significant at the 0.01 level (2-tailed).*. significant at the 0.05 level (2-tailed).
combination but with a correlation coefficient of .415 the ’T3support’/’W2 responsiveness’ combination as well as the’T4 individual-overall’/’W2 responsiveness’ combinationsare almost as high.
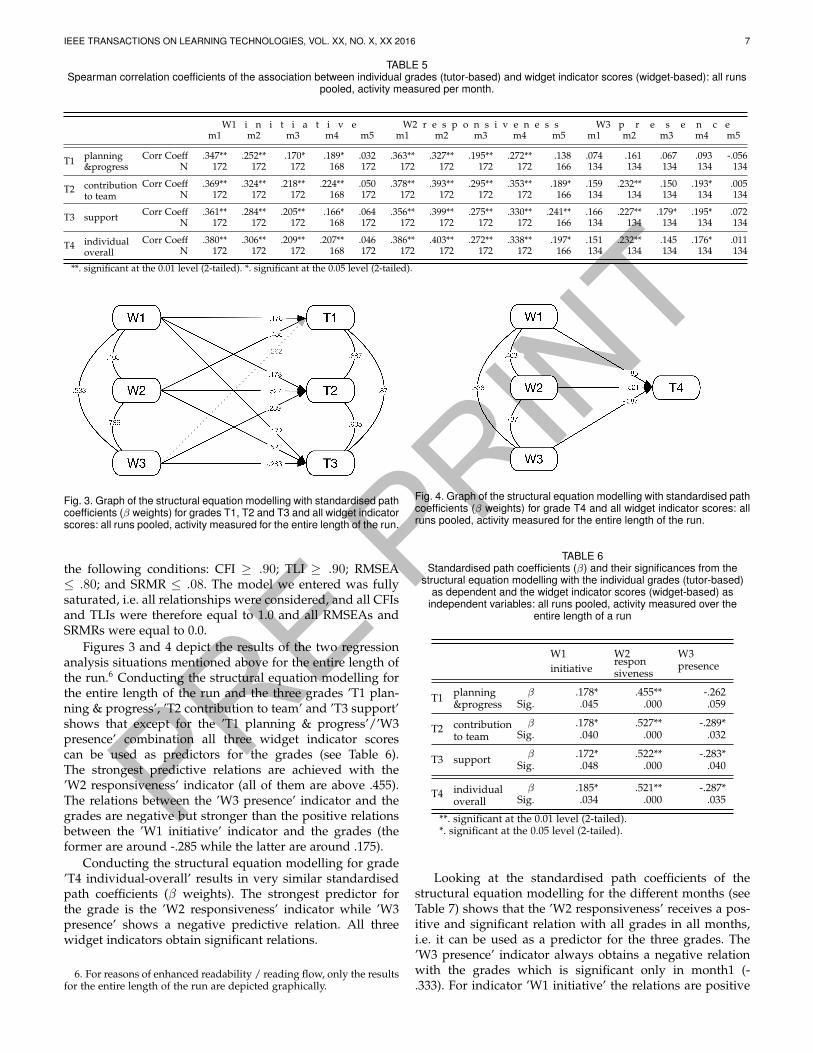
When the Spearman rank correlation coefficients for allruns pooled are calculated per month instead of over theentire length of a run, there are again many grade-widgetindicator combinations that are significantly positively cor-related (see Table 5). All four grades correlate best withthe ’W2 responsiveness’ indicator in month1 or month2(i.e. November and December). The ’W3 presence’ indi-cator, again, has the lowest correlation coefficients. Whilethe coefficients for the ’W2 responsiveness’ indicator arealmost all highest in month2, the ’W1 initiative’ indicatorhas the highest correlation coefficients in month1. The ’W3presence’ indicator only has a few significant correlations.
The highest of these are received in month2. The grade ’T1planning & progress’ never significantly correlates with the’W3 presence’ indicator. The lowest correlation coefficientsfor all three widget indicators are obtained in month5 withonly the ’W2 responsiveness’ indicator obtaining significantcorrelations at all. The ’W3 presence’ indicator score ofmonth5 even receives a negative correlation coefficient withthe grade ’T1 planning & progress’, albeit an non-significantone.
Looking at the correlations from the perspective of thedifferent grades, it shows that the ’T1 planning & progress’grade correlates best with the ’W2 responsiveness’ indicatorin month1 (.363), and the ’T2 contribution to team’ gradecorrelates best with the ’W2 responsiveness’ indicator inmonth2 (.393), as do the ’T3 support’ grade and the ’T4individual-overall’ grade (.399 and .403 respectively).
3.2 Structural Equation Modelling
Regression analyses using structural equation modellingwere performed in Mplus 7. The regressions performedpertained to two situations: in the first one the three grades’T1 planning & progress’, ’T2 contribution to team’ and’T3 support’ functioned as the dependent variables, whilein the second one grade ’T4 individual-overall’ was theonly dependent variable. This was done due to T4 being acombination of the other three grades. All calculations weredone with all years pooled for the whole run of the courseas well as for the individual months.
Different fit indices have been calculated for the differentanalyses: the Comparative Fit Index (CFI) [37], [38], theTucker-Lewis Index (TLI), and the Root Mean Squared Errorof Approximation (RMSEA) as well as the StandardisedRoot Mean Square Residual (SRMR) [39]. In order to havea moderate to good model fit these indices should satisfy
PRE PRIN
T
IEEE TRANSACTIONS ON LEARNING TECHNOLOGIES, VOL. XX, NO. X, XX 2016 7
TABLE 5Spearman correlation coefficients of the association between individual grades (tutor-based) and widget indicator scores (widget-based): all runs
pooled, activity measured per month.
W1 i n i t i a t i v e W2 r e s p o n s i v e n e s s W3 p r e s e n c em1 m2 m3 m4 m5 m1 m2 m3 m4 m5 m1 m2 m3 m4 m5
T1 planning&progress
Corr Coeff .347** .252** .170* .189* .032 .363** .327** .195** .272** .138 .074 .161 .067 .093 -.056N 172 172 172 168 172 172 172 172 172 166 134 134 134 134 134
T2 contributionto team
Corr Coeff .369** .324** .218** .224** .050 .378** .393** .295** .353** .189* .159 .232** .150 .193* .005N 172 172 172 168 172 172 172 172 172 166 134 134 134 134 134
T3 support Corr Coeff .361** .284** .205** .166* .064 .356** .399** .275** .330** .241** .166 .227** .179* .195* .072N 172 172 172 168 172 172 172 172 172 166 134 134 134 134 134
T4 individualoverall
Corr Coeff .380** .306** .209** .207** .046 .386** .403** .272** .338** .197* .151 .232** .145 .176* .011N 172 172 172 168 172 172 172 172 172 166 134 134 134 134 134
**. significant at the 0.01 level (2-tailed). *. significant at the 0.05 level (2-tailed).
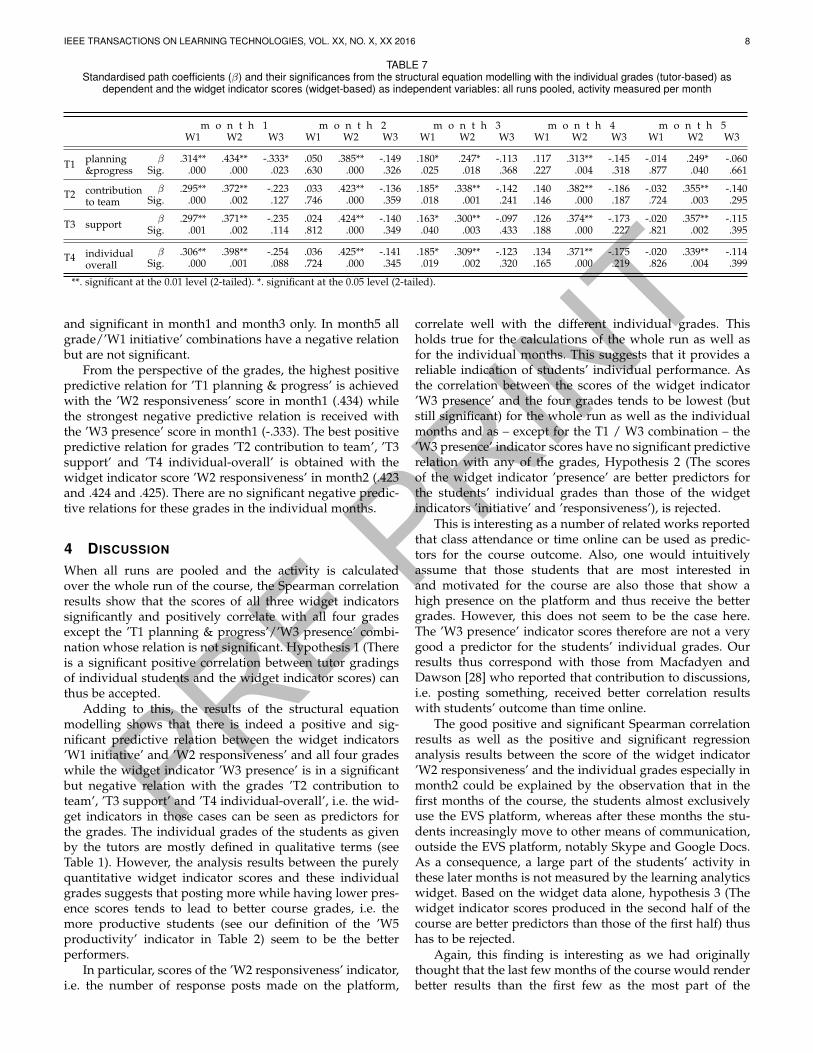
Fig. 3. Graph of the structural equation modelling with standardised pathcoefficients (β weights) for grades T1, T2 and T3 and all widget indicatorscores: all runs pooled, activity measured for the entire length of the run.
the following conditions: CFI ≥ .90; TLI ≥ .90; RMSEA≤ .80; and SRMR ≤ .08. The model we entered was fullysaturated, i.e. all relationships were considered, and all CFIsand TLIs were therefore equal to 1.0 and all RMSEAs andSRMRs were equal to 0.0.
Figures 3 and 4 depict the results of the two regressionanalysis situations mentioned above for the entire length ofthe run.6 Conducting the structural equation modelling forthe entire length of the run and the three grades ’T1 plan-ning & progress’, ’T2 contribution to team’ and ’T3 support’shows that except for the ’T1 planning & progress’/’W3presence’ combination all three widget indicator scorescan be used as predictors for the grades (see Table 6).The strongest predictive relations are achieved with the’W2 responsiveness’ indicator (all of them are above .455).The relations between the ’W3 presence’ indicator and thegrades are negative but stronger than the positive relationsbetween the ’W1 initiative’ indicator and the grades (theformer are around -.285 while the latter are around .175).
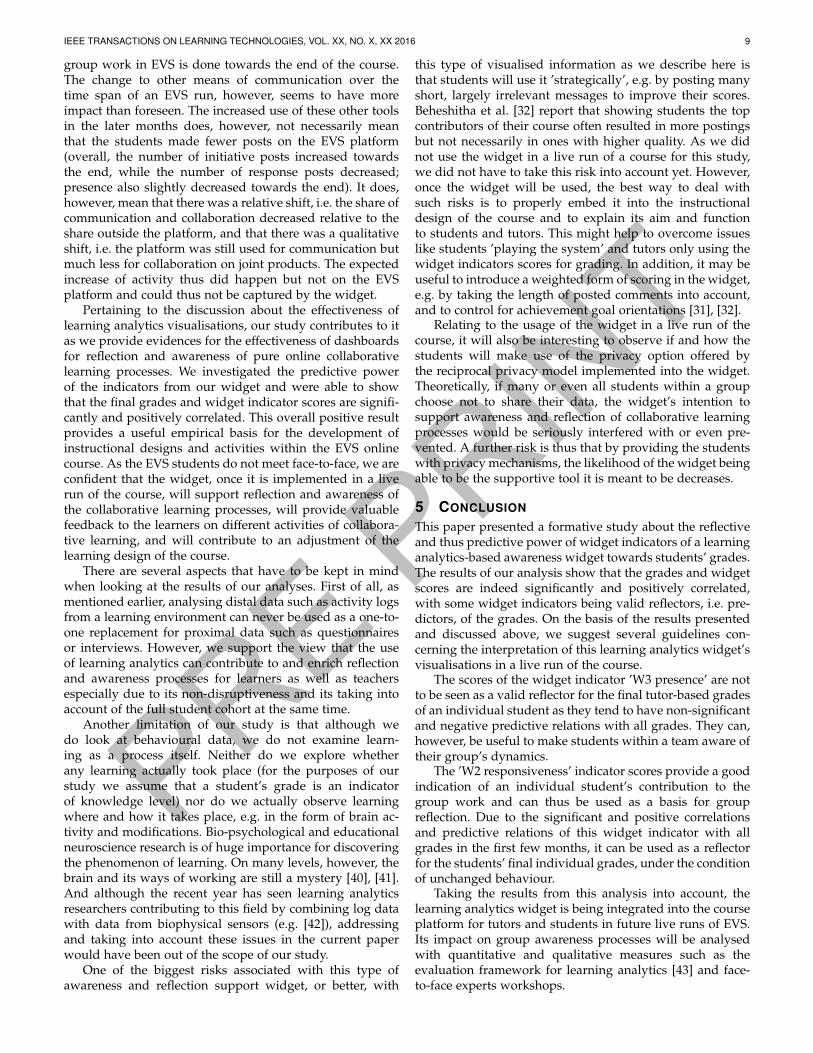
Conducting the structural equation modelling for grade’T4 individual-overall’ results in very similar standardisedpath coefficients (β weights). The strongest predictor forthe grade is the ’W2 responsiveness’ indicator while ’W3presence’ shows a negative predictive relation. All threewidget indicators obtain significant relations.
6. For reasons of enhanced readability / reading flow, only the resultsfor the entire length of the run are depicted graphically.
Fig. 4. Graph of the structural equation modelling with standardised pathcoefficients (β weights) for grade T4 and all widget indicator scores: allruns pooled, activity measured for the entire length of the run.
TABLE 6Standardised path coefficients (β) and their significances from the
structural equation modelling with the individual grades (tutor-based)as dependent and the widget indicator scores (widget-based) as
independent variables: all runs pooled, activity measured over theentire length of a run
W1 W2 W3initiative
responsiveness
presence
T1 planning&progress
β .178* .455** -.262Sig. .045 .000 .059
T2 contributionto team
β .178* .527** -.289*Sig. .040 .000 .032
T3 support β .172* .522** -.283*Sig. .048 .000 .040
T4 individualoverall
β .185* .521** -.287*Sig. .034 .000 .035
**. significant at the 0.01 level (2-tailed).*. significant at the 0.05 level (2-tailed).
Looking at the standardised path coefficients of thestructural equation modelling for the different months (seeTable 7) shows that the ’W2 responsiveness’ receives a pos-itive and significant relation with all grades in all months,i.e. it can be used as a predictor for the three grades. The’W3 presence’ indicator always obtains a negative relationwith the grades which is significant only in month1 (-.333). For indicator ’W1 initiative’ the relations are positive
PRE PRIN
T
IEEE TRANSACTIONS ON LEARNING TECHNOLOGIES, VOL. XX, NO. X, XX 2016 8
TABLE 7Standardised path coefficients (β) and their significances from the structural equation modelling with the individual grades (tutor-based) as
dependent and the widget indicator scores (widget-based) as independent variables: all runs pooled, activity measured per month
m o n t h 1 m o n t h 2 m o n t h 3 m o n t h 4 m o n t h 5W1 W2 W3 W1 W2 W3 W1 W2 W3 W1 W2 W3 W1 W2 W3
T1 planning&progress
β .314** .434** -.333* .050 .385** -.149 .180* .247* -.113 .117 .313** -.145 -.014 .249* -.060Sig. .000 .000 .023 .630 .000 .326 .025 .018 .368 .227 .004 .318 .877 .040 .661
T2 contributionto team
β .295** .372** -.223 .033 .423** -.136 .185* .338** -.142 .140 .382** -.186 -.032 .355** -.140Sig. .000 .002 .127 .746 .000 .359 .018 .001 .241 .146 .000 .187 .724 .003 .295
T3 support β .297** .371** -.235 .024 .424** -.140 .163* .300** -.097 .126 .374** -.173 -.020 .357** -.115Sig. .001 .002 .114 .812 .000 .349 .040 .003 .433 .188 .000 .227 .821 .002 .395
T4 individualoverall
β .306** .398** -.254 .036 .425** -.141 .185* .309** -.123 .134 .371** -.175 -.020 .339** -.114Sig. .000 .001 .088 .724 .000 .345 .019 .002 .320 .165 .000 .219 .826 .004 .399
**. significant at the 0.01 level (2-tailed). *. significant at the 0.05 level (2-tailed).
and significant in month1 and month3 only. In month5 allgrade/’W1 initiative’ combinations have a negative relationbut are not significant.
From the perspective of the grades, the highest positivepredictive relation for ’T1 planning & progress’ is achievedwith the ’W2 responsiveness’ score in month1 (.434) whilethe strongest negative predictive relation is received withthe ’W3 presence’ score in month1 (-.333). The best positivepredictive relation for grades ’T2 contribution to team’, ’T3support’ and ’T4 individual-overall’ is obtained with thewidget indicator score ’W2 responsiveness’ in month2 (.423and .424 and .425). There are no significant negative predic-tive relations for these grades in the individual months.
4 DISCUSSION
When all runs are pooled and the activity is calculatedover the whole run of the course, the Spearman correlationresults show that the scores of all three widget indicatorssignificantly and positively correlate with all four gradesexcept the ’T1 planning & progress’/’W3 presence’ combi-nation whose relation is not significant. Hypothesis 1 (Thereis a significant positive correlation between tutor gradingsof individual students and the widget indicator scores) canthus be accepted.
Adding to this, the results of the structural equationmodelling shows that there is indeed a positive and sig-nificant predictive relation between the widget indicators’W1 initiative’ and ’W2 responsiveness’ and all four gradeswhile the widget indicator ’W3 presence’ is in a significantbut negative relation with the grades ’T2 contribution toteam’, ’T3 support’ and ’T4 individual-overall’, i.e. the wid-get indicators in those cases can be seen as predictors forthe grades. The individual grades of the students as givenby the tutors are mostly defined in qualitative terms (seeTable 1). However, the analysis results between the purelyquantitative widget indicator scores and these individualgrades suggests that posting more while having lower pres-ence scores tends to lead to better course grades, i.e. themore productive students (see our definition of the ’W5productivity’ indicator in Table 2) seem to be the betterperformers.
In particular, scores of the ’W2 responsiveness’ indicator,i.e. the number of response posts made on the platform,
correlate well with the different individual grades. Thisholds true for the calculations of the whole run as well asfor the individual months. This suggests that it provides areliable indication of students’ individual performance. Asthe correlation between the scores of the widget indicator’W3 presence’ and the four grades tends to be lowest (butstill significant) for the whole run as well as the individualmonths and as – except for the T1 / W3 combination – the’W3 presence’ indicator scores have no significant predictiverelation with any of the grades, Hypothesis 2 (The scoresof the widget indicator ’presence’ are better predictors forthe students’ individual grades than those of the widgetindicators ’initiative’ and ’responsiveness’), is rejected.
This is interesting as a number of related works reportedthat class attendance or time online can be used as predic-tors for the course outcome. Also, one would intuitivelyassume that those students that are most interested inand motivated for the course are also those that show ahigh presence on the platform and thus receive the bettergrades. However, this does not seem to be the case here.The ’W3 presence’ indicator scores therefore are not a verygood a predictor for the students’ individual grades. Ourresults thus correspond with those from Macfadyen andDawson [28] who reported that contribution to discussions,i.e. posting something, received better correlation resultswith students’ outcome than time online.
The good positive and significant Spearman correlationresults as well as the positive and significant regressionanalysis results between the score of the widget indicator’W2 responsiveness’ and the individual grades especially inmonth2 could be explained by the observation that in thefirst months of the course, the students almost exclusivelyuse the EVS platform, whereas after these months the stu-dents increasingly move to other means of communication,outside the EVS platform, notably Skype and Google Docs.As a consequence, a large part of the students’ activity inthese later months is not measured by the learning analyticswidget. Based on the widget data alone, hypothesis 3 (Thewidget indicator scores produced in the second half of thecourse are better predictors than those of the first half) thushas to be rejected.
Again, this finding is interesting as we had originallythought that the last few months of the course would renderbetter results than the first few as the most part of the
PRE PRIN
T
IEEE TRANSACTIONS ON LEARNING TECHNOLOGIES, VOL. XX, NO. X, XX 2016 9
group work in EVS is done towards the end of the course.The change to other means of communication over thetime span of an EVS run, however, seems to have moreimpact than foreseen. The increased use of these other toolsin the later months does, however, not necessarily meanthat the students made fewer posts on the EVS platform(overall, the number of initiative posts increased towardsthe end, while the number of response posts decreased;presence also slightly decreased towards the end). It does,however, mean that there was a relative shift, i.e. the share ofcommunication and collaboration decreased relative to theshare outside the platform, and that there was a qualitativeshift, i.e. the platform was still used for communication butmuch less for collaboration on joint products. The expectedincrease of activity thus did happen but not on the EVSplatform and could thus not be captured by the widget.
Pertaining to the discussion about the effectiveness oflearning analytics visualisations, our study contributes to itas we provide evidences for the effectiveness of dashboardsfor reflection and awareness of pure online collaborativelearning processes. We investigated the predictive powerof the indicators from our widget and were able to showthat the final grades and widget indicator scores are signifi-cantly and positively correlated. This overall positive resultprovides a useful empirical basis for the development ofinstructional designs and activities within the EVS onlinecourse. As the EVS students do not meet face-to-face, we areconfident that the widget, once it is implemented in a liverun of the course, will support reflection and awareness ofthe collaborative learning processes, will provide valuablefeedback to the learners on different activities of collabora-tive learning, and will contribute to an adjustment of thelearning design of the course.
There are several aspects that have to be kept in mindwhen looking at the results of our analyses. First of all, asmentioned earlier, analysing distal data such as activity logsfrom a learning environment can never be used as a one-to-one replacement for proximal data such as questionnairesor interviews. However, we support the view that the useof learning analytics can contribute to and enrich reflectionand awareness processes for learners as well as teachersespecially due to its non-disruptiveness and its taking intoaccount of the full student cohort at the same time.
Another limitation of our study is that although wedo look at behavioural data, we do not examine learn-ing as a process itself. Neither do we explore whetherany learning actually took place (for the purposes of ourstudy we assume that a student’s grade is an indicatorof knowledge level) nor do we actually observe learningwhere and how it takes place, e.g. in the form of brain ac-tivity and modifications. Bio-psychological and educationalneuroscience research is of huge importance for discoveringthe phenomenon of learning. On many levels, however, thebrain and its ways of working are still a mystery [40], [41].And although the recent year has seen learning analyticsresearchers contributing to this field by combining log datawith data from biophysical sensors (e.g. [42]), addressingand taking into account these issues in the current paperwould have been out of the scope of our study.
One of the biggest risks associated with this type ofawareness and reflection support widget, or better, with
this type of visualised information as we describe here isthat students will use it ’strategically’, e.g. by posting manyshort, largely irrelevant messages to improve their scores.Beheshitha et al. [32] report that showing students the topcontributors of their course often resulted in more postingsbut not necessarily in ones with higher quality. As we didnot use the widget in a live run of a course for this study,we did not have to take this risk into account yet. However,once the widget will be used, the best way to deal withsuch risks is to properly embed it into the instructionaldesign of the course and to explain its aim and functionto students and tutors. This might help to overcome issueslike students ’playing the system’ and tutors only using thewidget indicators scores for grading. In addition, it may beuseful to introduce a weighted form of scoring in the widget,e.g. by taking the length of posted comments into account,and to control for achievement goal orientations [31], [32].
Relating to the usage of the widget in a live run of thecourse, it will also be interesting to observe if and how thestudents will make use of the privacy option offered bythe reciprocal privacy model implemented into the widget.Theoretically, if many or even all students within a groupchoose not to share their data, the widget’s intention tosupport awareness and reflection of collaborative learningprocesses would be seriously interfered with or even pre-vented. A further risk is thus that by providing the studentswith privacy mechanisms, the likelihood of the widget beingable to be the supportive tool it is meant to be decreases.
5 CONCLUSION
This paper presented a formative study about the reflectiveand thus predictive power of widget indicators of a learninganalytics-based awareness widget towards students’ grades.The results of our analysis show that the grades and widgetscores are indeed significantly and positively correlated,with some widget indicators being valid reflectors, i.e. pre-dictors, of the grades. On the basis of the results presentedand discussed above, we suggest several guidelines con-cerning the interpretation of this learning analytics widget’svisualisations in a live run of the course.
The scores of the widget indicator ’W3 presence’ are notto be seen as a valid reflector for the final tutor-based gradesof an individual student as they tend to have non-significantand negative predictive relations with all grades. They can,however, be useful to make students within a team aware oftheir group’s dynamics.
The ’W2 responsiveness’ indicator scores provide a goodindication of an individual student’s contribution to thegroup work and can thus be used as a basis for groupreflection. Due to the significant and positive correlationsand predictive relations of this widget indicator with allgrades in the first few months, it can be used as a reflectorfor the students’ final individual grades, under the conditionof unchanged behaviour.
Taking the results from this analysis into account, thelearning analytics widget is being integrated into the courseplatform for tutors and students in future live runs of EVS.Its impact on group awareness processes will be analysedwith quantitative and qualitative measures such as theevaluation framework for learning analytics [43] and face-to-face experts workshops.

PRE PRIN
T
IEEE TRANSACTIONS ON LEARNING TECHNOLOGIES, VOL. XX, NO. X, XX 2016 10
REFERENCES
[1] K. Kreijns, P. A. Kirschner, and W. Jochems, “Identifying thepitfalls for social interaction in computer-supported collaborativelearning environments: A review of the research,” Computers inHuman Behavior, vol. 19, no. 3, pp. 335–353, 2003.
[2] K. Kreijns, F. Van Acker, M. Vermeulen, and H. van Buuren,“Community of inquiry: Social presence revisited,” E-Learning andDigital Media [Special Issue: Inquiry into ’Communities of Inquiry’:Knowledge, Communication, Presence, Community, vol. 11, no. 1, pp.5–19, 2014.
[3] P. Kirschner, K. Kreijns, C. Phielix, and J. Fransen, “Awareness ofcognitive and social behaviour in a cscl environment,” Journal ofComputer Assisted Learning, vol. 31, no. 1, pp. 59–77, 2015.
[4] C. Phielix, F. J. Prins, P. A. Kirschner, G. Erkens, and J. Jaspers,“Group awareness of social and cognitive performance in a CSCLenvironment: Effects of a peer feedback and reflection tool,”Computers in Human Behavior, vol. 27, no. 3, pp. 1087–1102, 2011.
[5] M. Fishbein and I. Ajzen, Predicting and Changing Behavior: Thereasoned action approach. New York, NY, USA: Psychology Press,2010.
[6] P. Long and G. Siemens, “Penetrating the Fog: Analytics in Learn-ing and Education,” EDUCAUSE Review, vol. 46, no. 5, pp. 30–40,2011.
[7] D. Gasevic, S. Dawson, N. Mirriahi, and P. Long, “Learninganalytics – a growing field and community engagement,” Journalof Learning Analytics, vol. 2, no. 1, pp. 1–6, 2015.
[8] D. Gasevic, S. Dawson, and G. Siemens, “Let’s not forget: Learninganalytics are about learning,” TechTrends, vol. 59, no. 1, pp. 64–71,2014.
[9] W. Greller and H. Drachsler, “Translating Learning into Numbers:A Generic Framework for Learning Analytics,” Educational Tech-nology & Society, vol. 37, no. 3, pp. 42–57, 2012.
[10] R. Ferguson, “Learning analytics don’t just measure students’progress – They can shape it,” theguardian.com, 2014. [Online].Available: http://gu.com/p/3np4c/sbl
[11] J. Hattie and H. Timperley, “The Power of Feedback,” Review ofEducational Research, vol. 77, no. 1, pp. 81–112, 2007.
[12] E. H. Mory, “Feedback Research Revisited,” in Handbook of Researchon Educational Communications and Technology, D. H. Jonassen, Ed.Mahwah, NJ, US: Lawrence Erlbaum Associates, 2004, pp. 745–783.
[13] M. R. Endsley, “Toward a Theory of Situation Awareness inDynamic Systems,” Human Factors, vol. 37, pp. 32–64, 1995.
[14] ——, “Theoretical underpinnings of situation awareness: a criticalreview,” in Situation Awareness Analysis and Measurement, M. R.Endsley and D. J. Garland, Eds. Mahwah, NJ, USA: LawrenceErlbaum Associates, 2000.
[15] D. Schon, The reflective practitioner: How professionals think in action.London, UK: Temple Smith, 1983.
[16] G. Bolton, Reflective practice: Writing & professional development,3rd ed. London, UK: Sage, 2010.
[17] K. Verbert, E. Duval, J. Klerkx, S. Govaerts, and J. Santos, “Learn-ing Analytics Dashboard Applications,” American Behavioral Scien-tist, vol. 57, no. 10, pp. 1500–1509, 2013.
[18] D. Butler and P. Winne, “Feedback and self-regulated learning: atheoretical synthesis,” Review of Educational Research, vol. 65, no. 3,pp. 245–281, 1995.
[19] P. H. Winne, “Inherent Details in Self-Regulated Learning,” Educa-tional Psychologist, vol. 30, no. 4, pp. 173–187, 1995.
[20] B. J. Zimmerman, “Self-Regulation Involves More Than Metacog-nition: A Social Cognitive Perspective,” Educational Psychologist,vol. 30, no. 4, pp. 217–221, 1995.
[21] P. H. Winne, “How Software Technologies Can Improve Researchon Learning and Bolster School Reform,” Educational Psychologist,vol. 41, no. 1, pp. 5–17, 2006.
[22] M. Crede, S. G. Roch, and U. M. Kieszczynka, “Class Attendancein College: A Meta-Analytic Review of the Relationship of ClassAttendance With Grades and Student Characteristics,” Review ofEducational Research, vol. 80, no. 2, pp. 272–295, 2010.
[23] T. Bennett and S. Yalams, “Correlates of students’ attendance toclass, participation and performances in engineering modules,”in Global Engineering Education Conference (EDUCON), 2013 IEEE,2013, pp. 947–951.
[24] M. Stewart, T. Stott, and A.-M. Nuttall, “Student EngagementPatterns over the Duration of Level 1 and Level 3 GeographyModules: Influences on Student Attendance, Performance and
Use of Online resources,” Journal of Geography in Higher Education,vol. 35, no. 1, pp. 47–65, 2011.
[25] E. Latif and S. Miles, “Class Attendance and Academic Perfor-mance: A Panel Data Analysis,” Economic Papers, vol. 32, no. 4, pp.470–476, 2013.
[26] W. R. Louis, B. Bastian, B. McKimmie, and A. J. Lee, “Teachingpsychology in Australia: Does class attendance matter for perfor-mance,” Australian Journal of Psychology, vol. 68, pp. 47–51, 2016.
[27] C. Korkofingas and J. Macri, “Does Time Spent Onlinehave an Influence on Student Performance? Evidence for aLarge Business Studies Class,” Journal of University Teaching& Learning Practice, vol. 10, no. 2, 2013. [Online]. Available:http://ro.uow.edu.au/jutlp/vol10/iss2/2
[28] L. Macfadyen and S. Dawson, “Mining LMS data to developan ”early warning system” for educators: A proof of concept,”Computers & Education, vol. 54, pp. 588–599, 2010.
[29] K. D. Strang, “Beyond engagement analytics: which online mixed-data factors predict student learning outcomes?” Education andInformation Technologies, pp. 1–21, 2016.
[30] D. T. Tempelaar, B. Rienties, and B. Giesbers, “In search for themost informative data for feedback generation: Learning analyticsin a data-rich context,” Computers in Human Behavior, vol. 47, pp.157–167, 2015.
[31] S. Lonn, S. Aguilar, and S. Teasley, “Investigating student moti-vation in the context of a learning analytics intervention during asummer bridge program,” Computers in Human Behavior, vol. 47,pp. 90–97, 2015.
[32] S. Beheshitha, M. Hatala, D. Gasevic, and S. Joksimovic, “The roleof achievement goal orientations when studying effect of learninganalytics visualizations,” in Proceedings of the Sixth InternationalConference on Learning Analytics & Knowledge, ser. LAK ’16. NewYork, NY, USA: ACM, 2016, pp. 54–63.
[33] I. Khan and A. Pardo, “Data2U: scalable real time student feedbackin acive learning environments,” in Proceedings of the Sixth Interna-tional Conference on Learning Analytics & Knowledge, ser. LAK ’16.New York, NY, USA: ACM, 2016, pp. 249–253.
[34] J. de Kraker and R. Corvers, “European Virtual Seminar onSustainable Development: international, multi-disciplinary learn-ing in an online social network,” E-learning and Education forSustainability, Series ’Environmental Education, Communication andSustainability’, vol. 35, pp. 117–136, 2014.
[35] A. Slootmaker, M. Scheffel, K. Kreijns, J. De Kraker, andH. Drachsler, “Performance dashboard to support awareness andreflection in elgg communities (version 1.15) [software],” OpenUniversiteit, Heerlen, The Netherlands, 2015. [Online]. Available:http://hdl.handle.net/1820/6290
[36] H. Drachsler and W. Greller, “Privacy and Analytics - it’s aDELICATE issue. A Checklist to establish trusted Learning Ana-lytics,” in Proceedings of the Sixth International Conference on LearningAnalytics And Knowledge, ser. LAK ’16. New York, NY, USA: ACM,2016, pp. 89–98.
[37] R. Hoyle, Structural equation modelling: Concepts, issues, and applica-tions. Thousand Oaks, CA: Sage, 1995.
[38] H. Marsh, J. Bella, and K. Hau, An evaluation of incremental fitindices: A clarification of mathematical and empirical properties. Mah-wah, NJ, US: Erlbaum, 1996, pp. 315–353.
[39] M. Browne and R. Cudeck, “Single sample cross-validation indicesfor covariance structures,” Multivariate Behavioral Research, vol. 24,pp. 445–455, 1989.
[40] P. D. Bruyckere, P. A. Kirschner, and C. D. Hulshof, Eds., UrbanMyths about Learning and Education. San Diego: Academic Press,2015.
[41] B. Martynoga, “Head of the class – Teaching methodsare often based on convention over evidence. Canneuroscience help pupils to learn?” thelongandshort.org,2015. [Online]. Available: http://thelongandshort.org/society/head-of-the-class-neuroscience-education
[42] H. J. Pijeira-Dıaz, H. Drachsler, S. Jarvela, and P. A. Kirschner,“Investigating collaborative learning success with physiologicalcoupling indices based on electrodermal activity,” in Proceedings ofthe Sixth International Conference on Learning Analytics & Knowledge,ser. LAK ’16. New York, NY, USA: ACM, 2016, pp. 64–73.
[43] M. Scheffel, H. Drachsler, S. Stoyanov, and M. Specht, “Quality In-dicators for Learning Analytics,” Educational Technology & Society,vol. 17, no. 4, pp. 117–132, 2014.

PRE PRIN
T
IEEE TRANSACTIONS ON LEARNING TECHNOLOGIES, VOL. XX, NO. X, XX 2016 11
Maren Scheffel is a researcher at the Welten In-stitute (Research Center for Learning, Teachingand Technology) of the Open University of theNetherlands. She studied computational linguis-tics at the University of Edinburgh and the Uni-versity of Bonn and received her M.A. in 2008.She previously worked at the Fraunhofer Insti-tute for Applied Information Technology (FIT)focussing on aspects related to technology-enhanced learning where and was also involvedin managing the ROLE project. Since 2014 she
has been working at the Welten Institute where she was involved in themanagement as well as the research for the LACE project and nowcontributes to the SHEILA project. Her PhD work focuses on creatingan evaluation framework for learning analytics. She is a member of theSURF SIG Learning Analytics.
Hendrik Drachsler is Associate Professor forLearning Analytics at the Welten Institute ofthe Open University of the Netherlands, andholds a Chair on Technology-Enhanced Learn-ing at the University of Applied Sciences Zuyd.His research interests include learning analytics,personalisation technologies, recommender sys-tems, educational data, mobile devices, and theirapplications in the fields of technology-enhancedlearning and health2.0. He is chairing the EATELSIG dataTEL and the national SIG Learning An-
alytics of the Dutch umbrella organisation SURF. He is elected memberof the Society of Learning Analytics Research (SoLAR). In the pasthe has been principal investigator and scientific coordinator of vari-ous national and EU projects (e.g., laceproject.eu, patient-project.eu,LinkedUp-project.eu). He regularly chairs international scientific eventsand is Associate Editor of IEEE’s Transactions on Learning Technolo-gies, and the Journal of Learning Analytics.
Joop de Kraker is Associate Professor of Envi-ronment & Sustainability at the Faculty of Man-agement, Science & Technology of the OpenUniversity of the Netherlands. He is central co-ordinator of the European Virtual Seminar onSustainable Development (EVS) since 2011.His research focusses on ’Learning for Sustain-able Development’, in particular on collaborativetypes of learning in formal education and pro-fessional practice and how these learning pro-cesses can be supported by ICT-tools.
Karel Kreijns is Associate Professor at theWelten Institute of the Open University of theNetherlands. His research interest are (1) thesocial aspects of computer-supported collabo-rative learning (CSCL) and networked learning(i.e. social presence, social space, and socia-bility) using an ecological approach and the af-fordance theory of Gibson, (2) the applicationof Self-Determination Theory of Deci and Ryan,the I-Change model of De Vries, and the Rea-soned Action Approach framework of Fishbein
and Ajzen on teachers’ use of technology/open educational resources,enrolling in MOOCs, and teachers’ professional development activities(e.g., innovative behaviour, action research, 21st century skills), and (3)BIE-coaching (BIE = bug-in-ear technology) of beginning teachers toreduce attrition and to improve the quality of the teacher.
Aad Slootmaker is an ICT developer at theFaculty of Psychology and Educational Sciencesof the Open University of the Netherlands. Hehas experience in the design and developmentof software within TEL projects. His main (re-search) interest lies in the development of meth-ods for serious games and the development ofthese type of games. He is one of the developersof the EMERGO online platform that enablesserious game development and delivery.
Marcus Specht is Professor for AdvancedLearning Technologies at the Welten Instituteof the Open University of the Netherlands anddirector of the Learning Innovation Labs. He re-ceived his Diploma in Psychology in 1995 and aDissertation from the University of Trier in 1998on adaptive information technology. From 2001he headed the department ”Mobile Knowledge”at the Fraunhofer Institute for Applied Informa-tion Technology (FIT). His research focus is onMobile and Contextualised Learning Technolo-
gies and Social and Immersive Media for Learning. Since 2014 hehas been Program Chair Technology Enhanced Learning Innovationsat the Welten Institute and member of the management team of theWelten Institute. Prof. Specht is a member of ACM, IEEE, the SIKS andICO research schools in the Netherlands, is an Apple DistinguishedEducator and has been President of the International Association ofMobile Learning since 2013.
Related Documents


![IEEE TRANSACTIONS ON WIRELESS COMMUNICATIONS, …IEEE TRANSACTIONS ON WIRELESS COMMUNICATIONS, VOL. XX, NO. XX, XXX 201X 2 processes before directional data communications [14]. To](https://static.cupdf.com/doc/110x72/5f767a2b993c5b4ed7036e7f/ieee-transactions-on-wireless-communications-ieee-transactions-on-wireless-communications.jpg)


