Identifying priority areas for bioclimatic representation under climate change: a case study for Proteaceae in the Cape Floristic Region, South Africa Christopher R. Pyke a, * , Sandy J. Andelman a , Guy Midgley b a National Center for Ecological Analysis and Synthesis, 735 State Street, Suite 300, Santa Barbara, CA 93101, USA b National Botanical Institute, Kirstenbosch Private X7, Claremont 7735, South Africa Received 14 April 2004 Abstract Biological reserves are established to protect natural resources and represent the diversity of environments found within a region. Unfortunately, many systems of protected areas do not proportionally capture the range of environmental conditions occupied by species and communities. Combinations of habitat loss and climate change may exacerbate these representational biases, and result in future distributions of environmental conditions that bare little resemblance to historic patterns. New protected areas need to be established to correct existing biases, and create conservation networks that remain representative despite climate change, habitat loss, and changes in species distributions. We demonstrate a new method to identify and prioritize habitat based on its value for improving bioclimatic representation. We assessed representation provided by existing protected areas for 301 Proteaceae species under historic and projected 2050 climate across the Cape Floristic Region in South Africa. The existing reserve system has relatively modest biases with respect to current species distributions and climate. However, if the system is not supplemented, protected areas in 2050 will capture an increasingly skewed sample of climatic conditions occupied by Proteaceae. These biases can be repaired through the systematic establishment of new protected areas, and many of the most valuable areas coincide with high priority eco- system components and irreplaceable elements identified in the Cape Action for People and the Environmental conservation plan. Protecting these areas achieves nearly the best possible improvement in climatic representation while also meeting biodiversity rep- resentation goals. Ó 2004 Elsevier Ltd. All rights reserved. Keywords: Climate change; Biodiversity; Systematic conservation planning; Reserve design and selection; Bioclimatic representation 1. Introduction Reserve networks are a cornerstone of biodiversity conservation strategies. Effective reserve networks must represent the full range of biodiversity within the region of interest (Margules and Pressey, 2001). Ideally, habitat in reserves should also represent the same breadth and diversity of environmental conditions found across the ranges of target species and communities (Noss, 2001). However, world-wide, existing reserve systems provide a biased sample of both biodiversity (Margules and Pressey, 2001; Andelman and Willig, 2003; Rodrigues et al., 2004) and environmental conditions (Scott et al., 2001; Rouget et al., 2003a,b), resulting in the over-repre- sentation of some elements and no protection for others. Climate change poses a major threat to species persis- tence, and it challenges the effectiveness of reserve net- works as a conservation strategy. Once designated, reserves are fixed in space. Yet, relatively small changes in climate can lead to shifts in the distribution of suit- able habitat and environmental conditions for a species 0006-3207/$ - see front matter Ó 2004 Elsevier Ltd. All rights reserved. doi:10.1016/j.biocon.2004.08.004 * Corresponding author. Tel.: +1 703 549 0611. E-mail address: [email protected] (C.R. Pyke). www.elsevier.com/locate/biocon Biological Conservation 125 (2005) 1–9 BIOLOGICAL CONSERVATION

Welcome message from author
This document is posted to help you gain knowledge. Please leave a comment to let me know what you think about it! Share it to your friends and learn new things together.
Transcript
www.elsevier.com/locate/biocon
Biological Conservation 125 (2005) 1–9
BIOLOGICAL
CONSERVATION
Identifying priority areas for bioclimatic representation underclimate change: a case study for Proteaceae in the Cape
Floristic Region, South Africa
Christopher R. Pyke a,*, Sandy J. Andelman a, Guy Midgley b
a National Center for Ecological Analysis and Synthesis, 735 State Street, Suite 300, Santa Barbara, CA 93101, USAb National Botanical Institute, Kirstenbosch Private X7, Claremont 7735, South Africa
Received 14 April 2004
Abstract
Biological reserves are established to protect natural resources and represent the diversity of environments found within a region.
Unfortunately, many systems of protected areas do not proportionally capture the range of environmental conditions occupied by
species and communities. Combinations of habitat loss and climate change may exacerbate these representational biases, and result
in future distributions of environmental conditions that bare little resemblance to historic patterns. New protected areas need to be
established to correct existing biases, and create conservation networks that remain representative despite climate change, habitat
loss, and changes in species distributions. We demonstrate a new method to identify and prioritize habitat based on its value for
improving bioclimatic representation. We assessed representation provided by existing protected areas for 301 Proteaceae species
under historic and projected 2050 climate across the Cape Floristic Region in South Africa. The existing reserve system has relatively
modest biases with respect to current species distributions and climate. However, if the system is not supplemented, protected areas
in 2050 will capture an increasingly skewed sample of climatic conditions occupied by Proteaceae. These biases can be repaired
through the systematic establishment of new protected areas, and many of the most valuable areas coincide with high priority eco-
system components and irreplaceable elements identified in the Cape Action for People and the Environmental conservation plan.
Protecting these areas achieves nearly the best possible improvement in climatic representation while also meeting biodiversity rep-
resentation goals.
� 2004 Elsevier Ltd. All rights reserved.
Keywords: Climate change; Biodiversity; Systematic conservation planning; Reserve design and selection; Bioclimatic representation
1. Introduction
Reserve networks are a cornerstone of biodiversity
conservation strategies. Effective reserve networks mustrepresent the full range of biodiversity within the region
of interest (Margules and Pressey, 2001). Ideally, habitat
in reserves should also represent the same breadth and
diversity of environmental conditions found across the
ranges of target species and communities (Noss, 2001).
0006-3207/$ - see front matter � 2004 Elsevier Ltd. All rights reserved.
doi:10.1016/j.biocon.2004.08.004
* Corresponding author. Tel.: +1 703 549 0611.
E-mail address: [email protected] (C.R. Pyke).
However, world-wide, existing reserve systems provide
a biased sample of both biodiversity (Margules and
Pressey, 2001; Andelman and Willig, 2003; Rodrigues
et al., 2004) and environmental conditions (Scott et al.,2001; Rouget et al., 2003a,b), resulting in the over-repre-
sentation of some elements and no protection for others.
Climate change poses a major threat to species persis-
tence, and it challenges the effectiveness of reserve net-
works as a conservation strategy. Once designated,
reserves are fixed in space. Yet, relatively small changes
in climate can lead to shifts in the distribution of suit-
able habitat and environmental conditions for a species

2 C.R. Pyke et al. / Biological Conservation 125 (2005) 1–9
or community, and jeopardize the role of reserves as safe
havens for biodiversity. The implications of climate
change for species persistence within reserves may be
confounded by habitat loss outside reserves (Pyke,
2004; Pyke, 2005). Existing representational biases in re-
serve networks make it difficult to predict the outcomesof habitat loss-climate change interactions, and future
distributions of environmental conditions available to
species and communities may bear little resemblance
to current or historic patterns.
Current conservation strategies do not incorporate
analytical techniques to repair these biases. New tools
are required to create reserve networks that protect spe-
cies, communities, and ecosystems and the diversity ofenvironmental conditions they require for survival. Here
we present a novel heuristic method for identifying areas
with value for improving representation of bioclimatic
conditions for multiple species in the context of regional
climate change. We then apply a variant of the method
to evaluate the adequacy of bioclimatic representation
within existing or proposed protected area networks.
We focus on species in the family Proteaceae, in theCape Floristic Region (CFR) of South Africa (Fig. 1),
a global hotspot for biodiversity (Cowling et al., 1996;
Myers et al., 2000). Many Proteaceae species are rare
(124 species) and half are listed as endangered or vulner-
able by the World Conservation Union (Hilton-Taylor,
1996; IUCN, 2000; WCMC, 2002). Moreover, many of
these species are associated with the Fynbos Biome,
whose areal extent is expected to contract with climatechange (Midgley et al., 2002). Proteaceae in the CFR
Fig. 1. Location of study area in South Africa. The inset illustrates the distri
study area.
are protected by a relatively extensive system of nature
reserves; however, the distribution of protected habitat
is geographically biased (Rouget et al., 2003b). Habitat
associated with steep slopes and high elevations is over
protected, at the expense of low-relief, coastal areas
(Rouget et al., 2003b).
2. Methods
2.1. Present and future distributions of climate and
Proteaceae
Data on historic environmental conditions and cur-rent species distributions were available across the
CFR for a grid of 1 · 1 min cells (approximately
1.85 · 1.55 km at this latitude). The species distributions
were obtained from the Protea Atlas Project (PAP),
(www.protea.worldonline.co.za/default.htm), compris-
ing more than 250,000 records of presence and absence
for 340 species at more than 60,000 geo-referenced
locations.Future climate projections are based on Schulze and
Perks (1999), according to the 2050 projections for the
region from the Global Change Model HadCM2n.
Midgley et al. (2002) downscaled coarse-scale (3� · 3�)projections of climatic conditions for 2050 to regional
1 · 1 min grids. Downscaled change vectors were ap-
plied to historic climate grids (Schulze, 1997) to yield
map-based predictions of future distributions of climateacross the CFR.
bution of protected areas, degraded lands, and intact habitat across the

C.R. Pyke et al. / Biological Conservation 125 (2005) 1–9 3
Expected future species distributions of Proteaceae
species in 2050 were modeled using bioclimatic envelope
models that combined Generalized Additive Models
(GAMs) of environmental suitability for each species
based on five environmental parameters critical for plant
physiological function (details in Midgley et al. (2002))with constraints on species dispersal distances and rates
(primarily based on dispersal agent). Receiver Operator
Curve (ROC) thresholds were used to limit future distri-
butions and to create predictions of species distributions
for 2050. The result is a set of binary range maps with
1 · 1 min cells. Based on these models, bioclimatic con-
ditions suitable for 301 species are expected to be avail-
able in 2050. Bioclimatic conditions currently occupiedby 39 species in 2000 will no longer exist at this scale
of analysis in 2050.
2.2. Uncertainty in climatic and biogeographic projections
The climatic and biogeographic models used for this
analysis are subject to substantial uncertainties. These
uncertainties result from assumptions about parameters,mechanisms, and socio-economic conditions that are dif-
ficult to estimate or validate. However, climate modeling
from multiple international groups indicates a broad
consensus that this region will experience warmer condi-
tions given current trends. The magnitude and spatial
distribution of these changes vary by model and socio-
economic scenario, but the complexity of our coupled
analysis limits us to using a single projection from onemodel for biogeographic analysis. Perhaps more impor-
tant is uncertainty in modeling species responses to cli-
mate change. Bioclimatic envelope models assume that
historic relationships between climate and biogeography
can, at least in part, be used to predict future distributions
(Pearson et al., 2002; Thuller, 2003). This assumption will
not always hold true (Davis et al., 1998). Despite these
concerns, such models describe fundamental ecologicalrelationships, and are valuable for understanding biogeo-
graphic patterns for many species at regional and global
scales (Pearson and Dawson, 2003). Given these uncer-
tainties, the results presented here should be viewed as
a preliminary solution to one plausible realization of a
complex system.
2.3. Bioclimatic assessment and priorities for repairing
representation
Data about the geographic distribution of species, cli-
mate, and habitat were used to address three research
goals: (1) characterize bioclimatic representation within
protected areas for Proteaceae species under 2000 and
2050 climates, (2) identify areas outside of existing pro-
tected areas with high value for improving bioclimaticrepresentation for multiple species, and (3) evaluate
the potential of existing conservation plans, if imple-
mented, to improve representation. We used a four-step
procedure:
2.3.1. Bioclimatic representation: Evaluate the
representation of mean annual precipitation (MAP)
across the range of each species for habitat both inside and
outside of biological reserves under 2000 and 2050
climates
We define a bioclimatic representation goal such that
reserves provide a proportional sample of the distribu-
tion of environmental conditions across the range of
each target species. Representation is bioclimatic, be-
cause it is a product of the geographic distributions of
both species and climate. There is considerable uncer-tainty associated with predicting future species distribu-
tions. Thus reserve-siting methods that set objectives
based on direct measures of species representation, such
as a given number of occurrences or populations (Camm
et al., 2002) or a fraction of the total species range
(Rodrigues et al., 2004), entail some risk that reserves
will be designated in places where target species will
not persist. Rather than focusing on the precise loca-tions where species are expected to occur in 2050, our
objective is to identify places valuable for the conserva-
tion of the range of bioclimatic conditions currently
occupied by each species, despite changes in climate
and large-scale habitat loss. In other words, we are inter-
ested in maintaining a biophysical ‘‘stage’’ for each spe-
cies to act on, even though the ‘‘stage’’ may be
shrinking, as well as moving across the landscape. Weillustrate this approach using current and future MAP.
An analysis of MAP cannot hope to capture the full
range of environmental variability important to so many
different species (Faith and Walker, 1996; Midgley et al.,
2003), but it can serve to illustrate methods and provide
one important metric of ecological impacts.
2.3.2. Bioclimatic representation Index (RI): Summarize
the performance of the existing reserve network for each
species using a new metric called the bioclimatic
representation index (RI)
The RI for any species is the difference between the
species� region-wide average MAP in 2000 and the re-
serves-only average MAP in 2050. Region-wide averages
are only the most basic model of complex intra-range
environmental variability, and more comprehensivetreatments could identify many additional dimensions
of environmental variation (see Faith and Walker,
1996; Pyke and Fischer, in press). Assuming a worst case
scenario, in which all habitat outside protected areas
may be lost, we calculated the average bioclimatic RI
for all species using Eq. (1), where HA (all habitat) is
the region-wide average across all habitat under 2000
climate and HP (protected habitat) is the average forhabitat in existing protected areas under 2050 climate
for n species.
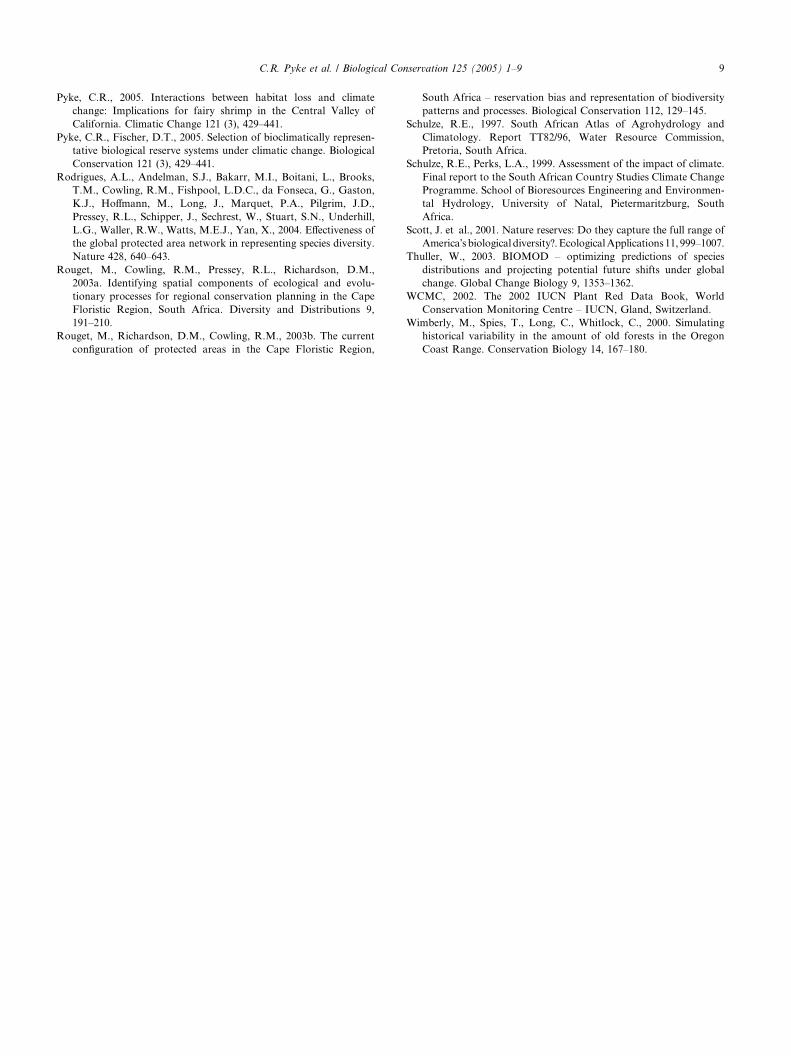
4 C.R. Pyke et al. / Biological Conservation 125 (2005) 1–9
RI ¼
Pn
1
HA � HP
n: ð1Þ
An RI value of 0.0 indicates that habitat within exist-
ing biological reserves has exactly the same mean for the
environmental variable as for the species range as awhole. Index values <0.0 indicate that, in the future, re-
serves will be wetter than current region-wide condi-
tions. Index values >0.0 indicate that protected areas
in the future will be drier than current region-wide con-
ditions. Thus, the magnitude of the departure from 0.0
provides an estimate of the degree of representational
bias and the sign indicates the direction. The index can
be calculated either for current conditions or for pro-jected future ranges of species or anticipated protected
areas. It is possible for unusual distributions of habitat
to confound the RI index; however, with so many differ-
ent possible combinations of habitat, species ranges, and
climate, this is unlikely.
We also used Moran�s I, an index of spatial autocor-
relation (Goodchild, 1986), implemented in the ArcGIS
Workstation�s GRID module (ESRI, 2002), to evaluatechanges in the spatial structure of MAP between 2000
and 2050. The Moran�s I index ranges from �1 (check-
erboard, uncorrelated) to +1 (smooth, clustered, highly
correlated). MAP naturally would be expected to show
strong patterns of spatial autocorrelation across a spe-
cies range (Moran�s I index values approaching 1.0)
(Koenig, 1999); however, habitat loss can disrupt spatial
patterns and change regional correlation structure(Wimberly et al., 2000).
2.3.3. Geographic weightings: Apply the RI as a weighting
to prioritize areas where the addition of new protected
areas might improve the distribution of bioclimatic
representation in reserves
We split the future (2050) range of each species,
identifying the portion of the range projected to be un-der-represented, and weighting cells within that area
according to the absolute value of the RI. This was
implemented in ArcGIS Geographic Information Sys-
tem using Arc Macro Language (AML) scripts to per-
form map algebra calculations on 1� · 1� raster grids
(limited by the spatial resolution of the climate data).
AML scripts to perform this analysis are available from
the corresponding author. If the species� MAP RI wasgreater than 0.0 (a surplus of dry areas, deficit of above
average precipitation areas), unprotected habitat areas
with 2050 MAP values higher than the species� region-wide 2050 mean were selected and assigned the absolute
value of the RI. If the RI was smaller than 0.0 (a surplus
of wet areas, a deficit of relatively low precipitation
areas), unprotected areas with MAP values lower than
the species� region-wide mean were selected and assignedthe absolute value of the representation ratio. This re-
sulted in a stack of 301 species grids with portions of
the range above or below the region-wide average for
each species attributed with the absolute value of their
representation ratio. This relatively simple method only
breaks the range into two bins, high and low. A more
sophisticated implementation might further subdividethe range and capture more dimensions of environmen-
tal variation, but this would substantially increase com-
plexity, computational effort, and data quality
requirements (see Pyke and Fischer, in press).
2.3.4. Aggregate representation index deficit (ARID)
map: Combine the RI weighted grids for each species to
create a composite map indicating high value conservation
areas
We created a composite grid, describing the ARID
for MAP, by summing the 301 weighted species. The
magnitude of the ARID grid corresponds to a compos-
ite representation deficit for all species occurring at a gi-
ven pixel. Low values indicate that environmental
conditions are already represented in protected areas.
High values indicate that environmental conditions arerelatively under-represented. The ARID map provides
a practical heuristic that directs attention toward areas
that could improve the representation of future biocli-
matic conditions for many species.
2.4. Evaluate existing and proposed reserves
This bioclimatic assessment procedure also can beused to evaluate the representational value of existing
and proposed protected areas. We demonstrate this for
the implementation stages of the Cape Action for People
and the Environment (CAPE) conservation plan (Cowl-
ing et al., 2003; Gelderblom et al., 2003). The CAPE
plan identifies seven implementation stages ultimately
leading to a reserve system covering 52% of the 87,892
km2 CFR. We calculated the value of these implementa-tion stages for bioclimatic representation, both individ-
ually and in aggregate by calculating average ARID
scores for each stage, and the cumulative average RI
score (Eq. (1)) at the end of each stage in the growing
reserve system. This provided information about the
representation value of specific stages, as well as the to-
tal improvement in representation achieved by imple-
menting the entire reserve network.
3. Results
We confirmed previous analyses of broad environ-
mental types within the CFR indicating a modest repre-
sentational bias in existing reserves under current
climate (Table 1) (Rouget et al., 2003b). Average MAPwithin existing reserves is 9% greater than for current
habitat region-wide (Fig. 2(a)). The overall correlation

Table 1
Summary statistics for MAP across the Cape Floristic Region study
area
2000 2050
All habitat Reserves All habitat Reserves
MAP (mm/year)
Mean 466 633 367 498
SD 291 368 242 302
Minimum 68 82 39 64
Maximum 3345 3345 2784 2784
C.R. Pyke et al. / Biological Conservation 125 (2005) 1–9 5
between MAP inside reserves and region-wide is strong
(r2 = 0.97, df = 299, p < 0.001). Existing reserves do a
nearly perfect job capturing current region-wide maxi-
mum MAP values (r2 = 0.99, df = 299, p < 0.001), but
biases toward higher elevation areas mean that region-
wide minimum MAPs are occasionally poorly repre-
sented (r2 = 0.94, df = 299, p < 0.001) (Fig. 2(b) and
(c)). This is reflected in an overall 10% difference in min-imum MAP and no net difference in maximum MAP.
Future patterns of bioclimatic representation may
not be as robust. A comparison of all habitat under cur-
rent climate with only habitat in existing reserves, with
2050 MAP and 2050 Proteaceae distributions, shows a
positive, but weaker relationship than exists today
(r2 = 0.75, df = 299, p < 0.001) (Fig. 2(a)). Representa-
tion for region-wide extremes declines more dramati-
Res
erve
s(2
000)
ME
AN
500
1000
1500
2000
Res
erve
s(2
000)
MIN
200
400
600
800
(a)
(d) (e)
(b)
All habitat (2000) MEAN All habi
Res
erve
s(2
050)
ME
AN
500 1000 1500 2000
050
010
0015
00
Res
erve
s(2
050)
MIN
200 400
020
040
060
080
010
00
Fig. 2. Correlations for individual species (n = 301) between MAP across regi
climate (y-axis) with historic ranges: (a) Average MAP, (b) minimum MAP a
MAP, (e) minimum MAP and (f) maximum MAP. Lines are 1-to-1 correlat
cally (Fig. 2(e) and (f)). Projections for 2050 suggest
that existing reserves will capture a lower proportion
of region-wide minimums (r2 = 0.48, df = 299, p <
0.001) and maximums (r2 = 0.76, df = 299, p < 0.001)
than under current climate and species distributions.
These changes in aggregate MAP representationwill also be accompanied by changes in the spatial
pattern of MAP. MAP within existing protected areas
tends to provide precipitation patterns with lower spa-
tial autocorrelation than is found region-wide
(r2 = 0.87, df = 299, p < 0.001) (Fig. 3a). For current
(2000) climate, the average Moran�s I statistic for
MAP inside reserves is 0.38, compared to 0.42 for re-
gion-wide habitat. This indicates a reduction in spatialcorrelation if habitat outside of reserves is lost. The
average Moran I statistic for all species in reserves un-
der 2050 climate drops slightly to 0.35. However, this
small change in average conditions masks a substan-
tial decline in species-by-species correlations
(r2 = 0.21, df = 299, p < 0.001) (Fig. 3b). This suggests
that many individual species will experience substan-
tial changes in the spatial pattern of MAP availableacross their future ranges.
RI values varied widely among Proteaceae species.
The range of values approximately followed a normal
distribution with a mean of –87 mm/year (SD = 149) .
This pattern suggests a systematic change in
Reser
ves
(200
0)M
AX
500
1000
2000
3000
(f)
(c)
tat (2000) MIN All habitat (2000) MAX
600 800
Res
erve
s(2
050)
MA
X
500 1000 2000 3000
050
010
0015
0020
0025
00
on-wide habitat (x-axis) and reserves-only habitat under historic (2000)
nd (c) maximum MAP: with projected 2050 species ranges, (d) average
ion lines, and they are not fitted to the data.

Moran index (all habitat 2000)
Mor
an in
dex
(res
erve
s-on
ly 2
000)
0.0 0.2 0.4 0.6 0.8
-0.2
0.0
0.2
0.4
0.6
0.8
Moran index (all habitat 2000)M
oran
inde
x (r
eser
ves-
only
205
0)0.0 0.2 0.4 0.6 0.8
-0.2
0.0
0.2
0.4
0.6
0.8Increasing spatial autocorrelation
Decreasing spatial autocorrelation
(a) (b)
Fig. 3. Correlations in Moran�s I spatial autocorrelation index for: (a) all region-wide habitat under 2000 climate and reserves-only habitat under
2000 climate, and (b) all region-wide habitat under 2000 climate and reserves-only habitat under projected 2050 climate and species ranges. Moran�s Ivalues range from �1.0 (contrasting, checkerboard landscapes) to +1.0 (smooth, clustered landscapes). Random landscapes have a Moran�s I valueof 0.0.
6 C.R. Pyke et al. / Biological Conservation 125 (2005) 1–9
environmental representation between 2000 and 2050. A
qualitative assessment of the ARIDmap suggests at least
three areas with high value for multiple species (Fig. 4).
Predictably, these correspond to gaps in the existing re-
serve system, where habitat outside reserves is heavily de-
graded and is poorly represented in protected areas.
Implementation of the CAPE conservation planwould lead to significant improvements in the represen-
tation of environmental conditions. Areas selected for
implementation in Stages 1 (average RI: 148, maximum
RI: 9625) and 2 (average RI = 111, maximum RI: 3587)
have the greatest absolute value for bioclimatic repre-
Fig. 4. ARID scores for MAP across 301 Proteaceae species (see E
sentation (Fig. 5). However, relatively high value areas
are available in every implementation stage. The combi-
nation of relatively high value and large area mean that
the greatest improvements in representation occur with
the implementation of Stages 0 through 2 (Fig. 6).
Stages 3 through 6 yield only a 4.5% improvement in
average RI with the addition of 27,713 km2 (+67%)more habitat. Implementation of Stage 6 yields nearly
the best possible average RI for this region of �56
mm/year. The residual reflects region-wide representa-
tional differences that cannot be repaired with remaining
habitat under future climate conditions.
q. (1)). Circles highlight concentrations of high-value habitat.

0 1 2 3 4 5 6
050
100
150
Ave
rage
AR
ID (
mm
/yr)
CAPE implementation stage
0 1 2 3 4 5 6
020
0040
0060
0080
0010
000
Max
imum
AR
ID (
mm
/yr)
CAPE implementation stage
Fig. 5. ARID scores associated with CAPE conservation plan implementation stages: (a) average ARID value by stage and (b) maximum ARID
value by stage.
Total reserve area (km2)
Ave
rage
RI (
mm
/yr)
10000 20000 30000 40000 50000 60000 70000
-110
-100
-90
-80
-70
-60
1
0
2 3 4 56
Fig. 6. Improvement in average RI for all 301 Proteaceae species with increasing reserve area. The points are labeled by their CAPE plan
implementation stage.
C.R. Pyke et al. / Biological Conservation 125 (2005) 1–9 7
4. Discussion
The CFR�s relatively extensive reserve system pro-vides reasonably good environmental representation to-
day. However, its modest bioclimatic biases are likely to
be exacerbated by climate change and species responses.
For most Proteaceae species, this means that environ-
mental representation within protected areas will be-
come more biased in the future. Repairing these biasesnow, while opportunities still exist for conservation of
suitable habitat and environmental conditions, will cre-
ate a more robust biophysical foundation for population

8 C.R. Pyke et al. / Biological Conservation 125 (2005) 1–9
and community processes and increase the likelihood
that the region�s ecosystems respond more predictably
to climate change (Pyke, 2004).
The methods we present are general, but they are lim-
ited by the assumptions and uncertainties of the under-
lying data. The approach is sensitive to uncertainty inclimate change projections and in modeled species re-
sponses, as well as to the spatial grain of climate data,
the extent of the study area, and the choice of climatic
and habitat baselines. Despite these caveats, improving
proportional environmental representation in reserve
networks will almost always enhance biodiversity con-
servation strategies. The most effective strategy will re-
duce biases with respect to existing climate, while alsoseeking opportunities to safeguard conditions that may
become rare in the future. Opportunities to improve bio-
climatic representation can only diminish over time with
increasing habitat loss.
In the CFR, areas with high value for bioclimatic rep-
resentation are strongly associated with areas identified
as high priorities for biodiversity conservation. Our re-
sults indicate that implementing Stages 1 and 2 of theCAPE conservation plan will substantially improve bio-
climatic representation within reserves. These stages fo-
cus on areas with high value for bioclimatic
representation, and also contain underrepresented eco-
logical conditions (e.g., ecotones and edaphic gradients)
and irreplaceable distributions of Proteaceae. The per-
formance of representation deficit scores like ARID
might be improved with the addition of measures ofother environmental variables such as soils or geomor-
phology to provide a more fine-grained index of envi-
ronmental diversity.
Conserving biodiversity in a dynamic world requires
new strategies that go beyond static reserve siting meth-
ods (e.g., Meir et al., 2004) based on species representa-
tion objectives to focus on maintaining suitable
conditions for long-term species persistence, despitechanges in climate and large-scale habitat loss. We have
demonstrated that it is possible to identify areas where
conservation action can mitigate existing representa-
tional biases in environmental conditions and increase
opportunities for species to adapt to future conditions,
without sacrificing current biodiversity representation
goals.
Acknowledgements
This work was supported by The Nature Conser-
vancy�s David H. Smith Fellows Program (CRP), the
National Center for Ecological Analysis and Synthesis
at the University of California, Santa Barbara (NSF
grant DEB-0072909), by NSF grant DEB-0074676(SJA), the Climate Change Research Program, Center
for Applied Biodiversity Science, Conservation Inter-
national, and Thomas Lacher from the Caesar Kle-
berg Chair in Wildlife Ecology at Texas A&M
University. We thank L. Hannah, R. Cowling, and
two anonymous reviewers for comments on the
manuscript.
References
Andelman, S.J., Willig, M.R., 2003. Present patterns and future
prospects for biodiversity in the Western Hemisphere. Ecology
Letters 6, 818–824.
Camm, J.D., Norman, S.K., Polasky, S., Solow, A.R., 2002. Nature
reserve selection to maximize expected species coverage. Opera-
tions Research 50, 946–955.
Cowling, R.M., Rundel, P.W., Lamont, B.B., Arroyo, M.K., Arian-
outsou, M., 1996. Plant diversity in Mediterranean-climate regions.
Trends in Ecol and Evol 11, 362–366.
Cowling, R.M., Pressey, R.L., Rouget, M., Lowbard, A.T., 2003. A
conservation plan for a global biodiversity hotspot – the Cape
Floristic Region, South Africa. Biological Conservation 112, 191–
216.
Davis, A.J., Jenkinson, L.S., Lawton, J.H., Shorrocks, B., Woods, S.,
1998. Making mistakes when predicting shifts in species range in
response to global warming. Nature 391, 783–786.
ESRI, 2002. ArcGIS. ESRI, Redlands, CA.
Faith, D.P., Walker, P.A., 1996. Environmental diversity: on the
best-possible use of surrogate data for assessing the relative
biodiversity of sets of areas. Biodiversity and Conservation 5,
399–415.
Gelderblom, C.M. et al., 2003. Turning strategy into action: imple-
menting a conservation action plan in the Cape Floristic Region.
Biological Conservation 112, 291–297.
Goodchild, M.F., 1986. Spatial Autocorrelation Catmog 47. Geo
Books, Norwich.
Hilton-Taylor, C., 1996. Red Data List of Southern African Plants.
National Botanical Institute, Pretoria, South Africa.
IUCN, 2000. IUCN Red List of Threatened Species. IUCN, Gland,
Switzerland.
Koenig, W.D., 1999. Spatial autocorrelation of ecological phenomena.
TREE 14, 22–26.
Margules, C.R., Pressey, R.L., 2000. Systematic conservation plan-
ning. Nature 405, 243–253.
Meir, E., Andelman, S.J., Possingham, H.P., 2004. Does conservation
planning matter in a dynamic and uncertain world. Ecology Letters
11, 615–622.
Midgley, G.F., Hannah, L., Millar, D., Rutherford, M.C., Powrie,
L.W., 2002. Assessing the vulernability of species richness to
anthropogenic climate change in a biodiversity hotspot. Global
Ecology & Biogeography 11, 445–451.
Midgley, G.F., Hannah, L., Millar, D., Thuiller, W., Booth, A., 2003.
Developing regional and species-level assessments of climate
change impacts on biodiversity in the Cape Floristic Region.
Biological Conservation 112, 87–93.
Noss, R.F., 2001. Beyond Kyoto: Forest management in a time of
rapid climate change. Conservation Biology 15, 578–590.
Pearson, R.G., Dawson, T.P., 2003. Predicting the impacts of
climate change on the distribution of species: are bioclimatic
envelope models useful?. Global Ecology and Biogeography 12,
361–371.
Pearson, R.G., Dawson, T.P., Berry, P.M., Harrison, P.A., 2002.
SPECIES: a spatial evaluation of climate impact on the envelope of
species. Ecological Modelling 154, 289–300.
Pyke, C.R., 2004. Habitat loss confounds climate change impacts.
Frontiers in Ecology and the Environment 2, 178–182.
C.R. Pyke et al. / Biological Conservation 125 (2005) 1–9 9
Pyke, C.R., 2005. Interactions between habitat loss and climate
change: Implications for fairy shrimp in the Central Valley of
California. Climatic Change 121 (3), 429–441.
Pyke, C.R., Fischer, D.T., 2005. Selection of bioclimatically represen-
tative biological reserve systems under climatic change. Biological
Conservation 121 (3), 429–441.
Rodrigues, A.L., Andelman, S.J., Bakarr, M.I., Boitani, L., Brooks,
T.M., Cowling, R.M., Fishpool, L.D.C., da Fonseca, G., Gaston,
K.J., Hoffmann, M., Long, J., Marquet, P.A., Pilgrim, J.D.,
Pressey, R.L., Schipper, J., Sechrest, W., Stuart, S.N., Underhill,
L.G., Waller, R.W., Watts, M.E.J., Yan, X., 2004. Effectiveness of
the global protected area network in representing species diversity.
Nature 428, 640–643.
Rouget, M., Cowling, R.M., Pressey, R.L., Richardson, D.M.,
2003a. Identifying spatial components of ecological and evolu-
tionary processes for regional conservation planning in the Cape
Floristic Region, South Africa. Diversity and Distributions 9,
191–210.
Rouget, M., Richardson, D.M., Cowling, R.M., 2003b. The current
configuration of protected areas in the Cape Floristic Region,
South Africa – reservation bias and representation of biodiversity
patterns and processes. Biological Conservation 112, 129–145.
Schulze, R.E., 1997. South African Atlas of Agrohydrology and
Climatology. Report TT82/96, Water Resource Commission,
Pretoria, South Africa.
Schulze, R.E., Perks, L.A., 1999. Assessment of the impact of climate.
Final report to the South African Country Studies Climate Change
Programme. School of Bioresources Engineering and Environmen-
tal Hydrology, University of Natal, Pietermaritzburg, South
Africa.
Scott, J. et al., 2001. Nature reserves: Do they capture the full range of
America�s biological diversity?.EcologicalApplications11, 999–1007.
Thuller, W., 2003. BIOMOD – optimizing predictions of species
distributions and projecting potential future shifts under global
change. Global Change Biology 9, 1353–1362.
WCMC, 2002. The 2002 IUCN Plant Red Data Book, World
Conservation Monitoring Centre – IUCN, Gland, Switzerland.
Wimberly, M., Spies, T., Long, C., Whitlock, C., 2000. Simulating
historical variability in the amount of old forests in the Oregon
Coast Range. Conservation Biology 14, 167–180.
Related Documents