Welcome message from author
This document is posted to help you gain knowledge. Please leave a comment to let me know what you think about it! Share it to your friends and learn new things together.
Transcript
Citation: Milburn, S. A., M. Bourdaghs, and J. J. Husveth. Floristic Quality Assessment for Minnesota Wetlands.
Minnesota Pollution Control Agency, St. Paul, Minn. Cover designed by Jason Husveth. Cover photos by Melissa Arikan (background) and Jason Husveth (close-ups of Eriophorum vaginatum var. spissum, Carex retrorsa, Kalmia polifolia, and Nymphaea odorata). A limited number of printed copies are available. To obtain a free, printed copy of this publication, call (651) 297-5569 or email: [email protected] To download an electronic copy of this publication go to:
www.pca.state.mn.us/water/biomonitoring/bio-wetlands.html This publication was printed on recycled paper containing 30% post consumer product and can be made available in other formats including, Braille, large type, computer disk, or audiotape, upon request.
Floristic Quality Assessment for
Minnesota Wetlands
Scott A. Milburn Critical Connections Ecological Services
14760 Oakhill Road Scandia, MN 55073
Michael Bourdaghs Environmental Analysis and Outcomes Division
Minnesota Pollution Control Agency 520 Lafayette Road N Saint Paul, MN 55155
Jason J. Husveth Critical Connections Ecological Services
14760 Oakhill Road Scandia, MN 55073
May 2007
wq-bwm2-01

Floristic Quality Assessment for Minnesota Wetlands
i
ACKNOWLEDGEMENTS Primary funding for this project was provided by the U.S. Environmental Protection Agency through a Clean Water Act Section 104(b)(3) Wetland Program Development Grant (CD-96545401-1) awarded to the Minnesota Pollution Control Agency. Norm Aaseng produced a synonymy between the Integrated Taxonomic Information System nomenclature used in the project and the nomenclature used by the Minnesota Department of Natural Resources with assistance from Stacey Olszewski. Ron Wieland assisted with synonymy between the wetland species list and the nomenclature used in surrounding states. Kelsey Larson and Jed Chesnut contributed to the production of the county distribution maps. Doug Norris provided statutory insight and review. Copy editing and format consulting was performed by Sam Brungardt. Special thanks go to Anita Cholewa and the University of Minnesota Herbarium for access to the herbarium database. We would also like to thank Gerould Wilhelm and John Taft for providing insight into the methodology. Finally, very special thanks to Mark Gernes, who helped envision this project many years ago and provided much logistical and technical assistance along the way. REVIEW PANEL C-value review panel members volunteered their time on this project. Without their effort and expertise this work could have not been possible.
Ken Arndt - Urban Forester William Bartodziej - Natural Resource Specialist, Ramsey Washington Metro Watershed District Paul Bockenstedt - Ecologist, Bonestroo, Rosene, Anderlik & Associates, Inc. Anita Cholewa - Curator, University of Minnesota Herbarium, Bell Museum of Natural History Rolf M. Dahle Otto Gockman Rhett Johnson - Adjunct Faculty, Department of Natural Resources, University of Minnesota Crookston Elizabeth Nixon - Plant Ecologist, Emmons & Olivier Resources Ken Powell - Permit Coordinator/Professional Wetland Scientist, Rice Creek Watershed District Gary Walton - Botanist Scott C. Zager - Plant Ecologist, Wildlands Ecological Services
MINNESOTA DEPARTMENT OF NATURAL RESOURCES REVIEW In addition to assistance with synonymy, staff from the County Biological Survey and Natural Heritage and Nongame Research Program at the Minnesota Department of Natural Resources provided C-value review through an interagency agreement with the Minnesota Pollution Control Agency. Carmen Converse, Supervisor of the County Biological Survey, facilitated this review.
Chel Anderson-Botanist/Plant Ecologist Robert Dana-Prairie Ecologist Lawson Gerdes-Northern Coordinator/Ecologist Lynden Gerdes-Botanist/Plant Ecologist Fred Harris-Plant Ecologist Karen Myhre-Botanist Welby Smith-Botanist
Floristic Quality Assessment for Minnesota Wetlands
ii
TABLE OF CONTENTS ACKNOWLEDGEMENTS .............................................................................................................................................i
REVIEW PANEL...........................................................................................................................................................i MINNESOTA DEPARTMENT OF NATURAL RESOURCES REVIEW .................................................................i
INTRODUCTION .......................................................................................................................................................... 1
Coefficients of Conservatism .............................................................................................................................. 2 Floristic Quality Index............................................................................................................................................ 3
METHODS ..................................................................................................................................................................... 3 Minnesota’s Wetland Species ............................................................................................................................. 3 Development of Coefficient of Conservatism Values .................................................................................. 5 Distribution Maps................................................................................................................................................... 6
PERFOMING A FLORISTIC QUALITY ASSESSMENT......................................................................................... 7 Data............................................................................................................................................................................ 7 Index Calculations.................................................................................................................................................. 8 Examples................................................................................................................................................................... 9
APPLICATION.............................................................................................................................................................11 Performance of FQA ............................................................................................................................................11 Potential Applications ........................................................................................................................................12 Sampling Considerations ..................................................................................................................................13 Community Type ..................................................................................................................................................14 Biogeography ........................................................................................................................................................15
FUTURE EFFORTS .....................................................................................................................................................17 LITERATURE CITED...................................................................................................................................................18 APPENDIX A: MINNESOTA’S WETLAND SPECIES..........................................................................................24 APPENDIX B: DISTRIBUTION ATLAS ..................................................................................................................56 APPENDIX C: SYNONYMY .................................................................................................................................. 137


Floristic Quality Assessment for Minnesota Wetlands-Introduction
1
INTRODUCTION Wetlands are a prevalent feature across the Minnesota landscape, occupying an estimated 9.3 million acres (www.dnr.state.mn.us/wetlands/index.html). This area, however, represents approximately only half of the pre-European settlement wetland acreage in the state (Anderson and Craig 1984). The majority of the historical wetland losses were due to draining and filling activities undertaken to increase the economic productivity of the land. In addition to the loss of wetland acres, many remaining wetlands have been negatively impacted by anthropogenic stressors (human caused external forcing factors that cause change to wetlands; Rapport et al. 1985, Detenbeck et al. 1999) resulting in a degradation of wetland quality. Examples of anthropogenic stressors to wetlands include hydrologic alterations (Wilcox 1995), nutrient enrichment (Kadlec and Bevis 1990), and competition or displacement from exotic invasive species (Galatowitsch et al. 1999). Recognition of the ecological importance of wetlands and loss of wetland acreage resulted in the no net loss policy initiated in the early 1990s at both the state and federal level. No net loss is enacted through a variety of mechanisms, such as Section 404 of the Federal Clean Water Act (CWA) and Minnesota’s Wetland Conservation Act (WCA), that regulate drain and fill activities. On agricultural lands, no net loss is also implemented through the ‘swampbuster’ provisions in the Food Security Act (i.e., Federal Farm Bill) that deny federal crop subsidies to landowners who drain or fill otherwise exempted wetlands on working lands. While no net loss is often referred to only in terms of wetland quantity (acres), the policy also clearly includes wetland quality. For example, a goal of the WCA is to “achieve no net loss in the quantity, quality, and biological diversity of Minnesota’s existing wetlands” (Minn. S. 103A 201). The WCA further establishes the goal to increase the quantity, quality, and biological diversity of Minnesota’s wetlands by restoring or enhancing diminished or drained wetlands. Likewise, the CWA requires states to monitor and assess their surface waters to determine whether they are meeting water-quality standards and providing beneficial uses (Section 305). Wetlands, by definition, are waters of the state (Minn. R. Ch. 7050) and are thus subject to the same requirements under the CWA as lakes and streams. This has created a need for tools that can be used to assess the quality of Minnesota’s wetlands. Two types of wetland assessment grew out of this demand to measure wetland quality based primarily on programmatic needs: functional and condition assessment. In general, functional assessment measures the ability of a wetland to provide goods and services, such as flood attenuation or wildlife habitat; whereas, condition assessment measures the deviation of a wetland from its natural state. Typically, these two approaches to wetland quality assessment have been viewed as being unrelated or competing methodologies, but in fact rely on many of the same concepts and are likely complementary (Stevenson and Hauer 2002). The regulatory process in Minnesota requires that wetland functions and values be maintained in a permitted drain or fill activity. This includes a mitigation sequencing approach that may call for a functional assessment. Several tools are available for functional assessment in the state, most notably the Minnesota Routine Assessment Methodology (MnRAM; MN BWSR 2006), which was developed to support goals in the WCA. Conversly, the Minnesota Pollution Control Agency (MPCA) has been developing plant and invertebrate Indices of Biological Integrity (IBIs) for depressional marsh wetland condition assessment in support of CWA goals of protecting surface water-quality (Gernes and Helgen 2002, Genet and Bourdaghs 2006). Both the MnRAM and the IBIs are valuable tools for measuring wetland quality, but each has limitations. MnRAM provides information on wetland functions and values that does not necessarily correlate well with measurements of wetland
Floristic Quality Assessment for Minnesota Wetlands-Introduction
2
condition. The IBIs provide measures of wetland condition but are limited to a narrow wetland type. Floristic Quality Assessment (FQA) is a tool that would serve to compliment these existing wetland assessment methods. FQA originated in an attempt to provide a uniform and repeatable method for assessing natural area quality of both uplands and wetlands in the Chicago region (Wilhelm 1977). Following refinement of concepts and methodology (Swink and Wilhelm 1994, Taft et al. 1997), the use of FQA rapidly expanded. To date, FQA has been developed in 10 states and one Canadian province: Illinois (Wilhelm 1977, Swink and Wilhelm 1994, Taft et al. 1997), Missouri (Ladd 1993), Ohio (Andreas and Lichvar 1995, Andreas et al. 2004), southern Ontario (Oldham et al. 1995), Michigan (Herman et al. 2001), North and South Dakota (NGPFQAP 2001), Wisconsin (Bernthal 2003), Indiana (Rothrock 2004), Florida (Cohen et al. 2004), and Mississippi (Herman et al. 2006). Because FQA has been shown in a number of studies to be a responsive and reliable indicator of wetland condition, it has potential to be useful in a variety of monitoring and assessment applications. We do not envision FQA as a replacement of existing wetland assessment methodologies or criteria, but rather present it as a tool that can be used to measure the quality of Minnesota’s wetlands that current assessments do not cover. Coefficients of Conservatism The concept of individual species conservatism, or fidelity, to natural habitats and communities is a fundamental principle in FQA. Through the evolutionary process, species develop life strategies and adaptations within communities or assemblages that better enable survival in relation to competition, stress, and disturbance (Grime 1974). It is assumed then that each plant species has a varying degree of tolerance to disturbance (either natural or anthropogenic in origin) and a varying fidelity to natural habitats. The Coefficient of Conservatism (C) value is simply a numerical rating of an individual species’ conservatism and habitat fidelity in relation to disturbance (Wilhelm 1977, Swink and Wilhelm 1994, Taft et al. 1997). C-values range from 0 to 10 and are assigned to each native species in a flora typically by an expert panel of botanists using best professional judgment. Non-native species are not assigned C-values as they were not present during the evolution of native species and local plant communities (Swink and Wilhelm 1994) though they may be included in index calculations with a value of 0. Species that are least conservative, or show the least fidelity to specific natural habitats, are assigned a value of 0; while 10 is reserved for those species that are most conservative. For example, Hordeum jubatum ssp. jubatum L. (Foxtail barley) is often found in disturbed places such as road ditches and has little fidelity to natural habitats. This species has been assigned a C-value of 0. Drosera anglica Huds. (English sundew), on the other hand, is restricted to undisturbed minerotrophic water tracks and spring-fed channels and has been assigned a C-value of 10. Assigning C-values to a local flora is a critical step in the development FQA for a region, as they are used in the core FQA indices. As with any natural resource quality assessment, FQA does include a degree of subjectivity. In this case, it enters into the process during C-value assignment, which requires best professional judgment. The subjectivity is thus placed “up front” in FQA (Swink and Wilhelm 1994, Herman et al. 2001) and controlled through a group decision-making process. Once the values have been assigned, FQA becomes a dispassionate and repeatable measure of ecological condition. Mushet et al. (2002) assessed the effect of subjectivity by comparing FQA results from panel- and data-derived C-values in North Dakota wetland complexes and found some differences in index scores. These
Floristic Quality Assessment for Minnesota Wetlands-Methods
3
differences, however, had little effect on the overall condition assessments and it was concluded that the panel-derived C-values were adequate. Floristic Quality Index A central measurement in FQA is the Floristic Quality Index (FQI), which is calculated by the following formula SCFQI = (1) where C is the mean C-value and S is the number of species, or species richness, occurring in the area that is being evaluated. The greater the C and FQI values, the greater is the condition (or closer to a natural state) of the evaluated area. C and S are also applied as stand-alone indices in FQA. FQI provides an additional measure that can be used to differentiate samples at either the same or different areas. For example, two sites may have the same C but different FQI scores and vice versa (Taft et al. 1997). Evaluating both indices allows for a greater understanding of an area’s condition. C and FQI can be expressed in different ways and have been found to vary due to a variety of factors. These indices can be computed by including or excluding introduced species (Taft et al. 1997, Herman et al. 2001) and by weighting C-values by abundance measures (Poling et al. 2003, Bourdaghs et al. 2006). Because FQI is essentially a weighted species richness index, sampling area or effort effects index scores due to the species-area relationship where species richness increases with area alone (Francis et al. 2000, Rooney and Rogers 2002, Matthews 2003, Bourdaghs et al. 2006). Values have also been found to vary due to the time of year the data are collected, plant community type, and knowledge of the surveyor (Rooney and Rogers 2002, Matthews 2003). The effects of these factors are discussed in detail in upcoming sections. METHODS Minnesota’s Wetland Species The first step was to define and compile the list of vascular wetland plants of Minnesota. Two key attributes were used to identify plants that belong on the list: (1) presence in Minnesota and (2) an adapted National Wetland Indicator (NWI) status (Reed 1988). Minnesota native status was also determined. This was necessary as only native species were assigned a C-value. Nomenclature follows the Integrated Taxonomic Information System (ITIS; www.itis.gov) which is a national standardized nomenclature source used in U.S. Environmental Protection Agency data-management systems. Development of the wetland species list was an iterative process that involved multiple levels of review by experienced botanists. Nomenclature and attribute (e.g., NWI status or growth habit) data were first compiled. All of the plant names recorded in the United States (approximately 60,000 records) were downloaded from ITIS. Attribute data for all species recorded as occurring in Minnesota (approximately 10,000 records) were downloaded from the Natural Resource Conservation Service’s PLANTS database (http://plants.usda.gov). These two data sets were joined and further refined by selecting only ITIS-accepted names. Quality-control checks revealed several issues that had to be resolved manually to further refine the flora. First, NWI status in PLANTS
Floristic Quality Assessment for Minnesota Wetlands-Methods
4
was not always tracked in a one:one manner from the original source due to nomenclature differences between PLANTS and Reed (1988). Species that did not have a direct NWI status were reviewed individually. PLANTS also had Minnesota presence reporting inaccuracies. Ownbey and Morley (1991), Gleason and Cronquist (1991), and the University of Minnesota Herbarium on-line database (http://biosci.cbs.umn.edu/herbarium/vascularplantpage2.htm) were used to verify presence and determine nativity in Minnesota. Finally, sub-specific classification (i.e., acceptance of varieties or subspecies) was also an issue. When ITIS accepts a sub-specific name(s), the parent name is also accepted, creating a dilemma of which name to choose as ‘most accepted’. All sub-specific classifications were reviewed using Ownbey and Morley (1991), Gleason and Cronquist (1991), Crow and Hellquist (1999a, 1999b) and the University of Wisconsin Madison on-line herbarium database (www.botany.wisc.edu/herbarium). Sub-specific names were accepted only if the names were broadly and consistently recognized in multiple treatments and taxonomic keys that directly identify the sub-specific taxon were available. These four components (NWI status, Minnesota presence and nativity, and sub-specific classification) were reviewed simultaneously and resulted in a first-draft wetland species list (MN Wetlist 1.1). The list was then reviewed by staff from the Minnesota Department of Natural Resources (MN DNR) County Biological Survey. More than 100 errors were identified and corrected to make MN Wetlist 1.2. A review was then conducted to detect false negatives (i.e., plants that occur in Minnesota wetlands but are not on established lists) and approximately 30 species were added to create MN Wetlist 1.3. MN Wetlist 1.3 was the primary list used to develop the C-values. However, during C-value assignment, a handful of errors were detected, resulting in the final list (MN Wetlist 1.4), which is provided in Appendix A. MN Wetlist 1.4 includes 1,108 native and 158 introduced wetland taxa (Appendix A). The majority of the taxa are species, but there are substantial numbers of subspecies and varieties (which will hereby be referred to generally as species). Species were included in the list if they had a wetland indicator status of FACU- or wetter. Wetland indicator status that differs from what is exactly reported in Reed (1988), because of nomenclature differences or a wetland indicator status was created or revised based on local observations, are noted in brackets. It should be made clear that the wetland indicators listed in Appendix A were adapted from Reed (1988) for the purpose of identifying wetland species and should not, under any circumstances, be used for jurisdictional wetland delineation. Species that appear on Minnesota’s List of Endangered, Threatened, and Special Concern Species (MN DNR 1996) were also denoted. As with the wetland indicators, brackets were used to indicate species that are synonyms of names on the state list. Caution should be used with bracketed designations as nomenclature differences may be obscuring whether the species is truly on the Minnesota list. For example, the state list includes Carex katadinensis Fern. as a Threatened species. ITIS, in agreement with Gleason and Cronquist (1991) and the Flora of North America (FNAEC 2002), has lumped C. katadinensis with the more common Carex conoidea Schkuhr ex Willd.; thereby creating a conflict between nomenclatures, where some populations of C. conoidea (according to ITIS) would be considered threatened (according to the current state list). To facilitate greater use, a thorough synonymy was also developed and is provided in Appendix C. Finally, while our goal was to achieve the highest accuracy possible, it should be noted that MN Wetlist 1.4 is a working list of wetland species in the state and not the definitive Minnesota wetland flora. It is anticipated that the list will be reviewed periodically to update taxonomy, nomenclature, and other attributes.

Floristic Quality Assessment for Minnesota Wetlands-Methods
5
Development of Coefficient of Conservatism Values C-values were assigned to all of the Minnesota native wetland species on a statewide level. A potential problem with treating species as such is that many vary in terms of conservatism regionally in the state. This was resolved by assigning C-values that typically represent the species statewide. For example, Calamagrostis canadensis (Michx.) Beauv. (Bluejoint) is a common species occurring throughout the state. In the Northeast, C. canadensis occupies upland as well as wetland habitats; whereas in the South and West, it is typically restricted to relatively undisturbed wet meadow wetlands. The conservatism of C. canadensis to specific habitats would therefore be relatively less in the Northeast and would increase in the South and West. A more marked example is Abies balsamea (L.) P. Mill. (Balsam fir), which is widespread in the northern half of the state, inhabiting a variety of communities from forested peatlands to fire-dependent forests but is narrowly restricted to the Southern Algific Talus Slope community type in southeastern Minnesota (MN DNR 2005a). Both of these species were assigned a statewide C-value of 4. Assigning C-values according to some ecologically meaningful geographic unit may improve the accuracy of FQA (Bourdaghs et al. 2006) but was outside the scope of this project.
Table 1. C-value assignment narrative guidance (adapted from Andreas et al. 2004).
C-value Description
0
Plants with a wide range of ecological tolerances. Often these plants are opportunistic invaders of natural communities (e.g. Phalaris arundinacea) or native species typical of disturbed or ruderal communities (e.g., Ambrosia artemisiifolia or Hordeum jubatum ssp. jubatum)
1-2 Widespread taxa that are not typical of a particular community (e.g., Impatiens capensis or Acer negundo)
3-5 Plants with an intermediate range of ecological tolerances that typify a stable phase of some native communities, but persist under some disturbance (e.g., Carex comosa or Potamogeton richardsonii)
6-8 Plants with a moderately narrow range of ecological tolerances that typify stable or late successional native plant communities (e.g., Epilobium leptophyllum or Vallisneria americana)
9-10 Plants with a narrow range of ecological tolerances that exhibit very high fidelity to a narrow range of stable habitat requirements (e.g., Arethusa bulbosa or Salix candida)
C-value assignment followed the narrative guidance developed by Andreas et al. (2004) listed in Table 1. The rareness of a species was not a factor for assigning C. As with the development of the wetland species list, C-value assignment followed an iterative process, where several drafts of values were prepared and subsequently reviewed. The initial draft C-values were assigned by a limited number of personnel and based on a combination of field experience, information from herbarium records, and C-values from adjacent states. We were fortunate to have a wealth of information from other states to guide initial assignment as Minnesota is the last of the Upper-Midwest states to develop C-values (researchers in Iowa have produced draft C-values;
Floristic Quality Assessment for Minnesota Wetlands-Methods
6
www.public.iastate.edu/~herbarium/coeffici.html). During this process, each taxon was further assigned a rating of I-III that reflected the degree of confidence in the initial assignment, with I being the greatest level of confidence. The confidence ratings were used to prioritize review. Initial draft C-values were then distributed to a volunteer panel of botanical experts that had cumulative experience statewide for review. The panel included members from academia, local government, and the private sector. Panel members were asked to review the initial values according to the guidelines in Table 1 for only the species with which they were familiar. Panel members provided their own values and comments. A second draft of C-values based on averages from the initial draft and the panel recommendations was then produced. Finally, the second draft values were reviewed by botanical experts from the County Biological Survey and Natural Heritage and Nongame Research Program at the MN DNR. Again, MN DNR staff reviewed draft C-values according to the guidelines in Table 1 and provided their own values for each species. Values were accepted as final when a species’ C-value from the second draft agreed with the values from MN DNR. If the C-values differed, the situation was resolved by further discussion with MN DNR staff and/or review of commentary provided by the review panel. The final C-values are listed in Appendix A. The C-value distribution of the native wetland species in Minnesota was slightly skewed towards the more conservative end of the scale, where the range of 5 to 8 accounted for more than half of the distribution (Figure 1). This was reflected in the overall native wetland species C (5.9) and median (6). Introduced species also made up a substantial portion of the overall Minnesota wetland species list at 12.5% (Figure 1). The frequency of species found on Minnesota’s List of Endangered, Threatened, and Special Concern Species (MN DNR 1996), however, increased with C (Figure 1). In all, 148 of the 244 vascular plant species that are state listed were included in MN Wetlist 1.4 and 39.2% of those were assigned C-values of 10. As previously mentioned, however, rarity had no bearing on C-value assignment even though many rare species had high C-values. For example, Carex annectens (Bickn.) Bickn. is a Special Concern species and was assigned a C-value of 3. According to records at the University of Minnesota Herbarium, this species is found in a number of habitats from old pasture to wet prairie. Malaxis paludosa (L.) Sw., on the other hand, is listed as Endangered and known only to inhabit undisturbed northern rich spruce swamps. M. paludosa was therefore assigned a 10. Distribution Maps In addition to assigning C-values, an effort was undertaken to produce distribution maps for Minnesota’s wetland species. This was done because a significant number of additional plant specimens have been collected since the most recent species-mapping effort was published for Minnesota (Ownbey and Morley 1991) and because updated maps would provide a valuable resource for the continued study of the state’s flora. The availability of electronic plant distribution data combined with GIS applications were key factors that facilitated this effort. Specimen county records from the University of Minnesota Herbarium were used to produce the distribution maps. Thus, the maps indicate presence or absence at the county level, as opposed to Ownbey and Morley (1991) where the locality of individual plant populations were mapped. Nomenclature differences between ITIS and the University of Minnesota data were resolved

Floristic Quality Assessment for Minnesota Wetlands-Performing a Floristic Quality Assessment
7
Figure 1. Frequency distribution of C-value assignments for Minnesota’s native wetland taxa, introduced species (*), and state listed taxa. The percentage of the overall wetland species list is given above each category and the number of state listed species is given above the black bars.
according to ITIS synonymy. An ArcView™ GIS script was written to produce the maps. Distribution maps were created for all 1,266 wetland species and are provided in Appendix B. PERFOMING A FLORISTIC QUALITY ASSESSMENT Data Any wetland plant data can be used in FQA as long as plants are confidently identified to the taxonomic level that the C-values are assigned to. Plants which cannot be identified to the correct level should be excluded from FQA as C-values are not assigned for taxonomic divisions above species. Data can be from quantitative plot-based sampling or surveys where only the species name is recorded. Caution should be taken, however, to only compare results that used consistent sampling methodologies as sampling area/effort has a significant effect on some FQA indices (see Sampling Considerations on page 13). In addition, a description of the general plant community and the biogeographical region should be noted as these will help place FQA results in the proper context (see Community Type and Biogeography on pages 14-15). Once the plant data have been compiled, the C-values and attributes from MN Wetlist 1.4 (Appendix A) can be related to the data and the various FQA indices can be computed.
0
20
40
60
80
100
120
140
160
180
* 0 1 2 3 4 5 6 7 8 9 10
Coefficient of Conservatism
Num
ber o
f Tax
a
Unlisted Taxa
Listed Taxa12.5% 11.6%
12.6%12.2% 12.0%
7.3% 6.7%
2.4%
4.0%
6.6%
9.7%
2.2%
3 3 611 15
2230
58
Floristic Quality Assessment for Minnesota Wetlands-Performing a Floristic Quality Assessment
8
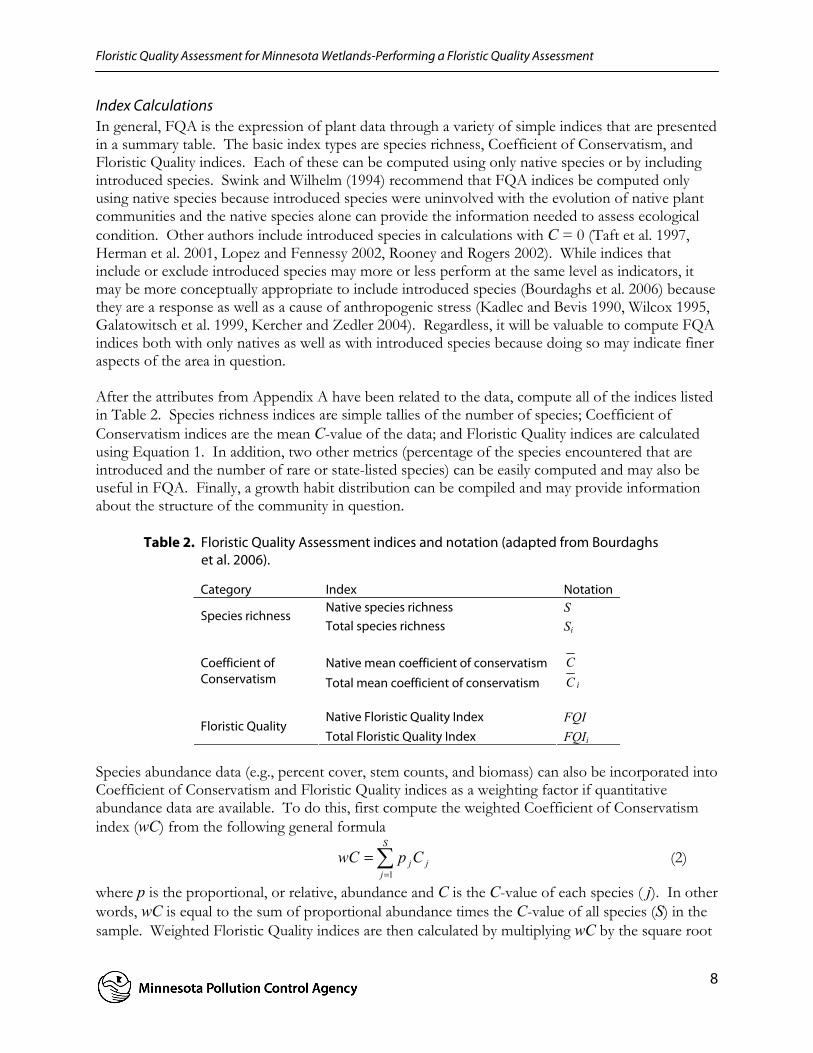
Index Calculations In general, FQA is the expression of plant data through a variety of simple indices that are presented in a summary table. The basic index types are species richness, Coefficient of Conservatism, and Floristic Quality indices. Each of these can be computed using only native species or by including introduced species. Swink and Wilhelm (1994) recommend that FQA indices be computed only using native species because introduced species were uninvolved with the evolution of native plant communities and the native species alone can provide the information needed to assess ecological condition. Other authors include introduced species in calculations with C = 0 (Taft et al. 1997, Herman et al. 2001, Lopez and Fennessy 2002, Rooney and Rogers 2002). While indices that include or exclude introduced species may more or less perform at the same level as indicators, it may be more conceptually appropriate to include introduced species (Bourdaghs et al. 2006) because they are a response as well as a cause of anthropogenic stress (Kadlec and Bevis 1990, Wilcox 1995, Galatowitsch et al. 1999, Kercher and Zedler 2004). Regardless, it will be valuable to compute FQA indices both with only natives as well as with introduced species because doing so may indicate finer aspects of the area in question. After the attributes from Appendix A have been related to the data, compute all of the indices listed in Table 2. Species richness indices are simple tallies of the number of species; Coefficient of Conservatism indices are the mean C-value of the data; and Floristic Quality indices are calculated using Equation 1. In addition, two other metrics (percentage of the species encountered that are introduced and the number of rare or state-listed species) can be easily computed and may also be useful in FQA. Finally, a growth habit distribution can be compiled and may provide information about the structure of the community in question.
Table 2. Floristic Quality Assessment indices and notation (adapted from Bourdaghs et al. 2006).
Category Index Notation
Native species richness S Species richness
Total species richness Si
Native mean coefficient of conservatism C Coefficient of Conservatism Total mean coefficient of conservatism iC
Native Floristic Quality Index FQI Floristic Quality
Total Floristic Quality Index FQIi Species abundance data (e.g., percent cover, stem counts, and biomass) can also be incorporated into Coefficient of Conservatism and Floristic Quality indices as a weighting factor if quantitative abundance data are available. To do this, first compute the weighted Coefficient of Conservatism index (wC) from the following general formula
∑=
=S
jjjCpwC
1 (2)
where p is the proportional, or relative, abundance and C is the C-value of each species ( j). In other words, wC is equal to the sum of proportional abundance times the C-value of all species (S) in the sample. Weighted Floristic Quality indices are then calculated by multiplying wC by the square root
Floristic Quality Assessment for Minnesota Wetlands-Performing a Floristic Quality Assessment
9
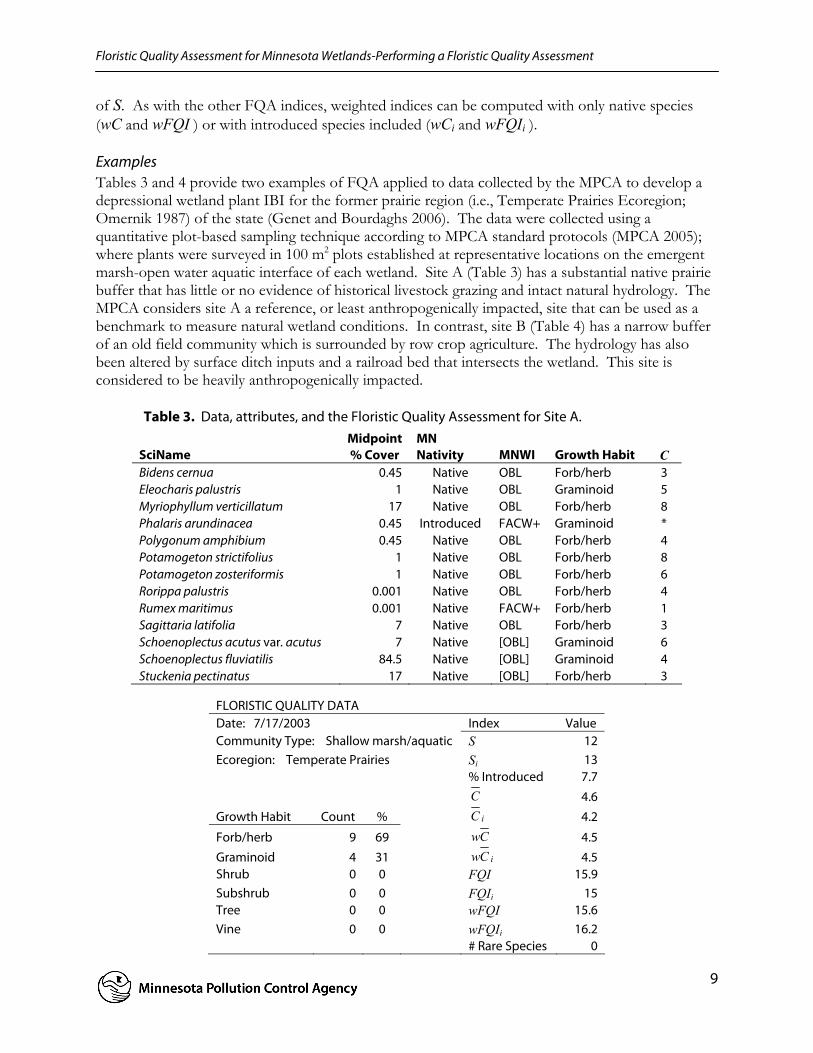
of S. As with the other FQA indices, weighted indices can be computed with only native species (wC and wFQI ) or with introduced species included (wCi and wFQIi ). Examples Tables 3 and 4 provide two examples of FQA applied to data collected by the MPCA to develop a depressional wetland plant IBI for the former prairie region (i.e., Temperate Prairies Ecoregion; Omernik 1987) of the state (Genet and Bourdaghs 2006). The data were collected using a quantitative plot-based sampling technique according to MPCA standard protocols (MPCA 2005); where plants were surveyed in 100 m2 plots established at representative locations on the emergent marsh-open water aquatic interface of each wetland. Site A (Table 3) has a substantial native prairie buffer that has little or no evidence of historical livestock grazing and intact natural hydrology. The MPCA considers site A a reference, or least anthropogenically impacted, site that can be used as a benchmark to measure natural wetland conditions. In contrast, site B (Table 4) has a narrow buffer of an old field community which is surrounded by row crop agriculture. The hydrology has also been altered by surface ditch inputs and a railroad bed that intersects the wetland. This site is considered to be heavily anthropogenically impacted.
Table 3. Data, attributes, and the Floristic Quality Assessment for Site A.
SciName Midpoint % Cover
MN Nativity MNWI Growth Habit C
Bidens cernua 0.45 Native OBL Forb/herb 3 Eleocharis palustris 1 Native OBL Graminoid 5 Myriophyllum verticillatum 17 Native OBL Forb/herb 8 Phalaris arundinacea 0.45 Introduced FACW+ Graminoid * Polygonum amphibium 0.45 Native OBL Forb/herb 4 Potamogeton strictifolius 1 Native OBL Forb/herb 8 Potamogeton zosteriformis 1 Native OBL Forb/herb 6 Rorippa palustris 0.001 Native OBL Forb/herb 4 Rumex maritimus 0.001 Native FACW+ Forb/herb 1 Sagittaria latifolia 7 Native OBL Forb/herb 3 Schoenoplectus acutus var. acutus 7 Native [OBL] Graminoid 6 Schoenoplectus fluviatilis 84.5 Native [OBL] Graminoid 4 Stuckenia pectinatus 17 Native [OBL] Forb/herb 3
FLORISTIC QUALITY DATA Date: 7/17/2003 Index Value Community Type: Shallow marsh/aquatic S 12 Ecoregion: Temperate Prairies Si 13 % Introduced 7.7
C 4.6 Growth Habit Count % iC 4.2
Forb/herb 9 69 Cw 4.5 Graminoid 4 31 iCw 4.5 Shrub 0 0 FQI 15.9 Subshrub 0 0 FQIi 15 Tree 0 0 wFQI 15.6 Vine 0 0 wFQIi 16.2 # Rare Species 0
Floristic Quality Assessment for Minnesota Wetlands-Performing a Floristic Quality Assessment
10
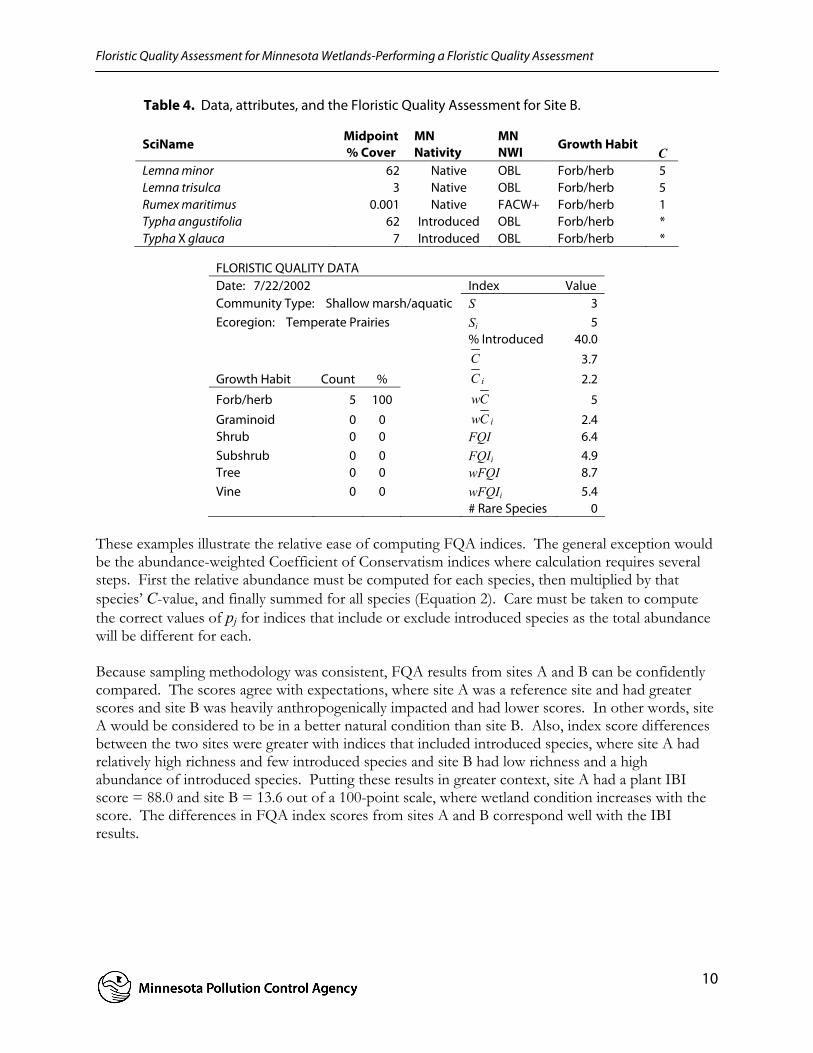
Table 4. Data, attributes, and the Floristic Quality Assessment for Site B.
SciName Midpoint % Cover
MN Nativity
MN NWI
Growth Habit C
Lemna minor 62 Native OBL Forb/herb 5 Lemna trisulca 3 Native OBL Forb/herb 5 Rumex maritimus 0.001 Native FACW+ Forb/herb 1 Typha angustifolia 62 Introduced OBL Forb/herb * Typha X glauca 7 Introduced OBL Forb/herb *
FLORISTIC QUALITY DATA Date: 7/22/2002 Index Value Community Type: Shallow marsh/aquatic S 3 Ecoregion: Temperate Prairies Si 5 % Introduced 40.0
C 3.7 Growth Habit Count % iC 2.2
Forb/herb 5 100 Cw 5 Graminoid 0 0 iCw 2.4 Shrub 0 0 FQI 6.4 Subshrub 0 0 FQIi 4.9 Tree 0 0 wFQI 8.7 Vine 0 0 wFQIi 5.4 # Rare Species 0
These examples illustrate the relative ease of computing FQA indices. The general exception would be the abundance-weighted Coefficient of Conservatism indices where calculation requires several steps. First the relative abundance must be computed for each species, then multiplied by that species’ C-value, and finally summed for all species (Equation 2). Care must be taken to compute the correct values of pj for indices that include or exclude introduced species as the total abundance will be different for each. Because sampling methodology was consistent, FQA results from sites A and B can be confidently compared. The scores agree with expectations, where site A was a reference site and had greater scores and site B was heavily anthropogenically impacted and had lower scores. In other words, site A would be considered to be in a better natural condition than site B. Also, index score differences between the two sites were greater with indices that included introduced species, where site A had relatively high richness and few introduced species and site B had low richness and a high abundance of introduced species. Putting these results in greater context, site A had a plant IBI score = 88.0 and site B = 13.6 out of a 100-point scale, where wetland condition increases with the score. The differences in FQA index scores from sites A and B correspond well with the IBI results.
Floristic Quality Assessment for Minnesota Wetlands-Application
11
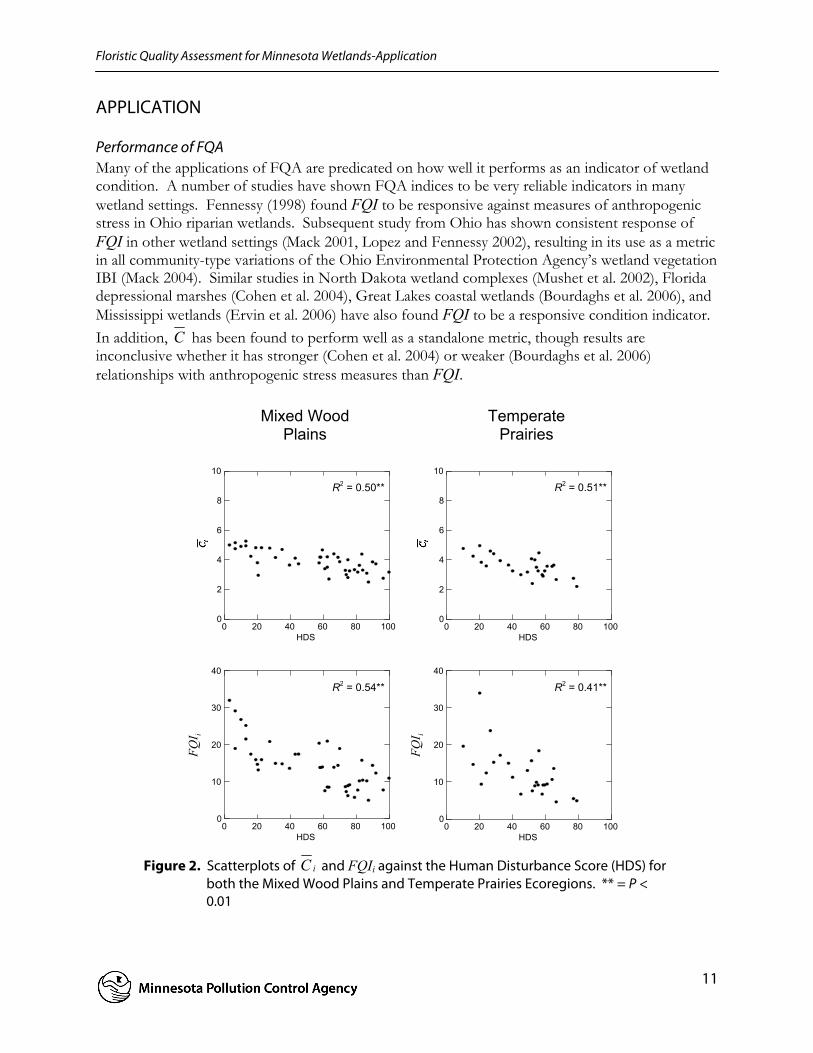
APPLICATION Performance of FQA Many of the applications of FQA are predicated on how well it performs as an indicator of wetland condition. A number of studies have shown FQA indices to be very reliable indicators in many wetland settings. Fennessy (1998) found FQI to be responsive against measures of anthropogenic stress in Ohio riparian wetlands. Subsequent study from Ohio has shown consistent response of FQI in other wetland settings (Mack 2001, Lopez and Fennessy 2002), resulting in its use as a metric in all community-type variations of the Ohio Environmental Protection Agency’s wetland vegetation IBI (Mack 2004). Similar studies in North Dakota wetland complexes (Mushet et al. 2002), Florida depressional marshes (Cohen et al. 2004), Great Lakes coastal wetlands (Bourdaghs et al. 2006), and Mississippi wetlands (Ervin et al. 2006) have also found FQI to be a responsive condition indicator. In addition, C has been found to perform well as a standalone metric, though results are inconclusive whether it has stronger (Cohen et al. 2004) or weaker (Bourdaghs et al. 2006) relationships with anthropogenic stress measures than FQI.
Figure 2. Scatterplots of iC and FQIi against the Human Disturbance Score (HDS) for
both the Mixed Wood Plains and Temperate Prairies Ecoregions. ** = P < 0.01
Mixed Wood Plains
Temperate Prairies
0 20 40 60 80 100HDS
0
2
4
6
8
10
Ci
R2 = 0.51**
0 20 40 60 80 100HDS
0
2
4
6
8
10
Ci
R2 = 0.50**
0 20 40 60 80 100HDS
0
10
20
30
40
FQIi
R2 = 0.54**
0 20 40 60 80 100HDS
0
10
20
30
40
FQIi
R2 = 0.41**
FQI i
FQI i
Floristic Quality Assessment for Minnesota Wetlands-Application
12
To develop depressional wetland IBIs in Minnesota, the MPCA has performed similar analyses of plant community metrics against measures of anthropogenic stress, where sites were selected along a gradient from least to heavily anthropogenically impacted (Gernes and Helgen 2002, Genet and Bourdaghs 2006). Applying iC and FQIi to data collected from the Mixed Wood Plains and Temperate Prairies Ecoregions (Omernik 1987) shows strong relationships with the Human Disturbance Score (HDS; Figure 2). HDS is a semiquantitative anthropogenic disturbance measurement that consists of five factors (buffer landscape disturbance, landscape influence, habitat alteration, hydrologic alteration, and chemical pollution) that are assessed using best professional judgment following consistent narrative standards and assigned numerical scores and summed. Overall, iC and FQIi performed at approximately the same level; neither measure had consistently stronger responses with HDS (Figure 2). iC and FQIi also performed at approximately the same level as the IBIs developed for each Ecoregion (Mixed Wood Plains IBI R2 with HDS = 0.48, Temperate Prairies R2 with HDS = 0.51). While this evaluation of FQA indices was limited to depressional marshes, it is likely that similar analyses in other wetland types in the state will reveal comparable results given its record of consistent performance. Potential Applications FQA has a number of potential applications because of its reliability as a condition indicator. These include ambient status and trends monitoring; regulatory monitoring (e.g., sequencing and measuring compensatory mitigation success); measuring wetland creation, restoration, and enhancement success; natural areas assessment; wastewater discharge monitoring; as well as a number of research applications. Three of these examples are given below in greater detail to illustrate the potential use of FQA:
• Natural Areas Assessment: The original purpose of FQA was for the identification of high- quality remnant natural areas in the Chicago region (Wilhelm 1977). In Minnesota, FQA can provide a quantitative assessment that complements existing methodologies already used to identify and monitor natural areas. For example, MN DNR plant ecologists use an assessment called the Element Occurrence Ranking (EOR) to identify significant natural areas. Both FQA and EOR include a degree of subjectivity where the assessment relies on best professional judgment on some level. With FQA, subjectivity enters into the process when assigning the C-values; after which it becomes a repeatable and objective measure of condition. Individual EOR assessments, however, are made using best professional judgment following consistent guidance. While EOR guidance is consistent, interpretations as to the quality of an individual site may differ between ecologists. FQA, in this case for only wetlands, could provide an accompanying source of information to EOR assessments.
• Status and Trends Monitoring: The MPCA has completed a probabilistic survey of wetland
condition in the Redwood River watershed in southwestern Minnesota (Genet and Olsen 2006). Depressional wetlands were randomly selected and assessed using IBIs. Therefore, estimates of wetland condition for all of the depressional wetlands in the watershed could be made. In the future, the MPCA plans to further apply probabilistic surveys to assess the overall status and trends of ambient wetland quality across broader regions and ultimately statewide (MCWAMMSSC 2006). The existing IBIs, however, were developed specifically for depressional wetlands with marsh/open water plant communities (Gernes and Helgen 2002, Genet and Bourdaghs 2006). With additional development of standard sampling methodologies and performance criteria, FQA could be used to expand beyond the current

Floristic Quality Assessment for Minnesota Wetlands-Application
13
scope of the IBIs, facilitating wetland condition status and trends monitoring for all wetland types in Minnesota.
• Regulatory Usage: As mentioned in the introduction, regulatory wetland actions in Minnesota
often include a functional assessment and the most used assessment tool is MnRAM. MnRAM is essentially a series of questions that are answered using best professional judgment following consistent guidance. The answers are then fed into a series of mathematical models that produce scores for 11 to 14 categories of wetland functions and values similar to Hydrogeomorphic (HGM) wetland assessment (Brinson et al. 1995). While MnRAM was designed to measure wetland functions and values, there are conflicting reports as to whether certain MnRAM functions can also be used as a measure of wetland condition. Two studies have found little to no correlation between MnRAM functions and existing wetland condition measures (Fennessy et al. 2004, Genet et al. 2006) but another found strong relationships between the MPCA plant IBI and the Vegetation Diversity/Integrity function (Joyal 2005). Regardless of the final analysis, FQA could complement MnRAM by providing a reliable and more objective measure of wetland condition.
The Chicago District of the U.S. Army Corps of Engineers has applied FQA in its CWA Section 404 program, where it is used to identify high-quality wetlands and measure mitigation success (www.lrc.usace.army.mil/co-r/mitgr.htm). Wetlands that are identified as high quality by FQA may require greater mitigation ratios for a permitted impact or the impact may be deemed unmitigable and the permit would be denied. On the other end, mitigation wetlands are required to have a FQI ≥ 20 or C ≥ 3.5 within five years to be in compliance. If the mitigation fails these standards, the permit may be suspended or revoked and enforcement action may be undertaken.
Sampling Considerations Users should be aware that several methodological factors can affect FQA indices. By recognizing and controlling these factors, their effect can be minimized, allowing for greater FQA accuracy. While FQA is relatively simple, both conceptually as well computationally, it is not a substitute for botanical knowledge. The greater the number of misidentified species and plants that cannot be identified to the species level in the sample, the more inaccurate FQA indices become. Rooney and Rogers (2002) examined the effect of removing Carex species from samples (essentially simulating an inability of the observer to identify them to species) and found that it significantly reduced C and FQI values. Therefore, knowledge of the Minnesota wetland flora will be essential for proper application of FQA. A number of studies have also reported that sampling area/effort affects Floristic Quality indices (Francis et al. 2000, Rooney and Rogers 2002, Matthews 2003, Bourdaghs et al. 2006). This is due to the species richness parameter in the index and the positive relationship between the number of species and sampling area (Arrhenius 1921). Sampling area, however, has been found to have little to no effect on Coefficient of Conservatism indices, where index scores remain level as sampling area is increased (Rooney and Rogers 2002, Bourdaghs et al. 2006). This has implications on how data are gathered as well as for comparing data that used different methodologies. Because of the strong effect of sampling area/effort, species richness and Floristic Quality indices should only be

Floristic Quality Assessment for Minnesota Wetlands-Application
14
compared when sampling area/effort was controlled. If this is not the case, the user should rely on Coefficient of Conservatism indices. Early versions of FQA recommended that a comprehensive census of the site be completed, where the observer walked the majority of the site multiple times during the growing season (Swink and Wilhelm 1994, Herman et al. 2001). The effect of sampling area/effort as well as conceptual research on the design of environmental indicators suggests that more controlled sampling schemes may be more appropriate for FQA. For Floristic Quality indices, sampling area does affect scores, but as more area is sampled the number of new species encountered will decrease to the point where indices will become stable with sampling area. When this occurs, the point of diminishing returns is reached where continued sampling to find the remaining species in the community will yield little change to index scores. For Coefficient of Conservatism indices, because they are stable with sampling area, the point of diminishing returns is met sooner. One of the most important properties of an indicator is its ease of use, both in terms of technical feasibility and resources required (Jackson et al. 2000, NRC 2000, Dale and Beyeler 2001). Because the point of diminishing returns is typically met with only a relatively small area of the community being sampled, a comprehensive census of an entire community will result in little gain in knowledge (i.e., little change in index scores and hence the assessment outcome) for the cost of completing the survey. Resources saved by sampling only a portion of the site can then be used to sample more sites. It should be noted that wetland sites can, and often have, multiple plant communities that have different suites of species and species-area relationships. Sampling schemes for FQA should therefore focus on minimally sampling each community in a wetland to the point where species-area curves tend to become stable, while standardizing the sampling area/effort, so that Floristic Quality indices can be used accurately. Finally, FQA indices have been found to be influenced by the time of year during which the data were collected (Matthews 2003). This is primarily due to phenology and its effect on the ability of the observer to identify plants to the required taxonomic level. The overall optimal time for applying FQA in Minnesota is June through August, when the greatest number of wetland plant species are likely to have reproductive structures that facilitate identification. In general, the probability that unidentifiable plants will be encountered will increase either earlier in the spring or later in the fall. Community Type Early proponents presented FQA as a tool that could compare sites regardless of community type (Swink and Wilhelm 1994, Taft et al. 1997). More recent work has shown, however, that the basic community type of the area in question can have a significant effect on index scores. Using data that formed the basis of John Curtis’ classic analysis of Wisconsin plant communities (Curtis 1959) Rooney and Rogers (2002) showed that C varied significantly among a number of plant community types. In an evaluation of FQA performance in Great Lakes coastal wetlands, an analysis of the discriminate ability of FQA indices was confounded because study wetlands were stratified by HGM classes and index scores varied between plant communities within an HGM class, adding unexpected variance to the analysis (Bourdaghs et al. 2006). Variability of FQA by community type should be expected, because C-values are a measure of disturbance tolerance (both natural and anthropogenic) and different communities often have inherently different natural disturbance regimes. For example, floodplain forest communities are adapted to frequent disturbance from natural river fluctuations, typically on an annual basis; whereas, the species that make up poor fen
Floristic Quality Assessment for Minnesota Wetlands-Application
15
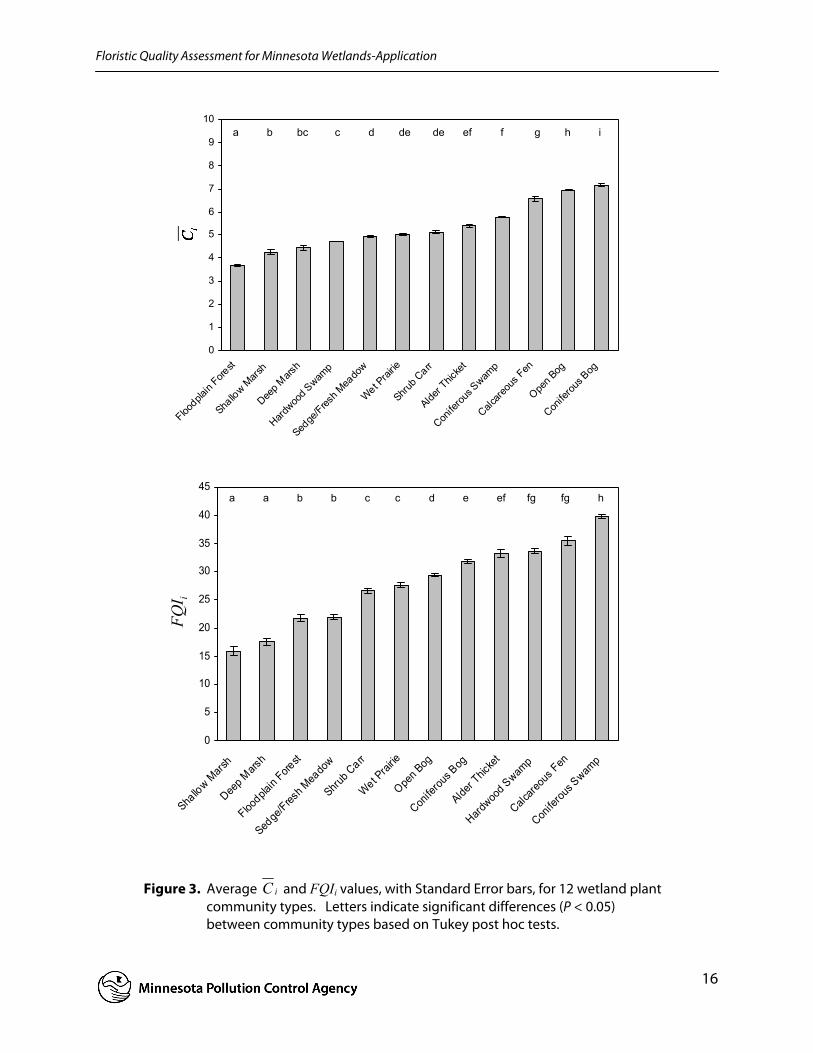
and bog communities are adapted to a very stable hydrology, on the order of hundreds to thousands of years. An analysis of MN DNR plot (relevé) data was performed to examine the effect of community type on FQA indices in Minnesota wetlands. Relevé data have been collected using standard procedures in the state since 1964 by a variety of ecologists in relatively undisturbed natural vegetation. The recent classification of native plant communities of Minnesota (MN DNR 2003, MN DNR 2005a, MN DNR 2005b) relied primarily on these data. To simplify the analysis, 74 MN DNR Native Plant Community Classes identified as wetland types were transposed into 12 more general community classes that follow the classification of Minnesota and Wisconsin wetland community types developed by Eggers and Reed (1997). iC and FQIi were calculated from 2,273 relevés representing all the Eggers and Reed (1997) communities except Open Water/Aquatic located throughout the state. Average index scores among community types were compared using one-way ANOVAs, and Tukey post hoc tests were used to determine groups of communities that had significant differences. Overall, community type had an effect on both iC (ANOVA; df = 11, 2,261, F = 433.8, P < 0.01) and FQIi (ANOVA; df = 11, 2,261, F = 213.4, P < 0.01), where different community types had significantly different index scores (Figure 3). The rankings of community types differed, however, between iC and FQIi. For example, Coniferous bog had the highest ranking iC but the fifth highest FQIi. Tukey post hoc tests also identified different community groupings between iC and FQIi. Classifying samples by community type will therefore be essential for placing index scores in the proper context for FQA interpretation. While the Eggers and Reed (1997) classification was used in this analysis, there is no standard or recommended plant community classification. Many wetland classifications exist, such as MN DNR’s Native Plant Communities of Minnesota (MN DNR 2003, MN DNR 2005a, MN DNR 2005b), the Classification of Wetlands and Deepwater habitats of the U.S. (Cowardin et al. 1979) used in the U.S. Fish and Wildlife Service (US FWS) National Wetland Inventory program, or US FWS Circular 39 (Shaw and Fredine 1956), that may provide differing results to the above analysis. The key point is that a classification that incorporates the plant community should be used when interpreting FQA indices. Biogeography In addition to community effects, biogeography may also affect FQA index scores. Communities of the same general type can vary due to natural biogeographical differences, which may in turn cause changes in index scores. To illustrate the potential effect of biogeography, another analysis of the MN DNR relevé data was performed. iC was compared at the Ecological Classification System (ECS) Province level (www.dnr.state.mn.us/ecs/index.html) for only the Sedge/Fresh Meadow community type using a one-way ANOVA and Tukey post hoc tests.
Floristic Quality Assessment for Minnesota Wetlands-Application
16
Figure 3. Average iC and FQIi values, with Standard Error bars, for 12 wetland plant community types. Letters indicate significant differences (P < 0.05) between community types based on Tukey post hoc tests.
0
1
2
3
4
5
6
7
8
9
10
Floodpla
in Fore
st
Shallo
w Mars
h
Deep M
arsh
Hardwoo
d Swam
p
Sedge
/Fresh M
eado
w
Wet Prai
rie
Shrub C
arr
Alder T
hicke
t
Conife
rous S
wamp
Calcare
ous F
en
Open B
og
Conife
rous B
og
f a b bc c d de de ef g h i
0
5
10
15
20
25
30
35
40
45
Shallo
w Mars
h
Deep M
arsh
Floodpla
in Fore
st
Sedge
/Fresh M
eado
w
Shrub C
arr
Wet Prai
rie
Open B
og
Conife
rous B
og
Alder T
hicke
t
Hardwoo
d Swam
p
Calcare
ous F
en
Conife
rous S
wamp
a a b b c c d e ef fg fg h
FQI i

Floristic Quality Assessment for Minnesota Wetlands-Future Efforts
17
Biogeography had a significant effect on iC (ANOVA; df = 3, 326, F = 17.3, P < 0.01) in the Sedge/Fresh Meadow community (Figure 4). In general, iC tended to increase from the Southwest region of Minnesota to the Northeast. Two significant groups of provinces were identified, though there was overlap between the groups in the Tallgrass Aspen Parkland Province. While this analysis was limited to the Sedge/Fresh Meadow community, it is likely indicative of similar biogeographical effects across many, if not all, of the various wetland community types. Thus, classifying samples by biogeography will likely also be necessary to place FQA results within the proper context for interpretation.
Figure 4. Average iC , with Standard Error bars, in the Sedge/Fresh Meadow
community type according to Ecological Classification System Provinces. Letters indicate significant differences (P < 0.05) between community types based on Tukey post hoc tests.
FUTURE EFFORTS A number of efforts could be undertaken to further develop and promote FQA in Minnesota. This work represents only the first step in the development process. Listed below are several key areas where additional work could be focused:
• Standardize Methods: A critical step in the development of any natural resource assessment is the determination of standardized optimal sampling methods. This would promote consistent use and increase the accuracy of the assessment at the most efficient level of effort. As previously discussed, a number of factors, such as sampling area/effort, community type, and biogeographical patterns, affect FQA indices. Development of standardized methods should focus on sampling communities to the point where FQA indices become stable with sampling area/effort and include standard wetland community and biogeography classifications to place results within the proper context. This could greatly facilitate comparison of results between different projects and applications, as well as over time.
• Develop Performance Criteria: Development of performance criteria based on reference (i.e.,
least anthropogenically impacted) conditions would greatly enhance FQA by providing clear benchmarks that FQA results could be measured against. Performance criteria for specific applications, such as measuring wetland restoration success, could also be developed and be
4
4.5
5
5.5
6
PrairieParkland
EasternBroadleaf
Forest
TallgrassAspen
Parkland
LaurentianMixedForest
aba ba
Floristic Quality Assessment for Minnesota Wetlands-Future Efforts
18
very valuable for the given application. Specific performance criteria, in combination with standard sampling methods, would allow FQA results to be universally comparable yet specific enough to meet many different application needs.
• Regionalizing C-value Assignment: As previously discussed, the conservatism of many plant species varies regionally throughout the state based on climatic, geomorphic, and habitat patterns. Assigning C-values according to uniform ecological features that better capture regional conservatism may improve the accuracy of FQA. This may also promote coordination between states that share the same biogeographical regions and perhaps facilitate broader multistate or national development of FQA.
• Assigning C-values to Upland Species: The majority of states that have developed FQA did so
for both uplands and wetlands. As the primary objective was to develop FQA for the state’s wetlands, assigning C-values to upland species was beyond the scope of the project. C-values will first need to be developed for the upland flora to provide the same benefits of FQA to monitoring and assessing Minnesota’s upland plant communities.
LITERATURE CITED Anderson, J. P. and W. J. Craig. 1984. Growing energy crops on Minnesota’s wetlands: the land use
perspective. Center for Urban and Regional Affairs, University of Minnesota, Minneapolis, Minn.
Andreas, B. K. and R. W. Lichvar. 1995. Floristic index for establishing assessment standards: a case
study for northern Ohio. U.S. Army Corps of Engineers, Waterways Experiment Station, Vicksburg, Miss. Technical Report WRP-DE-8.
Andreas, B. K., J. J. Mack, and J. S. McCormac. 2004. Floristic Quality Assessment Index (FQAI)
for vascular plants and mosses for the State of Ohio. Ohio Environmental Protection Agency, Division of Surface Water, Wetland Ecology Group, Columbus, Ohio.
Arrhenius, O. 1921. Species and area. Journal of Ecology 9:95-99. Bernthal, T. W. 2003. Development of a floristic quality assessment methodology for Wisconsin.
Wisconsin Department of Natural Resources, Bureau of Integrated Science Services, Madison, Wis. PUB-SS-986 2003.
Bourdaghs, M., C. A. Johnston, and R. R. Regal. 2006. Properties and performance of the floristic
quality index in Great Lakes coastal wetlands. Wetlands 26:718-735. Brinson, M. M., F. R. Hauer, L. C. Lee, W. L. Nutter, R. D. Rheinhardt, R. D. Smith, and D. F.
Whigham. 1995. A guidebook for application of hydrogeomorphic assessments to riverine wetlands. U.S. Army Corps of Engineers, Waterways Experiment Station, Vicksburg, Miss.
Cohen, M. J., S. Carstenn, and C. R. Lane. 2004. Floristic quality indices for biotic assessment of
depressional marsh condition in Florida. Ecological Applications 14:784-794.
Floristic Quality Assessment for Minnesota Wetlands-Future Efforts
19
Cowardin, L. M., V. Carter, F. C. Golet, and E. T. LaRoe. 1979. Classification of wetlands and deepwater habitats of the United States. U.S. Fish and Wildlife Service, Washington, D.C. FWS/OBS 79/31.
Crow, G. E. and C. B. Hellquist. 2000a. Aquatic and Wetland Plants of Northeastern North
America-Volume 1 Pteridophytes, Gymnosperms, and Angiosperms: Dicotyledons. University of Wisconsin Press, Madison, Wis.
Crow, G. E. and C. B. Hellquist. 2000b. Aquatic and Wetland Plants of Northeastern North
America-Volume 2 Angiosperms: Monocotyledons. University of Wisconsin Press, Madison, Wis.
Curtis, J. T. 1959. The Vegetation of Wisconsin. University of Wisconsin Press, Madison, Wis. Dale, V. H. and S. C. Beyeler. 2001. Challenges in the development and use of ecological indicators.
Ecological Indicators 1:3-10. Detenbeck, N. E., S. M. Galatowitsch, J. Atkinson, and H. Ball. 1999. Evaluating perturbations and
developing restoration strategies for inland wetlands in the Great Lakes basin. Wetlands 19:789-820.
Eggers, S. D. and D. M. Reed. 1997. Wetland Plants and Plant Communities of Minnesota and
Wisconsin, second edition. U.S. Army Corps of Engineers, St. Paul District, St. Paul, Minn. Ervin, G. N., B. D. Herman, J. T. Bried, D. C. Holly. 2006. Evaluating non-native species and
wetland indicator status as components of wetlands floristic assessment. Wetlands 26:1114-1129. Fennessy, M. S., R. Geho, B. Elifritz, and R. Lopez. 1998. Testing the floristic quality assessment
index as an indicator of riparian wetland quality. Ohio Environmental Protection Agency, Division of Surface Water, Columbus, Ohio. Final Report to U.S. EPA.
Fennessy, M. S., A. D. Jacobs, and M. E. Kentula. 2004. Review of Rapid Methods for Assessing
Wetland Condition. U.S. Environmental Protection Agency, Washington, D.C. EPA/620/R-04/009.
FNAEC (Flora of North America Editorial Committee) 2002. Flora of North America North of
Mexico-Volume 23: Cyperaceae. Oxford University Press, New York, N.Y. Francis, C. M., M. J. W. Austen, J. M. Bowles, and W. B. Draper. 2000. Assessing floristic quality in
southern Ontario woodlands. Natural Areas Journal 20:66-77. Galatowitsch, S. M., N. O. Anderson, and P. D. Ascher. 1999. Invasiveness in wetland plants in
temperate North America. Wetlands 19:733-755. Genet, J. A. and M. Bourdaghs. 2006. Development and Validation of Indices of Biological Integrity
(IBI) for Depressional Wetlands in the Temperate Prairies Ecoregion. Minnesota Pollution Control Agency, St. Paul, Minn. (http://www.pca.state.mn.us/publications/wq-bwm6-01.pdf)

Floristic Quality Assessment for Minnesota Wetlands-Future Efforts
20
Genet, J. A., M. Bourdaghs, and M. C. Gernes. 2006. Wetland Assessment for Improved Decision-Making. Minnesota Pollution Control Agency, St. Paul, Minn. Final Report to U.S. Environmental Protection Agency (#CD-975768-01).
Genet, J. A. and A. R. Olsen. 2006. Assessing the Quantity and Quality of Depressional Wetlands in
the Redwood River Watershed Utilizing a Probabilistic Sampling Design. Minnesota Pollution Control Agency, St. Paul, Minn. (http://www.pca.state.mn.us/publications/wq-bwm6-02.pdf)
Gernes, M. C. and J. C. Helgen. 2002. Indexes of biological integrity (IBI) for large depressional
wetlands in Minnesota. Minnesota Pollution Control Agency, St. Paul, Minn. Final Report to U.S. Environmental Protection Agency (#CD-995525-01).
Gleason, H. A. and A. Cronquist. 1991. Manual of Vascular Plants of Northeastern United States
and Adjacent Canada, second edition. New York Botanical Garden, New York, N.Y. Grime, J. P. 1974. Vegetation classification by reference to strategies. Nature 250:26-31. Herman, K. D., L. A. Masters, M. P. Penskar, A. A. Reznicek, G. S. Wilhelm, W. W. Brodovich, and
K. P. Gardiner. 2001. Floristic quality assessment with wetland categories and examples of computer applications for the state of Michigan, second edition. Michigan Department of Natural Resources, Wildlife Division, Natural Heritage Program, In partnership with U.S. Department of Agriculture Natural Resources Conservation Service, Rose Lake Plant Materials Center, East Lansing Mich.
Herman, B. D., J. D. Madsen, and G. N. Ervin. 2006. Development of coefficients of conservatism
for wetland vascular flora of north and central Mississippi. Geo resources Institute Report Number 4001, Mississippi State University, Miss. (http://www.gri.msstate.edu/information/pubs/docs/2006/MS-Coef-Conservatism.pdf)
Jackson, L. E., J. C. Kurtz, and W. S. Fisher (eds.). 2000. Evaluation guidelines for ecological
indicators. U.S. Environmental Protection Agency, Office of Research and Development, Research Triangle Park, N.C. EPA 620 R-99 005.
Joyal, L. A. 2005. Verifying, field testing, and validating the revised Minnesota routine wetland
assessment method Version 3.0. Minnesota Department of Natural Resources, Ecological Services, St. Paul, Minn.
Kadlec, R. H. and F. B. Bevis. 1990. Wetlands and wastewater: Kinross, Michigan. Wetlands 10:77-
92. Kercher, S. M. and J. B. Zedler. 2004. Multiple disturbances accelerate invasion of reed canary grass
(Phalaris arundinacea L.) in a mesocosm study. Oecologia 138:455-464. Ladd, D. 1993. The Missouri floristic quality assessment system. The Nature Conservancy, St. Louis,
Mo. Lopez, R. D. and M. S. Fennessy. 2002. Testing the floristic quality assessment index as an indicator
of wetland condition. Ecological Applications 12:487-497.
Floristic Quality Assessment for Minnesota Wetlands-Future Efforts
21
Mack, J. J. 2001. Vegetation Indices of Biotic Integrity (VIBI) for Wetlands. Ohio Environmental Protection Agency, Division of Surface Water, Wetland Ecology Group, Columbus, Ohio. Final Report to U.S. Environmental Protection Agency (#CD985875). (http://www.epa.state.oh.us/dsw/wetlands/wetland_bioassess.html)
Mack, J. J. 2004. Integrated Wetland Assessment Program Part 4: Vegetation index of biotic integrity
(VIBI) and tiered aquatic life uses (TALUs) for Ohio wetlands. Ohio Environmental Protection Agency, Division of Surface Water, Wetland Ecology Group, Columbus, Ohio. Technical Report WET/2004-4. (http://www.epa.state.oh.us/dsw/wetlands/PART4_VIBI_OH_WTLDs.pdf)
Matthews, J. W. 2003. Assessment of the floristic quality index for use in Illinois, USA, wetlands.
Natural Areas Journal 23:53-60. MCWAMMSS (Minnesota Comprehensive Wetland Assessment Monitoring and Mapping Strategy
Steering Committee). 2006. A Comprehensive Wetland Assessment, Monitoring, and Mapping Strategy for Minnesota. Minnesota Pollution Control Agency, St. Paul, Minn. (http://www.pca.state.mn.us/publications/wq-bwm6-03.pdf)
MN BWSR (Minnesota Board of Water and Soil Resources). 2006. Comprehensive General
Guidance for Minnesota Routine Assessment Method (MnRAM) Evaluating Wetland Function, Version 3.0. Minnesota Board of Water and Soil Resources, St. Paul, Minn. (http://www.bwsr.state.mn.us/wetlands/mnram/MnRAM_Guidance.doc)
MN DNR (Minnesota Department of Natural Resources). 1996. Minnesota’s List of Endangered,
Threatened, and Special Concern Species. Minnesota Department of Natural Resources, St. Paul, Minn. (http://files.dnr.state.mn.us/natural_resources/ets/endlist.pdf).
MN DNR (Minnesota Department of Natural Resources). 2003. Field Guide to the Native Plant
Communities of Minnesota: The Laurentian Mixed Forest Province. Ecological Land Classification Program, Minnesota County Biological Survey, and Natural Heritage and Nongame Research Program, Minnesota Department of Natural Resources, St. Paul, Minn.
MN DNR (Minnesota Department of Natural Resources). 2005a. Field Guide to the Native Plant
Communities of Minnesota: The Eastern Broadleaf Forest Province. Ecological Land Classification Program, Minnesota County Biological Survey, and Natural Heritage and Nongame Research Program, Minnesota Department of Natural Resources, St. Paul, Minn.
MN DNR (Minnesota Department of Natural Resources). 2005b. Field Guide to the Native Plant
Communities of Minnesota: The Prairie Parkland and Tallgrass Aspen Parklands Provinces. Ecological Land Classification Program, Minnesota County Biological Survey, and Natural Heritage and Nongame Research Program, Minnesota Department of Natural Resources, St. Paul, Minn.
MPCA (Minnesota Pollution Control Agency). 2005. Aquatic plant community sampling procedure
for depressional wetland monitoring sites. Minnesota Pollution Control Agency, St. Paul, Minn. (http://www.pca.state.mn.us/publications/wq-bwm3-01.pdf)
Floristic Quality Assessment for Minnesota Wetlands-Future Efforts
22
Mushet, D. M., N. H. Euliss, Jr., and T. H. Shaffer. 2002. Floristic quality assessment of one natural and three restored wetland complexes in North Dakota, USA. Wetlands 22:126-138.
NGPFQAP (Northern Great Plains Floristic Quality Assessment Panel). 2001. Coefficients of
conservatism for the vascular flora of the Dakotas and adjacent grasslands. U.S. Geological Survey, Biological Resources Division, Northern Prairie Wildlife Research Center, Jamestown, N.D. Information and Technology Report USGS/BRD/ITR-2001-001.
NRC (National Research Council). 2000. Ecological Indicators for the Nation. National Academy
Press, Washington, D.C. Oldham, M. J., W. D. Bakowsky, and D. A. Sutherland. 1995. Floristic quality assessment system
for southern Ontario. Ontario Ministry of Natural Resources, Natural Heritage Information Centre, Peterborough, Ont., Canada.
Omernik, J. M. 1987. Ecoregions of the conterminous United States. Annals of the Association of
American Geographers 77:118-125. Ownbey, G. B. and T. Morley. 1991. Vascular Plants of Minnesota: A Checklist and Atlas.
University of Minnesota Press, Minneapolis, Minn. Poling, T. C., M. G. Banker, and L. M. Jablonski. 2003. Quadrat-level floristic quality index reflects
shifts in composition of a restored tallgrass prairie (Ohio). Ecological Restoration 21:144-145. Rapport, D. J., H. A. Regier, and T. C. Hutchinson. 1985. Ecosystem behavior under stress.
American Naturalist 125:617-640. Reed, P. 1988. National List of Plant Species That Occur in Wetlands: North Central (Region 3).
National Wetland Inventory, U.S. Department of the Interior, Fish and Wildlife Service, St. Petersburg, Fla.
Rooney, T. P. and D. A. Rogers. 2002. The modified floristic quality index. Natural Areas Journal
22:340-344. Rothrock, P. E. 2004. Floristic quality assessment in Indiana: the concept, use, and development of
coefficients of conservatism. Indiana Department of Environmental Management, Office of Water Quality, Indianapolis, Ind. Final report for ARN A305-4-53, EPA Wetland Program Development Grant CD975586-01.
Shaw, S. P. and C. G. Fredine. 1956. Wetlands of the United States, Their Extent and Their Value
for Waterfowl and Other Wildlife. Circular 39, U.S. Fish and Wildlife Service, Washington, D.C. Stevenson, R. J. and F. R. Hauer. 2002. Integrating hydrogeomorphic and index of biotic integrity
approaches for environmental assessment of wetlands. Journal of the North American Benthological Society 21:502-513.
Swink, F. A. and G. S. Wilhelm. 1994. Plants of the Chicago Region, fourth edition. Morton
Arboretum, Lisle, Ill.
Floristic Quality Assessment for Minnesota Wetlands-Future Efforts
23
Taft, J. B., G. S. Wilhelm, D. M. Ladd, and L. A. Masters. 1997. Floristic quality assessment for vegetation in Illinois: a method for assessing vegetation integrity. Erigenia 15:3-95.
Wilcox, D. A. 1995. Wetland and aquatic macrophytes as indicators of anthropogenic hydrologic
disturbance. Natural Areas Journal 15:240-248. Wilhelm, G. S. 1977. Ecological assessment of open land areas in Kane County, Illinois. Kane County Urban Development, Geneva, Ill.

520 Lafayette Road NSt. Paul, MN 55155-4194(651) 296-6300
Toll-free/TTY (800) 657-3864
Related Documents