Identification of protein coding genes in genomes with statistical functions based on the circular code Didier G. Arque `s a,1 , Je ´ro ˆme Lacan b,2 , Christian J. Michel c, * a Equipe de Biologie The ´orique, Institut Gaspard Monge, Universite ´ de Marne la Valle ´e, 2 rue de la Butte Verte 93160 Noisy le Grand, France b De ´partement de Mathe ´matiques Applique ´es et d’Informatique, ENSICA, 1 Place Emile Blouin, 31056 Toulouse Cedex 5, France c Equipe de Bioinformatique The ´orique, LSIIT (UMR CNRS-ULP 7005), Universite ´ Louis Pasteur de Strasbourg, Po ˆle API, Boulevard Se ´bastien Brant, 67400 Illkirch, France Received 23 May 2001; received in revised form 3 April 2002; accepted 30 May 2002 Abstract A new statistical approach using functions based on the circular code classifies correctly more than 93% of bases in protein (coding) genes and non-coding genes of human sequences. Based on this statistical study, a research software called ‘Analysis of Coding Genes’ (ACG) has been developed for identifying protein genes in the genomes and for determining their frame. Furthermore, the software ACG also allows an evaluation of the length of protein genes, their position in the genome, their relative position between themselves, and the prediction of internal frames in protein genes. # 2002 Elsevier Science Ireland Ltd. All rights reserved. Keywords: Protein coding genes; Genomes; Circular code; Statistical functions; Research software 1. Introduction The concept of code ‘without commas’, intro- duced by Crick et al. (1957) for the protein (coding) genes, is a code readable in only one out of three frames. Such a theoretical code without commas, called circular code in the theory of codes (e.g. Be ´al, 1993; Berstel and Perrin, 1985), is a particular set X of trinucleotides such that a concatenation (a series) of trinucleotides of X leads to sequences that cannot be decomposed in another frame with a concatenation of trinucleo- tides of X . For example, suppose that X is the following set of trinucleotides: X /{AAC, AAT, ACC, ATC, ATT, CAG, CTC, CTG, GAA, GAC, GAG, GAT, GCC, GGC, GGT, GTA, GTC, GTT, TAC, TTC}. Some trinucleotides of X are con- catenated randomly, for example as follows: * Corresponding author. Tel.: /33-3-9024-4462; fax: /33-3- 9024-4455 E-mail addresses: arques@univ-mlv.fr (D.G. Arque `s), [email protected] (J. Lacan), [email protected] (C.J. Michel). 1 Tel.: /33-1-4932-9010; fax: /33-1-4932-9138. 2 Tel.: /33-5-6161-8720; fax: /33-5-6161-8688. BioSystems 66 (2002) 73 /92 www.elsevier.com/locate/biosystems 0303-2647/02/$ - see front matter # 2002 Elsevier Science Ireland Ltd. All rights reserved. PII:S0303-2647(02)00039-4

Welcome message from author
This document is posted to help you gain knowledge. Please leave a comment to let me know what you think about it! Share it to your friends and learn new things together.
Transcript
Identification of protein coding genes in genomes withstatistical functions based on the circular code
Didier G. Arques a,1, Jerome Lacan b,2, Christian J. Michel c,*a Equipe de Biologie Theorique, Institut Gaspard Monge, Universite de Marne la Vallee, 2 rue de la Butte Verte 93160 Noisy le Grand,
Franceb Departement de Mathematiques Appliquees et d’Informatique, ENSICA, 1 Place Emile Blouin, 31056 Toulouse Cedex 5, France
c Equipe de Bioinformatique Theorique, LSIIT (UMR CNRS-ULP 7005), Universite Louis Pasteur de Strasbourg, Pole API, Boulevard
Sebastien Brant, 67400 Illkirch, France
Received 23 May 2001; received in revised form 3 April 2002; accepted 30 May 2002
Abstract
A new statistical approach using functions based on the circular code classifies correctly more than 93% of bases in
protein (coding) genes and non-coding genes of human sequences. Based on this statistical study, a research software
called ‘Analysis of Coding Genes’ (ACG) has been developed for identifying protein genes in the genomes and for
determining their frame. Furthermore, the software ACG also allows an evaluation of the length of protein genes, their
position in the genome, their relative position between themselves, and the prediction of internal frames in protein
genes. # 2002 Elsevier Science Ireland Ltd. All rights reserved.
Keywords: Protein coding genes; Genomes; Circular code; Statistical functions; Research software
1. Introduction
The concept of code ‘without commas’, intro-
duced by Crick et al. (1957) for the protein
(coding) genes, is a code readable in only one out
of three frames. Such a theoretical code without
commas, called circular code in the theory of codes
(e.g. Beal, 1993; Berstel and Perrin, 1985), is a
particular set X of trinucleotides such that a
concatenation (a series) of trinucleotides of X
leads to sequences that cannot be decomposed in
another frame with a concatenation of trinucleo-
tides of X .
For example, suppose that X is the following set
of trinucleotides: X�/{AAC, AAT, ACC, ATC,
ATT, CAG, CTC, CTG, GAA, GAC, GAG,
GAT, GCC, GGC, GGT, GTA, GTC, GTT,
TAC, TTC}. Some trinucleotides of X are con-
catenated randomly, for example as follows:
* Corresponding author. Tel.: �/33-3-9024-4462; fax: �/33-3-
9024-4455
E-mail addresses: [email protected] (D.G. Arques),
[email protected] (J. Lacan),
[email protected] (C.J. Michel).1 Tel.: �/33-1-4932-9010; fax: �/33-1-4932-9138.2 Tel.: �/33-5-6161-8720; fax: �/33-5-6161-8688.
BioSystems 66 (2002) 73�/92
www.elsevier.com/locate/biosystems
0303-2647/02/$ - see front matter # 2002 Elsevier Science Ireland Ltd. All rights reserved.
PII: S 0 3 0 3 - 2 6 4 7 ( 0 2 ) 0 0 0 3 9 - 4

If the set X of trinucleotides is a circular code,
then there is an unique solution:
This unique solution is obtained by choosing a
window (sufficiently large) in any position in the
sequence and then verifying the belonging of the
trinucleotides of the window to X :
The first decomposition proposed is rejected
immediately as the first trinucleotide AGG in the
window does not belong to X . The second
decomposition proposed is rejected with a window
of 13 nucleotides. Indeed, the first nucleotide A in
the window may belong to several trinucleotides of
X , e.g. GTA. The trinucleotides GGT, AAT, and
�/ . . .CAG,GCC,TTC,AAT,ACC,ACC,CAG,GAA,GAG,GTA,ATT,ACC,AAT,GTA,AAC,TAC,TTC,
ACC,ATC. . .
The commas between the trinucleotides show the frame of construction (reading frame in biology).
Suppose now that the commas are ‘lost’, leading to the sequence:
�/ . . .CAGGCCTTCAATACCACCCAGGAAGAGGTAATTACCAATGTAAACTACTTCACCA
TC. . .
The problem is to retrieve the original frame of construction. There are three obvious possibilities:
�/ . . .C,AGG,CCT,TCA,ATA,CCA,CCC,AGG,AAG,AGG,TAA,TTA,CCA,ATG,TAA,ACT,ACT,
TCA,CCA,TC. . .�/ . . .CA,GGC,CTT,CAA,TAC,CAC,CCA,GGA,AGA,GGT,AAT,TAC,CAA,TGT,AAA,CTA,CTT,
CAC,CAT,C. . .�/ . . .CAG,GCC,TTC,AAT,ACC,ACC,CAG,GAA,GAG,GTA,ATT,ACC,AAT,GTA,AAC,TAC,TTC,
ACC,ATC. . .
�/ . . .CAG,GCC,TTC,AAT,ACC,ACC,CAG,GAA,GAG,GTA,ATT,ACC,AAT,GTA,AAC,TAC,TTC,ACC,ATC. . .
D.G. Arques et al. / BioSystems 66 (2002) 73�/9274
TAC following A belong to X . The next trinucleo-
tide CAA does not belong to X as the 13th
nucleotide A (from the beginning of the window)
differs from the unique possibility G of CAG
belonging to X . The third decomposition is the
original one as all the trinucleotides in the window
belong to X and the original decomposition of the
sequence is deduced automatically.
Such a code was proposed by Crick et al. (1957)
in order to explain how the reading of a series of
nucleotides in the protein genes could code for the
amino acids constituting the proteins. The two
problems stressed were: why are there more
trinucleotides than amino acids and how to choose
the correct reading frame? Crick et al. (1957)
proposed that only 20 among 64 trinucleotides
code for the 20 amino acids. However, the
determination of a set of 20 trinucleotides forming
a circular code X depends on a great number of
constraints:
i) A trinucleotide with identical nucleotides
(AAA, CCC, GGG or TTT) must be excluded
from such a code. Indeed, the concatenation
of AAA with itself does not allow the
retrieval of the reading (original) frame as
there are three possible decompositions:
. . .AAA,AAA,AAA,. . .,
. . .A,AAA,AAA,AA. . .and . . .AA,AAA,AAA,A. . .
ii) Two trinucleotides related to circular
permutation, e.g. ATC and TCA, must
be excluded from such a code. Indeed, the
concatenation of ATC with itself does
not allow the retrieval of the reading (original)
frame as there are two possible
decompositions: . . .ATC,ATC,ATC,. . . and
. . .A,TCA,TCA,TC. . .
Therefore, by excluding AAA, CCC, GGG and
TTT and by gathering the 60 remaining trinucleo-
tides in 20 classes of three trinucleotides so that, in
each class, the three trinucleotides are deduced
from each other by circular permutations, e.g.
ATC, TCA, and CAT, a circular code, has only
one trinucleotide per class and, therefore, contains
at most 20 trinucleotides (maximal circular code).
This trinucleotide number is identical to the amino
acid number suggesting a circular code assigning
one trinucleotide per amino acid.
No set of 20 trinucleotides leading to a circular
code has been found at this time. Furthermore, the
two discoveries that the trinucleotide TTT, an
‘excluded’ trinucleotide in the concept of circular
code, codes for phenylalanine (Nirenberg and
Matthaei, 1961) and that the protein genes are
placed in the reading frame with a particular
trinucleotide, namely the start trinucleotide
ATG, have led to giving up the concept of circular
code on the alphabet {A,C,G,T}. For several
biological reasons, in particular the interaction
between mRNA and tRNA, the concept of
circular code has been resumed subsequently
regarding the alphabet {R,Y} (R�/purine�/A or
G, Y�/pyrimidine�/C or T) with two trinucleo-
tide models for the primitive protein genes: RRY
(Crick et al., 1976) and RNY (N�/R or Y) (Eigen
and Schuster, 1978).
Unexpectedly, a maximal circular code has been
identified recently in the protein genes of both
eukaryotes and prokaryotes on the alphabet {A,
C, G, T} (Arques and Michel, 1996). This circular
code has been obtained by two methods:
i) by computing the occurrence frequencies of
the 64 trinucleotides AAA,. . .,TTT in the
three frames of protein genes and then, by
assigning each trinucleotide to the frame
associated with its highest frequency (Arques
and Michel, 1996);
ii) by computing the 12 288 (3�/642) autocorre-
lation functions analysing the probability that
a trinucleotide in any frame occurs any i bases
N after a trinucleotide in a given frame of
protein genes and then, by classifying these
autocorrelation functions according to their
modulo 3 periodicity for deducing a frame for
each trinucleotide (Arques and Michel,
1997a).
The maximal circular code identified
is the set X0�/{AAC,AAT,ACC,ATC,ATT,
CAG,CTC,CTG,GAA,GAC, GAG,GAT,GCC,
GGC,GGT,GTA,GTC,GTT,TAC,TTC} of 20 tri-
D.G. Arques et al. / BioSystems 66 (2002) 73�/92 75
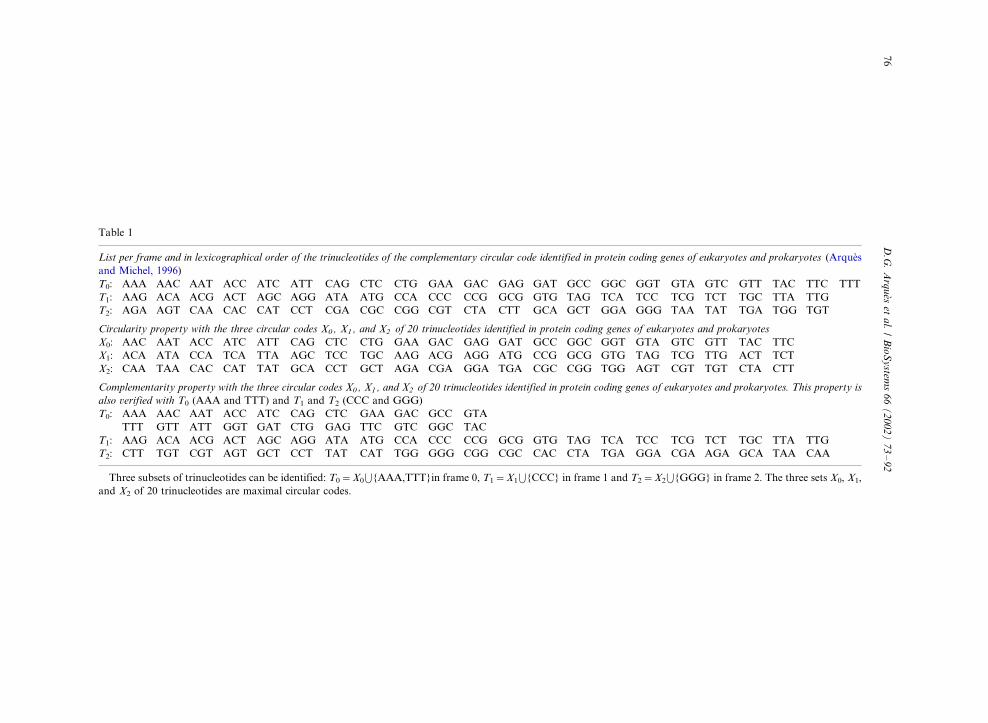
Table 1
List per frame and in lexicographical order of the trinucleotides of the complementary circular code identified in protein coding genes of eukaryotes and prokaryotes (Arques
and Michel, 1996)
T0: AAA AAC AAT ACC ATC ATT CAG CTC CTG GAA GAC GAG GAT GCC GGC GGT GTA GTC GTT TAC TTC TTT
T1: AAG ACA ACG ACT AGC AGG ATA ATG CCA CCC CCG GCG GTG TAG TCA TCC TCG TCT TGC TTA TTG
T2: AGA AGT CAA CAC CAT CCT CGA CGC CGG CGT CTA CTT GCA GCT GGA GGG TAA TAT TGA TGG TGT
Circularity property with the three circular codes X0 , X1 , and X2 of 20 trinucleotides identified in protein coding genes of eukaryotes and prokaryotes
X0: AAC AAT ACC ATC ATT CAG CTC CTG GAA GAC GAG GAT GCC GGC GGT GTA GTC GTT TAC TTC
X1: ACA ATA CCA TCA TTA AGC TCC TGC AAG ACG AGG ATG CCG GCG GTG TAG TCG TTG ACT TCT
X2: CAA TAA CAC CAT TAT GCA CCT GCT AGA CGA GGA TGA CGC CGG TGG AGT CGT TGT CTA CTT
Complementarity property with the three circular codes X0 , X1 , and X2 of 20 trinucleotides identified in protein coding genes of eukaryotes and prokaryotes. This property is
also verified with T0 (AAA and TTT) and T1 and T2 (CCC and GGG)
T0: AAA AAC AAT ACC ATC CAG CTC GAA GAC GCC GTA
TTT GTT ATT GGT GAT CTG GAG TTC GTC GGC TAC
T1: AAG ACA ACG ACT AGC AGG ATA ATG CCA CCC CCG GCG GTG TAG TCA TCC TCG TCT TGC TTA TTG
T2: CTT TGT CGT AGT GCT CCT TAT CAT TGG GGG CGG CGC CAC CTA TGA GGA CGA AGA GCA TAA CAA
Three subsets of trinucleotides can be identified: T0�/X0�{AAA,TTT}in frame 0, T1�/X1�{CCC} in frame 1 and T2�/X2�{GGG} in frame 2. The three sets X0, X1,
and X2 of 20 trinucleotides are maximal circular codes.
D.G
.A
rqu
eset
al.
/B
ioS
ystem
s6
6(
20
02
)7
3�
/92
76
nucleotides in frame 0 of protein genes (reading
frame). Furthermore, the two sets X1 and X2 of 20
trinucleotides identified in the frames 1 and 2,
respectively, (frames 1 and 2 being the frame 0
shifted by one and two nucleotides respectively in
the 5?�/3? direction) by these two methods, are also
maximal circular codes (Table 1). These three
circular codes have several important properties:
i) circularity: X0 generates X1 by one circular
permutation and X2 by another circular per-
mutation (one and two circular permutations
of each trinucleotide of X0 lead to the trinu-
cleotides of X1 and X2 respectively) (Table 1).
ii) complementarity: X0 is self-complementary
(ten trinucleotides of X0 are complementary
to the ten other trinucleotides of X0) and, X1
and X2 are complementary to each other (the
20 trinucleotides of X1 are complementary to
the 20 trinucleotides of X2) (Table 1). Note
that this property is also verified with T0�/
X0�{AAA,TTT}, T1�/X1�{CCC} and
T2�/X2�{GGG} (Table 1).
iii) rarity: the occurrence probability of X0 is
equal to 6�/10�8. As there are 20 classes of
three trinucleotides (see above), the number of
potential circular codes is 320�/3 486 784 401.
The computed number of complementary
circular codes with two shifted circular codes
(called C3 codes), such as X0, is 216. There-
fore, its probability is 216/320�/6�/10�8.iv) flexibility: the lengths of the minimal windows
to automatically retrieve the frames 0, 1, and 2
with the three circular codes X0, X1, and X2
respectively, are all equal to 13 nucleotides
and represent the largest window length
among the 216 C3 codes. The frequency of
misplaced trinucleotides in the shifted frames
is equal to 24.6%. If the trinucleotides of X are
concatenated randomly, for example as fol-
lows:
belong mainly to X1 and X2, respectively. A
few trinucleotides are misplaced in the shifted
frames. With this example, in frame 1, nine
trinucleotides belong to X1, one trinucleotide
(TAC) to X0 and one trinucleotide (TAA) to
X2. In frame 2, eight trinucleotides belong to
X2, two trinucleotides (GGT, AAC) to X0 and
one trinucleotide (ACT) to X1. By computing
exactly, the average frequencies of misplaced
trinucleotides in frame 1 are 11.9 for X0 and
12.7% for X2. In frame 2, the average
frequencies of misplaced trinucleotides are
11.9 for X0 and 12.7% for X1. The comple-
mentarity property explains on the one hand
that the frequency equality of X0 in frames 1
and 2 and on the other hand, the frequency
equality of X2 in frame 1 and X1 in frame 2.
The sum of percentages of misplaced trinu-
cleotides in frame 1 (X0 and X2) is equal to the
sum of percentages of misplaced trinucleotides
in frame 2 (X0 and X1) and is equal to 24.6%.
This value is close to the highest frequency
(27.9%) of misplaced trinucleotides among the
216 C3 codes. The four types of nucleotides
occur in the three trinucleotide sites with the
three circular codes X0, X1, and X2 (Table 1).
v) evolutionary: an evolutionary analytical
model at three parameters (p , q , t) based on
an independent mixing of the 20 trinucleotides
of X0 with equiprobability (1/20) followed by
t :/4 substitutions per trinucleotide according
to the proportions p :/0.1, q :/0.1 and r�/1�/
p�/q :/0.8 in the three trinucleotide sites,
. . .GAA,GAG,GTA,GTA,ACC,AAT,GTA,CTC,TAC,TTC,ACC,ATC. . .then, the trinucleotides in frame 1:. . .G,AAG,AGG,TAG,TAA,CCA,ATG,TAC,TCT,ACT,TCA,CCA,TC. . .and the trinucleotides in frame 2:. . .GA,AGA,GGT,AGT,AAC,CAA,TGT,ACT,CTA,CTT,CAC,CAT,C. . .
D.G. Arques et al. / BioSystems 66 (2002) 73�/92 77
respectively, retrieves the frequencies of X0,X1, and X2 observed in the three frames of
protein genes.
The proof that X0, X1, and X2 are circular codes,
the detailed explanation of the properties (i�/iv)
and the different biological consequences, in
particular on the two-letter genetic alphabets, the
genetic code and the amino acid frequencies in
proteins, are given in Arques and Michel (1996,
1997a). The property (v) is described in Arques et
al. (1998, 1999).
Note: a non-complementary circular code has
been identified recently in the mitochondrial
protein genes (Arques and Michel, 1997b).
As the circular code is a strong structural
property of protein genes, different statistical
functions based on the circular code are investi-
gated in this paper in order to discriminate
between coding and non-coding genes. Indeed,
the sets of 20 trinucleotides based on a circular
code, i.e. the 216 C3 codes and in particular X0, X1,
and X2, have a lesser number of misplaced
trinucleotides in the shifted frames compared
with the vast majority of sets without particular
property. This low number implies that the three
circular codes X0, X1, and X2 can clearly be
associated with the three frames 0, 1, and 2,
respectively, (detailed in method).After having validated this statistical approach
with the human sequences from the EMBL
database, research software has been developed
for identifying protein genes in genomes and for
determining their frame. Furthermore, this soft-
ware also allows an evaluation of the length of
protein genes, their position in the genome, theirrelative position between themselves, and the
prediction of internal frames. These possibilities
are presented with five examples taken from
human chromosomes: a large protein gene, a
complementary protein gene, a series of five exons,
a protein gene with four internal frames, and a
possible coding region in the human DNA se-
quence. An example with a prokaryotic genome isalso given.
2. Method
2.1. Introduction
The method developed is based on a strong
structural property of protein genes, i.e. thecircular code, and in particular its properties of
circularity and complementarity. This method
differs from the classical methods, such as the
codon usage methods and the HMM methods, at
least for the following reasons:
i) The circular code is observed in protein genes
of eukaryotes as well as of prokaryotes and is
not found in the non-coding genes (Arques et
al., 1998). Therefore, a method based on thiscircular code can be applied independently of
the type of eukaryotic/prokaryotic organism
under investigation. In contrast, the codon
usage methods use codon frequencies that
depend on the species and the functional
classes of protein genes (see e.g. Karlin et al.,
1998).
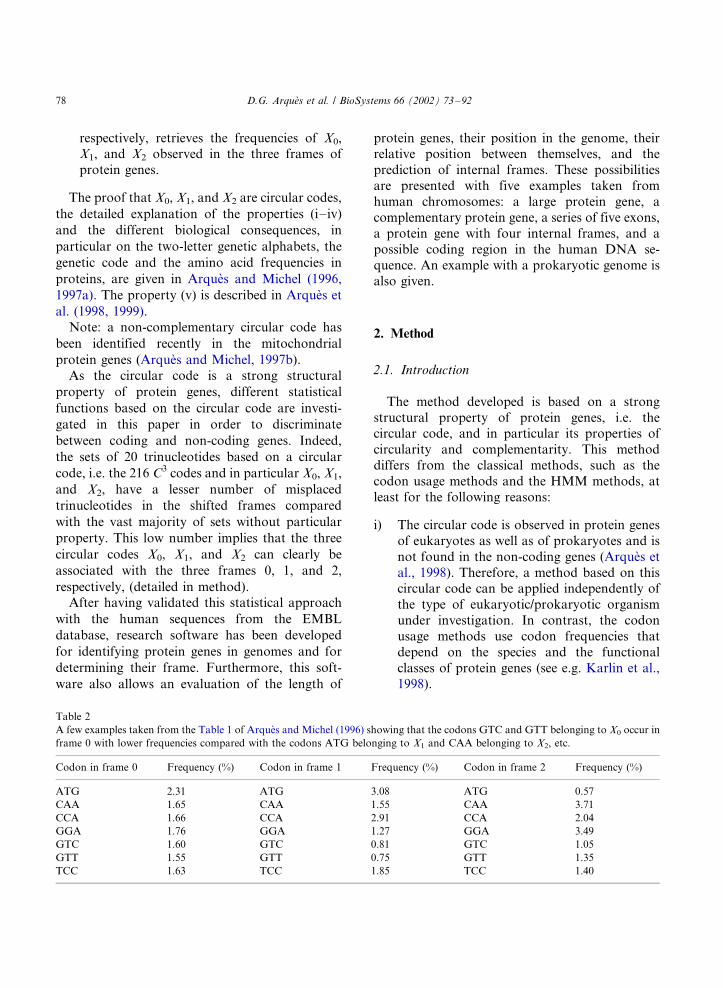
Table 2
A few examples taken from the Table 1 of Arques and Michel (1996) showing that the codons GTC and GTT belonging to X0 occur in
frame 0 with lower frequencies compared with the codons ATG belonging to X1 and CAA belonging to X2, etc.
Codon in frame 0 Frequency (%) Codon in frame 1 Frequency (%) Codon in frame 2 Frequency (%)
ATG 2.31 ATG 3.08 ATG 0.57
CAA 1.65 CAA 1.55 CAA 3.71
CCA 1.66 CCA 2.91 CCA 2.04
GGA 1.76 GGA 1.27 GGA 3.49
GTC 1.60 GTC 0.81 GTC 1.05
GTT 1.55 GTT 0.75 GTT 1.35
TCC 1.63 TCC 1.85 TCC 1.40
D.G. Arques et al. / BioSystems 66 (2002) 73�/9278
ii) The circular code X0 (respectively, X1 and X2)contains the 20 codons having a preferential
occurrence in the frame 0 (respectively, 1 and
2). It is important to stress that the set X0, for
example, does not necessarily represent the
common codons in frame 0, i.e. the 20 codons
having the highest frequencies in frame 0 (see
a few examples in Table 2).
iii) The 216 C3 codes have a low number ofmisplaced trinucleotides in the shifted frames,
27.9% in the worst case and 24.6% for X0. This
number is close to 2/3:/66.6% with the vast
majority of trinucleotide sets without particu-
lar property. Indeed, by excluding AAA,
CCC, GGG, and TTT, there is one chance
out of three to observe, for example, a codon
of X1 in frame 1, i.e. two chances out of threeto observe a codon of X0 or X2 in frame 1. In
summary, the method developed according to
the circular code allows to associate clearly the
three sets of trinucleotides X0, X1, and X2 with
the three frames 0, 1 and 2 respectively of
protein genes.
iv) The complementarity property of these three
sets X0, X1, and X2 is used for identifyingprotein genes on the direct strand but also on
the complementary strand (see the definition
of the four functions below).
v) The method developed is based on the global
probabilities of X0, X1, and X2 and not on the
individual codon probabilities that are used in
the codon usage methods.
2.2. Definition of statistical functions
Let t be a trinucleotide in the set {AAA, . . .,TTT} (64 trinucleotides). Let F be a population
with m (F ) sequences S . Each sequence S has a
base length l(S ). Let wi be a window of n
trinucleotides starting at the base position i , i�/
1, . . ., l(S )�/3n�/1, in a sequence S of F , i.e. wi �/
t1. . .tn where tj is the jth trinucleotide in the
window wi . Let Tg , g � /{0, 1, 2}, be the three
subsets of trinucleotides constituting the three
circular codes in the protein coding genes of
eukaryotes and prokaryotes, T0 in the open read-
ing frame (frame 0) and, T1 and T2, in the shifted
frames 1 and 2, respectively (Table 1). In a givenwindow wi , the function
/dg(tj)�1 if tj � Tg
0 if tj Qtg
�/
determines whether or not if the trinucleotide tj at
the position j in wi belongs to Tg with g � /{0, 1, 2}.Next, the occurrence frequency P (Tg , wi) of a
subset Tg in wi , is P(Tg;wi)�anj�1 dg(tj)=n where n
is the total number of trinucleotides in the window
wi .
Several statistical functions based on the proper-
ties of the circular code, are defined:
F1(i)�P(T0; wi) (1)
F2(i)�P(T0; wi)�P(T2; wi) (2)
F3(i)�(21=22)2P(T0; wi)
(P(T1; wi) � P(T2; wi))(3)
F4(i)�X2
j�0
P(Tj; wi�j) (4)
These four statistical functions use different
properties of the circular code, in particular theproperties of circularity and complementarity.
The function F1 is the simplest, and is based on
the circular code X0 (extended to T0) in each
window wi . In a protein gene, F1(i) associated with
the reading frame of the sequence (i.e. wi in
reading frame and, therefore, wi�1 and wi�2 in
the shifted frames 1 and 2, respectively) is in
general greater than F1(i�/1) and F1(i�/2) as theoccurrence probability of T0 is by definition
maximum in the reading frame (see point (ii) of
Section 2.1 explaining the misplaced trinucleo-
tides).
The function F2 considers the two circular codes
X0 and X2 (extended to T0 and T2). The prob-
ability difference P (T0, wi)�/P (T2, wi) is max-
imum among the 18 possible probabilitydifferences in the 3 frames. Indeed, the average
probabilities of T0, T1, and T2 in the frame 0
(respectively, 1, 2) of protein genes are 49%
(respectively, 26.5%, 32%), 28.5% (respectively,
43%, 23%), and 22.5% (respectively, 30.5%, 45%)
(Arques et al., 1998). By consequence, the max-
D.G. Arques et al. / BioSystems 66 (2002) 73�/92 79
imum probability difference in frame 0 (respec-
tively, 1, 2) is 26.5% with Prob(T0)�/Prob(T2)
(respectively, 16.5% with Prob(T1)�/Prob(T0),
22% with Prob(T2)�/Prob(T1)).
The functions F3 and F4 are based on the three
circular codes X0, X1, and X2 (extended to T0, T1,
and T2). The function F3 tests a ratio that is
maximum in the reading frame. The functions F1,
F2, and F3 favor the circular code X0 characterising
the reading frame, while the function F4 considers
the three circular codes in their three associated
frames.
Finally, as T0 is self-complementary, and as T1
and T2 are complementary to each other, the four
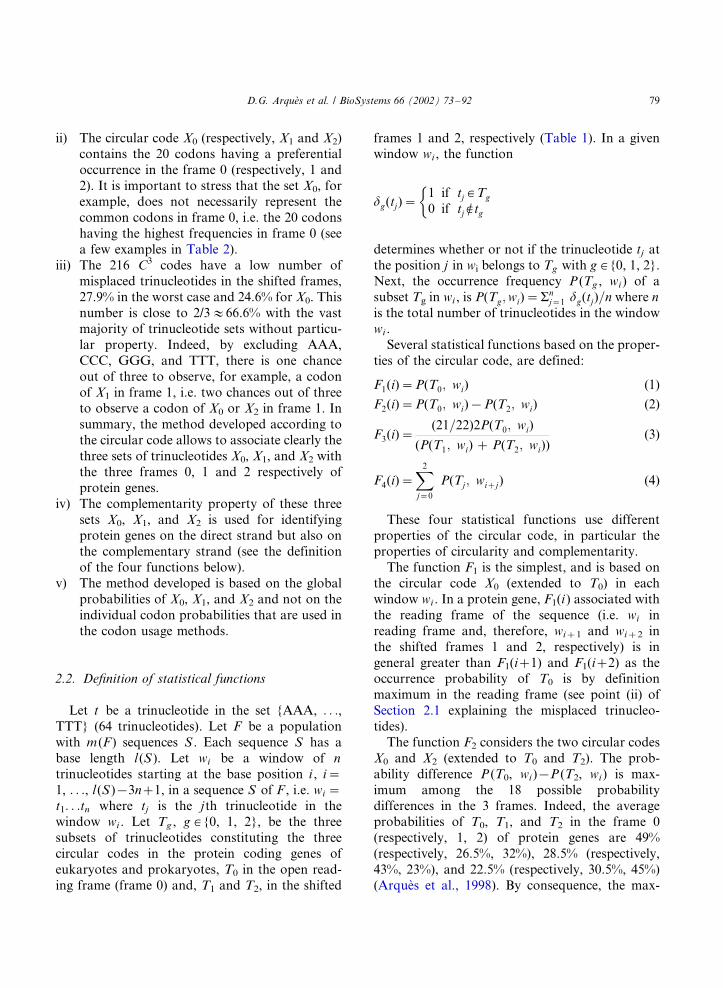
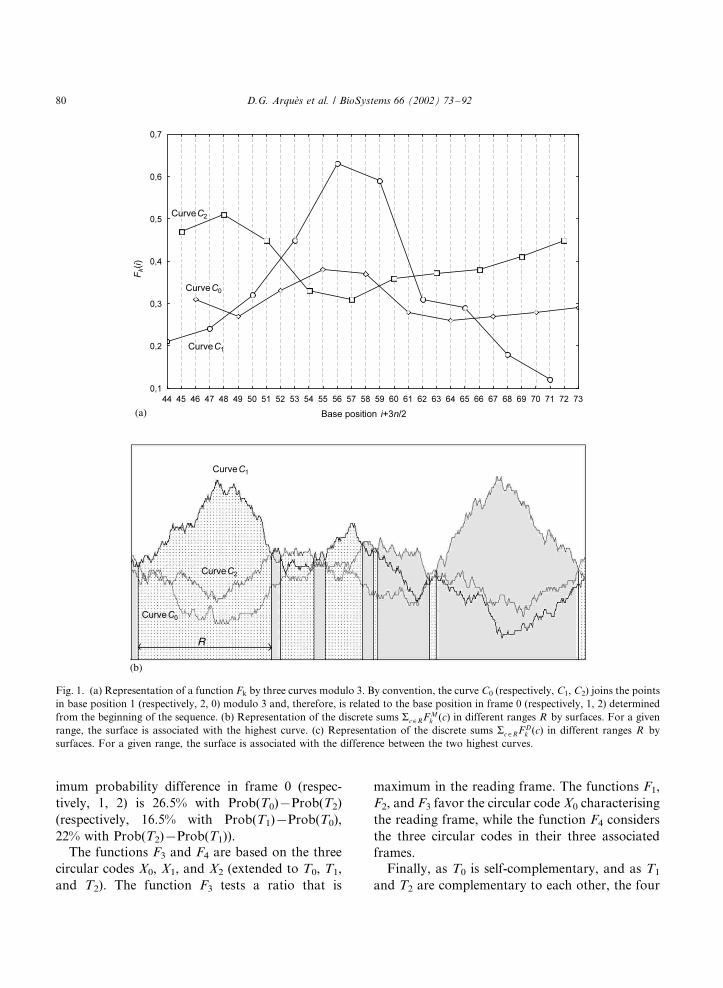
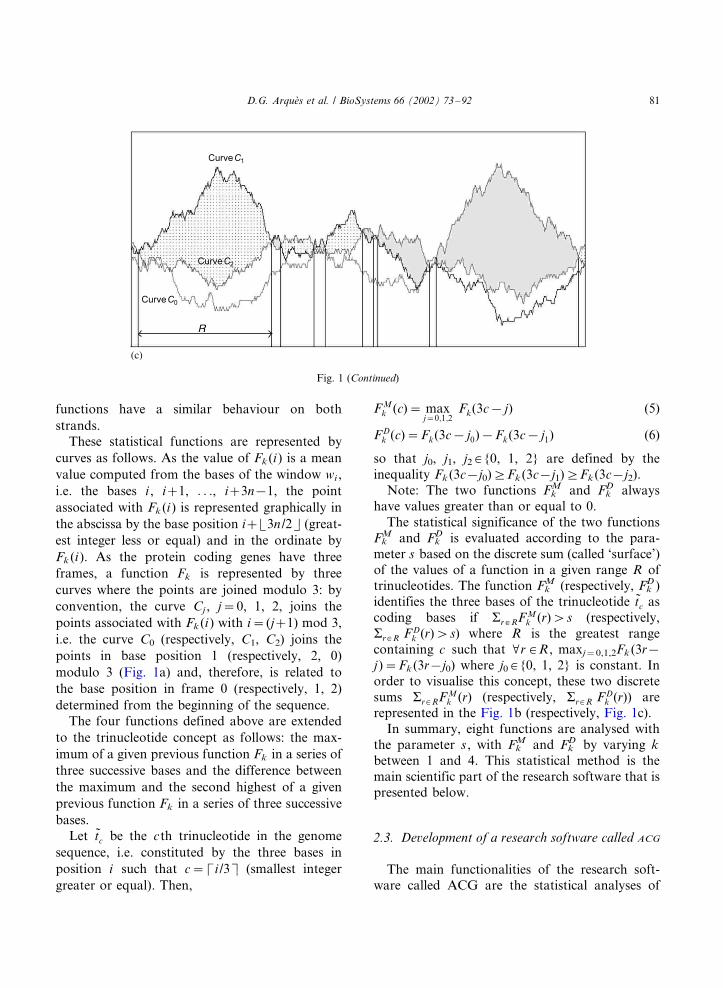
Fig. 1. (a) Representation of a function Fk by three curves modulo 3. By convention, the curve C0 (respectively, C1, C2) joins the points
in base position 1 (respectively, 2, 0) modulo 3 and, therefore, is related to the base position in frame 0 (respectively, 1, 2) determined
from the beginning of the sequence. (b) Representation of the discrete sums ac �RFMk (c) in different ranges R by surfaces. For a given
range, the surface is associated with the highest curve. (c) Representation of the discrete sums ac �RFDk (c) in different ranges R by
surfaces. For a given range, the surface is associated with the difference between the two highest curves.
D.G. Arques et al. / BioSystems 66 (2002) 73�/9280
functions have a similar behaviour on both
strands.
These statistical functions are represented by
curves as follows. As the value of Fk(i) is a mean
value computed from the bases of the window wi ,
i.e. the bases i , i�/1, . . ., i�/3n�/1, the point
associated with Fk (i ) is represented graphically in
the abscissa by the base position i�/�/3n /2�/ (great-
est integer less or equal) and in the ordinate by
Fk (i). As the protein coding genes have three
frames, a function Fk is represented by three
curves where the points are joined modulo 3: by
convention, the curve Cj , j�/0, 1, 2, joins the
points associated with Fk (i) with i�/(j�/1) mod 3,
i.e. the curve C0 (respectively, C1, C2) joins the
points in base position 1 (respectively, 2, 0)
modulo 3 (Fig. 1a) and, therefore, is related to
the base position in frame 0 (respectively, 1, 2)
determined from the beginning of the sequence.
The four functions defined above are extended
to the trinucleotide concept as follows: the max-
imum of a given previous function Fk in a series of
three successive bases and the difference between
the maximum and the second highest of a given
previous function Fk in a series of three successive
bases.
Let tc be the cth trinucleotide in the genome
sequence, i.e. constituted by the three bases in
position i such that c�/�/i /3�/ (smallest integer
greater or equal). Then,
FMk (c)� max
j�0;1;2Fk(3c� j) (5)
FDk (c)�Fk(3c� j0)�Fk(3c� j1) (6)
so that j0, j1, j2 � /{0, 1, 2} are defined by the
inequality Fk (3c�/j0)]/Fk (3c�/j1)]/Fk(3c�/j2).
Note: The two functions FkM and Fk
D always
have values greater than or equal to 0.
The statistical significance of the two functions
FkM and Fk
D is evaluated according to the para-
meter s based on the discrete sum (called ‘surface’)
of the values of a function in a given range R oftrinucleotides. The function Fk
M (respectively, FkD )
identifies the three bases of the trinucleotide tc as
coding bases if ar �RFMk (r)�s (respectively,
ar �R F Dk (r)�s) where R is the greatest range
containing c such that �/r � /R , maxj�0,1,2Fk (3r�/
j)�/Fk (3r�/j0) where j0 � /{0, 1, 2} is constant. In
order to visualise this concept, these two discrete
sums ar�RF Mk (r) (respectively, ar�R FD
k (r)) arerepresented in the Fig. 1b (respectively, Fig. 1c).
In summary, eight functions are analysed with
the parameter s , with FkM and Fk
D by varying k
between 1 and 4. This statistical method is the
main scientific part of the research software that is
presented below.
2.3. Development of a research software called ACG
The main functionalities of the research soft-
ware called ACG are the statistical analyses of
Fig. 1 (Continued)
D.G. Arques et al. / BioSystems 66 (2002) 73�/92 81
different functions based on the circular code in
sequence populations, the identification of protein
genes in genomes, and the determination of their
frame. Furthermore, several patterns of protein
genes can be evaluated: their length, their position
in the genome, their relative position between
themselves, and the presence of internal frames.
Several examples of these possibilities are given in
the Section 3.The software is written with three units: a
sequence analysis unit, a statistical function unit
and an interface unit.
The sequence analysis unit reads the sequences
and computes the occurrence frequency P (Tg, wi)
in a window according to the algorithm described
below. This unit calls the statistical function unit
for computing a chosen function FkM and Fk
D .
Precisely, the four functions Fk and their trinu-
cleotide evaluation FkM or Fk
D are implemented in
this statistical function unit, which allows statis-
tical numerical results on a sequence population F
(eventually on one sequence). The interface unit
allows the choice of different statistical para-
meters: the EMBL sequence file (population F or
sequence S ), the statistical function FkM or Fk
D , the
window length n in trinucleotides, and the statis-
tical surface parameter s . It also has a graphical
functionality for displaying the graphical curves:
the start base position in the sequence, the curve
display window length in bases, the left/right scroll
of a curve allowing to display a curve again, and a
coloured curve associated with the frame for a
direct interpretation. The curve display window
can be printed on a broad range of printing devices. The statistical numerical results are stored
in text files.
This structure in units easily allows modifica-
tions and extensions of the software ACG. ACG
has been developed to be interactive and user-
friendly. ACG is written in Pascal Delphi and
implemented on IBM compatible microcomputers.
It can be used without any computer knowledge.
The algorithm for computing the occurrence
frequency P (Tg , wi) is constructed such that the
different bases in each sequence are read only one
time.
A window wi of n trinucleotides runs from the
first (i�/1) base to the base position i�/l(S )�/3n�/
Fig. 2. Computation of the three occurrence frequencies P (Tg ,
wi ) in the window wi from the window wi�3. The two windows
wi and wi�3 differ only from one trinucleotide. The ‘destroyed
trinucleotide’ td is the trinucleotide belonging to wi�3 but not
to wi , i.e. the trinucleotide from the position i�/3 to i�/1.
Similarly, the ‘constructed trinucleotide’ tc is the trinucleotide
belonging to wi but not to wi�3, i.e. the last trinucleotide in wi
that starts in position i�/3(n�/1) and ends in position i�/3n�/1.
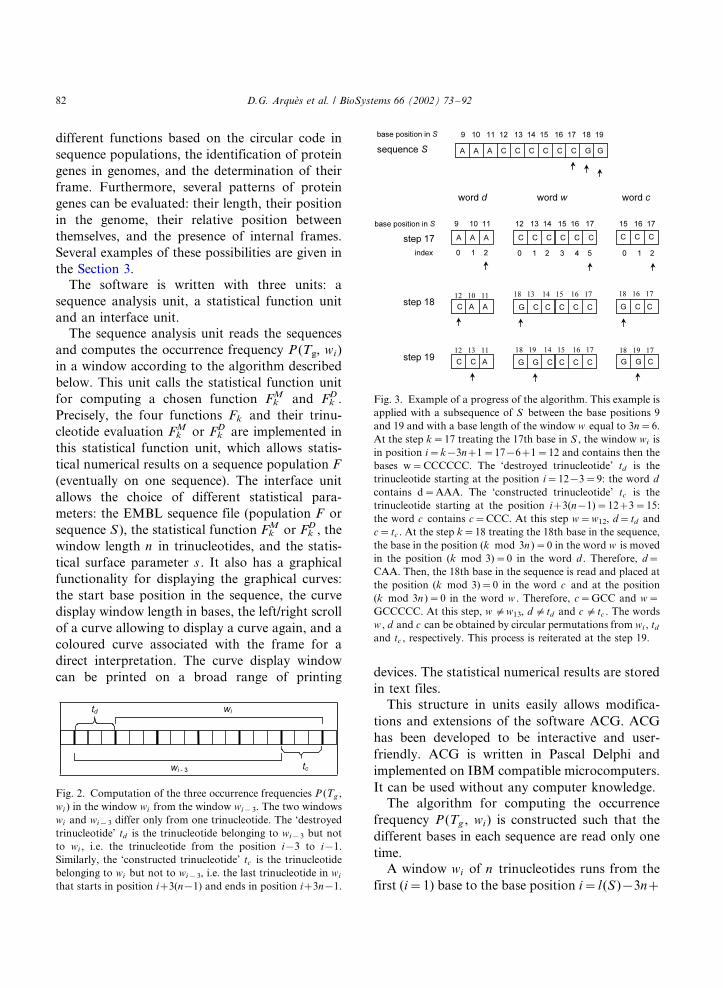
Fig. 3. Example of a progress of the algorithm. This example is
applied with a subsequence of S between the base positions 9
and 19 and with a base length of the window w equal to 3n�/6.
At the step k�/17 treating the 17th base in S , the window wi is
in position i�/k�/3n�/1�/17�/6�/1�/12 and contains then the
bases w�/CCCCCC. The ‘destroyed trinucleotide’ td is the
trinucleotide starting at the position i�/12�/3�/9: the word d
contains d�/AAA. The ‘constructed trinucleotide’ tc is the
trinucleotide starting at the position i�/3(n�/1)�/12�/3�/15:
the word c contains c�/CCC. At this step w�/w12, d�/td and
c�/tc . At the step k�/18 treating the 18th base in the sequence,
the base in the position (k mod 3n )�/0 in the word w is moved
in the position (k mod 3)�/0 in the word d . Therefore, d�/
CAA. Then, the 18th base in the sequence is read and placed at
the position (k mod 3)�/0 in the word c and at the position
(k mod 3n )�/0 in the word w . Therefore, c�/GCC and w�/
GCCCCC. At this step, w "/w13, d "/td and c "/tc . The words
w , d and c can be obtained by circular permutations from wi , td
and tc , respectively. This process is reiterated at the step 19.
D.G. Arques et al. / BioSystems 66 (2002) 73�/9282

1 in the sequence. At each step of the algorithm, a
base is read in the sequence and treated.
From the base position k�/1 to k�/3n�/2, the
algorithm computes the values P (Tg , wi ) for g�/0,
1, 2 and i�/1, 2, 3.
From the base position k�/3n�/3 to l(S ), the
algorithm computes for i�/k�/3n�/1, the values
P (Tg , wi ) for g�/0, 1, 2, i.e. from i�/4 to l(S )�/
3n�/1. The value P (Tg , wi ) is deduced from P (Tg ,
wi�3). Indeed, the two windows wi and wi�3 differ
only from one trinucleotide (Fig. 2). Let the
‘destroyed trinucleotide’ td be the trinucleotide
belonging to wi�3 but not to wi , i.e. the trinucleo-
tide from the position i�/3 to i�/1. Similarly, let
the ‘constructed trinucleotide’ tc be the trinucleo-
tide belonging to wi but not to wi�3, i.e. the last
trinucleotide in wi that starts in position i�/3(n�/1)
and ends in position i�/3n�/1 (Fig. 2). Suppose
that td � /Tg and tc � /Tg ?. If g"/g ?, then P (Tg , wi)�/
P (Tg , wi�3)�/1/n and P (Tg ?, wi )�/P(Tg ?, wi�3)�/
1/n . If g�/g ?, then P (Tg ƒ, wi)�/P (Tg ƒ, wi�3) for
gƒ�/0, 1, 2.
This algorithm is implemented with three words
indexed from 0: two words d and c of length three
associated with the destroyed and constructed
trinucleotides respectively, and w of length 3n ,
with the current window. At the step treating the
k th base in the sequence, the base in the position k
modulo 3n in the word w is moved in the position
k modulo 3 in the word d . Then, the k th base in
the sequence is read and placed at the position k
modulo 3 in the word c and at the position k
modulo 3n in the word w . In this way, the three
words contain correctly the series of bases of the
sequence which is read only one time.
Example of computation (Fig. 3): The subse-
quence of S that is analysed comprises the base
positions between 9 and 19. The base length of the
window w is chosen as 3n�/6. The proposed
computation starts at the step k�/17, treating
the 17th base in S . The window wi is in position
i�/k�/3n�/1�/17�/6�/1�/12 and then contains
the bases w�/CCCCCC. The ‘destroyed trinucleo-
tide’ td is the trinucleotide starting at the position
i�/12�/3�/9: the word d contains d�/AAA. The
‘constructed trinucleotide’ tc is the trinucleotide
starting at the position i�/3(n�/1)�/12�/3�/15:
the word c contains c�/CCC. Note that at thisstep w�/w12, d�/td, and c�/tc. At the step k�/18
treating the 18th base in the sequence, the base in
the position (k mod 3n )�/0 in the word w is
moved in the position (k mod 3)�/0 in the word
d . Therefore, d�/CAA. Then, the 18th base in the
sequence is read and placed at the position
(k mod 3)�/0 in the word c and at the position
(k mod 3n )�/0 in the word w . Therefore, c�/
GCC and w�/GCCCCC. Note that at this step,
w "/w13, d "/td, and c "/tc. The words w , d , and c
can be obtained by circular permutations from wi ,
td, and tc, respectively. This method avoids base
shifting in the words. This process is reiterated at
the next steps (see the Fig. 3 for the step 19).
2.4. Data acquisition
The gene population F used for the statistical
analysis is made of all human sequences (84 222
sequences, 303 124 560 bases) obtained from re-
lease 57 (December 1998) of the EMBL Nucleotide
Sequence Data Library. This large population
leads to stable frequencies for the different func-
tions analysed (law of large numbers). Therefore,these functions can be compared in order to
identify the most interesting. The protein coding
genes are extracted according to the keyword CDS
without discarding particular sequences. In this
population, 9.4% of bases are annotated as coding.
After the validation of the statistical approach, the
research software ACG has been developed for
identifying protein genes and used with the humanchromosomes (Sanger Centre, March 1999).
3. Results
3.1. Statistical results
The different functions are evaluated with the
software ACG according to the classical parameterSimple Matching Coefficient (SMC) (Burset and
Guigo, 1996), which considers the proportion of
bases (according to the EMBL release) identified
correctly by the function. Let as �F l(S)�nF be the
total number of bases in the gene population F .
Let True Positives (TP) (respectively, True Nega-
D.G. Arques et al. / BioSystems 66 (2002) 73�/92 83

tives (TN)) be the total number of bases identified
as coding (respectively, non-coding) bases by a
function (defined above) in the coding (respec-
tively, non-coding) genes in the gene population F .
The coefficient SMC is then defined as SMC�/
(TP�/TN)/nF (Burset and Guigo, 1996).
The eight functions FkM and Fk
D defined above
are analysed with the coefficient SMC. These
Fig. 4. (a) Statistical results giving the proportion SMC of bases identified correctly by the four functions FkM . The functions Fk
M are
evaluated by varying the parameter surface s between 6 and 130 with a step of 2 and the window length n between 33 and 169
trinucleotides with a step of 17 trinucleotides. The maximum value of the proportion SMC is given with a function FkM by varying s for
a given n . The four maxima of the four functions FkM are all less than the four maxima of the four functions Fk
D (see Fig. 4b). (b)
Statistical results giving the proportion SMC of bases identified correctly by the four functions FkD evaluated by the parameter s. The
functions FkD are evaluated by varying the parameter surface s between 6 and 130 with a step of 2 and the window length n between 33
and 169 trinucleotides with a step of 17 trinucleotides. The maximum value of the proportion SMC is given with a function FkD by
varying s for a given n . The parameter SMC is maximum with the function F2D with n�/50 and s�/38 and equal to 93.32% of bases
identified correctly.
D.G. Arques et al. / BioSystems 66 (2002) 73�/9284
functions are evaluated with the parameter surfaces between 6 and 130 with a step of 2. They are
calculated with a window length n varying be-
tween 33 and 169 trinucleotides with a step of 17
trinucleotides. For each function, a maximum
value of the coefficient SMC is obtained for given
values of s and n . The eight curves associated with
the eight maximum values of the eight functions
are represented in Fig. 4a and b by varying s for agiven n . Fig. 4a (respectively 4b) gives the four
curves FkM (respectively, Fk
D).
The Fig. 4a and b show that the coefficient SMC
is maximum with the function F2D with n�/50 and
s�/38, which identifies 93.32% of bases correctly.
For the function giving the maximum value of
the coefficient SMC (F2D with n�/50 and s�/38),
four other classical measures are computed, Sn,Sp, Sp?, and CC, as follows (Burset and Guigo,
1996). Let False Positives (FP) (respectively,
False Negatives (FN)) be the total number
of bases identified as coding (respectively,
non-coding) bases by a function (defined above)
in the non-coding (respectively, coding) genes in
the gene population F . Note: TP�/TN�/FP�/
FN�/nF .The definitions and results of these four mea-
sures are:
i) The Sensitivity Sn is the proportion of coding
bases identified correctly by the function:
Sn�TP
TP � FN�39:75%
ii) The Specificity (Sp) is the proportion of non-
coding bases identified correctly by the func-
tion:
Sp�TN
TN � FP�98:88%
iii) Another definition of the Specificity Sp? is the
proportion of coding bases among the bases
identified as coding by the function:
Sp?�TP
TP � FP�78:71%
iv) The correlation coefficient CC is a measure of
global accuracy where the value 1.00 corre-
sponds to a perfect prediction and where
the value 0.0 is expected for a random predic-
tion:
CC�(TP � TN) � (FN � FP)
((TP � FN)(TN � FP)(TP � FP)(TN � FN))1=2
�0:53
3.2. Applications of the research software ACG with
the human chromosomes
3.2.1. Three examples leading to classical results
The research software ACG identifies protein
genes and their frames as follows:
The identification of a protein gene (called CDS
according to the EMBL syntax) results from acurve that is significantly greater than the two
others that lead to a large surface s (notion
introduced in Section 2). The existence of a top
curve is justified by the fact that the associated
function Fk is based on the circular code, which
is a strong property of the protein genes (see
Section 1). The intersection of the two highest
curves allows for predicting a beginning andend regions of protein genes.
The identification of a frame of a protein gene is
deduced from the frame of the top curve
determined from the beginning of the sequence
(see the Section 2).
Three examples of identification of protein
genes (CDS) listed in the EMBL human chromo-
somes with the software ACG, are given.
Fig. 5a identifies a large CDS (2295 bases in the
human DNA sequence from clone 512B11 onchromosome 6p24�/25). Indeed, the curve becomes
greater than the two others. Note that in a random
sequence, e.g. a sequence generated with the four
bases with equiprobability, leads to three similar
horizontal curves. These three curves are gathered
together before the beginning of the CDS (5?
D.G. Arques et al. / BioSystems 66 (2002) 73�/92 85
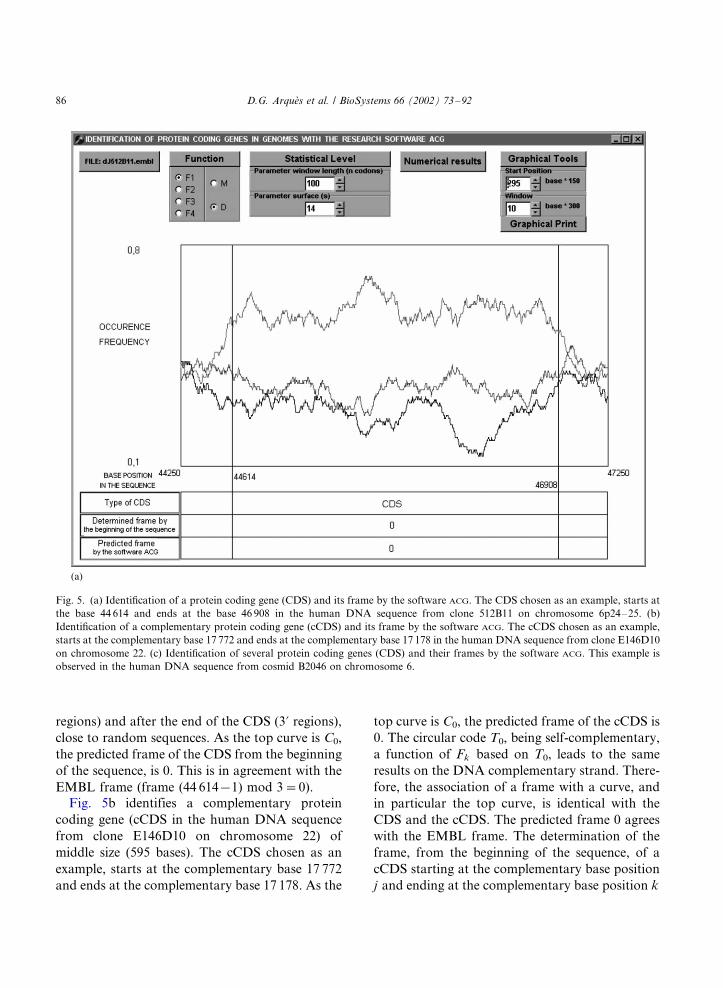
regions) and after the end of the CDS (3? regions),
close to random sequences. As the top curve is C0,
the predicted frame of the CDS from the beginning
of the sequence, is 0. This is in agreement with the
EMBL frame (frame (44 614�/1) mod 3�/0).
Fig. 5b identifies a complementary protein
coding gene (cCDS in the human DNA sequence
from clone E146D10 on chromosome 22) of
middle size (595 bases). The cCDS chosen as an
example, starts at the complementary base 17 772
and ends at the complementary base 17 178. As the
top curve is C0, the predicted frame of the cCDS is
0. The circular code T0, being self-complementary,
a function of Fk based on T0, leads to the same
results on the DNA complementary strand. There-
fore, the association of a frame with a curve, and
in particular the top curve, is identical with the
CDS and the cCDS. The predicted frame 0 agrees
with the EMBL frame. The determination of the
frame, from the beginning of the sequence, of a
cCDS starting at the complementary base position
j and ending at the complementary base position k
Fig. 5. (a) Identification of a protein coding gene (CDS) and its frame by the software ACG. The CDS chosen as an example, starts at
the base 44 614 and ends at the base 46 908 in the human DNA sequence from clone 512B11 on chromosome 6p24�/25. (b)
Identification of a complementary protein coding gene (cCDS) and its frame by the software ACG. The cCDS chosen as an example,
starts at the complementary base 17 772 and ends at the complementary base 17 178 in the human DNA sequence from clone E146D10
on chromosome 22. (c) Identification of several protein coding genes (CDS) and their frames by the software ACG. This example is
observed in the human DNA sequence from cosmid B2046 on chromosome 6.
D.G. Arques et al. / BioSystems 66 (2002) 73�/9286
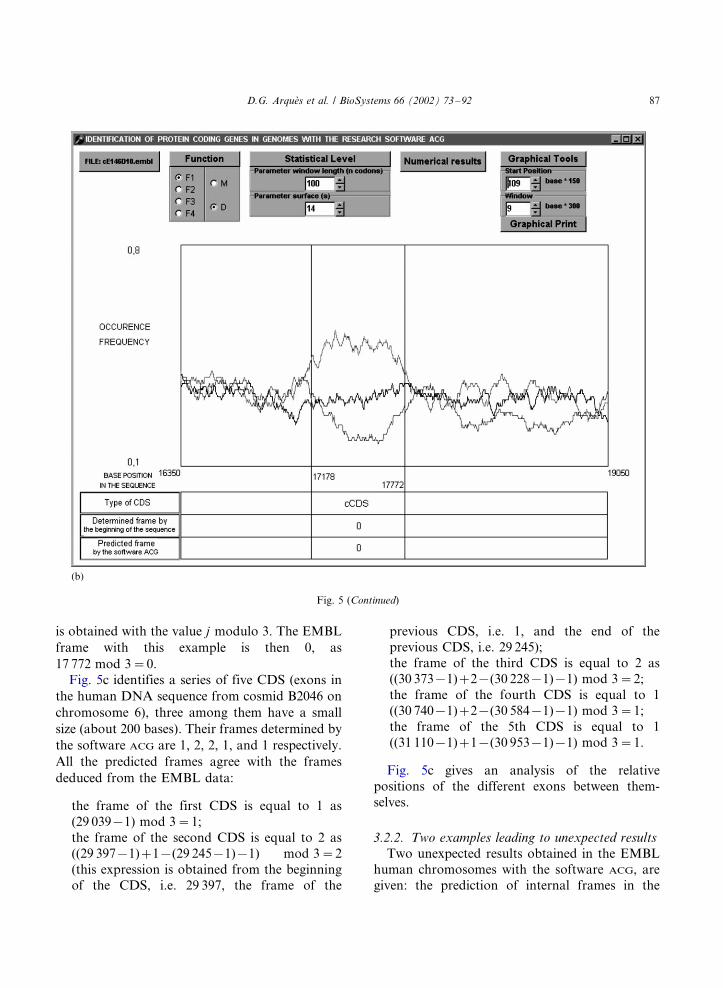
is obtained with the value j modulo 3. The EMBL
frame with this example is then 0, as
17 772 mod 3�/0.
Fig. 5c identifies a series of five CDS (exons in
the human DNA sequence from cosmid B2046 on
chromosome 6), three among them have a small
size (about 200 bases). Their frames determined by
the software ACG are 1, 2, 2, 1, and 1 respectively.
All the predicted frames agree with the frames
deduced from the EMBL data:
the frame of the first CDS is equal to 1 as
(29 039�/1) mod 3�/1;
the frame of the second CDS is equal to 2 as
((29 397�/1)�/1�/(29 245�/1)�/1) mod 3�/2
(this expression is obtained from the beginning
of the CDS, i.e. 29 397, the frame of the
previous CDS, i.e. 1, and the end of the
previous CDS, i.e. 29 245);the frame of the third CDS is equal to 2 as
((30 373�/1)�/2�/(30 228�/1)�/1) mod 3�/2;
the frame of the fourth CDS is equal to 1
((30 740�/1)�/2�/(30 584�/1)�/1) mod 3�/1;
the frame of the 5th CDS is equal to 1
((31 110�/1)�/1�/(30 953�/1)�/1) mod 3�/1.
Fig. 5c gives an analysis of the relative
positions of the different exons between them-
selves.
3.2.2. Two examples leading to unexpected results
Two unexpected results obtained in the EMBL
human chromosomes with the software ACG, are
given: the prediction of internal frames in the
Fig. 5 (Continued)
D.G. Arques et al. / BioSystems 66 (2002) 73�/92 87

protein genes and the prediction of a coding region
in the genomes.
Fig. 6a predicts internal frames in a CDS (1334
bases in the human DNA sequence from clone
1189B24 on chromosome Xq25�/26.3). Indeed,
there are three intersections of the two first highest
curves, which are associated with four assumed
internal frames 0, 1, 0 and 2. The frameshift of 1
(respectively, 2) base can be associated with 1
(respectively, 2) base insertion (modulo 3) or 2
(respectively, 1) base deletions (modulo 3). The
internal frames can also be explained with the
concatenation of coding regions whose lengths are
not all multiple of 3. This CDS is mentioned as
pseudogene in the EMBL file.
Fig. 6b predicts a coding region in the human
DNA sequence from clone 1048E9 on chromo-
some 22q11.2�/12.2 and its frame 2. This region is
associated with the primary transcript starting at
18 411 and ending at 18 946. Surprisingly, thepredicted frame by the software ACG is equal to
the EMBL frame (18 411�/1) mod 3�/2.
4. Discussion
A new statistical approach using functions
based on the circular code identifies 93.32%
(coefficient SMC) of bases in the human sequences
correctly, i.e. classifies the bases in coding and
Fig. 5 (Continued)
D.G. Arques et al. / BioSystems 66 (2002) 73�/9288

non-coding genes correctly. This approach has
been evaluated with the coefficient SMC, which
represents a good compromise between the Sensi-
tivity Sn of coding bases identified correctly
(39.75%) and the Specificity Sp of non-coding
bases identified correctly (98.88%) (in the popula-
tion studied, 90.6% bases are non-coding). These
frequencies are retrieved by varying the size of the
sequence population, e.g. by eliminating the short
sequences (data not shown). Indeed, a large
quantity of data used for the computation leads
to stable values. The parameter s (surface) used for
evaluating the statistical significance is a concept
extending the natural and simplest parameter v
based on the value of a function for a given base
position. The statistical results obtained with
this parameter v lead to a coefficient SMC that
is significantly low than 93.32% (data not shown).
The choice of the coefficient SMC for evaluating
this new statistical approach in order to identify
protein genes in genomes is confirmed by the
Correlation Coefficient (CC) whose maximum
(0.53) is also reached with the function F2D
with n�/50 and s�/38. Note that if all bases
Fig. 6. (a) Prediction of internal frames in a protein coding gene (CDS) and their internal frames by the software ACG. This example is
observed in the human DNA sequence from clone 1189B24 on chromosome Xq25�/26.3. (b) Prediction of a coding region in the
human DNA sequence from clone 1048E9 on chromosome 22q11.2�/12.2.
D.G. Arques et al. / BioSystems 66 (2002) 73�/92 89

are predicted as non-coding then CC is equal to
0.
The main purpose of this paper is to propose a
completely new approach for identifying protein
coding genes in genomes by using a gene model
based on the circular code. Therefore, the method
developed allows the global location of regions
that are coding for proteins or not. The start and
end of the coding region can be predicted by the
intersection of the two highest curves. Obviously,
the exact location of the boundaries can be
improved in the future by analysing in detail the
start regions and the end regions of coding genes
by considering, for example, the start codon ATG,
the stop codons TAA, TAG, and TGA, the
splicing sites, the TATA box, etc. It can also be
associated with other methods for identifying
protein genes in genomes, such as the codon usage
methods, the methods based on the hidden Mar-
kov model (HMM), etc. (e.g. Shulman et al., 1981;
Shepherd, 1981; Staden and McLachlan, 1982;
Fickett, 1982; Smith et al., 1983; Blaisdell, 1983;
Staden, 1984; Borodovsky and Mc Ininch, 1993;
Krogh et al., 1994; Burge and Karlin, 1997;
Lukashin and Borodovsky, 1998; Salzberg et al.,
1998; Pavy et al., 1999; Shmatkov et al., 1999,
etc.). However, it should be stressed that the
method in its actual state gives interesting results.
Indeed, the Correlation Coefficient (CC) is equal
to 0.53 with a data set containing 303 124 560 bases
without discarding particular sequences. Ob-
viously, these values become significantly better
Fig. 6 (Continued)
D.G. Arques et al. / BioSystems 66 (2002) 73�/9290
if there is a data selection before the statistical
analysis, e.g. by discarding particular sequences:
the sequences for which the exact location of the
protein genes is determined ambiguously, the
sequences encoding pseudogenes, etc. For exam-
ple, the removal of pseudogenes (784 274 bases
representing about 2.92% of the gene population
studied) increases the coefficient SMC from 93.32
to 93.53%.
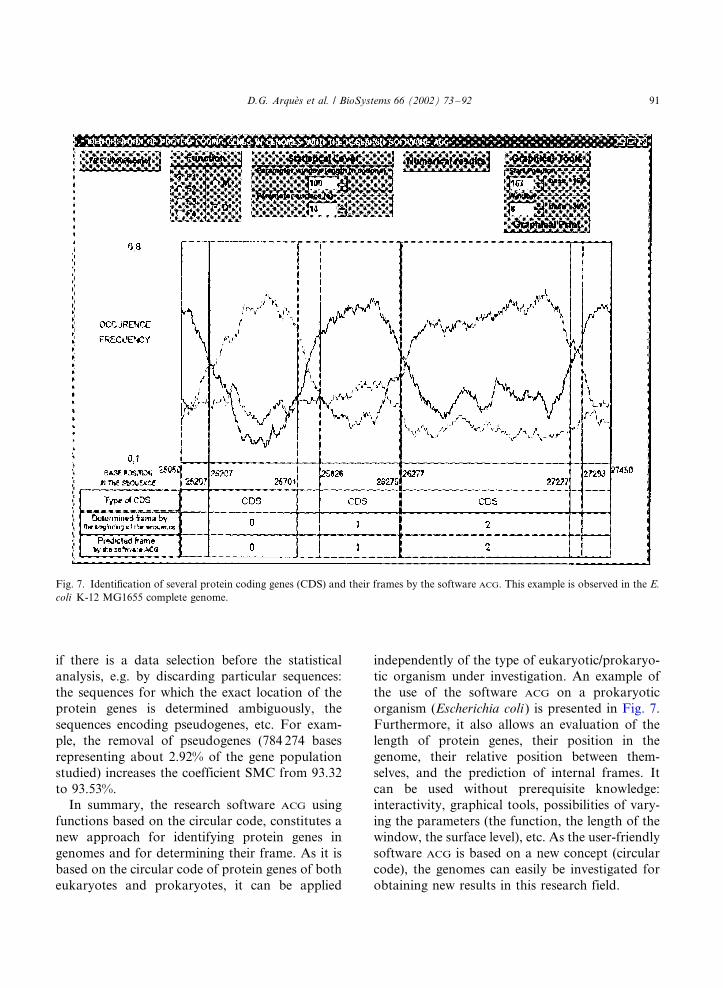
In summary, the research software ACG using
functions based on the circular code, constitutes a
new approach for identifying protein genes in
genomes and for determining their frame. As it is
based on the circular code of protein genes of both
eukaryotes and prokaryotes, it can be applied
independently of the type of eukaryotic/prokaryo-
tic organism under investigation. An example of
the use of the software ACG on a prokaryotic
organism (Escherichia coli ) is presented in Fig. 7.
Furthermore, it also allows an evaluation of the
length of protein genes, their position in the
genome, their relative position between them-
selves, and the prediction of internal frames. It
can be used without prerequisite knowledge:
interactivity, graphical tools, possibilities of vary-
ing the parameters (the function, the length of the
window, the surface level), etc. As the user-friendly
software ACG is based on a new concept (circular
code), the genomes can easily be investigated for
obtaining new results in this research field.
Fig. 7. Identification of several protein coding genes (CDS) and their frames by the software ACG. This example is observed in the E.
coli K-12 MG1655 complete genome.
D.G. Arques et al. / BioSystems 66 (2002) 73�/92 91
Acknowledgements
We thank the Editor-in-Chief and the Referee
for their advice.
References
Arques, D.G., Fallot, J.-P., Marsan, L., Michel, C.J., 1999. An
evolutionary analytical model of a complementary circular
code. BioSystems 49, 83�/103.
Arques, D.G., Fallot, J.-P., Michel, C.J., 1998. An evolutionary
analytical model of a complementary circular code simulat-
ing the protein coding genes, the 5? and 3? regions. Bull.
Math. Biol. 60, 163�/194.
Arques, D.G., Michel, C.J., 1996. A complementary
circular code in the protein coding genes. J. Theor. Biol.
182, 45�/58.
Arques, D.G., Michel, C.J., 1997a. A code in the protein coding
genes. BioSystems 44, 107�/134.
Arques, D.G., Michel, C.J., 1997b. A circular code in the
protein coding genes of mitochondria. J. Theor. Biol. 189,
273�/290.
Beal, M.-P., 1993. Codage Symbolique. Masson.
Berstel, J., Perrin, D., 1985. Theory of Codes. Academic Press.
Blaisdell, B.E., 1983. A prevalent persistent nonrandomness
that distinguishes coding and non-coding eukaryotic nuclear
DNA sequences. J. Mol. Evol. 19, 122�/133.
Borodovsky, M., Mc Ininch, J.D., 1993. GeneMark: parallel
gene recognition for both DNA strands. Comput. Chem. 17,
123�/133.
Burge, C., Karlin, S., 1997. Prediction of complete gene
structures in human genomic DNA. J. Mol. Biol. 268, 78�/
94.
Burset, M., Guigo, R., 1996. Evaluation of gene structure
prediction programs. Genomics 34, 353�/367.
Crick, F.H.C., Brenner, S., Klug, A., Pieczenik, G., 1976. A
speculation on the origin of protein synthesis. Origins Life 7,
389�/397.
Crick, F.H.C., Griffith, J.S., Orgel, L.E., 1957. Codes without
commas. Proc. Natl. Acad. Sci. 43, 416�/421.
Eigen, M., Schuster, P., 1978. The hypercycle. a principle of
natural self-organisation. Part C: the realistic hypercycle.
Naturwissenschaften 65, 341�/369.
Fickett, J.W., 1982. Recognition of protein coding
regions in DNA sequences. Nucleic Acids Res. 10, 5303�/
5318.
Karlin, S., Mrazek, J., Campbell, A.M., 1998. Codon usages in
different gene classes of the Escherichia coli genome. Mol.
Microbiol. 29, 1341�/1355.
Krogh, A., Mian, I.S., Haussler, D., 1994. A hidden Markov
model that finds genes in E. coli DNA. Nucleic Acids Res.
22, 4768�/4778.
Lukashin, A.V., Borodovsky, M., 1998. GeneMark.hmm: new
solutions for gene finding. Nucleic Acids Res. 26, 1107�/
1115.
Nirenberg, M.W., Matthaei, J.H., 1961. The dependance of
cell-free protein synthesis in E. coli upon naturally occur-
ring or synthetic polyribonucleotides. Proc. Natl. Acad. Sci.
47, 1588�/1602.
Pavy, N., Rombauts, S., Dehais, P., Mathe, C., Ramana,
D.V.V., Leroy, P., Rouze, P., 1999. Evaluation of gene
prediction software using a genomic data set: application to
Arabidopsis thaliana sequences. Bioinformatics 15, 887�/
899.
Salzberg, S.L., Delcher, A.L., Kasif, S., White, O., 1998.
Microbial gene identification using interpolated Markov
models. Nucleic Acids Res. 26, 544�/548.
Shepherd, J.C.W., 1981. Method to determine the reading
frame of a protein from the purine/pyrimidine genome
sequence and its possible evolutionary justification. Proc.
Natl. Acad. Sci. USA 78, 1596�/1600.
Shulman, M.J., Steinberg, C.M., Westmoreland, N., 1981. The
coding function of nucleotide sequences can be discerned by
statistical analysis. J. Theor. Biol. 88, 409�/420.
Shmatkov, A.M., Melikyan, A.A., Chernousko, F.L., Boro-
dovsky, M., 1999. Finding prokaryotic genes by the ‘frame-
by-frame’ algorithm: targeting gene starts and overlapping
genes. Bioinformatics 15, 874�/886.
Smith, T.F., Waterman, M.S., Sadler, J.R., 1983. Statistical
characterisation of nucleic acid sequence functional do-
mains. Nucleic Acids Res. 11, 2205�/2220.
Staden, R., 1984. Measurements of the effect that coding for a
protein has on DNA sequence and their use for finding
genes. Nucleic Acids Res. 12, 551�/567.
Staden, R., McLachlan, A.D., 1982. Codon preference and its
use in identifying protein coding regions in long DNA
sequences. Nucleic Acids Res. 10, 141�/156.
D.G. Arques et al. / BioSystems 66 (2002) 73�/9292
Related Documents