Identification of key soil indicators influencing plantation productivity and sustainability across a national trial series in New Zealand Michael S. Watt a, *, Murray R. Davis a , Peter W. Clinton a , Graham Coker a , Craig Ross b , John Dando b , Roger L. Parfitt b , Robyn Simcock c a Scion, PO Box 29237, Christchurch, New Zealand b Landcare Research, Private Bag 11052, Palmerston North, New Zealand c Landcare Research, Private Bag 92170, Auckland, New Zealand 1. Introduction New Zealand has signed an international agreement that commits it to report on progress towards sustainable forest management. The New Zealand government has agreed to report on indicators grouped within seven criteria of the Montreal Process (Anon., 1995). Two of these criteria (Criterion 2 and 4) address the important issue of whether plantations can be grown for an indefinite number of rotations without adversely affecting soil quality or the site’s capacity for net primary production. Although the Montreal Process and certification schemes identify potential criteria that can be used to describe site quality, foresters need tools, guidelines or management systems to enable them to turn these high-level, subjective sustainability goals into indicators that can be measured quantitatively (Richardson et al., 1999). Forest Ecology and Management 256 (2008) 180–190 ARTICLE INFO Article history: Received 25 January 2008 Received in revised form 9 April 2008 Accepted 12 April 2008 Keywords: Forest productivity Radiata pine Soil indicator ABSTRACT New Zealand is committed to developing sustainable forest management practices as evidenced through Government involvement in international forestry agreements such as the Montreal Process, and the forestry sector’s adoption of forest certification mechanisms. Despite this, there is little quantitative evidence of how plantation forestry affects site quality and long-term site productivity. To address this issue, a nationwide study of site quality was established at 31 key sites covering the range of edaphic and environmental conditions for New Zealand plantation forests. At each location, eight short-term site quality plots were planted at a very high stand density (40,000 stems ha 1 ) to rapidly identify key soil indicators of growth which may be useful for determining site sustainability. The plots at each site were arranged in a factorial design with the following three factors: species (Pinus radiata D. Don and Cupressus lusitanica Mill.), fertiliser (no fertiliser and nutrients supplied in excess of crop demands) and disturbance (low and high disturbance). These plots were harvested after 4 years and data was used to (i) examine treatment and site effects on volume mean annual increment (MAI) and (ii) identify key soil properties that influence volume MAI for the two species. Volume MAI significantly ranged 7-fold across sites. For the treatments, species accounted for most of the variance in volume MAI, with values for P. radiata significantly exceeding those of C. lusitanica by 95%. Volume MAI was significantly affected by fertilisation which induced gains of 33%. Disturbance did not significantly affect volume MAI. After correction had been made for climatic variables, soil properties that were most strongly related to volume MAI for both species included C:N ratio, total phosphorus (P), and organic P. When soil properties were included in combination, the best predictive models of volume MAI formulated for P. radiata included total P and C:N ratio while the best predictive model for C. lusitanica included C:N ratio and Olsen P. Variation in species sensitivity to total P and C:N ratio is likely to be attributable to their different mycorrhizal associations. For both species, the most important soil physical property influenced by management operations was total porosity. This research suggests that total P, C:N ratio, Olsen P and total porosity should be used as indicator properties for determining sustainability of plantation grown P. radiata and C. lusitanica. ß 2008 Elsevier B.V. All rights reserved. * Corresponding author at: Scion, PO Box 29237, Fendalton, Christchurch, New Zealand. Tel.: +64 3 364 2949; fax: +64 3 364 2812. E-mail address: [email protected] (M.S. Watt). Contents lists available at ScienceDirect Forest Ecology and Management journal homepage: www.elsevier.com/locate/foreco 0378-1127/$ – see front matter ß 2008 Elsevier B.V. All rights reserved. doi:10.1016/j.foreco.2008.04.024

Welcome message from author
This document is posted to help you gain knowledge. Please leave a comment to let me know what you think about it! Share it to your friends and learn new things together.
Transcript

Forest Ecology and Management 256 (2008) 180–190
Contents lists available at ScienceDirect
Forest Ecology and Management
journal homepage: www.elsevier.com/locate/foreco
Identification of key soil indicators influencing plantation productivity andsustainability across a national trial series in New Zealand
Michael S. Watt a,*, Murray R. Davis a, Peter W. Clinton a, Graham Coker a, Craig Ross b,John Dando b, Roger L. Parfitt b, Robyn Simcock c
a Scion, PO Box 29237, Christchurch, New Zealandb Landcare Research, Private Bag 11052, Palmerston North, New Zealandc Landcare Research, Private Bag 92170, Auckland, New Zealand
A R T I C L E I N F O
Article history:
Received 25 January 2008
Received in revised form 9 April 2008
Accepted 12 April 2008
Keywords:
Forest productivity
Radiata pine
Soil indicator
A B S T R A C T
New Zealand is committed to developing sustainable forest management practices as evidenced through
Government involvement in international forestry agreements such as the Montreal Process, and the
forestry sector’s adoption of forest certification mechanisms. Despite this, there is little quantitative
evidence of how plantation forestry affects site quality and long-term site productivity. To address this
issue, a nationwide study of site quality was established at 31 key sites covering the range of edaphic and
environmental conditions for New Zealand plantation forests. At each location, eight short-term site
quality plots were planted at a very high stand density (40,000 stems ha�1) to rapidly identify key soil
indicators of growth which may be useful for determining site sustainability. The plots at each site were
arranged in a factorial design with the following three factors: species (Pinus radiata D. Don and Cupressus
lusitanica Mill.), fertiliser (no fertiliser and nutrients supplied in excess of crop demands) and disturbance
(low and high disturbance). These plots were harvested after 4 years and data was used to (i) examine
treatment and site effects on volume mean annual increment (MAI) and (ii) identify key soil properties
that influence volume MAI for the two species.
Volume MAI significantly ranged 7-fold across sites. For the treatments, species accounted for most of
the variance in volume MAI, with values for P. radiata significantly exceeding those of C. lusitanica by 95%.
Volume MAI was significantly affected by fertilisation which induced gains of 33%. Disturbance did not
significantly affect volume MAI. After correction had been made for climatic variables, soil properties that
were most strongly related to volume MAI for both species included C:N ratio, total phosphorus (P), and
organic P. When soil properties were included in combination, the best predictive models of volume MAI
formulated for P. radiata included total P and C:N ratio while the best predictive model for C. lusitanica
included C:N ratio and Olsen P. Variation in species sensitivity to total P and C:N ratio is likely to be
attributable to their different mycorrhizal associations. For both species, the most important soil physical
property influenced by management operations was total porosity. This research suggests that total P,
C:N ratio, Olsen P and total porosity should be used as indicator properties for determining sustainability
of plantation grown P. radiata and C. lusitanica.
� 2008 Elsevier B.V. All rights reserved.
1. Introduction
New Zealand has signed an international agreement thatcommits it to report on progress towards sustainable forestmanagement. The New Zealand government has agreed to report
* Corresponding author at: Scion, PO Box 29237, Fendalton, Christchurch, New
Zealand. Tel.: +64 3 364 2949; fax: +64 3 364 2812.
E-mail address: [email protected] (M.S. Watt).
0378-1127/$ – see front matter � 2008 Elsevier B.V. All rights reserved.
doi:10.1016/j.foreco.2008.04.024
on indicators grouped within seven criteria of the Montreal Process(Anon., 1995). Two of these criteria (Criterion 2 and 4) address theimportant issue of whether plantations can be grown for anindefinite number of rotations without adversely affecting soilquality or the site’s capacity for net primary production. Althoughthe Montreal Process and certification schemes identify potentialcriteria that can be used to describe site quality, foresters needtools, guidelines or management systems to enable them to turnthese high-level, subjective sustainability goals into indicators thatcan be measured quantitatively (Richardson et al., 1999).
M.S. Watt et al. / Forest Ecology and Management 256 (2008) 180–190 181
Despite the importance of sustainability for the long-termviability of the forestry sector, there is little direct evidence toindicate how successive rotations, characteristic of plantationforestry, influence site productivity. As well-designed long-termfield trials for investigating sustainability are rare, evidencedemonstrating changes in productivity are uncommon, even at aregional level (Dyck and Cole, 1990). Within New Zealand, thereare considerable data that may be used to examine temporalchanges in productivity of the most commonly planted plantationspecies Pinus radiata D. Don, as annual growth has been measuredin permanent sample plots in some plantations for over 60 years(Woollons, 2000). However, these data are of questionable value inassessing temporal changes in site productivity because they areinvariably confounded by changes over time in managementpractices, tree genotype and climate (Morris and Miller, 1994;Richardson et al., 1999; Woollons, 2000). Mechanistic models arealso of limited use in assessing changes in site productivity as ourknowledge of many of the key ecosystem processes is incomplete(Yarie, 1990).
The importance of well-designed long-term field experimentsfor detecting changes in site productivity over time has beenemphasised by many researchers (Adlard et al., 1984; Dyck andCole, 1990; Richardson et al., 1999). Ideally, these trials should beinstalled across a wide environmental range and run over anumber of successive rotations. Within the trials, it is vital tocontrol management and genotype factors and monitor climaticparameters, so that any changes in productivity can be correctlyattributed to alterations in site quality (Morris and Miller, 1994).
Although long-term field trials are important for determining ifsite productivity changes over time, these trials do little toelucidate the mechanisms causing alterations to site quality(Adlard et al., 1984; Richardson et al., 1999). Understanding thesemechanisms is essential as it provides the information necessaryfor managers to predict and prevent or ameliorate declining sitequality. Measurements of soil properties are useful in this regard asindicators of changes in site quality. As forest productivity is animportant indicator of sustainability, these soil properties must berelated to measures of performance such as net primaryproduction (Richardson et al., 1999). Use of this information andthe development of relationships between various managementpractices and soil properties would enable site-specific recom-mendations to be made on management practices necessary tomaintain the productive capacity of the site (Richardson et al.,1999).
One approach that could be used to rapidly determine the keysoil properties influencing site productivity is experimentation inminiature. This method, which uses small scale, highly stockedplots to rapidly induce site productivity limitations and compressthe length of the rotation, has considerable merit (Amateis et al.,2003a). Previous research shows that trees grown at these highstand densities over short periods mimic growth patterns of treesgrowing over longer periods at conventional stand densities(Amateis et al., 2003a,b; Sharma et al., 2003). As the experimentalcycle is shortened, this approach is more efficient and cost effectivethan the same experiment conducted at an operational scale. Thesegreater efficiencies allow relatively large numbers of plots to beinstalled, which permits increased coverage across a wide range ofenvironments. Another key advantage of this approach is that thesmall plot area used is subject to less edaphic variation, whichmakes it easier to characterise soil properties within the plot(Amateis et al., 2003a). Although these small plots are short-lived,the use of high stand densities should ensure that there issignificant demand for resources from the site quickly, thusenabling the key soil properties influencing productivity to beidentified.
Following this rationale, a nationwide study of relationshipsbetween forest productivity and site quality was initiated at 31key sites covering the range of edaphic and environmentalconditions for New Zealand plantation forests. At each locationeight plots were installed at high stockings (40,000 stems ha�1)with the following three factors arranged factorially: species (P.
radiata and Cupressus lusitanica Mill.), fertiliser (no fertiliser andnutrients supplied in excess of crop demands) and disturbance(low and high disturbance). A preliminary study at age twoshowed the key determinants of volume productivity in this siteseries to be total soil nitrogen, total soil phosphorus and depthof the A horizon for both species (Watt et al., 2005). These plotswere harvested after 4 years and data was used in this study to(i) examine treatment and site effects on volume mean annualincrement (MAI) and (ii) identify the soil properties that mostinfluence volume MAI for the two species, across the sitenetwork.
2. Materials and methods
2.1. Location of site quality plots
Sites were selected to represent the range in soil properties onwhich plantation forests are currently grown in New Zealand(Fig. 1). Soils were grouped according to the New Zealand soilclassification (Hewitt, 1998), which recognises 15 soil orders.Plantation forests within New Zealand occur on 9 of these 15 soilorders, namely the Allophanic, Brown, Oxidic, Pallic, Podzol,Pumice, Raw, Recent and Ultic soil orders. The trial series wasestablished on all of these soil orders apart from Oxidic, whichrepresents a small proportion of the area (0.7%) on which the forestestate is planted (R. Simcock, personal communication). Thenumber of sites established on each soil order was weighted to berepresentative of the corresponding plantation area on which thesoil order is found (Fig. 1).
Sites were further screened using climatic surfaces to ensurethat selected areas represented the considerable range inmeteorological conditions found throughout New Zealand forestplantations. Long-term climate data obtained from thin-platespline surfaces (Hutchinson and Gessler, 1994) fitted to meteor-ological station data (Leathwick and Stephens, 1998) were used todetermine climatic conditions at each selected site. Whencompared to long-term average values for all plantation forests(Anon., 1983), the 31 selected sites almost completely encompassthe range in total annual rainfall and mean annual temperature,relative humidity and solar radiation.
2.2. Experimental design
Site quality plots were located at each of the 31 selectedlocations. At each location, a series of eight plots was installedusing a full factorial design (three factors with two levels perfactor) with the following three factors: species (P. radiata and C.lusitanica), fertiliser (no fertiliser and nutrients supplied in excessof crop demands) and disturbance (low and high disturbance). Theplots were located in close proximity to each other and were ofsimilar slope and aspect. P. radiata was chosen as it is the mostcommon plantation species within New Zealand, while C. lusitanica
was selected as it is a commonly planted species on more fertilefarm sites. Sufficient quantities of fertiliser were applied tofertilised plots to ensure that there were no nutrient limitations.Disturbed plots were located on areas compacted by previousharvesting operations, while undisturbed plots were located inareas which had no previous compaction from harvestingoperations.

Fig. 1. Distribution map of soil orders showing the location of the site quality plots.
M.S. Watt et al. / Forest Ecology and Management 256 (2008) 180–190182
Each plot was small in size (3 m � 3 m) and contained ninemeasurement trees spaced at 0.5 m � 0.5 m (40,000 stems ha�1)surrounded by a two-row buffer. Regular applications of herbicidewere made to ensure weed-free conditions. All sites were plantedwith seed stock of the same origin (growth and form rating of 191
(Vincent and Dunstan, 1989) for P. radiata and 99/275 for C.
lusitanica) sourced from the Scion nursery in Rotorua. At each ofthe 31 selected locations, permanent 40 m � 40 m sample plotswere installed, at the same time, adjacent to the site quality plots atconventional stand densities (500–1100 stems ha�1) using P.
radiata seedlings with a growth and form rating of 19. Thesepermanent sample plots were installed to monitor the effects ofplantation forestry on long-term changes in key soil indicatorproperties, identified from the adjacent site quality plots. This
1 The growth and form rating is an index which ranks improvements in growth
and form of a particular seedlot relative to unimproved seed (Vincent, 1987).
monitoring should provide a basis for site-specific recommenda-tions on management practices necessary to maintain theproductive capacity of New Zealand’s plantation forests. The sitequality plots were installed over a 3-year period from 2000 to2002.
In fertilised plots, broadcast application of fertiliser wasundertaken three times a year during the first year (winter,spring, summer) and thereafter during spring at annual intervals.Over the 4 years of the study, the elemental quantity of nitrogen(N), phosphorus (P), potassium (K), sulphur, magnesium (Mg) andcalcium (Ca), applied to each fertilised plot as Nitrophospka, was690, 200, 558, 160, 40 and 160 kg ha�1, respectively. Thesequantities of fertiliser were applied to ensure that there were nolimitations in these nutrients at each site. At sites identified byforest history or soil analysis (at time of planting) as beingdeficient in boron, magnesium and copper, additional applica-tions of these nutrients to fertilised plots were made during
M.S. Watt et al. / Forest Ecology and Management 256 (2008) 180–190 183
summer in sufficient quantities to ensure these nutrients werenon-limiting.
2.3. Climatic measurements
Measurements of photosynthetically active radiation, airtemperature and relative humidity were taken from sensorsinstalled on a 3 m tower located adjacent to the experimentalplots. A tipping bucket rain gauge positioned on top of the towerwas used to measure above-canopy rainfall. Vapour pressuredeficit (VPD) was determined from relative humidity andtemperature measurements using standard formulae.
2.4. Measurements of soil properties
Soil physical properties were measured on samples of mineral soiltaken from the edges of disturbed and undisturbed plots immedi-ately prior to planting. Air capacity (at 10 kPa), macroporosity (at5 kPa), total porosity, bulk density, particle density and void ratiowere determined to 200 mm following the procedures described byGradwell (1972). To ensure that results between sites were notaffected by in situ site variation in volumetric water content, conepenetration resistance was measured in the laboratory at�10 kPa onsoil samples extracted at 0–100 mm and 100–200 mm.
A soil pit was excavated down to impermeable layers, or if none,parent material (average depth of 980 mm) prior to plot establish-ment in an undisturbed area adjacent to the plots at each locationto determine soil texture. From this pit, particle size was measuredby dispersing the field-moist soil in water with an ultrasonic probeand separating the<2 mm, 2–63 mm and 63 mm to 2 mm fractionsby sedimentation (Claydon, 1989). The profile drainage class(Hewitt, 1993) and depth to mottling were recorded.
A comprehensive set of soil chemical measurements were takenfrom the site quality plots after harvest at age 4 years. Soil chemistrysamples were taken between trees from 0 to 100 mm depth onmineral soil at 16 points in all plots and bulked to give 16 cores perplot. Sampling points were located approximately 0.5 m apartaround the nine trees at the centre of the plots. These soil sampleswere analysed for soil moisture, pH in water, total carbon (C), total N,total P, organic P, inorganic P, Bray P, Olsen P, exchangeable bases,and CEC, following the methods described by Blakemore et al.(1987). Results are expressed on an oven dry basis (105 8C).
2.5. Determination of root-zone water storage
A daily water balance equation was used to calculate root-zonewater storage (W) on the ith day as,
Wi ¼Wi�1 þ Pi � Eti � Etwi � Egi � Fi (1)
where Pi is rainfall, Eti is transpiration from the dry tree canopy, Etwi
evaporation of intercepted rainfall from the tree canopy, Egi
evaporation from the soil, and Fi drainage from the root zone(Whitehead et al., 2001). Using the methods, and parameter values,described in Watt et al. (2008), Wi, was modelled in all treatmentswithin the 31 sites over the 4-year period, and successfullyvalidated at eight sites in the final year (Watt et al., 2008).
The water balance model requires seasonal measurements ofleaf area index and total available root-zone water storage by siteand treatment. At four monthly intervals, leaf area index of eachplot was measured directly using a canopy analyser (LAI-2000, Li-Cor Inc., Lincoln, NE, USA). Following Gradwell (1972), availablevolumetric water content, ua, was determined by horizon frommeasurements in the soil pit as ua = umax � umin, where umax andumin represent maximum and minimum volumetric water content,
determined at tensions of 10 kPa and 1500 kPa, respectively. Usingthese measurements of ua, total available root-zone water, Wa, wasdetermined over the root depth by site and treatment fromWa = uar(1 � c), where c is stone content and r is root depth. Rootdepth was determined from measurements of the deepest root onfive trees per plot taken from the four undisturbed plots at harvest.As root depth was significantly affected by species (F-value = 62.12, P-value < 0.0001) but not fertilisation (F-value = 0.76, P-value = 0.38) or the interaction of fertilisationand species (F-value = 0.11, P-value = 0.73), unique root depthswere used for each species, determined as the deepest plot averageobtained from fertilised and unfertilised plots.
2.6. Tree dimensions
Ground-line diameter and height of the nine measurementtrees were measured annually. Stem volume (V) was determinedfrom tree height (h) and ground-line diameter (D) for both P.
radiata and C. lusitanica using the following equation previouslyfound to be applicable to stands covering a range of ages andstockings (Beets, unpublished data):
V ¼ pD
2
� �2
h
!0:25 (2)
2.7. Data analysis
All analyses were undertaken in SAS (SAS Institute, 1996).Variables were tested for normality and homogeneity of varianceand transformations made as necessary to meet the underlyingstatistical assumptions of the models used.
A two-way analysis of variance (ANOVA) was used to test forthe main effects of disturbance and site on soil physical propertieswithin the top 100 mm of the mineral horizon. The main influenceof site, fertilisation, disturbance, species and interactive effect ofthe three treatments (fertiliser, species and disturbance), on soilchemical properties was examined using analysis of variance. Themain influence of site and treatment (fertiliser, species anddisturbance) and interactive effects of treatment on height,ground-line diameter, total volume and volume MAI over the 4-year period, was tested using analysis of variance. Initial size wasincluded as a covariate in the model when found to be significantlyrelated to the tree dimensions.
Key soil properties influencing volume MAI were determined byspecies using data from all four treatment combinations offertilisation and disturbance. To remove the effect of climate,base models of volume MAI were separately constructed for eachspecies. Climatic variables in these models included average airtemperature and average annual root-zone water storage for P.
radiata and average air temperature and average total annualrainfall for C. lusitanica. These variables were selected as theyrepresented the combination of environmental variables moststrongly related to volume MAI from those available. Initial volumewas also included in the model for P. radiata as this had asignificant influence on volume MAI.
After correction had been made for the effects of climate,bivariate relationships between volume MAI and soil propertieswere examined by singly adding soil properties to the two basemodels. Soil texture variables used in this analysis weredetermined over both the top 100 mm and the entire root depth,as determined at harvest. The soil physical properties used weredetermined both over the top 100 mm and top 200 mm of mineralsoil. For soil texture and physical property variables, the reportedvalues are from the depth which displayed the strongest
M.S. Watt et al. / Forest Ecology and Management 256 (2008) 180–190184
correlation with volume MAI. The proportion of roots in mottledsoil was determined from (1 �mottle depth/root depth), whereroot depth, at age 4 years, exceeded mottle depth, and denoted as 0,where mottle depth was greater than root depth.
A multiple regression model for each species was constructedusing a combination of edaphic properties. Using appropriatefunctional forms and any necessary transformations, variableswere sequentially introduced into each base model. Variables wereonly retained if inclusion significantly improved the model andparameter values for the included variables were significant(P < 0.05). In constructing the two final models, emphasis wasplaced on developing simple equations with very little apparentbias.
3. Results
3.1. Site level variation in climate, soil properties, tree dimensions
Climatic variation between sites was considerable (Table 1).Across sites, mean annual rainfall ranged from 458 mm at aninland site in the South Island (site 28; Fig. 1) up to 3035 mm at asite west of the main divide in the South Island (site 22; Fig. 1).When averaged across treatments, average annual root-zone waterstorage ranged from 12 to 112 mm. Variation in annual averagetemperature also exhibited considerable variation from 8.5 8C at ahigh elevation South Island site (site 29; Fig. 1) to 17.0 8C at acoastal site in the northern North Island (site 5; Fig. 1).
The selected sites included extremes in soil texture rangingfrom single-grained scoria and sandy soils to clay loam soils.Variation in all textural components was considerable (Table 1)and most pronounced for the coarse (0–72.0%) and medium sandfractions (1–39.4%). All soil physical properties significantly varied(P < 0.0001) across sites. Variation was most pronounced for the
Table 1Site level variation in climate, soil texture over the root depth and soil chemical
properties over the top 100 mm of mineral soil
Variable Mean and range
Climate
Average annual air temperature (8C) 13.4 (8.5–17.0)
Average min. annual air temperature (8C) 7.6 (3.6–12.3)
Average annual PAR (MJ PAR m�2 d�1) 6.0 (4.2–7.5)
Total annual rainfall (mm yr�1) 1349 (458–3035)
Average annual VPD (kPa) 0.51 (0.31–0.72)
Average annual W (mm) 47 (12–112)
Soil texture
Coarse sand (%) 8.0 (0.0–72.0)
Medium sand (%) 9.6 (1.0–39.4)
Fine sand (%) 21.2 (2.8–68.5)
Silt (%) 38.8 (2.1–71.0)
Clay (%) 22.4 (1.5–50.5)
Chemical properties
Carbon (%) 5.7 (1.4–27.5)
Nitrogen (%) 0.28 (0.04–0.79)
C:N ratio 20.5 (11.7–34.5)
pH 5.0 (4.0–5.8)
CEC (cmol kg�1) 19 (4–45)
Exchangeable Ca (cmol kg�1) 3.8 (0.3–17.4)
Exchangeable K (cmol kg�1) 0.50 (0.06–1.04)
Exchangeable Mg (cmol kg�1) 1.8 (0.3–9.8)
Exchangeable Na (cmol kg�1) 0.25 (0.06–0.52)
Sum bases (cmol kg�1) 6.4 (1–24)
Base saturation (%) 33 (7–77)
Bray P (mg kg�1) 47 (8–154)
Olsen P (mg kg�1) 17 (5–48)
Inorganic P (mg kg�1) 187 (21–438)
Organic P (mg kg�1) 314 (33–699)
Total P (mg kg�1) 501 (65–910)
closely related variables macroporosity and air capacity whichranged from 5 to 44% and 5 to 48%, respectively, across sites.
Site variation for all soil chemical properties was highlysignificant (P < 0.0001). When averaged across treatments, varia-tion was most marked for exchangeable Ca, exchangeable Mg, sumof bases, organic P and inorganic P, which, respectively, ranged 53-,38-, 32-, 22- and 21-fold across sites (Table 1).
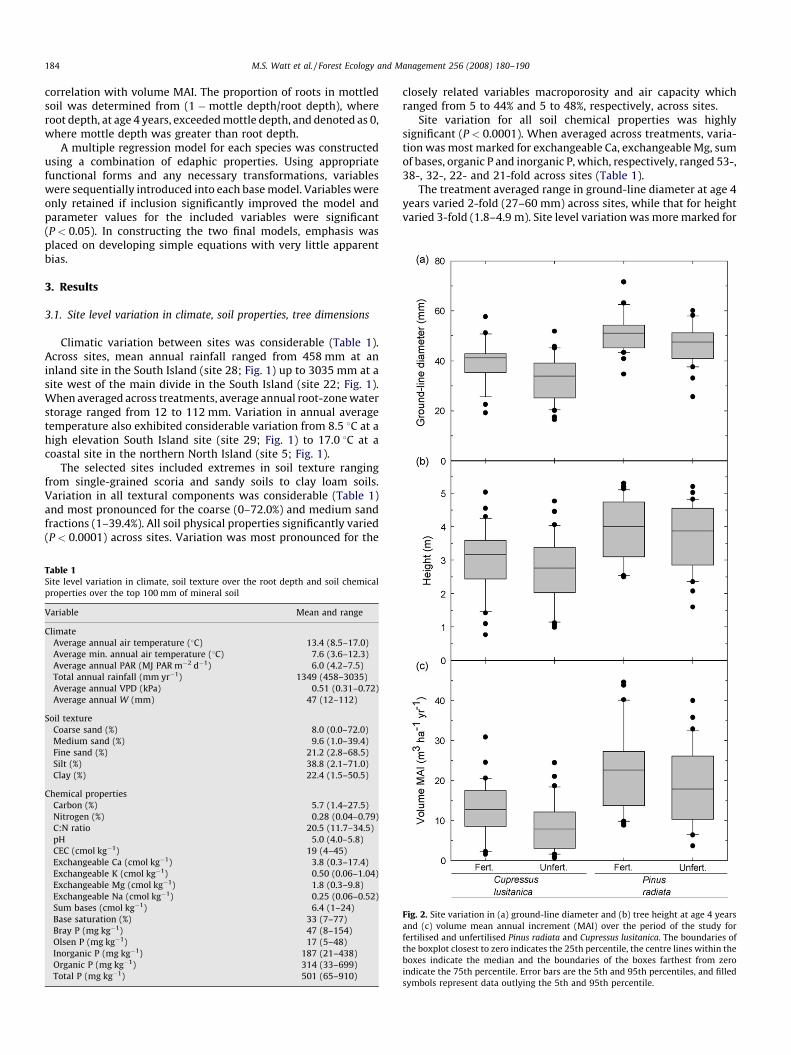
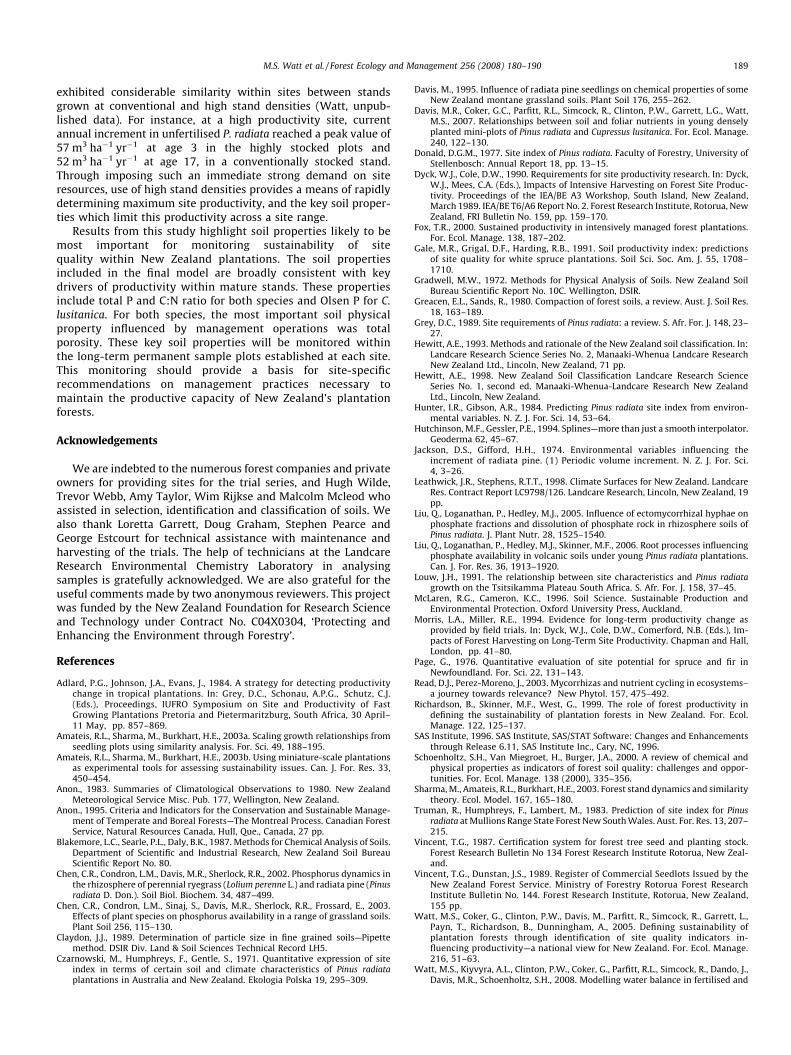
The treatment averaged range in ground-line diameter at age 4years varied 2-fold (27–60 mm) across sites, while that for heightvaried 3-fold (1.8–4.9 m). Site level variation was more marked for
Fig. 2. Site variation in (a) ground-line diameter and (b) tree height at age 4 years
and (c) volume mean annual increment (MAI) over the period of the study for
fertilised and unfertilised Pinus radiata and Cupressus lusitanica. The boundaries of
the boxplot closest to zero indicates the 25th percentile, the centre lines within the
boxes indicate the median and the boundaries of the boxes farthest from zero
indicate the 75th percentile. Error bars are the 5th and 95th percentiles, and filled
symbols represent data outlying the 5th and 95th percentile.
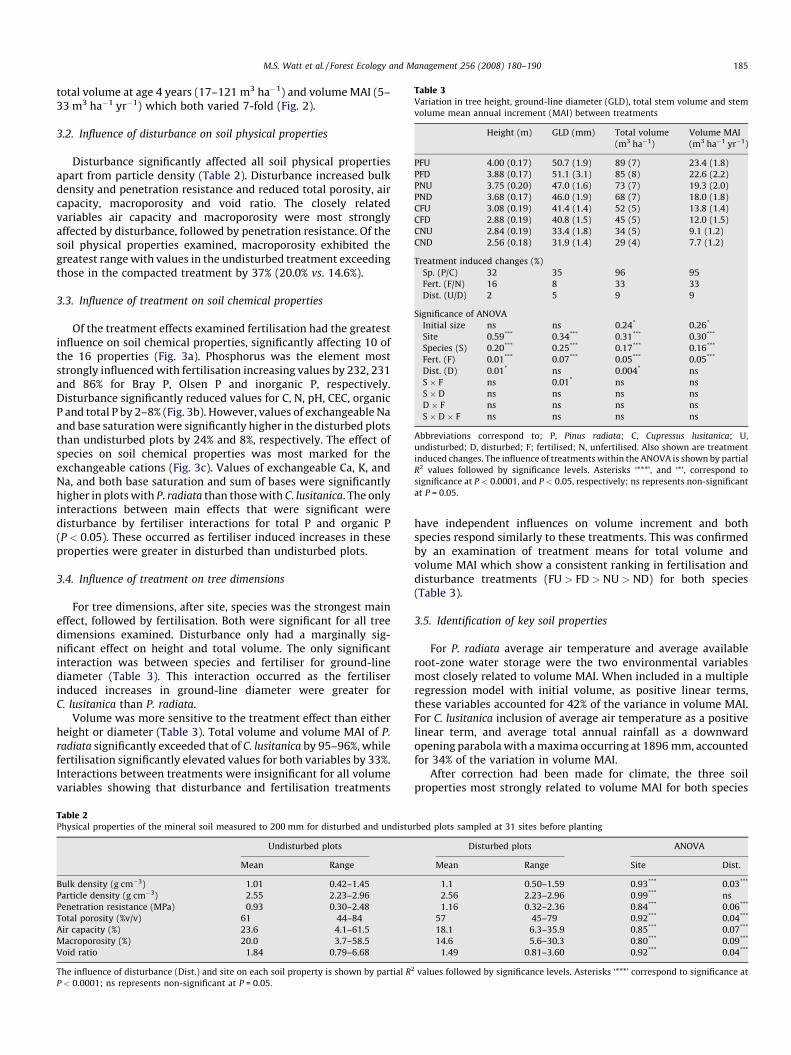
Table 3Variation in tree height, ground-line diameter (GLD), total stem volume and stem
volume mean annual increment (MAI) between treatments
Height (m) GLD (mm) Total volume
(m3 ha�1)
Volume MAI
(m3 ha�1 yr�1)
PFU 4.00 (0.17) 50.7 (1.9) 89 (7) 23.4 (1.8)
PFD 3.88 (0.17) 51.1 (3.1) 85 (8) 22.6 (2.2)
PNU 3.75 (0.20) 47.0 (1.6) 73 (7) 19.3 (2.0)
PND 3.68 (0.17) 46.0 (1.9) 68 (7) 18.0 (1.8)
CFU 3.08 (0.19) 41.4 (1.4) 52 (5) 13.8 (1.4)
CFD 2.88 (0.19) 40.8 (1.5) 45 (5) 12.0 (1.5)
CNU 2.84 (0.19) 33.4 (1.8) 34 (5) 9.1 (1.2)
CND 2.56 (0.18) 31.9 (1.4) 29 (4) 7.7 (1.2)
Treatment induced changes (%)
Sp. (P/C) 32 35 96 95
Fert. (F/N) 16 8 33 33
Dist. (U/D) 2 5 9 9
Significance of ANOVA
Initial size ns ns 0.24* 0.26*
Site 0.59*** 0.34*** 0.31*** 0.30***
Species (S) 0.20*** 0.25*** 0.17*** 0.16***
Fert. (F) 0.01*** 0.07*** 0.05*** 0.05***
Dist. (D) 0.01* ns 0.004* ns
S � F ns 0.01* ns ns
S � D ns ns ns ns
D � F ns ns ns ns
S � D � F ns ns ns ns
Abbreviations correspond to; P, Pinus radiata; C, Cupressus lusitanica; U,
undisturbed; D, disturbed; F; fertilised; N, unfertilised. Also shown are treatment
induced changes. The influence of treatments within the ANOVA is shown by partial
R2 values followed by significance levels. Asterisks ‘***’, and ‘*’, correspond to
significance at P < 0.0001, and P < 0.05, respectively; ns represents non-significant
at P = 0.05.
M.S. Watt et al. / Forest Ecology and Management 256 (2008) 180–190 185
total volume at age 4 years (17–121 m3 ha�1) and volume MAI (5–33 m3 ha�1 yr�1) which both varied 7-fold (Fig. 2).
3.2. Influence of disturbance on soil physical properties
Disturbance significantly affected all soil physical propertiesapart from particle density (Table 2). Disturbance increased bulkdensity and penetration resistance and reduced total porosity, aircapacity, macroporosity and void ratio. The closely relatedvariables air capacity and macroporosity were most stronglyaffected by disturbance, followed by penetration resistance. Of thesoil physical properties examined, macroporosity exhibited thegreatest range with values in the undisturbed treatment exceedingthose in the compacted treatment by 37% (20.0% vs. 14.6%).
3.3. Influence of treatment on soil chemical properties
Of the treatment effects examined fertilisation had the greatestinfluence on soil chemical properties, significantly affecting 10 ofthe 16 properties (Fig. 3a). Phosphorus was the element moststrongly influenced with fertilisation increasing values by 232, 231and 86% for Bray P, Olsen P and inorganic P, respectively.Disturbance significantly reduced values for C, N, pH, CEC, organicP and total P by 2–8% (Fig. 3b). However, values of exchangeable Naand base saturation were significantly higher in the disturbed plotsthan undisturbed plots by 24% and 8%, respectively. The effect ofspecies on soil chemical properties was most marked for theexchangeable cations (Fig. 3c). Values of exchangeable Ca, K, andNa, and both base saturation and sum of bases were significantlyhigher in plots with P. radiata than those with C. lusitanica. The onlyinteractions between main effects that were significant weredisturbance by fertiliser interactions for total P and organic P(P < 0.05). These occurred as fertiliser induced increases in theseproperties were greater in disturbed than undisturbed plots.
3.4. Influence of treatment on tree dimensions
For tree dimensions, after site, species was the strongest maineffect, followed by fertilisation. Both were significant for all treedimensions examined. Disturbance only had a marginally sig-nificant effect on height and total volume. The only significantinteraction was between species and fertiliser for ground-linediameter (Table 3). This interaction occurred as the fertiliserinduced increases in ground-line diameter were greater forC. lusitanica than P. radiata.
Volume was more sensitive to the treatment effect than eitherheight or diameter (Table 3). Total volume and volume MAI of P.
radiata significantly exceeded that of C. lusitanica by 95–96%, whilefertilisation significantly elevated values for both variables by 33%.Interactions between treatments were insignificant for all volumevariables showing that disturbance and fertilisation treatments
Table 2Physical properties of the mineral soil measured to 200 mm for disturbed and undistu
Undisturbed plots
Mean Range
Bulk density (g cm�3) 1.01 0.42–1.45
Particle density (g cm�3) 2.55 2.23–2.96
Penetration resistance (MPa) 0.93 0.30–2.48
Total porosity (%v/v) 61 44–84
Air capacity (%) 23.6 4.1–61.5
Macroporosity (%) 20.0 3.7–58.5
Void ratio 1.84 0.79–6.68
The influence of disturbance (Dist.) and site on each soil property is shown by partial R2
P < 0.0001; ns represents non-significant at P = 0.05.
have independent influences on volume increment and bothspecies respond similarly to these treatments. This was confirmedby an examination of treatment means for total volume andvolume MAI which show a consistent ranking in fertilisation anddisturbance treatments (FU > FD > NU > ND) for both species(Table 3).
3.5. Identification of key soil properties
For P. radiata average air temperature and average availableroot-zone water storage were the two environmental variablesmost closely related to volume MAI. When included in a multipleregression model with initial volume, as positive linear terms,these variables accounted for 42% of the variance in volume MAI.For C. lusitanica inclusion of average air temperature as a positivelinear term, and average total annual rainfall as a downwardopening parabola with a maxima occurring at 1896 mm, accountedfor 34% of the variation in volume MAI.
After correction had been made for climate, the three soilproperties most strongly related to volume MAI for both species
rbed plots sampled at 31 sites before planting
Disturbed plots ANOVA
Mean Range Site Dist.
1.1 0.50–1.59 0.93*** 0.03***
2.56 2.23–2.96 0.99*** ns
1.16 0.32–2.36 0.84*** 0.06***
57 45–79 0.92*** 0.04***
18.1 6.3–35.9 0.85*** 0.07***
14.6 5.6–30.3 0.80*** 0.09***
1.49 0.81–3.60 0.92*** 0.04***
values followed by significance levels. Asterisks ‘***’ correspond to significance at
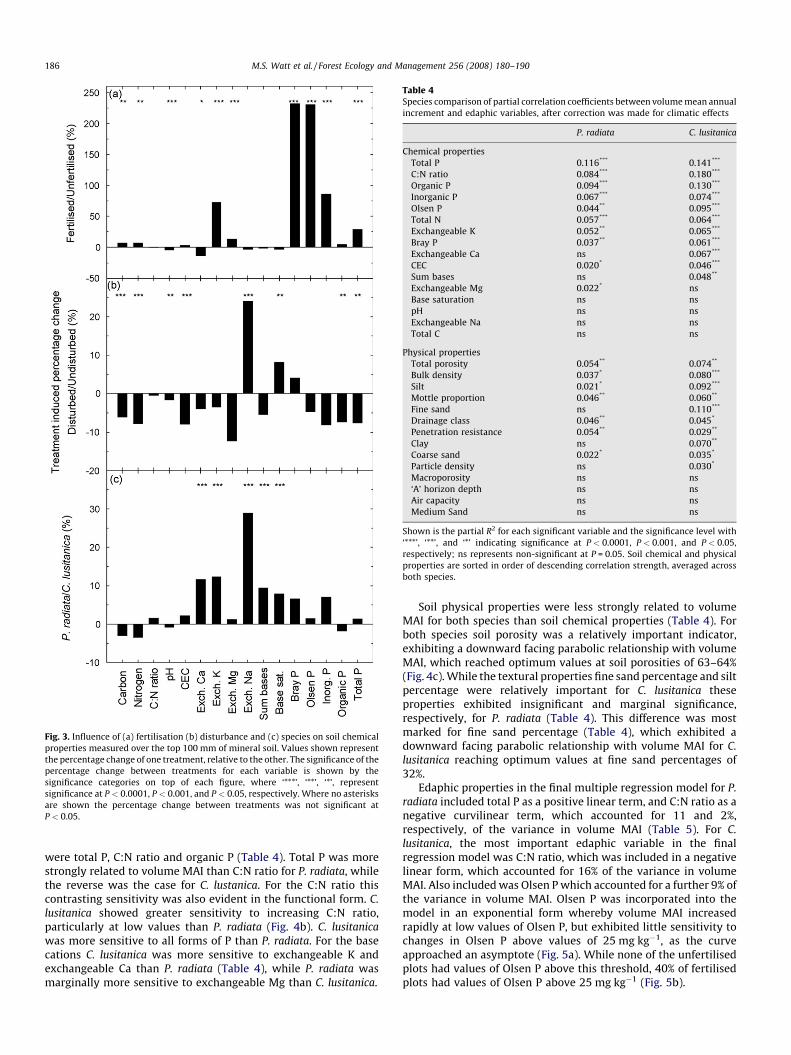
Fig. 3. Influence of (a) fertilisation (b) disturbance and (c) species on soil chemical
properties measured over the top 100 mm of mineral soil. Values shown represent
the percentage change of one treatment, relative to the other. The significance of the
percentage change between treatments for each variable is shown by the
significance categories on top of each figure, where ‘***’, ‘**’, ‘*’, represent
significance at P < 0.0001, P < 0.001, and P < 0.05, respectively. Where no asterisks
are shown the percentage change between treatments was not significant at
P < 0.05.
Table 4Species comparison of partial correlation coefficients between volume mean annual
increment and edaphic variables, after correction was made for climatic effects
P. radiata C. lusitanica
Chemical properties
Total P 0.116*** 0.141***
C:N ratio 0.084*** 0.180***
Organic P 0.094*** 0.130***
Inorganic P 0.067*** 0.074***
Olsen P 0.044** 0.095***
Total N 0.057*** 0.064***
Exchangeable K 0.052** 0.065***
Bray P 0.037** 0.061***
Exchangeable Ca ns 0.067***
CEC 0.020* 0.046***
Sum bases ns 0.048**
Exchangeable Mg 0.022* ns
Base saturation ns ns
pH ns ns
Exchangeable Na ns ns
Total C ns ns
Physical properties
Total porosity 0.054** 0.074**
Bulk density 0.037* 0.080***
Silt 0.021* 0.092***
Mottle proportion 0.046** 0.060**
Fine sand ns 0.110***
Drainage class 0.046** 0.045*
Penetration resistance 0.054** 0.029**
Clay ns 0.070**
Coarse sand 0.022* 0.035*
Particle density ns 0.030*
Macroporosity ns ns
‘A’ horizon depth ns ns
Air capacity ns ns
Medium Sand ns ns
Shown is the partial R2 for each significant variable and the significance level with
‘***’, ‘**’, and ‘*’ indicating significance at P < 0.0001, P < 0.001, and P < 0.05,
respectively; ns represents non-significant at P = 0.05. Soil chemical and physical
properties are sorted in order of descending correlation strength, averaged across
both species.
M.S. Watt et al. / Forest Ecology and Management 256 (2008) 180–190186
were total P, C:N ratio and organic P (Table 4). Total P was morestrongly related to volume MAI than C:N ratio for P. radiata, whilethe reverse was the case for C. lustanica. For the C:N ratio thiscontrasting sensitivity was also evident in the functional form. C.
lusitanica showed greater sensitivity to increasing C:N ratio,particularly at low values than P. radiata (Fig. 4b). C. lusitanica
was more sensitive to all forms of P than P. radiata. For the basecations C. lusitanica was more sensitive to exchangeable K andexchangeable Ca than P. radiata (Table 4), while P. radiata wasmarginally more sensitive to exchangeable Mg than C. lusitanica.
Soil physical properties were less strongly related to volumeMAI for both species than soil chemical properties (Table 4). Forboth species soil porosity was a relatively important indicator,exhibiting a downward facing parabolic relationship with volumeMAI, which reached optimum values at soil porosities of 63–64%(Fig. 4c). While the textural properties fine sand percentage and siltpercentage were relatively important for C. lusitanica theseproperties exhibited insignificant and marginal significance,respectively, for P. radiata (Table 4). This difference was mostmarked for fine sand percentage (Table 4), which exhibited adownward facing parabolic relationship with volume MAI for C.
lusitanica reaching optimum values at fine sand percentages of32%.
Edaphic properties in the final multiple regression model for P.
radiata included total P as a positive linear term, and C:N ratio as anegative curvilinear term, which accounted for 11 and 2%,respectively, of the variance in volume MAI (Table 5). For C.
lusitanica, the most important edaphic variable in the finalregression model was C:N ratio, which was included in a negativelinear form, which accounted for 16% of the variance in volumeMAI. Also included was Olsen P which accounted for a further 9% ofthe variance in volume MAI. Olsen P was incorporated into themodel in an exponential form whereby volume MAI increasedrapidly at low values of Olsen P, but exhibited little sensitivity tochanges in Olsen P above values of 25 mg kg�1, as the curveapproached an asymptote (Fig. 5a). While none of the unfertilisedplots had values of Olsen P above this threshold, 40% of fertilisedplots had values of Olsen P above 25 mg kg�1 (Fig. 5b).

Fig. 4. Response of volume mean annual increment to (a) total phosphorus (b) C:N
ratio and (c) total porosity for Pinus radiata (thick line) and Cupressus lusitanica (thin
line). All other variables in the model were held at mean values when each response
curve was generated.
Fig. 5. (a) Response of volume mean annual increment (MAI) to Olsen phosphorus
for Cupressus lusitanica and (b) frequency distribution of Olsen Phosphorus for
unfertilised plots (closed circles) and fertilised plots (open circles). The dotted line
drawn in (a) shows the value above which further increases in Olsen phosphorus
have little effect on volume MAI.
M.S. Watt et al. / Forest Ecology and Management 256 (2008) 180–190 187
4. Discussion
This study highlighted the importance of C:N ratio and totalphosphorus as key soil indicators for both species. These indicatorproperties exhibit considerable similarity to the indicators foundwithin the same trial series at age two (Watt et al., 2005). Theimportance of phosphorus as a determinant of growth in P. radiata
has been widely recognised (Grey, 1989), and soil phosphorus is
the most commonly used soil chemical property in local andregional models of productivity for this species (Czarnowski et al.,1971; Jackson and Gifford, 1974; Donald, 1977; Hunter and Gibson,1984; Truman et al., 1983; Grey, 1989; Louw, 1991). In nationalstudies within New Zealand, productivity of mature P. radiata hasbeen predicted previously using both Olsen P (Jackson and Gifford,1974) and Bray P (Hunter and Gibson, 1984), in combination withother environmental and edaphic properties. Although neither ofthese studies used total P in analyses, we found this variable to bemore strongly correlated to volume MAI than either Olsen P andBray P, for P. radiata. The superior predictive power of total P, overvariables representing only inorganic fractions of P, suggests that P.
radiata can access the large pool of soil organic P as observed byDavis (1995) and Chen et al. (2002, 2003) in pot experiments with arange of soils.
Although not as widely used as N (Jackson and Gifford, 1974;Hunter and Gibson, 1984), C:N ratio has been used to modelgrowth (Page, 1976), and provides an index of the rate of nitrogenmineralisation (Schoenholtz et al., 2000). Examination of the datashowed that the difference in predictive power between N and C:Nratio was mainly attributable to differential precision betweenthese variables at a site with an unusual combination of N and C:Nratio. This low productivity site (site 30; Fig. 1) had the highestoverall N (average of 0.79%), C (average of 27.5%) and C:N ratio(average of 34.5) of all sites. Soil N considerably overpredicted thelow volume MAI at this site, for both species. In contrast, volumeMAI was accurately predicted for both species, using C:N ratio,

Table 5Summary of statistics for the final predictive models of volume mean annual increment (MAI) for Pinus radiata and Cupressus lusitanica
Pinus radiata Cupressus lusitanica
MAI = a + bVi + cTa + dW + ePt � fC:N2 MAI = a + bTa + cR � dR2 � eC:N + f(1 � exp(�gPolsen))
Parameters Value Variable R2 Parameters Value Variable R2
a �23.5 a �13.4
b 348816 Initial volume (Vi) 0.22 (0.22) b 0.52 Average temperature (Ta) 0.19 (0.19)
c 2.20 Average temperature (Ta) 0.08 (0.30) c 0.029 Rainfall (R) 0.15 (0.34)
d 0.10 Average water storage (W) 0.12 (0.42) d 7.6 � 10�6
e 0.011 Total P (Pt) 0.11 (0.53) e 0.52 C:N ratio (C:N) 0.16 (0.50)
f 0.0057 C:N ratio (C:N) 0.02 (0.55) f 8.41 Olsen P (Polsen) 0.09 (0.59)
g 0.11
Parameter values and variable partial R2 and cumulative R2 values (in brackets) are shown. All parameters are significant at P < 0.05.
M.S. Watt et al. / Forest Ecology and Management 256 (2008) 180–190188
possibly as this variable accounted for the low availability ofmineral N. This highlights the greater general applicability of C:Nratio over N as a predictor of productivity.
The relative importance of the two strongest indicators, C:Nratio and total P, differed between species. In the bivariaterelationships for P. radiata total P was more strongly correlated tovolume MAI than C:N ratio while the reverse was the case for C.
lusitanica. A similar pattern was also evident in the multipleregression results, which also indicated that C. lusitanica was moresensitive to inorganic P, in the form of Olsen P, than P. radiata.These differences may reflect the contrasting mycorrhizal status ofthe two species. P. radiata associates with ectomycorrhizal species,whereas C. lusitanica associates with endomycorrhizal species. Aswell as facilitating the acquisition of nutrient ions, especially of N,recent studies have shown that ectomycorrhizae may mobilise Nand P from organic polymers as well, enabling the host species toobtain these elements directly from plant and microbial detritussources (Read and Perez-Moreno, 2003; Liu et al., 2005, 2006). As aresult of this association with ectomycorrhizal species, P. radiata
should be less limited by N, and less reliant on inorganic P, thanC. lusitanica.
Indicator properties differed markedly between species for theexchangeable cations. Volume MAI of C. lusitanica exhibitedgreater sensitivity to soil concentrations of exchangeable K,exchangeable Ca, and the overall base sum than P. radiata.Examination of soil concentrations indicated that exchangeable Kand exchangeable Ca were significantly lower under C. lusitanica
than P. radiata, indicating greater uptake by C. lusitanica. Theseresults are consistent with the substantially greater foliar cationconcentrations found in C. lusitanica than in P. radiata in this study(Davis et al., 2007).
Of the soil physical properties examined, total porosity, bulkdensity and the proportion of roots in mottled soil were on averagethe three most important indicators for both species. Depth tomottling has been previously used as a sufficiency curve within asite quality model to describe the adequacy of soil aeration (Galeet al., 1991). The relationship between bulk density and volumeMAI was predominantly due to a decline in volume MAI above bulkdensities of 1.25 g cm�3, which is consistent with the sufficiencycurve for bulk density described by Gale et al. (1991). Growthreductions at high bulk densities are likely to be attributable to areduction in water and oxygen supply (Schoenholtz et al., 2000).High bulk densities are unlikely to have limited root extension aspenetration resistance was not significantly related to volume MAI,and values for penetration resistance did not exceed 2.5 MPa,which is the threshold thought to limit root growth (Greacen andSands, 1980). Given the strong linear correlation between bulkdensity and total porosity (R2 = 0.96; P < 0.0001), the reductions ingrowth at low porosities mirror the effects of high bulk density on
growth. Reductions in growth above the optimum porosity of 64%,and below the optimum bulk density of 0.92 g cm�3, are largelyattributable to the concurrent increase in Phosphorus retention(Hewitt, 1998), within these sites, which binds P to the soil (datanot shown).
The strong and significant influence of fertilisation on volumeMAI found in this study is consistent with previous research acrossa broad range of species (see Fox, 2000 for review). Gains in volumeMAI obtained through fertilisation were 4-fold higher than theinsignificant reductions in volume MAI induced through soildisturbance. This disparity in treatment response was also evidentin the modelling which showed that volume MAI was generallymore strongly related to soil chemical properties than soil physicalproperties. These results highlight the importance of fertiliser as asilvicultural treatment that can be used to improve site quality. Thesignificant effect of disturbance on key soil chemical indicatorproperties (N, total P) also suggests that addition of fertiliser can beused to at least partially compensate for the negative impacts ofdisturbance on soil concentrations of these elements and volumeproductivity.
The results suggest that for both species fertiliser induced gainsin volume MAI were due to significant increases in total P and N.Increases in volume MAI for C. lusitanica are also likely to be due toincreases in Olsen P. Olsen P was very strongly influenced byfertilisation, which elevated values beyond the growth limitingthreshold for C. lusitanica for this variable in 40% of plots. It isnotable the threshold value (25 mg g�1, Fig. 5a) is similar to that forpasture production for a range of New Zealand soils (McLaren andCameron, 1996).
Research strongly suggests that trees grown at very highstand densities follow a similar developmental pattern asoperational stands. Studies using Pinus taeda L. show that thepattern of diameter and height growth for trees grown atoperational stand densities over 16 years closely corresponds tothe pattern of development over 4 years when the distancebetween trees is reduced to 1/16th of the operational standdistance (Amateis et al., 2003a,b; Sharma et al., 2003). Thissimilarity was confirmed by a comparison of volume growth forunfertilised P. radiata from our plots with stands grown atoperational stockings of 300 stems ha�1 over a 30-year period(Watt, unpublished data). The pattern was sigmoidal for bothstand densities, reaching a maximum current annual incrementat an average of 3.5 years at high stand density and 20 years atconventional stand densities.
As the experimentation in miniature approach also replicatesthe maximum rate of volume increment obtained in convention-ally grown stands this approach should provide a good method foridentifying key soil indicator properties. Although maximumvalues of current annual increment varied widely by site, they
M.S. Watt et al. / Forest Ecology and Management 256 (2008) 180–190 189
exhibited considerable similarity within sites between standsgrown at conventional and high stand densities (Watt, unpub-lished data). For instance, at a high productivity site, currentannual increment in unfertilised P. radiata reached a peak value of57 m3 ha�1 yr�1 at age 3 in the highly stocked plots and52 m3 ha�1 yr�1 at age 17, in a conventionally stocked stand.Through imposing such an immediate strong demand on siteresources, use of high stand densities provides a means of rapidlydetermining maximum site productivity, and the key soil proper-ties which limit this productivity across a site range.
Results from this study highlight soil properties likely to bemost important for monitoring sustainability of sitequality within New Zealand plantations. The soil propertiesincluded in the final model are broadly consistent with keydrivers of productivity within mature stands. These propertiesinclude total P and C:N ratio for both species and Olsen P for C.
lusitanica. For both species, the most important soil physicalproperty influenced by management operations was totalporosity. These key soil properties will be monitored withinthe long-term permanent sample plots established at each site.This monitoring should provide a basis for site-specificrecommendations on management practices necessary tomaintain the productive capacity of New Zealand’s plantationforests.
Acknowledgements
We are indebted to the numerous forest companies and privateowners for providing sites for the trial series, and Hugh Wilde,Trevor Webb, Amy Taylor, Wim Rijkse and Malcolm Mcleod whoassisted in selection, identification and classification of soils. Wealso thank Loretta Garrett, Doug Graham, Stephen Pearce andGeorge Estcourt for technical assistance with maintenance andharvesting of the trials. The help of technicians at the LandcareResearch Environmental Chemistry Laboratory in analysingsamples is gratefully acknowledged. We are also grateful for theuseful comments made by two anonymous reviewers. This projectwas funded by the New Zealand Foundation for Research Scienceand Technology under Contract No. C04X0304, ‘Protecting andEnhancing the Environment through Forestry’.
References
Adlard, P.G., Johnson, J.A., Evans, J., 1984. A strategy for detecting productivitychange in tropical plantations. In: Grey, D.C., Schonau, A.P.G., Schutz, C.J.(Eds.), Proceedings, IUFRO Symposium on Site and Productivity of FastGrowing Plantations Pretoria and Pietermaritzburg, South Africa, 30 April–11 May, pp. 857–869.
Amateis, R.L., Sharma, M., Burkhart, H.E., 2003a. Scaling growth relationships fromseedling plots using similarity analysis. For. Sci. 49, 188–195.
Amateis, R.L., Sharma, M., Burkhart, H.E., 2003b. Using miniature-scale plantationsas experimental tools for assessing sustainability issues. Can. J. For. Res. 33,450–454.
Anon., 1983. Summaries of Climatological Observations to 1980. New ZealandMeteorological Service Misc. Pub. 177, Wellington, New Zealand.
Anon., 1995. Criteria and Indicators for the Conservation and Sustainable Manage-ment of Temperate and Boreal Forests—The Montreal Process. Canadian ForestService, Natural Resources Canada, Hull, Que., Canada, 27 pp.
Blakemore, L.C., Searle, P.L., Daly, B.K., 1987. Methods for Chemical Analysis of Soils.Department of Scientific and Industrial Research, New Zealand Soil BureauScientific Report No. 80.
Chen, C.R., Condron, L.M., Davis, M.R., Sherlock, R.R., 2002. Phosphorus dynamics inthe rhizosphere of perennial ryegrass (Lolium perenne L.) and radiata pine (Pinusradiata D. Don.). Soil Biol. Biochem. 34, 487–499.
Chen, C.R., Condron, L.M., Sinaj, S., Davis, M.R., Sherlock, R.R., Frossard, E., 2003.Effects of plant species on phosphorus availability in a range of grassland soils.Plant Soil 256, 115–130.
Claydon, J.J., 1989. Determination of particle size in fine grained soils—Pipettemethod. DSIR Div. Land & Soil Sciences Technical Record LH5.
Czarnowski, M., Humphreys, F., Gentle, S., 1971. Quantitative expression of siteindex in terms of certain soil and climate characteristics of Pinus radiataplantations in Australia and New Zealand. Ekologia Polska 19, 295–309.
Davis, M., 1995. Influence of radiata pine seedlings on chemical properties of someNew Zealand montane grassland soils. Plant Soil 176, 255–262.
Davis, M.R., Coker, G.C., Parfitt, R.L., Simcock, R., Clinton, P.W., Garrett, L.G., Watt,M.S., 2007. Relationships between soil and foliar nutrients in young denselyplanted mini-plots of Pinus radiata and Cupressus lusitanica. For. Ecol. Manage.240, 122–130.
Donald, D.G.M., 1977. Site index of Pinus radiata. Faculty of Forestry, University ofStellenbosch: Annual Report 18, pp. 13–15.
Dyck, W.J., Cole, D.W., 1990. Requirements for site productivity research. In: Dyck,W.J., Mees, C.A. (Eds.), Impacts of Intensive Harvesting on Forest Site Produc-tivity. Proceedings of the IEA/BE A3 Workshop, South Island, New Zealand,March 1989. IEA/BE T6/A6 Report No. 2. Forest Research Institute, Rotorua, NewZealand, FRI Bulletin No. 159, pp. 159–170.
Fox, T.R., 2000. Sustained productivity in intensively managed forest plantations.For. Ecol. Manage. 138, 187–202.
Gale, M.R., Grigal, D.F., Harding, R.B., 1991. Soil productivity index: predictionsof site quality for white spruce plantations. Soil Sci. Soc. Am. J. 55, 1708–1710.
Gradwell, M.W., 1972. Methods for Physical Analysis of Soils. New Zealand SoilBureau Scientific Report No. 10C. Wellington, DSIR.
Greacen, E.L., Sands, R., 1980. Compaction of forest soils, a review. Aust. J. Soil Res.18, 163–189.
Grey, D.C., 1989. Site requirements of Pinus radiata: a review. S. Afr. For. J. 148, 23–27.
Hewitt, A.E., 1993. Methods and rationale of the New Zealand soil classification. In:Landcare Research Science Series No. 2, Manaaki-Whenua Landcare ResearchNew Zealand Ltd., Lincoln, New Zealand, 71 pp.
Hewitt, A.E., 1998. New Zealand Soil Classification Landcare Research ScienceSeries No. 1, second ed. Manaaki-Whenua-Landcare Research New ZealandLtd., Lincoln, New Zealand.
Hunter, I.R., Gibson, A.R., 1984. Predicting Pinus radiata site index from environ-mental variables. N. Z. J. For. Sci. 14, 53–64.
Hutchinson, M.F., Gessler, P.E., 1994. Splines—more than just a smooth interpolator.Geoderma 62, 45–67.
Jackson, D.S., Gifford, H.H., 1974. Environmental variables influencing theincrement of radiata pine. (1) Periodic volume increment. N. Z. J. For. Sci.4, 3–26.
Leathwick, J.R., Stephens, R.T.T., 1998. Climate Surfaces for New Zealand. LandcareRes. Contract Report LC9798/126. Landcare Research, Lincoln, New Zealand, 19pp.
Liu, Q., Loganathan, P., Hedley, M.J., 2005. Influence of ectomycorrhizal hyphae onphosphate fractions and dissolution of phosphate rock in rhizosphere soils ofPinus radiata. J. Plant Nutr. 28, 1525–1540.
Liu, Q., Loganathan, P., Hedley, M.J., Skinner, M.F., 2006. Root processes influencingphosphate availability in volcanic soils under young Pinus radiata plantations.Can. J. For. Res. 36, 1913–1920.
Louw, J.H., 1991. The relationship between site characteristics and Pinus radiatagrowth on the Tsitsikamma Plateau South Africa. S. Afr. For. J. 158, 37–45.
McLaren, R.G., Cameron, K.C., 1996. Soil Science. Sustainable Production andEnvironmental Protection. Oxford University Press, Auckland.
Morris, L.A., Miller, R.E., 1994. Evidence for long-term productivity change asprovided by field trials. In: Dyck, W.J., Cole, D.W., Comerford, N.B. (Eds.), Im-pacts of Forest Harvesting on Long-Term Site Productivity. Chapman and Hall,London, pp. 41–80.
Page, G., 1976. Quantitative evaluation of site potential for spruce and fir inNewfoundland. For. Sci. 22, 131–143.
Read, D.J., Perez-Moreno, J., 2003. Mycorrhizas and nutrient cycling in ecosystems–a journey towards relevance? New Phytol. 157, 475–492.
Richardson, B., Skinner, M.F., West, G., 1999. The role of forest productivity indefining the sustainability of plantation forests in New Zealand. For. Ecol.Manage. 122, 125–137.
SAS Institute, 1996. SAS Institute, SAS/STAT Software: Changes and Enhancementsthrough Release 6.11, SAS Institute Inc., Cary, NC, 1996.
Schoenholtz, S.H., Van Miegroet, H., Burger, J.A., 2000. A review of chemical andphysical properties as indicators of forest soil quality: challenges and oppor-tunities. For. Ecol. Manage. 138 (2000), 335–356.
Sharma, M., Amateis, R.L., Burkhart, H.E., 2003. Forest stand dynamics and similaritytheory. Ecol. Model. 167, 165–180.
Truman, R., Humphreys, F., Lambert, M., 1983. Prediction of site index for Pinusradiata at Mullions Range State Forest New South Wales. Aust. For. Res. 13, 207–215.
Vincent, T.G., 1987. Certification system for forest tree seed and planting stock.Forest Research Bulletin No 134 Forest Research Institute Rotorua, New Zeal-and.
Vincent, T.G., Dunstan, J.S., 1989. Register of Commercial Seedlots Issued by theNew Zealand Forest Service. Ministry of Forestry Rotorua Forest ResearchInstitute Bulletin No. 144. Forest Research Institute, Rotorua, New Zealand,155 pp.
Watt, M.S., Coker, G., Clinton, P.W., Davis, M., Parfitt, R., Simcock, R., Garrett, L.,Payn, T., Richardson, B., Dunningham, A., 2005. Defining sustainability ofplantation forests through identification of site quality indicators in-fluencing productivity—a national view for New Zealand. For. Ecol. Manage.216, 51–63.
Watt, M.S., Kiyvyra, A.L., Clinton, P.W., Coker, G., Parfitt, R.L., Simcock, R., Dando, J.,Davis, M.R., Schoenholtz, S.H., 2008. Modelling water balance in fertilised and

M.S. Watt et al. / Forest Ecology and Management 256 (2008) 180–190190
unfertilised Cupressus lusitanica and Pinus radiata grown across an environ-mental gradient. For. Ecol. Manage. 255, 1104–1112.
Whitehead, D., Leathwick, J.R., Walcroft, A.S., 2001. Modeling annual carbon uptakefor the indigenous forests of New Zealand. For. Sci. 47 (1), 9–19.
Woollons, R.C., 2000. Comparison of growth of Pinus radiata over two rotations inthe central North Island of New Zealand. Int. For. Rev. 2 (2), 84–89.
Yarie, J., 1990. Role of computer models in predicting the consequences of manage-ment on forest productivity. In: Dyck, W.J., Mees, C.A. (Eds.), Impacts ofIntensive Harvesting on Forest Site Productivity. Proceedings of the IEA/BEA3 Workshop, South Island, New Zealand, March 1989. IEA/BE T6/A6 Report No.2. Forest Research Institute, Rotorua, New Zealand, FRI Bulletin No. 159, pp. 3–18.
Related Documents