Research article Identification of conserved regulatory elements by comparative genome analysis Boris Lenhard* † , Albin Sandelin* † , Luis Mendoza* ‡ , Pär Engström*, Niclas Jareborg* § and Wyeth W Wasserman* ¶ Addresses: *Center for Genomics and Bioinformatics, Karolinska Institutet, 171 77 Stockholm, Sweden. ‡ Current address: Serono Research and Development, CH-1121 Geneva 20, Switzerland. § Current address: AstraZeneca Research and Development, S-151 85 Södertälje, Sweden. ¶ Current address: Centre for Molecular Medicine and Therapeutics, University of British Columbia, Vancouver, BC V5Z 4H4, Canada. † These authors contributed equally to this work. Correspondence: Wyeth W Wasserman. E-mail: [email protected] Abstract Background: For genes that have been successfully delineated within the human genome sequence, most regulatory sequences remain to be elucidated. The annotation and interpretation process requires additional data resources and significant improvements in computational methods for the detection of regulatory regions. One approach of growing popularity is based on the preferential conservation of functional sequences over the course of evolution by selective pressure, termed ‘phylogenetic footprinting’. Mutations are more likely to be disruptive if they appear in functional sites, resulting in a measurable difference in evolution rates between functional and non-functional genomic segments. Results: We have devised a flexible suite of methods for the identification and visualization of conserved transcription-factor-binding sites. The system reports those putative transcription- factor-binding sites that are both situated in conserved regions and located as pairs of sites in equivalent positions in alignments between two orthologous sequences. An underlying collection of metazoan transcription-factor-binding profiles was assembled to facilitate the study. This approach results in a significant improvement in the detection of transcription- factor-binding sites because of an increased signal-to-noise ratio, as demonstrated with two sets of promoter sequences. The method is implemented as a graphical web application, ConSite, which is at the disposal of the scientific community at http://www.phylofoot.org/. Conclusions: Phylogenetic footprinting dramatically improves the predictive selectivity of bioinformatic approaches to the analysis of promoter sequences. ConSite delivers unparalleled performance using a novel database of high-quality binding models for metazoan transcription factors. With a dynamic interface, this bioinformatics tool provides broad access to promoter analysis with phylogenetic footprinting. Published: 22 May 2003 Journal of Biology 2003, 2:13 The electronic version of this article is the complete one and can be found online at http://jbiol.com/content/2/2/13 Received: 12 December 2002 Revised: 21 March 2003 Accepted: 8 April 2003 BioMed Central Journal of Biology Journal of Biology 2003, 2:13 Open Access © 2003 Lenhard et al., licensee BioMed Central Ltd. This is an Open Access article: verbatim copying and redistribution of this article are permitted in all media for any purpose, provided this notice is preserved along with the article's original URL.

Welcome message from author
This document is posted to help you gain knowledge. Please leave a comment to let me know what you think about it! Share it to your friends and learn new things together.
Transcript
Research articleIdentification of conserved regulatory elements by comparativegenome analysisBoris Lenhard*†, Albin Sandelin*†, Luis Mendoza*‡, Pär Engström*,Niclas Jareborg*§ and Wyeth W Wasserman*¶
Addresses: *Center for Genomics and Bioinformatics, Karolinska Institutet, 171 77 Stockholm, Sweden. ‡Current address: Serono Researchand Development, CH-1121 Geneva 20, Switzerland. §Current address: AstraZeneca Research and Development, S-151 85 Södertälje, Sweden.¶Current address: Centre for Molecular Medicine and Therapeutics, University of British Columbia, Vancouver, BC V5Z 4H4, Canada.
†These authors contributed equally to this work.
Correspondence: Wyeth W Wasserman. E-mail: [email protected]
Abstract
Background: For genes that have been successfully delineated within the human genomesequence, most regulatory sequences remain to be elucidated. The annotation andinterpretation process requires additional data resources and significant improvements incomputational methods for the detection of regulatory regions. One approach of growingpopularity is based on the preferential conservation of functional sequences over the courseof evolution by selective pressure, termed ‘phylogenetic footprinting’. Mutations are morelikely to be disruptive if they appear in functional sites, resulting in a measurable difference inevolution rates between functional and non-functional genomic segments.
Results: We have devised a flexible suite of methods for the identification and visualization ofconserved transcription-factor-binding sites. The system reports those putative transcription-factor-binding sites that are both situated in conserved regions and located as pairs of sites inequivalent positions in alignments between two orthologous sequences. An underlyingcollection of metazoan transcription-factor-binding profiles was assembled to facilitate thestudy. This approach results in a significant improvement in the detection of transcription-factor-binding sites because of an increased signal-to-noise ratio, as demonstrated with twosets of promoter sequences. The method is implemented as a graphical web application,ConSite, which is at the disposal of the scientific community at http://www.phylofoot.org/.
Conclusions: Phylogenetic footprinting dramatically improves the predictive selectivity ofbioinformatic approaches to the analysis of promoter sequences. ConSite deliversunparalleled performance using a novel database of high-quality binding models for metazoantranscription factors. With a dynamic interface, this bioinformatics tool provides broad accessto promoter analysis with phylogenetic footprinting.
Published: 22 May 2003
Journal of Biology 2003, 2:13
The electronic version of this article is the complete one and can befound online at http://jbiol.com/content/2/2/13
Received: 12 December 2002Revised: 21 March 2003Accepted: 8 April 2003
BioMed CentralJournalof Biology
Journal of Biology 2003, 2:13
Open Access
© 2003 Lenhard et al., licensee BioMed Central Ltd. This is an Open Access article: verbatim copying and redistribution of this article are permittedin all media for any purpose, provided this notice is preserved along with the article's original URL.
IntroductionThe information in genes generally flows from static DNAsequences to active proteins via an RNA intermediary.Depending upon the cellular context of physiological, devel-opmental and environmental inputs, genes are selectivelyactivated via regulatory sequences in the DNA. At their foun-dation, transcriptional regulatory regions in the humangenome are characterized by the presence of target bindingsites for transcription factors (TFs). Knowledge of the identityof a mediating TF can give important insights into the func-tion of a gene via inference of the processes or conditions thatlead to expression. Research in bioinformatics has developedreliable methods to model the DNA binding specificity ofindividual TFs. As most eukaryotic TFs tolerate considerablesequence variation in their target sites, simple consensussequences fail to represent the specificity of binding factors.This realization led to the development of the quantitativerepresentation of binding specificity with position weightmatrices [1]. Such matrices can be highly accurate in identify-ing in vitro target sequences [2], but are insufficiently specificin the identification of sites with in vivo function to providemeaningful predictions [3]. The in vivo binding specificity of aTF depends upon additional properties not modeled by aweight matrix, such as protein-protein interactions, chro-matin superstructures and TF concentrations.
Comparison of orthologous gene sequences has emerged asa powerful tool in genome analysis. ‘Phylogenetic footprint-ing’ [4] provides complementary data to computational pre-dictions, as sequence conservation over evolution highlightssegments in genes likely to mediate biological function. Theutility of phylogenetic footprinting extends to a broad arrayof annotation challenges, but it is particularly suited to theidentification of sequences with a functional role in the regu-lation of gene transcription [5,6]. Despite specific successes[7] in studies of gene regulation, the central algorithms forphylogenetic footprinting remain to be optimized and arethus the focus of continuing research. In particular, newalgorithms based on phylogenetic footprinting have beenpresented for the alignment of genomic sequences, datavisualization and the identification of exons [8,9]. Algo-rithms for the analysis of regulatory sequences haveaddressed the detection of over-represented patterns in thepromoters of co-regulated genes [10], and the improved dis-crimination of regulatory modules [11], as well as compara-tive studies of orthologous promoters across collections ofmicrobial genomes [12,13].
Here, we introduce a highly specific algorithm, ConSite, forthe detection of transcription-factor-binding sites (TFBSs)that is based on phylogenetic footprinting. Three centralcomponents underlie the advance: first, a non-redundant setof transcription-factor binding models; second, a suitable
alignment algorithm for orthologous non-coding genomicsequences; and third, modular software for the integrationof binding-site predictions with analysis of sequence simi-larity. We show that our approach results in an increasedspecificity of predicted TFBSs as a result of a significantreduction of noise. The ConSite algorithm is thus particu-larly suited to the analysis of pairs of orthologous genomicsequences with limited or no experimental annotation ofregulatory elements.
ResultsA non-redundant set of high-quality transcription-factor binding modelsPotential TFBSs can be identified within a genomicsequence by well-studied computational approaches basedon quantitative profiles describing the binding site charac-teristics for TFs. The quality of matrix models is dependentupon the number of biochemically determined target sites.While the binding specificities of few eukaryotic TFs aredescribed richly in the literature by multiple in vivo func-tional sites, a significant number of TF binding profiles havebeen produced through the application of in vitro target-sitedetection assays [14]. We collected available data of bothtypes from the biological literature to construct 108 non-redundant high-quality profiles [15]. The profiles are derivedfrom the super-classes vertebrates, insects or plants, but themajority (65%) of matrices model the binding of human orrodent factors. As the majority of the profiles originate fromsite-selection assays, the average number of TFBSs contribut-ing to each profile is a robust 31.2 sites per model. Informa-tion content, in terms of bits of information, is commonlyused within bioinformatics to describe the overall specificityof a profile. The models in the collection range in informa-tion content from 5.6 to 26.2 bits, with an average of 12.1bits. All models are hyperlinked to corresponding sequenceaccession numbers and the PubMed abstract for the articledescribing the binding study.
Integrating binding-site prediction with analysis ofsequence conservation in orthologous genomicsequencesPhylogenetic footprinting provides data complementary tobinding-site predictions, for the analysis of gene regulation.The simple hypothesis that motivates phylogenetic foot-printing is that important functional sequences will be underselective pressure to be retained over moderate periods ofevolution. The classification of sequences as conserved orfreely evolving (as proposed by Kimura [16]) is not yet aquantitative process. It should be noted that evolutionaryrates vary dramatically between genes and the choice ofspecies is an important consideration in phylogenetic foot-printing studies. Too great an evolutionary distance can
13.2 Journal of Biology 2003, Volume 2, Issue 2, Article 13 Lenhard et al. http://jbiol.com/content/2/2/13
Journal of Biology 2003, 2:13
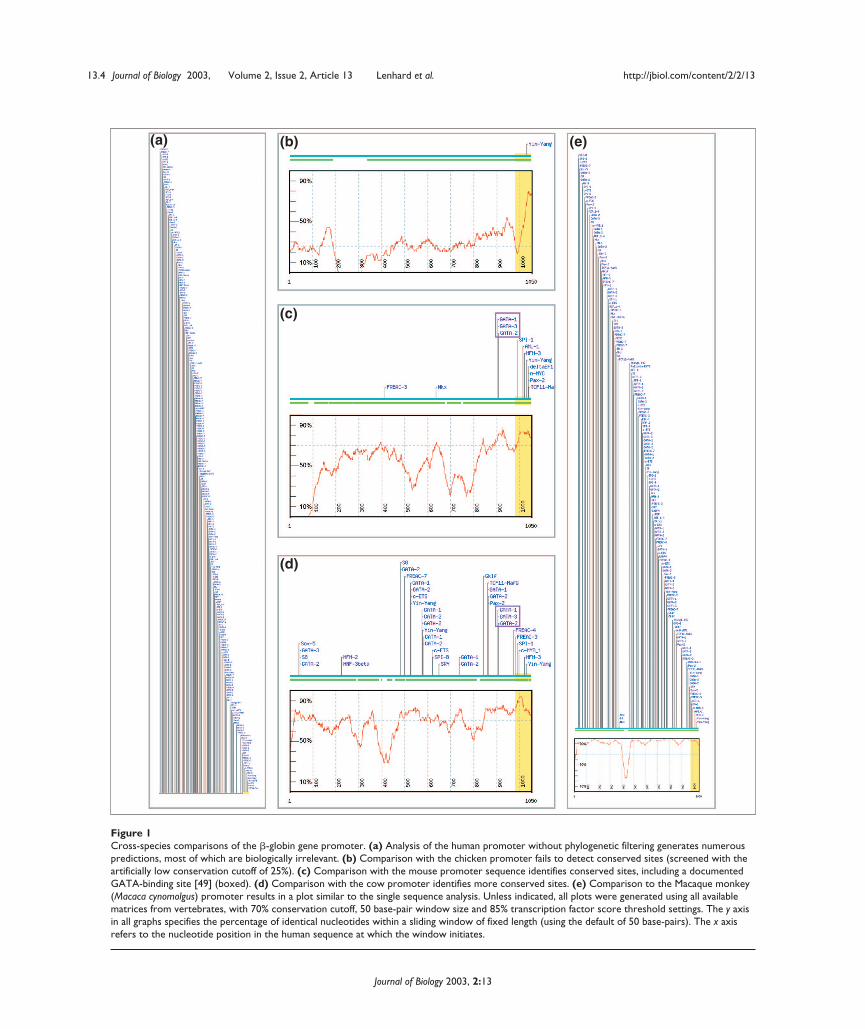
result in regulatory alterations or difficulty in aligning shortpatches of similarity between long sequences. Inadequateevolutionary distance does not significantly improve theoverall specificity of predictions. We have developed theConSite method to integrate phylogenetic footprinting withprofile-based predictions of TFBSs, in order to achieve spe-cific predictions of functional regulatory elements in genes.As an example of the influence of species selection on thequalitative performance of the system, the human � globinpromoter was compared to a diverse range of orthologs(Figure 1).
In this report, we focus on human-rodent comparisons, asseveral studies have suggested that only a small portion (17-20%) of non-coding regions are conserved (on average) atthis evolutionary distance [10,17]. Furthermore, similarityis punctuated, with distinguishable segments of high simi-larity flanked by regions of apparently random sequence(roughly 33% nucleotide identity is observed betweenrandom genomic sequences, with wide variations depen-dent upon the applied alignment algorithm, settings, andsequence characteristics [18]). This compartmentalizedpattern of similarity is consistent with the emerging empha-sis on multiple TFs binding to locally dense site clusterstermed regulatory modules [19], which suggests that dis-tinct blocks of sequence are required for transcriptional reg-ulation. In order to identify segments of preferentialconservation in orthologous genomic sequences, a suitableset of classification criteria must be defined. As similarity orrates of evolution vary widely across genomic sequences, nosingle threshold will be perfectly suited. We elected to focusthe algorithm on segments of high similarity. This refers tosliding windows of fixed size over the alignment, retainingonly those where the sequence identity exceeds a default oruser-specified threshold. If a cDNA sequence is available,the analysis program can exclude from considerationbinding-site predictions situated within exons present in analignment of genomic sequences.
Assessing the impact of phylogenetic footprinting onthe specificity of binding-site predictionsIn order to assess quantitatively the contribution of compar-ative sequence analysis to the specificity of TFBS predictions,a reference collection of 14 well-studied genes was assem-bled. We compared the selectivity and sensitivity of the TFBSpredictions between those generated with isolated humansequences and those generated with the same human genesfiltered by comparative analysis with orthologous mousegene sequences (Table 1). The sequence pairs ranged inlength between 680 and 2,900 base-pairs (bp), but allincluded the region -500 to +100 relative to the transcriptionstart site. Within the 14 paired sequences are 40 experimen-tally defined TFBSs (Table 1) for 13 distinct TFs within the
set of available matrices. For clarity, these binding sites werenot utilized in the construction of the matrix models. A con-servation cutoff was set to 70% for all tests, while thewindow size for conservation analysis was set to 50 bp.
SelectivityInsufficient experimental data are available to confidentlyclassify predictions as false, because many functional sitesremain to be discovered. As the population of true TFBSswithin a genomic sequence is anticipated to be small, wedefine the false-positive rate as the total number of predic-tions from all models divided by the length of the querysequence. The number of predicted TFBSs was determinedfor incrementally increasing relative matrix score thresholds(described in the Materials and methods section) between65% and 90% for both single sequences and the corre-sponding orthologous pairs:
�m�M Pm,cSel(c) = ———————L
where M is the set of 108 models, Pm,c the number ofpredicted sites using model m and relative matrix scorethreshold c, and L the length of the analyzed sequence inbase-pairs (Figure 2a).
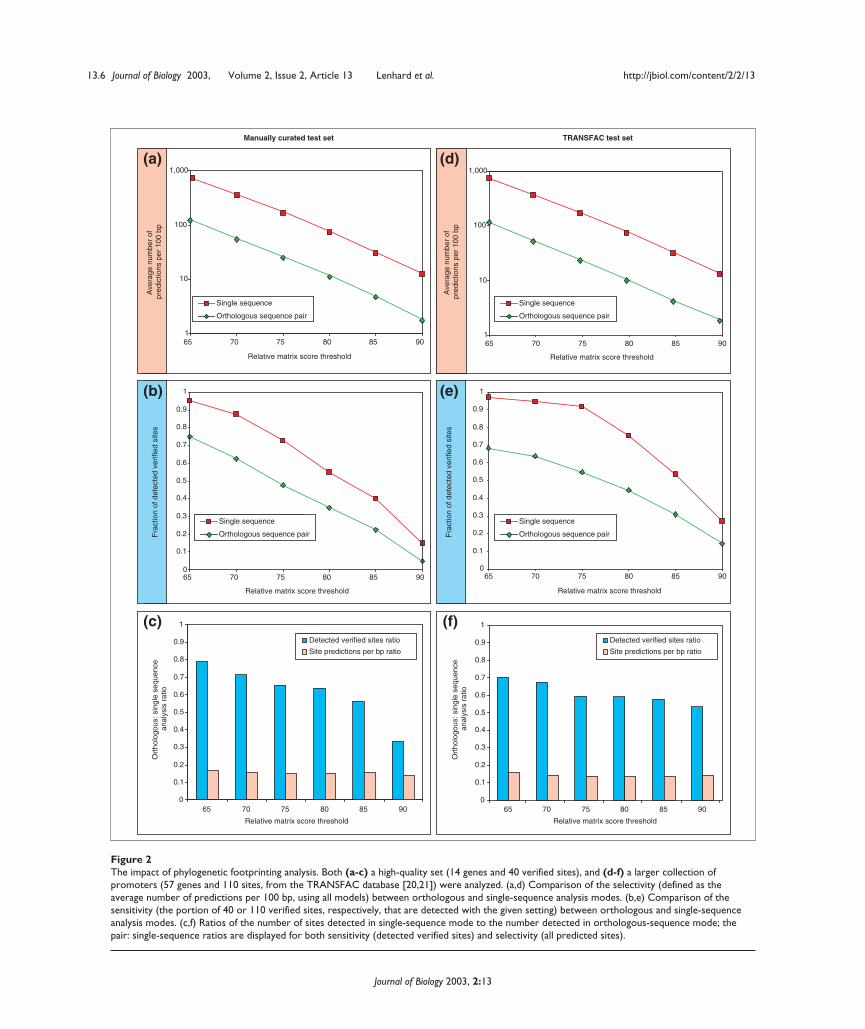
Predictive selectivity (measured by the average number ofpredicted TFBSs per 100 bp of promoter sequence whenscanning with all models) improved by 85% (average ratio:0.15) when phylogenetic footprinting is applied. The ratiosof the observed selectivity scores using phylogenetic foot-printing to those obtained using single-sequence analysismodes are shown in Figure 2c.
SensitivitySensitivity measures the ability to correctly detect knownsites (that is, when a prediction and an annotated TFBSoverlap by at least 50% of the width of the thinnest pattern),given a corresponding transcription-factor binding-profilemodel. Analyses were performed with incrementallyincreasing relative matrix score thresholds between 65%and 90%. The overall sensitivity (the fraction of known sitesdetected) was reduced slightly under the conservationrequirement: 65.5% were detected with phylogenetic foot-printing (settings of 75% relative matrix score threshold,70% identity cut-off, 50 bp window) as compared to 72.5%when analyzing single sequences (Figure 2b). The fact that afew sites were not detected with the stringent requirementsfor both regional sequence and specific-site conservationcan be attributed to multiple causes. For instance, TFBSsmay not be conserved or may be present but not detected bythe profile under the thresholds. We conclude that most
http://jbiol.com/content/2/2/13 Journal of Biology 2003, Volume 2, Issue 2, Article 13 Lenhard et al. 13.3
Journal of Biology 2003, 2:13
13.4 Journal of Biology 2003, Volume 2, Issue 2, Article 13 Lenhard et al. http://jbiol.com/content/2/2/13
Journal of Biology 2003, 2:13
Figure 1Cross-species comparisons of the �-globin gene promoter. (a) Analysis of the human promoter without phylogenetic filtering generates numerouspredictions, most of which are biologically irrelevant. (b) Comparison with the chicken promoter fails to detect conserved sites (screened with theartificially low conservation cutoff of 25%). (c) Comparison with the mouse promoter sequence identifies conserved sites, including a documentedGATA-binding site [49] (boxed). (d) Comparison with the cow promoter identifies more conserved sites. (e) Comparison to the Macaque monkey(Macaca cynomolgus) promoter results in a plot similar to the single sequence analysis. Unless indicated, all plots were generated using all availablematrices from vertebrates, with 70% conservation cutoff, 50 base-pair window size and 85% transcription factor score threshold settings. The y axisin all graphs specifies the percentage of identical nucleotides within a sliding window of fixed length (using the default of 50 base-pairs). The x axisrefers to the nucleotide position in the human sequence at which the window initiates.
(a) (b) (e)
(c)
(d)
experimentally annotated binding sites are located withinconserved regions, as we can correctly detect 82.5% of theTFBSs with a score threshold of 60%, using orthologous
gene pairs (data not shown). Ratios of the sensitivity resultsobtained using single-sequence analysis to those obtainedusing phylogenetic footprinting, are shown in Figure 2c.
http://jbiol.com/content/2/2/13 Journal of Biology 2003, Volume 2, Issue 2, Article 13 Lenhard et al. 13.5
Journal of Biology 2003, 2:13
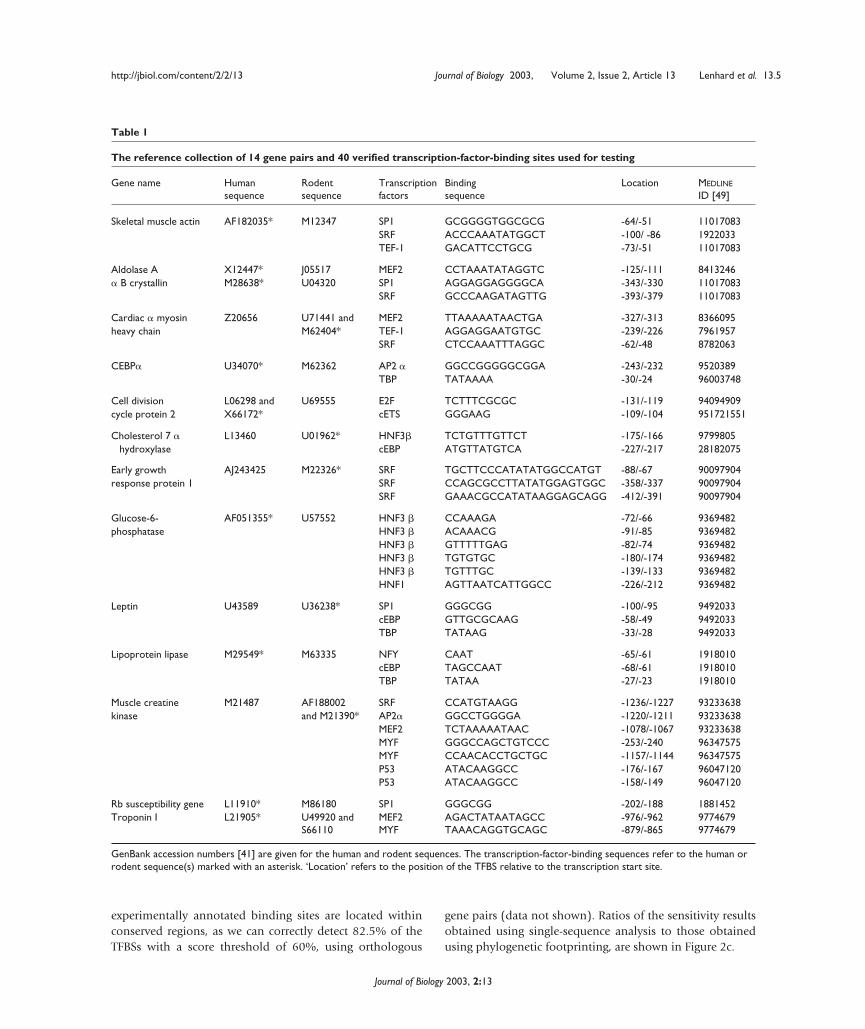
Table 1
The reference collection of 14 gene pairs and 40 verified transcription-factor-binding sites used for testing
Gene name Human Rodent Transcription Binding Location MEDLINE
sequence sequence factors sequence ID [49]
Skeletal muscle actin AF182035* M12347 SP1 GCGGGGTGGCGCG -64/-51 11017083SRF ACCCAAATATGGCT -100/ -86 1922033TEF-1 GACATTCCTGCG -73/-51 11017083
Aldolase A X12447* J05517 MEF2 CCTAAATATAGGTC -125/-111 8413246� B crystallin M28638* U04320 SP1 AGGAGGAGGGGCA -343/-330 11017083
SRF GCCCAAGATAGTTG -393/-379 11017083
Cardiac � myosin Z20656 U71441 and MEF2 TTAAAAATAACTGA -327/-313 8366095heavy chain M62404* TEF-1 AGGAGGAATGTGC -239/-226 7961957
SRF CTCCAAATTTAGGC -62/-48 8782063
CEBP� U34070* M62362 AP2 � GGCCGGGGGCGGA -243/-232 9520389TBP TATAAAA -30/-24 96003748
Cell division L06298 and U69555 E2F TCTTTCGCGC -131/-119 94094909cycle protein 2 X66172* cETS GGGAAG -109/-104 951721551
Cholesterol 7 � L13460 U01962* HNF3� TCTGTTTGTTCT -175/-166 9799805hydroxylase cEBP ATGTTATGTCA -227/-217 28182075
Early growth AJ243425 M22326* SRF TGCTTCCCATATATGGCCATGT -88/-67 90097904response protein 1 SRF CCAGCGCCTTATATGGAGTGGC -358/-337 90097904
SRF GAAACGCCATATAAGGAGCAGG -412/-391 90097904
Glucose-6- AF051355* U57552 HNF3 � CCAAAGA -72/-66 9369482phosphatase HNF3 � ACAAACG -91/-85 9369482
HNF3 � GTTTTTGAG -82/-74 9369482HNF3 � TGTGTGC -180/-174 9369482HNF3 � TGTTTGC -139/-133 9369482HNF1 AGTTAATCATTGGCC -226/-212 9369482
Leptin U43589 U36238* SP1 GGGCGG -100/-95 9492033cEBP GTTGCGCAAG -58/-49 9492033TBP TATAAG -33/-28 9492033
Lipoprotein lipase M29549* M63335 NFY CAAT -65/-61 1918010cEBP TAGCCAAT -68/-61 1918010TBP TATAA -27/-23 1918010
Muscle creatine M21487 AF188002 SRF CCATGTAAGG -1236/-1227 93233638 kinase and M21390* AP2� GGCCTGGGGA -1220/-1211 93233638
MEF2 TCTAAAAATAAC -1078/-1067 93233638MYF GGGCCAGCTGTCCC -253/-240 96347575MYF CCAACACCTGCTGC -1157/-1144 96347575P53 ATACAAGGCC -176/-167 96047120P53 ATACAAGGCC -158/-149 96047120
Rb susceptibility gene L11910* M86180 SP1 GGGCGG -202/-188 1881452Troponin I L21905* U49920 and MEF2 AGACTATAATAGCC -976/-962 9774679
S66110 MYF TAAACAGGTGCAGC -879/-865 9774679
GenBank accession numbers [41] are given for the human and rodent sequences. The transcription-factor-binding sequences refer to the human orrodent sequence(s) marked with an asterisk. ‘Location’ refers to the position of the TFBS relative to the transcription start site.
13.6 Journal of Biology 2003, Volume 2, Issue 2, Article 13 Lenhard et al. http://jbiol.com/content/2/2/13
Journal of Biology 2003, 2:13
Figure 2The impact of phylogenetic footprinting analysis. Both (a-c) a high-quality set (14 genes and 40 verified sites), and (d-f) a larger collection ofpromoters (57 genes and 110 sites, from the TRANSFAC database [20,21]) were analyzed. (a,d) Comparison of the selectivity (defined as theaverage number of predictions per 100 bp, using all models) between orthologous and single-sequence analysis modes. (b,e) Comparison of thesensitivity (the portion of 40 or 110 verified sites, respectively, that are detected with the given setting) between orthologous and single-sequenceanalysis modes. (c,f) Ratios of the number of sites detected in single-sequence mode to the number detected in orthologous-sequence mode; thepair: single-sequence ratios are displayed for both sensitivity (detected verified sites) and selectivity (all predicted sites).
orth
olog
ous/
sing
le s
eque
nce
anal
ysis
rat
io
65 70 75 80 85 90
relative score threshold
65 70 75 80 85 90
relative score threshold
single sequenceorthologous sequence pair
0
0.1
0.2
0.3
0.4
0.5
0.6
0.7
0.8
0.9
1
65 70 75 80 85 90
relative score threshold
orth
olog
ous/
sing
le s
eque
nce
anal
ysis
rat
io
detected verified sites ratiosite predictions/bp ratio
Detected verified sites ratio
Site predictions per bp ratio
0
0.1
0.2
0.3
0.4
0.5
0.6
0.7
0.8
0.9
1
65 70 75 80 85 90
detected verified sites ratiosite predictions/bp ratio
Ort
holo
gous
: sin
gle
sequ
ence
an
alys
is r
atio
Ort
holo
gous
: sin
gle
sequ
ence
an
alys
is r
atio
Detected verified sites ratio
Site predictions per bp ratio
Relative matrix score thresholdRelative matrix score threshold
1
10
100
1,000
Relative matrix score threshold
0
0.1
0.2
0.3
0.4
0.5
0.6
0.7
0.8
0.9
1
Relative matrix score threshold
Single sequence
Orthologous sequence pair
Single sequence
Orthologous sequence pair
Fra
ctio
n of
det
ecte
d ve
rifie
d si
tes
Fra
ctio
n of
det
ecte
d ve
rifie
d si
tes
Ave
rage
num
ber
of
pred
ictio
ns p
er 1
00 b
p
Ave
rage
num
ber
of
pred
ictio
ns p
er 1
00 b
p
Manually curated test set TRANSFAC test set
(a)
(b)
(c)
(d)
(e)
(f)
0
0.1
0.2
0.3
0.4
0.5
0.6
0.7
0.8
0.9
1
65 70 75 80 85 90
single sequence
Relative matrix score threshold
Single sequence
Orthologous sequence pair
1
10
100
1,000
65 70 75 80 85 90
Relative matrix score threshold
Single sequence
Orthologous sequence pair
Performance assessment with an extendedphylogenetic footprinting TFBS reference collectionAssessment of comparative genome analysis methodsrequires a broad collection of reference data to insure thatalgorithms and settings are not overly oriented towards afew genes or factors. A phylogenetic footprinting referencecollection was assembled on the basis of the TRANSFACdatabase [20,21] (as described in the Materials and methodssection). For the identification of orthologous genes, onlyintragenic regions (exons and introns) were used (that is, nopotential promoters were included). In any such large-scalemapping, it is of critical importance to find truly ortholo-gous sequences, as opposed to pseudogenes or homologswhich have no selective pressure to retain functionalbinding sites. Our selection process resulted in 110uniquely mapped TFBSs in 57 promoters of human-mouseorthologous gene pairs (available at [22]). The reference col-lection does not overlap with the initial set of 14 referencegenes described above.
The promoter regions from the reference set were analyzedusing the same procedures as were applied above (Figure 2d-f).In spite of the likelihood that the new reference collectionwill have greater noise than the small set collected bydetailed literature analysis, the performance results are com-parable between sets. The sensitivity is slightly lower for thelarge collection (Figure 2e,f), which in addition to the poten-tial difference in annotation standards could be attributableto the TFs associated with the sites. The average informationcontent of the models for TFs linked to sites in the referencecollection is lower than that for the factors associated withthe small test set (median information content: 9.7, as com-pared to 15.3 bits in the first test set). Selectivity performanceis virtually identical to the test (Figure 2d,f).
Web implementationThe algorithm described for the identification of regulatoryregions by comparative sequence analysis has been imple-mented as an intuitive and easy to use web service namedConSite [23]. The implementation allows for three analysismodes: first, alignment and conserved-site analysis of twoorthologous genomic sequences applying one or more TFprofiles; second, conserved site analysis on a submittedalignment, which allows users to generate alignments fromtheir preferred tools and allows for the analysis of longergenomic sequences; and third, a single-sequence analysistool. The single-sequence service is functionally comparableto the TESS system [24], but utilizes the JASPAR profile col-lection [15]. Alignment submission accepts the de facto stan-dard CLUSTALW format [25]. In all operating modes, usersare allowed to submit a cDNA sequence to define exon loca-tions. Users may also submit new matrix profiles of theirown construction.
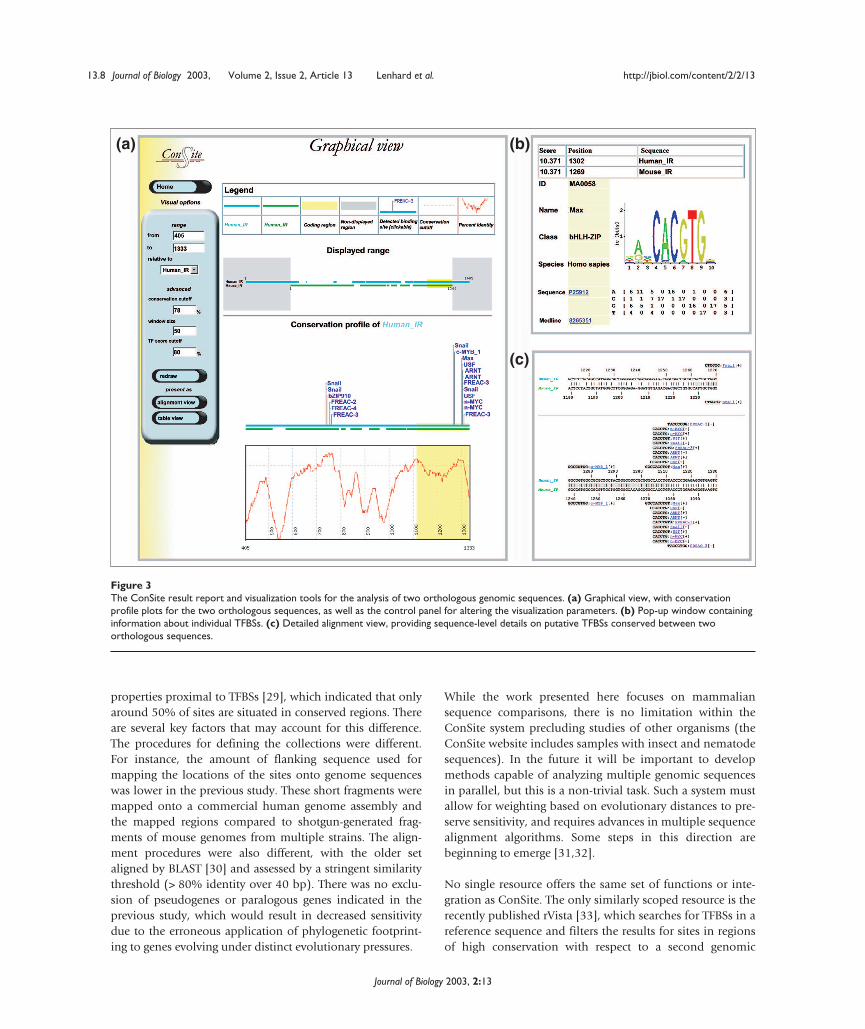
Results can be obtained in three distinct report formats.Graphical view (Figure 3a) displays an alignment overviewand conservation plots with x-axis reference for each sub-mitted sequence. Positions of conserved TFBSs are indicatedabove the plot. The transcription-factor labels are equippedwith mouse-over function to display additional data (thename and structural class of the factor, and the absolute andrelative site scores), and are hyperlinked to further informa-tion on the TF and its binding profile (Figure 3b). The pop-up windows provide data summaries, including a sequencelogo (graphical representation of the specificity of theprofile based on position-specific information content [26])with the corresponding profile from the database. Align-ment view (Figure 3c) provides a detailed overview of thedetected potential TFBSs displayed on the sequence. Thenumbering indicates positions in the actual sequences, andthe predicted TFBSs are marked. For convenience, a tabularoutput of detected sites with associated details is also pro-vided in Table view.
DiscussionComparison of orthologous genomic sequences is an effec-tive method for the identification of segments likely tomediate a sequence-specific biological function. The perfor-mance of phylogenetic footprinting methods for the detec-tion of TFBSs is dependent upon multiple factors, includingthe alignment algorithm, the available binding profiles andthe evolutionary distance between the target sequences. Twokey data resources are introduced in this study: a novel col-lection of transcription-factor binding profiles compiledfrom the biological research literature and a reference testset for phylogenetic footprinting methods. The ConSite webinterface to the system facilitates user control, an essentialfeature for users studying diverse genomes.
The binding profile collection is an important resource forbioinformatics projects. Like the TFBS programming system[27], the JASPAR profile collection is available freely to theresearch community [15]. The profiles are non-redundantand are restricted to those cases for which sufficient bindingdata were available to generate a meaningful representationof the binding specificity of a TF. Continuing expansion ofthe collection is anticipated, given the strong researchprogress in modeling DNA binding sites [28].
The new phylogenetic footprinting reference collection ofTFBSs allows for quantitative assessment of the performanceof new methods. This is the largest collection of its kind avail-able for broad use. In our study, we could detect around 68%of the experimentally defined TFBSs in conserved segments(at 65% relative matrix score threshold; see Figure 2). Thisdiffers slightly from the outcome of a study of conservation
http://jbiol.com/content/2/2/13 Journal of Biology 2003, Volume 2, Issue 2, Article 13 Lenhard et al. 13.7
Journal of Biology 2003, 2:13
properties proximal to TFBSs [29], which indicated that onlyaround 50% of sites are situated in conserved regions. Thereare several key factors that may account for this difference.The procedures for defining the collections were different.For instance, the amount of flanking sequence used formapping the locations of the sites onto genome sequenceswas lower in the previous study. These short fragments weremapped onto a commercial human genome assembly andthe mapped regions compared to shotgun-generated frag-ments of mouse genomes from multiple strains. The align-ment procedures were also different, with the older setaligned by BLAST [30] and assessed by a stringent similaritythreshold (> 80% identity over 40 bp). There was no exclu-sion of pseudogenes or paralogous genes indicated in theprevious study, which would result in decreased sensitivitydue to the erroneous application of phylogenetic footprint-ing to genes evolving under distinct evolutionary pressures.
While the work presented here focuses on mammaliansequence comparisons, there is no limitation within theConSite system precluding studies of other organisms (theConSite website includes samples with insect and nematodesequences). In the future it will be important to developmethods capable of analyzing multiple genomic sequencesin parallel, but this is a non-trivial task. Such a system mustallow for weighting based on evolutionary distances to pre-serve sensitivity, and requires advances in multiple sequencealignment algorithms. Some steps in this direction arebeginning to emerge [31,32].
No single resource offers the same set of functions or inte-gration as ConSite. The only similarly scoped resource is therecently published rVista [33], which searches for TFBSs in areference sequence and filters the results for sites in regionsof high conservation with respect to a second genomic
13.8 Journal of Biology 2003, Volume 2, Issue 2, Article 13 Lenhard et al. http://jbiol.com/content/2/2/13
Journal of Biology 2003, 2:13
Figure 3The ConSite result report and visualization tools for the analysis of two orthologous genomic sequences. (a) Graphical view, with conservationprofile plots for the two orthologous sequences, as well as the control panel for altering the visualization parameters. (b) Pop-up window containinginformation about individual TFBSs. (c) Detailed alignment view, providing sequence-level details on putative TFBSs conserved between twoorthologous sequences.
(a) (b)
(c)
sequence. Unlike rVista, ConSite searches both sequencesfor TFBSs, for better specificity, and enables easy modifica-tion of the parameters for interactive analysis, as well asproviding different output formats to aid the design andinterpretation of experiments in molecular biotechnology.ConSite’s publicly available collection of transcription-factor profiles allows users to access information about theTFs associated with the predicted sites. Given that manyusers focus on a specific TF and have developed high-quality models of their own, ConSite also allows for user-defined profiles.
We present an algorithm that uses phylogenetic footprintingto identify potential TFBSs. The approach to identifying reg-ulatory elements presented here yields greater specificitythan previous approaches that were based purely on profilesearches of single genomic sequences. In short, using phylo-genetic footprinting to filter the computational predictionssignificantly reduces noise at the price of a slight decreasein sensitivity. The web application we present enablesresearchers to utilize this approach in a straightforwardmanner. With the culmination of the human and mousegenome sequencing efforts [34,35], we believe this newalgorithm will be of significant use in the ongoing efforts toascribe function to non-coding sequences.
Materials and methodsGenomic sequence alignmentAs a result of the low overall similarity of non-codingregions across moderate evolutionary distances (for example,between human and mouse), many alignment algorithmswill fail to produce biologically meaningful alignments orwill require an arduous process to tune the algorithm para-meters. In order to obtain high-quality global alignments,we utilized the DPB algorithm (L.M. and W.W., unpub-lished; see [23]), which is optimized for the global align-ment of long genomic sequences containing short, colinearsegments of similarity.
Measurement of local similarity in global alignmentsThe most common approach used to measure local similar-ity between two globally aligned orthologous sequences uti-lizes a fixed-size sliding window to scan an alignment andidentify segments containing a minimum number of identi-cal nucleotides. The difficulties that arise with sliding-window approaches are related to the treatment of edgesand gaps in the alignment. Sliding a window along thealignment itself will assign a low identity score to shortregions of high identity flanked by long regions of greatervariation (for example, a large gap or insertion in one of thesequences). We elected to collapse the gaps in the alignment(that is, to remove the positions containing gaps in the
sequence in question) and to calculate a separate conserva-tion profile for each orthologous sequence.
Classification of motif-match conservation withinaligned genomic sequencesWithin the conserved segments, conserved sites are detectedby, firstly, scanning each of the two orthologous sequenceswith position-specific weight matrices [1] for the TFs ofinterest, and secondly, retaining only those predicted sites(for each given TF model) that are in equivalent positionsin the alignment. The scores for matches to the position-specific weight matrix models must exceed the user-definedrelative matrix score threshold.
Collection and annotation of binding modelsAll profiles are derived from published collections of experi-mentally defined TFBSs for multicellular eukaryotes. Thedatabase, named JASPAR [15], represents a curated collec-tion of target sequences. The motif-detection program ANN-Spec [36] was used to align each binding site set. TheANN-Spec alignments were performed with a range of motifwidths, using three random seeds and 80,000 iterations.The profile matrices and associated information are storedin a relational database (MySQL); a flat file representationof the data is available for academic use [22]. Users mayalso submit their own profiles for private use within theConSite system.
Identification of relative matrix score thresholdsCandidate TFBSs in individual sequences have a score asdetermined by the position weight matrix for the givensequence, which has been reviewed elsewhere [1]. The scoreranges are unique for each binding model, so it is advanta-geous to convert the score range to a common, relative unitscale as given by
score – scoremin100 � ——————————
scoremax – scoremin
Score ranges are used for defining relative matrix scorethresholds. The applied scoring method is in direct relationto the protein-DNA binding energy [1], and it thereforedoes not take into account statistical significance of anobserved motif in relation to the local nucleotide composi-tion (for example, GC-rich regions). The influence of thebackground distribution on the protein-DNA interaction ispoorly understood. This is recognized as an open problemwithin the field, as it is highly controversial whether the sur-rounding base composition could have any influence on thethermodynamics of binding [37]. For these reasons, wechoose to score the matrix profiles using a uniform basecomposition.
http://jbiol.com/content/2/2/13 Journal of Biology 2003, Volume 2, Issue 2, Article 13 Lenhard et al. 13.9
Journal of Biology 2003, 2:13
Parameter settings and manipulationIn all three analysis modes the user can choose relativematrix score thresholds (default 80%). In alignment analysismodes, one can also choose the size of the sliding window(default 50 nucleotides) and the conservation cutoff (per-centage sequence identity within the window for the defini-tion of conserved regions). There is no fixed default value forthe latter parameter; instead, the conservation cutoff is set toretain the top 10% of conserved windows (based onnucleotide identity within a window of sequence in thealignment). This latter mechanism was motivated by the dif-ferent rates of evolution across genomes.
Matrix manipulation, site detection andphylogenetic footprintingFor matrix manipulation, TFBS detection and some otheractions (such as sequence ‘logo’ drawing) we intensively usedthe ‘TFBS software’, a set of object-oriented Perl modules(with extensions in C and C++) developed for the accelera-tion of promoter analysis scripting [38].
The phylogenetic footprinting TFBS referencecollectionAn initial set of annotated binding sites was identified fromTRANSFAC (version 4.0) [20,21] for human (662 sites) andmouse (376 sites). Each binding site was extended with 50bp of flanking sequence in both directions from the respec-tive promoter to allow unambiguous mapping onto the cor-responding genome assembly (human version hg13 andmouse version mm2 [39,40]). Only sites bound by a TFwith a corresponding matrix model in the JASPAR collec-tion were kept.
In order to define orthology without regard to thesequences flanking the binding sites (which would intro-duce circularity problems), we defined human-mouse pair-ings on the basis of cDNA sequences. The mappings ofGenBank [41] and RefSeq [42,43] cDNAs to the assemblieswere obtained from the UCSC Genome Browser Database[39,40]. In addition 50,821 mouse cDNAs from the RIKENproject [44] were mapped to the mouse genome assemblyusing the client/server version of BLAT [45] with default set-tings. In brief, for all mappings of a given cDNA, we con-sider only those with cDNA coverage > 75% and with> 99% sequence identity to the genomic sequence, then sortthe set by (number of matches)*(cDNA coverage), andfinally take the first mapping in the sorted set.
Each promoter fragment was mapped to its correspondinggenome assembly using BLAT, as above. Extended sitesequences that unambiguously mapped to the promoterregion of the TRANSFAC annotated gene were kept. For eachmapped TRANSFAC binding site, the nearest downstream
cDNA mapping was located and the GeneLynx record con-taining that cDNA retrieved. cDNAs with mouse-humanortholog pairs defined in the GeneLynx Mouse [46] data-base were retained.
For a pair of cDNA sequences thus identified, the genomicsequences spanning representative mappings were extractedand aligned, using BLASTZ [47] (default settings). For eachaligned sequence pair, the alignment coverage and the simi-larities in gene structure as indicated by the mappings weremanually evaluated to select not more than one ortholo-gous region per initial TFBS-cDNA-GeneLynx identifier‘triplet’. Promoter-region pairs corresponding to 1,000 bpupstream of the binding site and 100 bp into the first exonwere extracted, using the BLASTZ alignment as reference.
AcknowledgementsThis project was supported by funds from the Karolinska Institute andthe Pharmacia Corporation.
References1. Stormo GD: DNA binding sites: representation and discov-
ery. Bioinformatics 2000, 16:16-23.2. Tronche F, Ringeisen F, Blumenfeld M, Yaniv M, Pontoglio M:
Analysis of the distribution of binding sites for a tissue-specific transcription factor in the vertebrate genome. JMol Biol 1997, 266:231-245.
3. Fickett JW: Quantitative discrimination of MEF2 sites. MolCell Biol 1996, 16:437-441.
4. Gumucio DL, Heilstedt-Williamson H, Gray TA, Tarle SA, SheltonDA, Tagle DA, Slightom JL, Goodman M, Collins FS: Phyloge-netic footprinting reveals a nuclear protein which binds tosilencer sequences in the human gamma and epsilonglobin genes. Mol Cell Biol 1992, 12:4919-4929.
5. Pennacchio LA, Rubin EM: Genomic strategies to identifymammalian regulatory sequences. Nat Rev Genet 2001,2:100-109.
6. Fickett JW, Wasserman WW: Discovery and modeling oftranscriptional regulatory regions. Curr Opin Biotechnol 2000,11:19-24.
7. Loots GG, Locksley RM, Blankespoor CM, Wang ZE, Miller W,Rubin EM, Frazer KA: Identification of a coordinate regulatorof interleukins 4, 13, and 5 by cross-species sequence com-parisons. Science 2000, 288:136-140.
8. Batzoglou S, Pachter L, Mesirov JP, Berger B, Lander ES: Humanand mouse gene structure: comparative analysis andapplication to exon prediction. Genome Res 2000, 10:950-958.
9. Jareborg N, Durbin R: Alfresco - a workbench for compara-tive genomic sequence analysis. Genome Res 2000, 10:1148-1157.
10. Wasserman WW, Palumbo M, Thompson W, Fickett JW,Lawrence CE: Human-mouse genome comparisons tolocate regulatory sites. Nat Genet 2000, 26:225-228.
11. Krivan W, Wasserman WW: A predictive model for regula-tory sequences directing liver-specific transcription.Genome Res 2001, 11:1559-1566
12. Gelfand MS, Novichkov PS, Novichkova ES, Mironov AA: Com-parative analysis of regulatory patterns in bacterialgenomes. Brief Bioinform 2000, 1:357-371.
13. McCue L, Thompson W, Carmack C, Ryan MP, Liu JS, DerbyshireV, Lawrence CE: Phylogenetic footprinting of transcriptionfactor binding sites in proteobacterial genomes. NucleicAcids Res 2001, 29:774-782.
13.10 Journal of Biology 2003, Volume 2, Issue 2, Article 13 Lenhard et al. http://jbiol.com/content/2/2/13
Journal of Biology 2003, 2:13
14. Pollock R, Treisman R: A sensitive method for the determi-nation of protein-DNA binding specificities. Nucleic Acids Res1990, 18:6197-6204.
15. JASPAR database [http://www.phylofoot.org/consite/download]16. Kimura M: Preponderance of synonymous changes as evi-
dence for the neutral theory of molecular evolution.Nature 1977, 267:275-276.
17. Shabalina SA, Ogurtsov AY, Kondrashov VA, Kondrashov AS:Selective constraint in intergenic regions of human andmouse genomes. Trends Genet 2001, 17:373-376.
18. Duret L, Bucher P: Searching for regulatory elements in humannoncoding sequences. Curr Opin Struct Biol 1997, 7:399-406.
19. Arnone MI, Davidson EH: The hardwiring of development:organization and function of genomic regulatory systems.Development 1997, 124:1851-1864.
20. Matys V, Fricke E, Geffers R, Gossling E, Haubrock M, Hehl R,Hornischer K, Karas D, Kel AE, Kel-Margoulis OV, et al.: TRANS-FAC: transcriptional regulation, from patterns to profiles.Nucleic Acids Res 2003, 31:374-378.
21. TRANSFAC - The Transcription Factor Database[http://transfac.gbf.de/TRANSFAC/]
22. Extended TFBS test set[http://www.phylofoot.org/consite/testset]
23. Phylofoot.org tools for phylogenetic footprinting[http://www.phylofoot.org/]
24. TESS: Transcription Element Search System[http://www.cbil.upenn.edu/tess/]
25. Thompson JD, Higgins DG, Gibson TJ: CLUSTAL W: improv-ing the sensitivity of progressive multiple sequence align-ment through sequence weighting, position-specific gappenalties and weight matrix choice. Nucleic Acids Res 1994,22:4673-4680.
26. Schneider TD, Stephens RM: Sequence logos: a new way todisplay consensus sequences. Nucleic Acids Res 1990, 18:6097-6100.
27. Lenhard B, Hayes WS, Wasserman WW: GeneLynx: a gene-centric portal to the human genome. Genome Res 2001,11:2151-2157.
28. Bulyk ML, Huang X, Choo Y, Church GM: Exploring the DNA-binding specificities of zinc fingers with DNA microarrays.Proc Natl Acad Sci USA 2001, 98:7158-7163.
29. Levy S, Hannenhalli S: Identification of transcription factorbinding sites in the human genome sequence. MammGenome 2002, 13:510-514.
30. Altschul SF, Madden TL, Schaffer AA, Zhang J, Zhang Z, Miller W,Lipman DJ: Gapped BLAST and PSI-BLAST: a new genera-tion of protein database search programs. Nucleic Acids Res1997, 25:3389-3402.
31. Blanchette M, Schwikowski B, Tompa M: Algorithms for phylo-genetic footprinting. J Comput Biol 2002, 9:211-223.
32. Boffelli D, McAuliffe J, Ovcharenko D, Lewis KD, Ovcharenko I,Pachter L, Rubin EM: Phylogenetic shadowing of primatesequences to find functional regions of the humangenome. Science 2003, 299:1391-1394.
33. Loots GG, Ovcharenko I, Pachter L, Dubchak I, Rubin EM: rVistafor comparative sequence-based discovery of functionaltranscription factor binding sites. Genome Res 2002, 12:832-839.
34. Lander ES, Linton LM, Birren B, Nusbaum C, Zody MC, Baldwin J,Devon K, Dewar K, Doyle M, FitzHugh W, et al.: Initial sequenc-ing and analysis of the human genome. Nature 2001,409:860-921.
35. Waterston RH, Lindblad-Toh K, Birney E, Rogers J, Abril JF,Agarwal P, Agarwala R, Ainscough R, Alexandersson M, An P, etal.: Initial sequencing and comparative analysis of themouse genome. Nature 2002, 420:520-562.
36. Workman CT, Stormo GD: ANN-Spec: a method for discov-ering transcription factor binding sites with improvedspecificity. Pac Symp Biocomput 2000, 5:467-478.
37. Schneider TD: Measuring molecular information. J Theor Biol1999, 201:87-92.
38. Lenhard B, Wasserman WW: TFBS: Computational frame-work for transcription factor binding site analysis. Bioinfor-matics 2002, 18:1135-1136.
39. Karolchik D, Baertsch R, Diekhans M, Furey TS, Hinrichs A, Lu YT,Roskin KM, Schwartz M, Sugnet CW, Thomas DJ, et al.: TheUCSC Genome Browser Database. Nucleic Acids Res 2003,31:51-54.
40. Kent WJ, Sugnet CW, Furey TS, Roskin KM, Pringle TH, ZahlerAM, Haussler D: The human genome browser at UCSC.Genome Res 2002, 12:996-1006.
41. GenBank [http://www.ncbi.nlm.nih.gov/Genbank/index.html]42. Pruitt KD, Maglott DR: RefSeq and LocusLink: NCBI gene-
centered resources. Nucleic Acids Res 2001, 29:137-140.43. RefSeq [http://www.ncbi.nlm.nih.gov/RefSeq/]44. Okazaki Y, Furuno M, Kasukawa T, Adachi J, Bono H, Kondo S,
Nikaido I, Osato N, Saito R, Suzuki H, et al.: Analysis of themouse transcriptome based on functional annotation of60,770 full-length cDNAs. Nature 2002, 420:563-573.
45. Kent WJ: BLAT - the BLAST-like alignment tool. GenomeRes 2002, 12:656-664.
46. Lenhard B, Wahlestedt C, Wasserman W: GeneLynx Mouse:integrated portal to the mouse genome. Genome Res, inpress.
47. Schwartz S, Kent WJ, Smit A, Zhang Z, Baertsch R, Hardison RC,Haussler D, Miller W: Human-mouse alignments withBLASTZ. Genome Res 2003, 13:103-107.
48. MEDLINE [http://www.ncbi.nlm.nih.gov/entrez/query.fcgi]49. Cao A, Moi P: Regulation of the globin genes. Pediatr Res
2002, 51:415-421.
http://jbiol.com/content/2/2/13 Journal of Biology 2003, Volume 2, Issue 2, Article 13 Lenhard et al. 13.11
Journal of Biology 2003, 2:13
Related Documents