IDAHO TRANSPORTATION DEPARTMENT RESEARCH REPORT Development of Pavement Temperature Prediction Model RP 279 By Emad Kassem Fouad M.S. Bayomy Christopher Williams Eric Saasita Simpson Lamichane Dio D. Permadi University of Idaho Prepared for Idaho Transportation Department ITD Research Program, Contracting Services Highways Construction and Operations August 2020

Welcome message from author
This document is posted to help you gain knowledge. Please leave a comment to let me know what you think about it! Share it to your friends and learn new things together.
Transcript

IDAHO TRANSPORTATION DEPARTMENT
RESEARCH REPORT
Development of Pavement Temperature Prediction Model
RP 279
By
Emad Kassem Fouad M.S. Bayomy
Christopher Williams Eric Saasita
Simpson Lamichane Dio D. Permadi
University of Idaho
Prepared for
Idaho Transportation Department
ITD Research Program, Contracting Services
Highways Construction and Operations
August 2020

Development of Pavement Temperature Prediction Model 2
Disclaimer
This document is disseminated under the sponsorship of the Idaho Transportation Department and the United States Department of Transportation in the interest of information exchange. The State of Idaho and the United States Government assume no liability of its contents or use thereof.
The contents of this report reflect the view of the authors, who are responsible for the facts and accuracy of the data presented herein. The contents do not necessarily reflect the official policies of the Idaho Transportation Department or the United States Department of Transportation.
The State of Idaho and the United States Government do not endorse products or manufacturers. Trademarks or manufacturers’ names appear herein only because they are considered essential to the object of this document.
This report does not constitute a standard, specification or regulation.
Development of Pavement Temperature Prediction Model 3
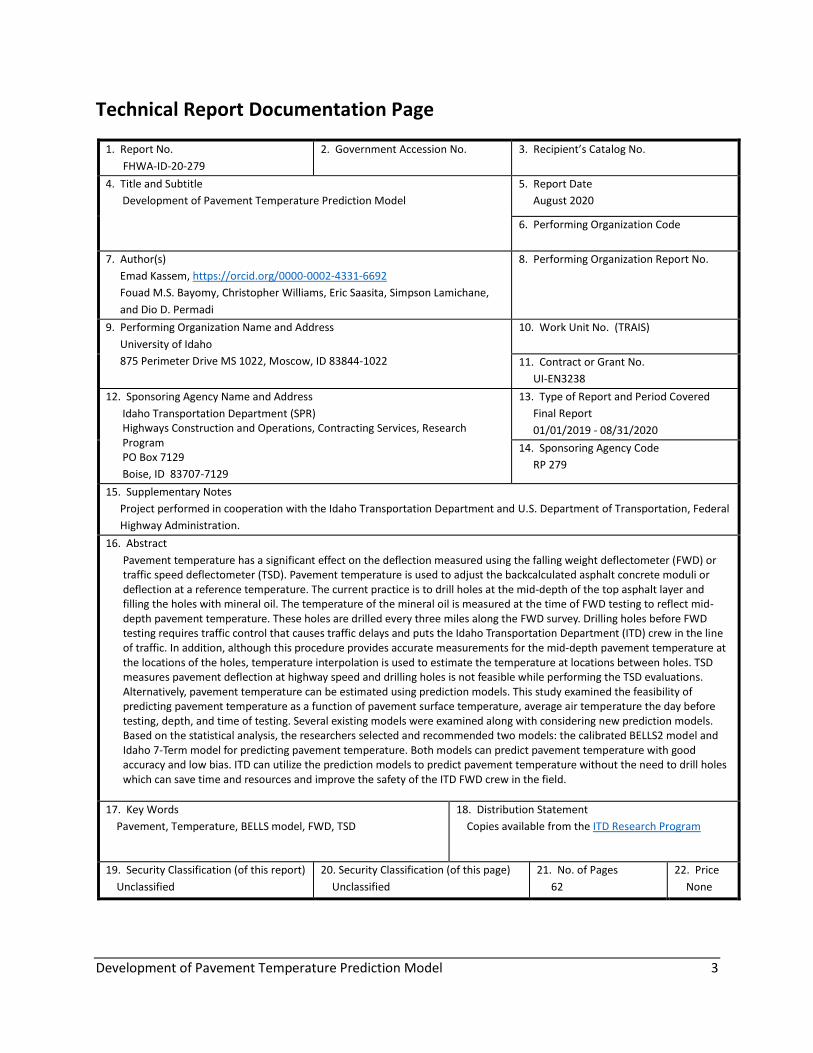
Technical Report Documentation Page
1. Report No.
FHWA-ID-20-279
2. Government Accession No.
3. Recipient’s Catalog No.
4. Title and Subtitle
Development of Pavement Temperature Prediction Model
5. Report Date
August 2020
6. Performing Organization Code
7. Author(s)
Emad Kassem, https://orcid.org/0000-0002-4331-6692
Fouad M.S. Bayomy, Christopher Williams, Eric Saasita, Simpson Lamichane,
and Dio D. Permadi
8. Performing Organization Report No.
9. Performing Organization Name and Address
University of Idaho
875 Perimeter Drive MS 1022, Moscow, ID 83844-1022
10. Work Unit No. (TRAIS)
11. Contract or Grant No.
UI-EN3238
12. Sponsoring Agency Name and Address
Idaho Transportation Department (SPR) Highways Construction and Operations, Contracting Services, Research Program PO Box 7129
Boise, ID 83707-7129
13. Type of Report and Period Covered
Final Report
01/01/2019 - 08/31/2020
14. Sponsoring Agency Code
RP 279
15. Supplementary Notes
Project performed in cooperation with the Idaho Transportation Department and U.S. Department of Transportation, Federal
Highway Administration.
16. Abstract
Pavement temperature has a significant effect on the deflection measured using the falling weight deflectometer (FWD) or traffic speed deflectometer (TSD). Pavement temperature is used to adjust the backcalculated asphalt concrete moduli or deflection at a reference temperature. The current practice is to drill holes at the mid-depth of the top asphalt layer and filling the holes with mineral oil. The temperature of the mineral oil is measured at the time of FWD testing to reflect mid-depth pavement temperature. These holes are drilled every three miles along the FWD survey. Drilling holes before FWD testing requires traffic control that causes traffic delays and puts the Idaho Transportation Department (ITD) crew in the line of traffic. In addition, although this procedure provides accurate measurements for the mid-depth pavement temperature at the locations of the holes, temperature interpolation is used to estimate the temperature at locations between holes. TSD measures pavement deflection at highway speed and drilling holes is not feasible while performing the TSD evaluations. Alternatively, pavement temperature can be estimated using prediction models. This study examined the feasibility of predicting pavement temperature as a function of pavement surface temperature, average air temperature the day before testing, depth, and time of testing. Several existing models were examined along with considering new prediction models. Based on the statistical analysis, the researchers selected and recommended two models: the calibrated BELLS2 model and Idaho 7-Term model for predicting pavement temperature. Both models can predict pavement temperature with good accuracy and low bias. ITD can utilize the prediction models to predict pavement temperature without the need to drill holes which can save time and resources and improve the safety of the ITD FWD crew in the field.
17. Key Words
Pavement, Temperature, BELLS model, FWD, TSD
18. Distribution Statement
Copies available from the ITD Research Program
19. Security Classification (of this report)
Unclassified
20. Security Classification (of this page)
Unclassified
21. No. of Pages
62
22. Price
None

Development of Pavement Temperature Prediction Model 4
Acknowledgments
This project is funded by Idaho Transportation Department (ITD) from SPR funds. It is performed in
cooperation with ITD. The authors would like to acknowledge all members of the research project
Technical Advisory Committee (TAC) for their valuable feedback and cooperation all over the project tasks.
The authors would like also to acknowledge the support from the National Institute for Advanced
Transportation Technology (NIATT) and the Department of Civil and Environmental Engineering at the
University of Idaho. The authors would also like to acknowledge the help from Dr. Ahmed Muftah and Mr.
Austin Corley in this study.
Technical Advisory Committee
Each research project is overseen by a Technical Advisory Committee (TAC). The TAC is responsible for
monitoring project progress, reviewing deliverables, ensuring that study objectives are met, and
facilitating implementation of research recommendations, as appropriate. ITD’s Research Program
Manager appreciates the work of the following TAC members in guiding this research study.
Project Sponsor: Mark Snyder, P.E.
Project Manager: James Poorbaugh, P.E.
TAC Members: James Poorbaugh, Trek Pallister, Ned Parrish
FHWA-Idaho Advisor: Kyle Holman, P.E.
Development of Pavement Temperature Prediction Model 5
Table of Contents
Executive Summary ..................................................................................................................................... 10
1. Introduction .......................................................................................................................................... 12
Background and Problem Statement ................................................................................................... 12
Project Goal and Objectives ................................................................................................................. 13
Research Tasks ..................................................................................................................................... 13
Task 1: Literature Review .................................................................................................................. 14
Task 2: Review ITD Measured Mid-Depth Pavement Temperature Data ......................................... 14
Task 3: Validate Existing Mid-Depth Pavement Temperature Models ............................................. 14
Task 4: Develop Excel–Based Utility.................................................................................................. 15
Task 5: Develop Recommendations on Revised Practice for Pavement Temperature Measurement
........................................................................................................................................................... 15
Report Organization ............................................................................................................................. 15
2. Literature Review ................................................................................................................................. 17
Introduction .......................................................................................................................................... 17
Temperature Prediction Models .......................................................................................................... 20
BELLS Models .................................................................................................................................... 20
Alternative (Texas A&M) Prediction Model ...................................................................................... 22
Validation of BELLS Models ............................................................................................................... 24
3. Data Collection and Statistical Analysis ................................................................................................ 26
Introduction .......................................................................................................................................... 26
ITD Data Collection ............................................................................................................................... 26
Data Collection on Campus .................................................................................................................. 30
Statistical Analysis of Pavement Temperature Data ............................................................................ 31
BELLS2 Model ....................................................................................................................................... 32
BELLS3 Model ....................................................................................................................................... 33
Calibrated BELLS2 Model ...................................................................................................................... 34
Alternative Texas Model....................................................................................................................... 36
Idaho First Order Model ....................................................................................................................... 39
Idaho 7-Term Model ............................................................................................................................. 41
Development of Pavement Temperature Prediction Model 6
Summary of Prediction Models ............................................................................................................ 43
Excel-Based Utility for Pavement Temperature Prediction.................................................................. 46
4. Conclusions and Recommendations .................................................................................................... 48
5. References ............................................................................................................................................ 50
Appendix A. Test Data ................................................................................................................................. 51
Table A.1 Data Collection ..................................................................................................................... 51

Development of Pavement Temperature Prediction Model 7
List of Tables
Table 1 Coefficients of BELLS Equations ..................................................................................................... 21
Table 2. Coefficients of Calibrate BELLS Equation after Fernando et al. (2001) (Fernando et al. 2011) .... 23
Table 3. Coefficients of the Alternative Model for Predicting Pavement Temperature (Liao et al. 2009) . 23
Table 4. Comparison of Predictive Accuracy of Models Evaluated by Fernando et al. (2001) (Fernando et
al. 2011) ...................................................................................................................................................... 24
Table 5. Example of the Measured Pavement Temperature Data by ITD .................................................. 27
Table 6. Statistical Analysis of BELLS2 Model using National Parameter Estimates ................................... 33
Table 7. Statistical Analysis of BELLS3 Model using National Parameter Estimates ................................... 34
Table 8. Coefficients of Calibrated BELLS2 Model ...................................................................................... 35
Table 9. Statistical Analysis of Calibrated BELLS2 Model using Idaho Parameter Estimates...................... 36
Table 10. Statistical Analysis of Alternative Texas Model using Texas Parameter Estimates .................... 37
Table 11. Coefficients of Calibrated Alternative Texas Model for Predicting Pavement Temperature ..... 38
Table 12. Statistical Analysis of Calibrated Alternative Texas Model using Idaho Parameter Estimates ... 39
Table 13. Coefficients of Idaho First Order Model ...................................................................................... 40
Table 14. Statistical Analysis of Idaho First Order Model ........................................................................... 41
Table 15. Coefficients of the Idaho 7-Term Model ..................................................................................... 42
Table 16. Statistical Analysis of the Idaho 7-Term Model .......................................................................... 43
Table 17. Summary Results from all models ............................................................................................... 45
Table 18. Command Buttons and Their Function ....................................................................................... 47

Development of Pavement Temperature Prediction Model 8
List of Figures
Figure 1: ITD’s FWD Truck and Trailer ......................................................................................................... 17
Figure 2. FWD Deflection Basin (Tutumluer and Sarker 2015) ................................................................... 18
Figure 3. Temperature Change as a Function of Pavement Depth and Time of Measurement: (a) Section
20 in September; (b) Section 13 in February 7 (Inge and Kim 1995) .......................................................... 19
Figure 4. Influence of Temperature on Flexible Pavement Deflection (Johnson et al. 1990) .................... 20
Figure 5. 18-hr Sine Function Used in BELLS Equations (Lukanen et al. 2000) ........................................... 21
Figure 6. Comparison of Predicted Temperatures from BELLS2 with Measured Temperatures (Fernando
et al. 2011) .................................................................................................................................................. 22
Figure 7. Validation of the BELLS Equation using Temperatures Measured from Pavements in North
Carolina (Inge and Kim 1995) ...................................................................................................................... 24
Figure 8. Measured versus Predicted Pavement Temperature using Calibrated BELLS model (Solatifar et
al. 2018) ...................................................................................................................................................... 25
Figure 9. Measured versus predicted pavement temperature using BELLS3 model (Liao et al. 2009) ...... 25
Figure 10. Locations of selected sections ................................................................................................... 28
Figure 11. Items and materials used in Measuring Pavement Temperature in the Field .......................... 30
Figure 12. Location of Test Sites at U of I ................................................................................................... 31
Figure 13. Predicted Temperature vs. Measured Temperature using the BELLS2 Model with National
Parameter Estimates ................................................................................................................................... 32
Figure 14. Predicted Temperature vs. Measured Temperature using the BELLS3 Model with National
Parameter Estimates ................................................................................................................................... 33
Figure 15. Predicted Temperature vs. Measured Temperature using the Calibrated BELLS2 Model with
Idaho Parameter Estimates ......................................................................................................................... 35
Figure 16. Predicted Temperature vs. Measured Temperature using Alternative Texas Model with Texas
Parameter Estimates ................................................................................................................................... 37
Figure 17. Predicted Temperature vs. Measured Temperature using Alternative Texas Model with ID
parameter estimates and ID data ............................................................................................................... 39
Figure 18. Predicted Temperature vs. Measured Temperature using the Idaho First Order Model ......... 41
Figure 19. Predicted Temperature vs. Measured Temperature using the Idaho 7-Term Model ............... 43
Figure 20. Predicted Pavement Temperature using the Calibrated BELLS Model vs. Idaho 7-Term Model
.................................................................................................................................................................... 45
Figure 21. Excel–Based Utility for Pavement Temperature Prediction ...................................................... 46

Development of Pavement Temperature Prediction Model 9
List of Abbreviations and Acronyms
FWD …………………………. Falling Weight Deflectometer
TSD …………………………… Traffic Speed Deflectometer
ITD ……………………………. Idaho Transportation Department
FHWA ………………………. Federal Highway Administration
LTPP …………………………. Long-Term Pavement Performance
UI ……………………………… University of Idaho
TxDOT ………………………. Texas Department of Transportation
TAC Technical Advisory Committee

Development of Pavement Temperature Prediction Model 10
Executive Summary
Pavement temperature has a significant effect on the deflection measured using the falling weight
deflectometer (FWD) or traffic speed deflectometer (TSD). Pavement temperature is used to adjust the
backcalculated asphalt concrete moduli or deflection at a reference temperature. The current practice at
Idaho Transportation Department (ITD) and other transportation agencies is to drill holes at the mid-depth
of the top asphalt layer and filling the holes with mineral oil. The temperature of the mineral oil is
measured at the time of FWD testing to reflect mid-depth pavement temperature. These holes are drilled
every three miles along the FWD survey. Drilling holes before FWD testing requires traffic control that
causes traffic delays and puts the ITD crew in the line of traffic. In addition, although this procedure
provides accurate measurements for the mid-depth pavement temperature at the locations of the holes,
temperature interpolation is used to estimate the temperature at locations between holes since they are
drilled every three miles. This may result in inaccurate pavement temperature predictions. Furthermore,
ITD recently adapted the use of TSD is evaluating the structural conditions of pavements. TSD measures
pavement deflection at highway speeds and drilling holes is not feasible while performing the TSD
evaluations. Alternatively, pavement temperature can be estimated using prediction models.
This study aimed to develop a procedure that can be used by ITD crew to predict the mid-depth pavement
temperature as a function of pavement surface temperature, previous day’s average air temperature,
depth, and time of testing. An infrared thermometer is installed on the FWD trailer to measure the
pavement surface temperature during testing. In addition, the location of the measurements was also
documented. The location was used to determine the previous day’s average air temperature from the
weather records using online resources such as Weather Underground website. The researchers used the
pavement temperature data collected by the ITD FWD crew in the past four years (i.e., 2016, 2017, 2018,
and 2019) during the FWD testing in the six districts of the state. A total number of 454 measurements
were collected in the field. Most of the pavement temperature measurements collected by FWD crew
were obtained at a fixed depth of three inches from the pavement surface. Therefore, the researchers
collected additional measurements (142 measurements) at two different depths (i.e., three inches and
five inches) at two sites on campus at the University of Idaho. A total number of 596 pavement
temperature measurements were used in this study to develop pavement temperature prediction models
or calibrate existing ones. The researchers evaluated seven models to obtain a pavement temperature
prediction model with good accuracy and low bias. These seven cases included:
• Case 1: BELLS2 model with the national coefficient estimates
• Case 2: BELLS3 model with the national coefficient estimates
• Case 3: Calibrated BELLS2 model with calibrated (Idaho) coefficient estimates
• Case 4: Alternative Texas model with Texas coefficient estimates
• Case 5: Calibrated Alternative Texas model with calibrated (Idaho) coefficient estimates
• Case 6: Idaho First Order Model
• Case 7: Idaho 7-Term Model

Development of Pavement Temperature Prediction Model 11
The results revealed that the calibration process improved the accuracy of the BELLS2 model and reduced
the bias in pavement temperature prediction. There was a reduction of 12.5% in Root-Mean-Square Error
(RMSE) using the calibrated BELLS2 model compared to the original BELLS2 model. The calibrated BELLS2
model and Idaho 7-Term model were found to provide the highest adjusted R2 and lowest RMSE. An
adjusted R2 of 0.913 was obtained for the calibrated BELLS2 model and 0.919 for Idaho 7-Term model,
while an RMSE of 3.3 °C was associated with the calibrated BELLS2 model and 3.2 °C for the Idaho 7-Term
model. Both models (i.e., Idaho 7-Term and calibrated BELLS2) are highly correlated (R2 of 0.99). It should
be noted that BELLS2 model was originally developed using over 10,000 observations and the
measurements used in this study (596 observations) were used to calibrate the model and provide the
calibrated BELLS2 model. Whereas the Idaho 7-Term model was developed based on the data collected
in Idaho (596 observations). The Idaho 7-Term model provided comparable R2 to that of calibrated BELLS2
model but a slightly lower RMSE.
The results of this study clearly demonstrate that pavement temperature can be estimated as a function
or pavement surface temperature, previous day’s average air temperature, depth, and time of testing.
Based on the statistical analysis, the researchers selected and recommended two models: the calibrated
BELLS2 model and Idaho 7-Term model for predicting pavement temperature. Both models can predict
pavement temperature with good accuracy and low bias. ITD can utilize the prediction models to predict
pavement temperature without the need to drill holes which can save time and resources. In addition,
this procedure improves the safety of ITD crew and the accuracy of mid-depth pavement temperature at
locations where no holes are drilled or can be drilled such as when TSD is used.
Development of Pavement Temperature Prediction Model 12
1. Introduction
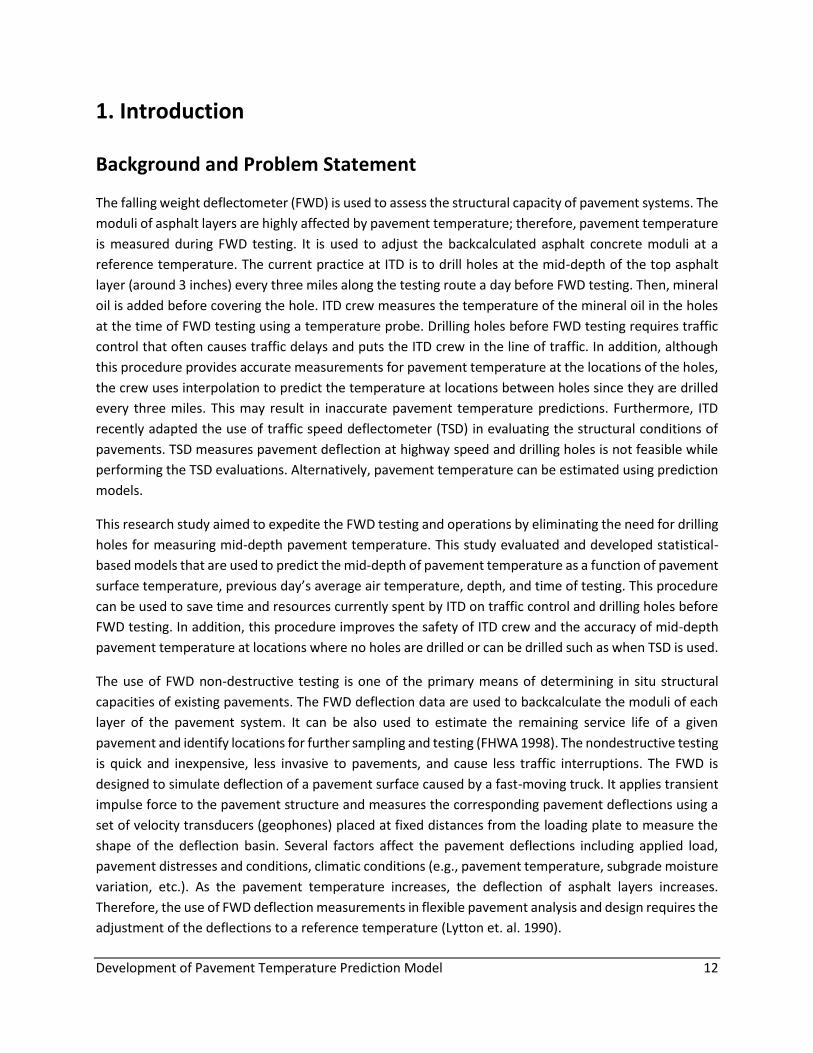
Background and Problem Statement
The falling weight deflectometer (FWD) is used to assess the structural capacity of pavement systems. The
moduli of asphalt layers are highly affected by pavement temperature; therefore, pavement temperature
is measured during FWD testing. It is used to adjust the backcalculated asphalt concrete moduli at a
reference temperature. The current practice at ITD is to drill holes at the mid-depth of the top asphalt
layer (around 3 inches) every three miles along the testing route a day before FWD testing. Then, mineral
oil is added before covering the hole. ITD crew measures the temperature of the mineral oil in the holes
at the time of FWD testing using a temperature probe. Drilling holes before FWD testing requires traffic
control that often causes traffic delays and puts the ITD crew in the line of traffic. In addition, although
this procedure provides accurate measurements for pavement temperature at the locations of the holes,
the crew uses interpolation to predict the temperature at locations between holes since they are drilled
every three miles. This may result in inaccurate pavement temperature predictions. Furthermore, ITD
recently adapted the use of traffic speed deflectometer (TSD) in evaluating the structural conditions of
pavements. TSD measures pavement deflection at highway speed and drilling holes is not feasible while
performing the TSD evaluations. Alternatively, pavement temperature can be estimated using prediction
models.
This research study aimed to expedite the FWD testing and operations by eliminating the need for drilling
holes for measuring mid-depth pavement temperature. This study evaluated and developed statistical-
based models that are used to predict the mid-depth of pavement temperature as a function of pavement
surface temperature, previous day’s average air temperature, depth, and time of testing. This procedure
can be used to save time and resources currently spent by ITD on traffic control and drilling holes before
FWD testing. In addition, this procedure improves the safety of ITD crew and the accuracy of mid-depth
pavement temperature at locations where no holes are drilled or can be drilled such as when TSD is used.
The use of FWD non-destructive testing is one of the primary means of determining in situ structural
capacities of existing pavements. The FWD deflection data are used to backcalculate the moduli of each
layer of the pavement system. It can be also used to estimate the remaining service life of a given
pavement and identify locations for further sampling and testing (FHWA 1998). The nondestructive testing
is quick and inexpensive, less invasive to pavements, and cause less traffic interruptions. The FWD is
designed to simulate deflection of a pavement surface caused by a fast-moving truck. It applies transient
impulse force to the pavement structure and measures the corresponding pavement deflections using a
set of velocity transducers (geophones) placed at fixed distances from the loading plate to measure the
shape of the deflection basin. Several factors affect the pavement deflections including applied load,
pavement distresses and conditions, climatic conditions (e.g., pavement temperature, subgrade moisture
variation, etc.). As the pavement temperature increases, the deflection of asphalt layers increases.
Therefore, the use of FWD deflection measurements in flexible pavement analysis and design requires the
adjustment of the deflections to a reference temperature (Lytton et. al. 1990).

Development of Pavement Temperature Prediction Model 13
The BELLS2 and BELLS3 models are the most common models used to estimate the pavement
temperature as a function of pavement surface temperature, previous day’s average air temperature,
depth, and time of testing (Lukanen et. al. 2000). The BELLS2 model was developed based on the FWD
testing protocol followed in the Long-Term Pavement Performance (LTPP) program while the BELLS3
model considers the shade effect to suit the routine FWD testing operation followed by various
transportation agencies. Both the BELLS2 and BELLS3 models have the same mathematical expression but
different calibration coefficients. Research studies showed that local calibration of the BELLS models may
be necessary to improve the accuracy of pavement temperature prediction (Fernando et. al. 2001). In
addition to the BELLS2 and BELLS3 models, researchers at Texas A&M University proposed an alternative
model that provided a 7% reduction in the Root-Mean-Square Error (RMSE) between predicted and
measured values.
Project Goal and Objectives
The FWD is used by ITD to measure the structural capacity and stiffness of pavements. The FWD testing
involves applying loads and measuring the corresponding deflections from the center of loading plate
using geophones which is referred to as deflection basin. Pavement temperature (often mid-depth) is
used to adjust the backcalculated moduli from the deflection basin. The ITD FWD crew measures the mid-
depth pavement temperature by drilling holes and filling them with mineral oil before the FWD testing.
This practice requires additional resources from ITD and extends the road closure time required for drilling
the holes. This project aims to assist the ITD crew with a procedure to eliminate the need for site
preparation prior to FWD data collection. In addition, the proposed method would improve the accuracy
of estimated mid-depth pavement temperature at locations where no holes are drilled. In addition, when
the TSD is used, drilling holes is not feasible while performing the TSD evaluations. The project has three
main objectives as follows:
• Review and select proper methods/models used for predicting mid-depth pavement temperature
using pavement surface temperature, previous day’s average air temperature, depth, and time of
testing.
• Validate and revise existing models or develop new models for predicting mid-depth pavement
temperature and develop a simple excel-based utility that can be used by ITD crew to facilitate
the calculations.
• Develop recommendations and guideline on a revised practice for measuring pavement
temperature during FWD testing.
Research Tasks
Several tasks were performed to achieve the above-mentioned research objectives. The tasks performed
in the study are described in the following section.

Development of Pavement Temperature Prediction Model 14
Task 1: Literature Review
Under this task, the research team conducted a literature review to collect pertinent information on
current practices, methods, and models used to predict mid-depth pavement temperature. These
methods include the BELLS2 and BELLS3 models as well as an alternative model developed at Texas A&M
University. In addition, the researchers reviewed the statistical analysis parameters used to evaluate the
accuracy of various prediction models. The outcome of the literature review guided the researchers to
identify proper models used to predict mid-depth pavement temperature as a function of pavement
surface temperature, previous day’s average air temperature, depth, and time of testing.
Task 2: Review ITD Measured Mid-Depth Pavement Temperature Data
Under this task, the research team reviewed the mid-depth pavement temperature data collected by the
ITD FWD crew. The mid-depth pavement temperature measurements were collected by ITD crew in 2016,
2017, 2018, and 2019 during their annual FWD testing and operations. The collected data include the
following:
• Location: highway number and mile post.
• Depth: the depth at which the temperature was measured from the surface.
• Pavement Surface temperature: the surface temperature is measured using an infrared
thermometer mounted on the FWD trailer.
• Pavement temperature at a given depth (e.g., three inches): the pavement temperature is
measured by drilling holes and filling them with mineral oil. A fluke meter is used to measure the
temperature of the mineral oil inside the holes.
• Air temperature: the previous day’s average air temperature can be obtained from the weather
records using online resources such as Weather Underground website.
• Time of measurements: the time at which the temperature was measured.
The research team reviewed the collected data provided by ITD FWD crew. In addition, the team collected
additional data at two sites on campus at the University of Idaho (U of I). It should be noted that pavement
temperature collected by ITD crew is often measured at a depth of three inches from the pavement
surface. The researchers collected temperature data at both three inches and five inches from the surface
of pavement sections at U of I.
Task 3: Validate Existing Mid-Depth Pavement Temperature Models
Under this task, the researchers analyzed the mid-depth pavement temperature data collected by ITD
FWD crew as well as the data collected at U of I. The researchers validated and calibrated the BELLS models
and an alternative model proposed by Texas A&M University. In addition, the researchers proposed and
Development of Pavement Temperature Prediction Model 15
developed two new models for Idaho. These models predict pavement temperature as a function of
pavement surface temperature pavement surface temperature, previous day’s average air temperature,
depth, and time of testing.
Task 4: Develop Excel–Based Utility
Under this task the research team developed a simple Excel-based utility that summarizes the
mathematical relationships and models that were developed under Task 3 to predict the mid-depth
pavement temperature. The inputs for this utility include the following information:
• Pavement surface temperature measured using an infrared thermometer mounted on the FWD
trailer.
• Previous day’s average air temperature obtained from climate and weather data records.
• Depth at which the temperature is needed.
• Time of testing.
The output of the software is a predicted mid-depth pavement temperature at the specified time using
two models: the calibrated BELLS2 model and Idaho 7-Term model. This Excel-based utility is simple to
use by the ITD FWD crew to predict mid-depth pavement temperature.
Task 5: Develop Recommendations on Revised Practice for Pavement Temperature
Measurement
Under this task, the research team provided recommendations based on the calibrated BELLS2 model and
proposed new Idaho models to predict mid-depth pavement temperature. Such noninvasive methods can
be used to predict pavement temperature with adequate accuracy, assist ITD FWD crew to improve their
operations, speed up the testing, improve the FWD crew’s safety, and reduce the amount of time needed
for traffic control.
Report Organization
This report documents research methodology, presents the results and analysis, summarizes the findings,
and provides recommendations. The report has four chapters and one appendix. Chapter 1 provides
background and problem statement, project goal and objectives, research tasks, and report organization.
Chapter 2 presents a review of current methods and models used to predict pavement temperature
during the FWD testing and previous studies conducted to validate these models.
Chapter 3 provides an overview of the data collection and discusses in detail the statistical analysis used
to evaluate the accuracy of various prediction models examined in this study. Based on the results, the
researchers selected and recommended the proper statistical-based models to predict pavement

Development of Pavement Temperature Prediction Model 16
temperature without the need to drill holes. In addition, it presented the developed Excel-based utility to
facilitate the pavement temperature calculations. Finally, Chapter 4 summarizes the research
methodology and findings and provides recommendations on measuring pavement temperature.
Appendix A provides all the data used in this study.

Development of Pavement Temperature Prediction Model 17
2. Literature Review
Introduction
ITD conducts FWD testing to evaluate and assess the structural capacity of pavement systems. The results
are used in overlay design to determine the proper overlay thickness and detect possible pavement failure
due to insufficient structural support (ITD Pavement Performance Report, 2015). The FWD trailer is towed
behind an ITD truck (Figure 1). It is designed to simulate deflection of a pavement surface caused by a
fast-moving truck. The FWD applies transient impulse force to the pavement structure and measures the
corresponding pavement deflections using a set of velocity transducers (geophones) placed at fixed
distances from the loading plate to measure the shape of the deflection basin (Figure 2). The force is
applied through lifting a weight to a given height and releasing it to drop on the loading plate placed on
the pavement surface. The applied force can be varied by changing the falling weight and/or the drop
height. The magnitude of the applied force and its duration have significant effect on pavement deflection
(FHWA 1998). Using the applied force, corresponding deflections, and pavement structure (e.g., number
of layer and thickness of each layer), various computational methods can be used to estimate the modulus
of each pavement layer.
Figure 1: ITD’s FWD Truck and Trailer

Development of Pavement Temperature Prediction Model 18
Figure 2. FWD Deflection Basin (Tutumluer and Sarker 2015)
The deflection basin is affected by several factors including applied load, pavement distresses and
conditions, climatic conditions (e.g., pavement temperature, subgrade moisture variation, etc.) (FHWA
1998). The deflection increases with the applied load; however, such relationship is nonlinear. Also,
shorter load pulse, simulating faster vehicle, results in smaller deflection (FHWA 1998). Pavement
deflection near distressed or cracked areas is often greater than non-distressed areas. Pavement
temperature has a significant impact on the deflection. Inge and Kim (1995) demonstrated that pavement
temperature changes with the depth of pavements and time of testing (Figure 3). The variation in
temperature decreases as the depth increases away from the surface (Inge and Kim 1995). As the
pavement temperature increases, the deflection of asphalt layers increases (Figure 4) since asphalt
binders are softer at higher temperatures. Therefore, the use of FWD deflection measurements in flexible
pavement analysis and design requires the adjustment of deflections to a reference temperature (Lytton
et al. 1990).
The current practice at ITD is to drill holes at a depth of three inches from the surface and filling it with
mineral oil before covering the hole. ITD FWD crew measures the temperature of the mineral oil inside
the hole at the time of FWD testing. Such information is used to adjust the FWD deflection measurements.
Drilling holes requires traffic control that may cause traffic delays and put the ITD crew in the line of traffic.
In addition, since these holes are drilled every three miles, temperature interpolation is often used to
estimate pavement temperature at the locations of testing between two consecutive holes which may
result in inaccurate pavement temperature predictions. Alternatively, statistical-based models such as the

Development of Pavement Temperature Prediction Model 19
BELLS2 and BELLS3 models are often used to predict pavement temperature as a function of pavement
surface temperature, previous day’s average air temperature, depth, and time of testing.
Figure 3. Temperature Change as a Function of Pavement Depth and Time of Measurement: (a) Section 20 in September; (b) Section 13 in February 7 (Inge and Kim 1995)

Development of Pavement Temperature Prediction Model 20
Figure 4. Influence of Temperature on Flexible Pavement Deflection (Johnson et al. 1990)
Temperature Prediction Models
BELLS Models
The BELLS2 and BELLS3 models are the primary models used to estimate pavement temperature without
the need for drilling holes. The BELLS2 model was developed based on the FWD testing protocol followed
in the LTPP program while the BELLS3 model considers the shade effect to suit the routine FWD testing
operations followed by various transportation agencies. The time required to complete the FWD testing
at a given location may affect the surface temperature of pavement if shaded for an extended period of
time. The shading allows the surface to cool down. The testing location was shaded for about six min. in
the LTPP testing protocol. Meanwhile, the routine FWD testing can be completed in a shorter time at a
given location. The LTPP surface temperature data were adjusted to account for the cooling effects. The
BELLS2 model (based on the LTPP testing protocol) has the same mathematical equation as the BELLS3
model (that considers the shade effect to suit the routine FWD testing operation) except the regression
coefficients are different. The values of the regression coefficients for both BELLS models are presented
in Table 1. The BELLS2 and BELLS3 models were developed using 10,304 observations. The BELLS2 model
provided an adjusted R2 of 0.977 and standard error of 1.8 °C, while the BELLS3 model provided adjusted
R2 of 0.975 and standard error of 1.9 °C. The equation of BELLS Models is as follows:
… … … Eqn. 1
where,
Td = pavement temperature at depth d, °C
IR = pavement surface temperature measured using an infrared gauge, °C
Td = β0 + β1 IR + [log (d) - 1.25] [β2IR + β3T(1−day ) + β4 sin (hr18 - 15.5)] + β5IR sin (hr18 - 13.5)
Development of Pavement Temperature Prediction Model 21
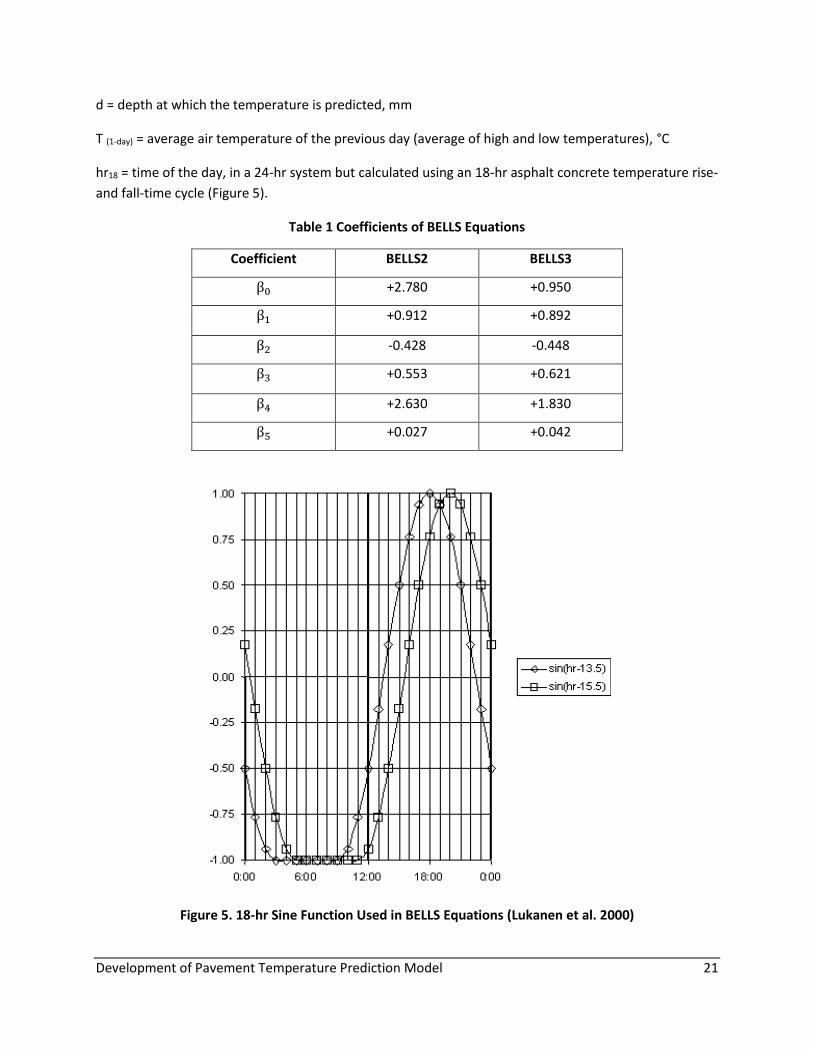
d = depth at which the temperature is predicted, mm
T (1-day) = average air temperature of the previous day (average of high and low temperatures), °C
hr18 = time of the day, in a 24-hr system but calculated using an 18-hr asphalt concrete temperature rise-
and fall-time cycle (Figure 5).
Table 1 Coefficients of BELLS Equations
Coefficient BELLS2 BELLS3
β0 +2.780 +0.950
β1 +0.912 +0.892
β2 -0.428 -0.448
β3 +0.553 +0.621
β4 +2.630 +1.830
β5 +0.027 +0.042
Figure 5. 18-hr Sine Function Used in BELLS Equations (Lukanen et al. 2000)
Development of Pavement Temperature Prediction Model 22
Alternative (Texas A&M) Prediction Model
The Texas Department of Transportation (TxDOT) uses the FWD to evaluate the structural capacity of
pavements. They use MODULUS program to estimate of pavement layer moduli and use the modulus
values in other applications (e.g., pavement design, loading analysis) (Fernando et al. 2001). The
backcalculated moduli are corrected or adjusted at reference conditions (e.g., temperature and loading
frequency). TxDOT recommends recoding the pavement temperature at the beginning and end of FWD
survey and interpolation is used to estimate the temperature at stations between the start and end
locations (Fernando et. al 2001). Since measuring the pavement temperature at every station is not
feasible, Fernando et al. (2001) conducted a study to evaluate the BELLS equations and developed an
alternative equation that can be used to estimate pavement temperature without the need to drill holes
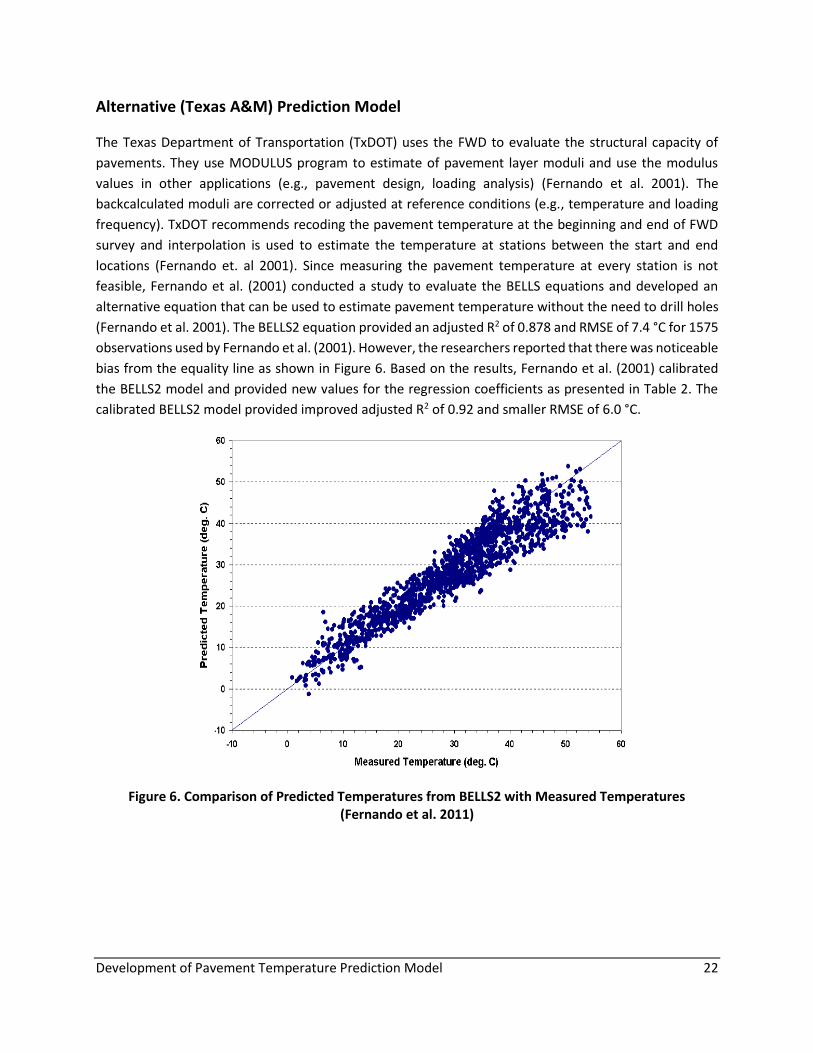
(Fernando et al. 2001). The BELLS2 equation provided an adjusted R2 of 0.878 and RMSE of 7.4 °C for 1575
observations used by Fernando et al. (2001). However, the researchers reported that there was noticeable
bias from the equality line as shown in Figure 6. Based on the results, Fernando et al. (2001) calibrated
the BELLS2 model and provided new values for the regression coefficients as presented in Table 2. The
calibrated BELLS2 model provided improved adjusted R2 of 0.92 and smaller RMSE of 6.0 °C.
Figure 6. Comparison of Predicted Temperatures from BELLS2 with Measured Temperatures (Fernando et al. 2011)

Development of Pavement Temperature Prediction Model 23
Table 2. Coefficients of Calibrate BELLS Equation after Fernando et al. (2001) (Fernando et al. 2011)
Coefficient Value
β0 +1.472
β1 +1.079
β2 -0.924
β3 +0.979
β5 +0.065
Note: β4 coefficient in the original BELLS2 model was found insignificant; therefore, it was omitted from
the calibrated model
Fernando et al. (2001) also proposed an alternative model. This model is referred to as alternative Texas
model in the study herein. The alternative Texas equation considers the climatic conditions in Texas. This
model uses the same parameters used in the BELLS2 model. Equation 2 presents the proposed alternative
Texas model. Table 3 presents the values of regressions coefficients of the alternative Texas model. This
model provided an adjusted R2 of 0.93 and RMSE of 5.6 °C (Table 4). Although the adjusted R2 of the
alternative Texas model was close to the calibrated BELLS2 model (adjusted R2 = 0.92), the RMSE was
reduced by 7 percent compared to BELLS2 model (RMSE = 6.0 °C).
… … … Eqn. 2
Table 3. Coefficients of the Alternative Model for Predicting Pavement Temperature (Liao et al. 2009)
Coefficient Alternative Texas A&M model
Estimate
β0 +6.460
β1 +0.199
β2 -0.083
β3 -0.692
β4 1.875
β5 +0.059
β6 -6.784
Td = β0 + β1(IR + 2)1.5 + log10 d × {β2 (IR + 2)1.5 + β3 sin2(hr18 -15.5) + β4 sin2 (hr18 -13.5) +
β5[ T 1−𝑑𝑎𝑦 + 6)1.5} +β6 sin2(hr18 - 15.5) sin2(hr18 -13.5)

Development of Pavement Temperature Prediction Model 24
Table 4. Comparison of Predictive Accuracy of Models Evaluated by Fernando et al. (2001) (Fernando et al. 2011)
Model Adjusted R2 Root-Mean-Square Error, o C
BELLS2 0.878 7.410
Calibrated BELLS2 0.920 5.998
Alternative Texas Model 0.931 5.584
Validation of BELLS Models
Several studies have been conducted in the literature to validate and calibrate the BELLS models. Inge and
Kim (1995) demonstrated that BELLS models underpredict pavement temperatures at higher
temperatures (Figure 7) (Inge and Kim 1995). These results demonstrate that model calibration is needed
to improve the accuracy of the BELLS prediction models. Inge and Kim (1995) also proposed the inclusion
of temperature gradients as a function of the testing time along with the depth to predict pavement
temperature. Meanwhile, the number of test sections included in their study was limited.
Recently, Solatifar et al. (2018) evaluated the BELLS equation which was found to provided very good
correlation with measured pavement temperature (R2 was greater than 0.96) and it was even slightly
improved with model calibration (Figure 8) (Solatifar et al. 2018).
Figure 7. Validation of the BELLS Equation using Temperatures Measured from Pavements in North Carolina (Inge and Kim 1995)

Development of Pavement Temperature Prediction Model 25
Figure 8. Measured versus Predicted Pavement Temperature using Calibrated BELLS model (Solatifar et al. 2018)
Liao et al. (2009) collected pavement temperature data from three pavement sections and compared
predicted pavement temperature using the BELLS3 model with the measured pavement temperature at
various depths (i.e., 0.79, 1.59, 2.36, 3.15, 3.93 inches) (Figure 9). The results demonstrated that a linear
relationship between measured pavement temperature and predicted temperature using the BELLS3
model (R2 = 0.8848); however, the BELLS3 model tended to underestimate pavement temperatures at
temperatures above 40 °C. Based on the results, the researchers developed an alternative model that
provided improved correlation between measured and predicted pavement temperature (Liao et al.
2009).
Figure 9. Measured versus predicted pavement temperature using BELLS3 model (Liao et al. 2009)

Development of Pavement Temperature Prediction Model 26
3. Data Collection and Statistical Analysis
Introduction
The current practice at ITD is to drill holes and measure pavement temperature every three miles during
the FWD testing. Although such practice provides accurate pavement temperature measurements at the
location of drilled holes, interpolation is used to predict pavement temperature at the FWD testing
locations between the holes. In addition, such practice requires additional resources (traffic control and
staff time) and may put the crew in line with the traffic. The primary objective of this study was to utilize
the ITD collected data over the past few years (2016, 2017, 2018, and 2019) available to the researchers
to examine the feasibility of predicting pavement temperature using the data collected in Idaho. Most of
the ITD pavement temperature measurements were collected a depth of three inches from the surface.
A total number of 454 measurements were collected in the field. These measurements were obtained
from sites distributed over the six districts of the state of Idaho. In addition to the field data, the team
collected 142 measurements at two sites on campus at the University of Idaho at two different depths
(i.e., three inches and five inches) to complement the measurements collected by ITD crew. A total
number of 596 pavement temperature measurements were used in this study. This chapter discusses the
data collection and analysis.
ITD Data Collection
The research team carefully reviewed the mid-depth pavement temperature data collected by the ITD
FWD crew for the last four years. The ITD FWD crew collected comprehensive amount of mid-depth
pavement temperature during their annual FWD testing and operations. The collected data included
highway location, the depth at which the temperature was measured from the surface, pavement
temperature, surface temperature, air temperature, and the time and date of measurements. The
pavement temperature data were collected for four consecutive years: 2016, 2017, 2018, and 2019. The
data were in MDB formats, and the researchers processed the data and exported the MDB files created
from FWD to generate Excel tables with the needed information. Table 5 presents an example of the
processed data collected in 2016. Appendix A provides all the pavement temperature measurements used
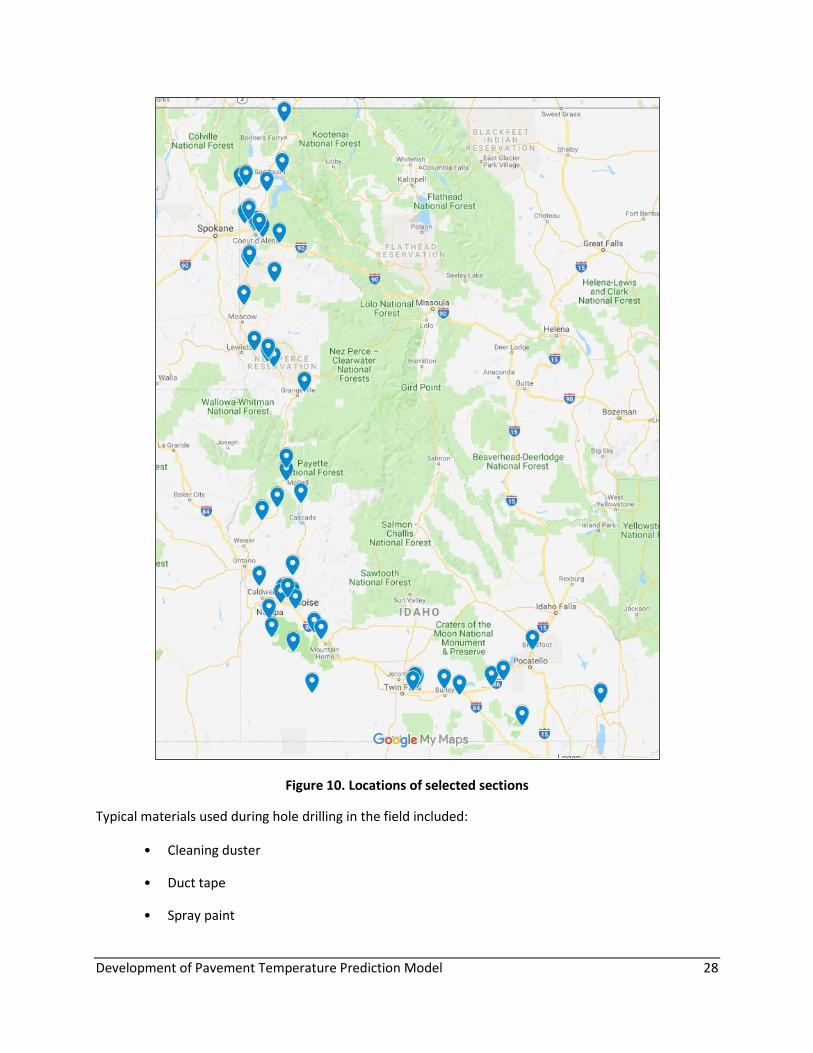
in this study. The selected sections covered all six districts, and geographic locations of these sections are
shown in Figure 10. The researchers obtained the previous day’s average air temperature from the
weather records using online resources such as Weather Underground website.

Development of Pavement Temperature Prediction Model 27
Table 5. Example of the Measured Pavement Temperature Data by ITD
Highway Station ID
Station Pavement Temp. at 3 in.
Surface Temp. (°F)
Air Temp. (°F)
Date Time
SH06 1 35.06 56.50 59.60 54.40 5/19/2016
8:48:09 AM
68 29.00 65.30 61.70 53.10 5/19/2016 10:54:25
AM
SH-41
1 37.34 53.10 53.50 50.30 5/11/2016 8:00:05
AM
61 32.00 61.60 64.50 57.90 5/11/2016 9:45:16
AM
159 23.00 77.90 82.70 74.40 5/11/2016 12:46:32
PM
192 20.00 82.50 83.50 74.50 5/11/2016 1:41:33
PM
SH-53
1 9.67 55.10 50.60 47.60 5/12/2016 5:26:08
AM
27 12.00 53.80 48.00 43.70 5/12/2016 6:04:45
AM
50 14.00 57.50 49.60 45.90 5/12/2016 6:38:01
AM
US-02-A0009
1 9.70 89.30 84.20 70.10 5/10/2016 2:30:23
PM
27 12.00 95.80 92.10 78.50 5/10/2016 3:20:16
PM
60 15.00 74.00 64.90 54.10 5/10/2016 5:18:14
PM
104 19.00 79.70 72.20 64.80 5/10/2016 7:38:58
PM
US-02-D0020
1 19.01 52.80 50.50 45.10 5/10/2016 7:29:07
AM
25 17.00 56.20 55.00 49.90 5/10/2016 9:01:13
AM
57 14.00 73.50 73.60 59.20 5/10/2016 10:45:33
AM
90 11.00 72.80 80.60 69.20 5/10/2016 12:24:53
PM
104 9.70 89.50 89.80 73.90 5/10/2016 1:08:03
PM
US-95-A0393
1 393.80 71.70 84.40 78.50 5/18/2016 11:02:15
AM
34 397.00 81.30 82.90 77.30 5/18/2016 11:55:27
AM
45 398.00 74.00 84.20 79.80 5/18/2016 12:09:56
PM
US-95-A0429 1 429.03 77.00 68.60 66.50 7/26/2016
5:43:30 AM
17 430.60 77.30 70.10 67.40 7/26/2016 6:10:10
AM
Development of Pavement Temperature Prediction Model 28
Figure 10. Locations of selected sections
Typical materials used during hole drilling in the field included:
• Cleaning duster
• Duct tape
• Spray paint

Development of Pavement Temperature Prediction Model 29
• Mineral oil
• Hammer drill with and a 0.5-inch drill bit
• Fluke Meter
• Caulk Gun
• Blacktop repair (Siliconized acrylic latex for flexible, durable seal)
The process of hole drilling included the following steps:
• Use the spray paint to mark the measurement location.
• Drill a hole using a 0.5-drill bit.
• Clean out the hole using the cleaning duster and clean around the hole.
• Pour in the mineral oil in the hole all the way to the top.
• Cover the hole with duct tape and spray a circle around the temp hole to mark it.
• Before the FWD testing, peel back tape and insert the fluke meter wire to gather the
temperature. Wait for the temperature to stabilize before recording.
• Mark down the temperature and put it in the system.
• When the temperature hole is no longer needed, fill the hole with the blacktop repair using
the caulk gun.
Figure 11 shows the items used in measuring pavement temperature in the field.

Development of Pavement Temperature Prediction Model 30
Figure 11. Items and materials used in Measuring Pavement Temperature in the Field
Data Collection on Campus
A similar procedure was followed to collect additional pavement temperature data on campus at the
University of Idaho. The temperature data were collected at two sites at different depths (i.e., three inches
and five inches from the surface). Two holes were drilled at each site. Since most of the ITD pavement
temperature data were collected at three inches from the surface, which is the practice at ITD, the
researchers collected pavement temperatures at various depths (i.e., three and five inches) since the
depth in an important parameter in the prediction models. Figure 12 shows the location of the two sites
(i.e., Site A and Site B) on campus.
The following data were obtained at the sites of U of I:
• Pavement surface temperature recorded by an infrared thermometer.
• Pavement temperature at three inches and five inches from the surface recorded using a
fluke meter.
• Previous day’s average air temperature obtained from the “Weather Underground” website.
• Time and date of pavement temperature measurements.

Development of Pavement Temperature Prediction Model 31
Figure 12. Location of Test Sites at U of I
Statistical Analysis of Pavement Temperature Data
The researchers used statistical software SAS and R to conduct the statistical analysis and model
development and calibration in this study (SAS 2013; R Core Team 2013). Based on the literature review,
the BELLS models (i.e., BELLS2 and BELLS3) are commonly used to estimate the pavement temperature as
a function of pavement surface temperature, depth, average air temperature of the previous day of
testing, and time of testing. Both BELLS2 and BELLS3 have the same mathematical expression (Equation
1) but different calibration coefficients (Table 1). Research studies showed that local calibration of BELLS
model may be necessary to improve its prediction accuracy (Fernando et al. 2001). In addition, the
researchers at Texas A&M University proposed an alternative model (i.e., alternative Texas model), which
provided 7% reduction in RMSE between predicted and measured values (Fernando et al. 2001).
In addition to the above-mentioned pavement temperature prediction models, the researchers explored
new alternative models to improve accuracy of pavement temperature prediction compared to existing
models. Seven cases were considered for evaluating and selecting proper prediction models that suit
Idaho conditions. These seven cases are as follows:
• Case 1: BELLS2 model with the national coefficient estimates
• Case 2: BELLS3 model with the national coefficient estimates
Development of Pavement Temperature Prediction Model 32
• Case 3: Calibrated BELLS2 model with calibrated (Idaho) coefficient estimates
• Case 4: Alternative Texas model with Texas coefficient estimates
• Case 5: Calibrated Alternative Texas model with calibrated (Idaho) coefficient estimates
• Case 6: Idaho First Order Model
• Case 7: Idaho 7-Term Model
The statistical analysis of these cases and models are discussed in detail the following section.
BELLS2 Model
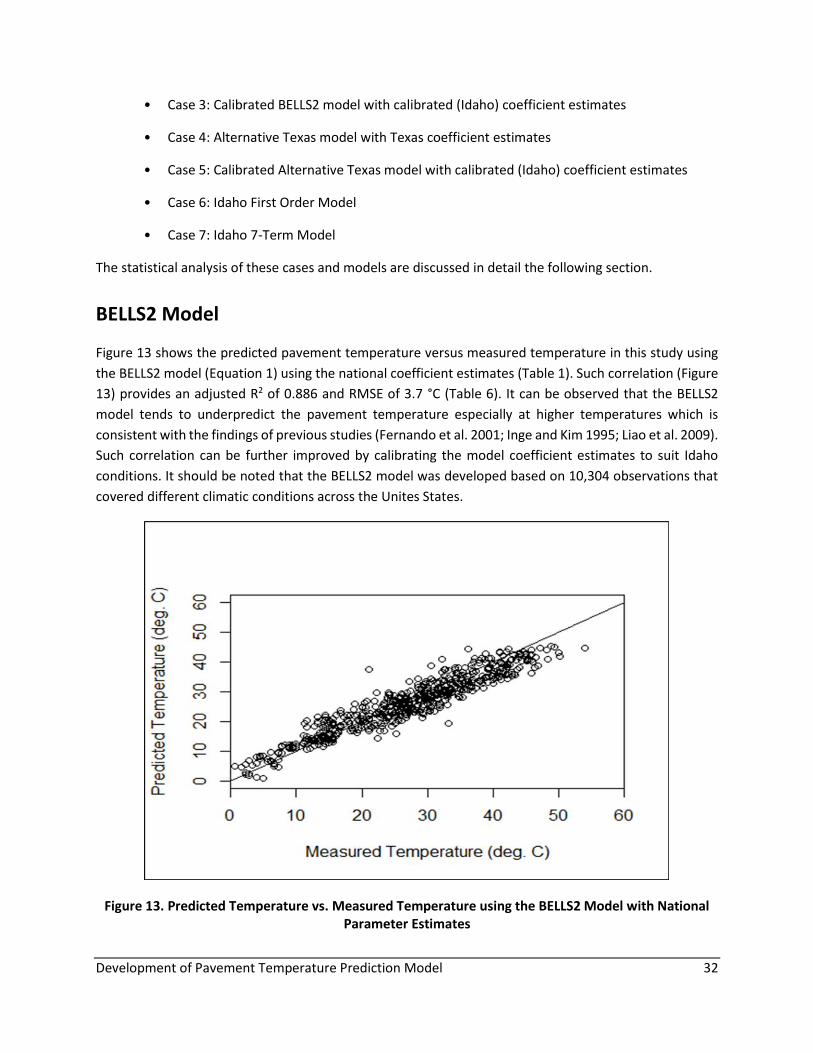
Figure 13 shows the predicted pavement temperature versus measured temperature in this study using
the BELLS2 model (Equation 1) using the national coefficient estimates (Table 1). Such correlation (Figure
13) provides an adjusted R2 of 0.886 and RMSE of 3.7 °C (Table 6). It can be observed that the BELLS2
model tends to underpredict the pavement temperature especially at higher temperatures which is
consistent with the findings of previous studies (Fernando et al. 2001; Inge and Kim 1995; Liao et al. 2009).
Such correlation can be further improved by calibrating the model coefficient estimates to suit Idaho
conditions. It should be noted that the BELLS2 model was developed based on 10,304 observations that
covered different climatic conditions across the Unites States.
Figure 13. Predicted Temperature vs. Measured Temperature using the BELLS2 Model with National Parameter Estimates

Development of Pavement Temperature Prediction Model 33
Table 6. Statistical Analysis of BELLS2 Model using National Parameter Estimates
N Standard error of
residuals
R2 Adjusted R2
Root-mean-
square error
596 3.729 0.887 0.886 3.73
BELLS3 Model
Similarly, Figure 14 shows the predicted pavement temperature versus measured temperature in this
study using the BELLS3 model (Equation 1) using the national coefficient estimates (Table 1). Such
comparison provides an adjusted R2 of 0.834 and RMSE of 4.5 °C (Table 7). The BELLS3 model provided
slightly lower R2 and higher RMSE compared to the BELLS2 model, which means that the BELLS2 model
provided slightly better pavement temperature prediction when compared to the BELLS3 model.
Figure 14. Predicted Temperature vs. Measured Temperature using the BELLS3 Model with National Parameter Estimates

Development of Pavement Temperature Prediction Model 34
Table 7. Statistical Analysis of BELLS3 Model using National Parameter Estimates
N Standard error of
residuals
R2 Adjusted R2
Root-mean-
square error
596 4.503 0.835 0.834 4.503
Calibrated BELLS2 Model
The researchers calibrated the BELLS2 model by calculating the model coefficient estimates to suit Idaho
conditions. It should be noted that the BELLS2 and BELLS3 model have the same mathematical expression
(Equation 1) but different coefficient estimates (Table 1). Researchers used statistical software SAS and R
to calibrate the coefficients of the BELLS2 model (SAS 2013; R Core Team 2013). The significance of model
parameters or independent variables (i.e., β0, β1, β2, β3, β4, and β5) was examined using the t-test. The t-
test is used to determine whether the null hypothesis (no significant effect of a model parameter) should
be supported or rejected. The model parameter is significant if the associated p-value is less than 0.05.
The significance of model parameters increases as the p-value decreases. Table 8 summarizes the
statistical analysis and p-value for the calibrated BELLS2 model. The results demonstrate that all model
coefficients (i.e., β0, β1, β2, β3, β4, and β5) are significant. Meanwhile, β4 coefficient was less significant
when compared to the other model coefficients.
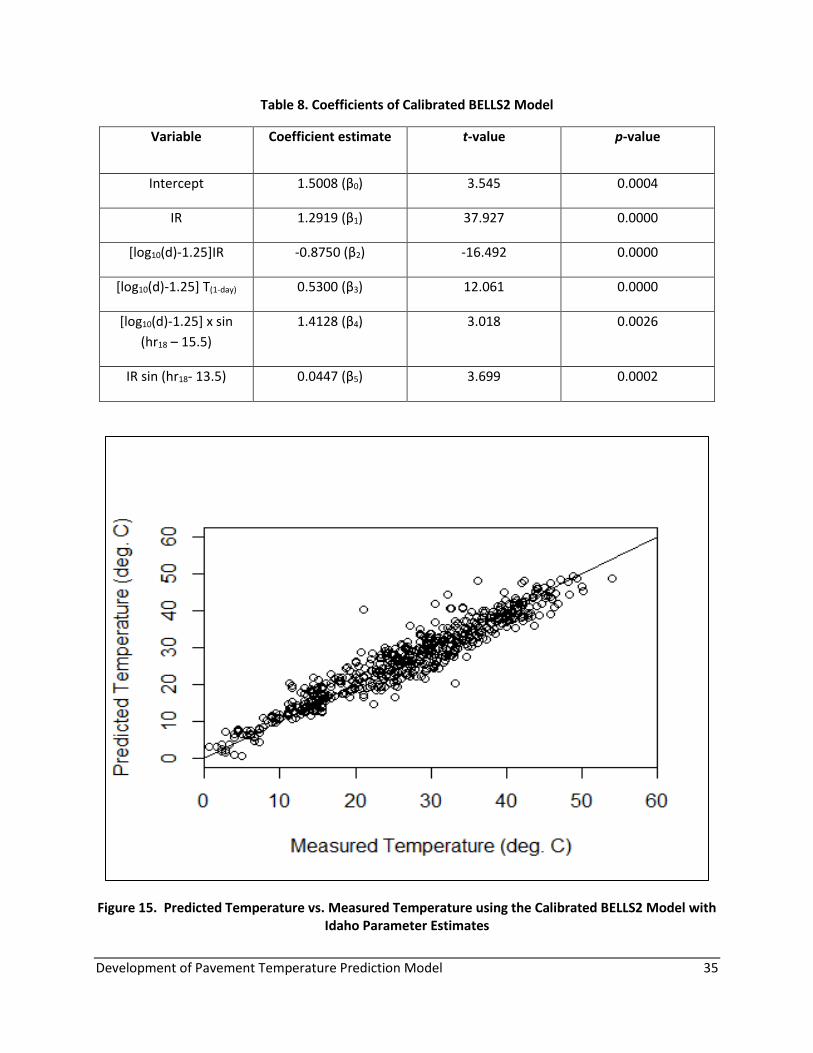
Figure 15 shows the predicted pavement temperature using the calibrated BELLS2 model versus the
measured temperatures. Such model provided improved adjusted R2 of 0.913 and reduced RMSE of 3.3
°C (Table 9) compared to R2 of 0.886 and RMSE of 3.7 °C for the BELLS2 model before calibration. These
results show that the calibration process improved the accuracy of the BELLS2 model and reduced the
RMSE by 12.5%. In addition, such calibration reduced the bias in the model prediction (i.e., improved the
predicted pavement temperature at higher temperatures). It should be noted that the calibration of the
BELLS3 model would provide the same results as the calibrated BELLS2 model since both the BELLS2 and
BELLS3 models have the same equation but different model coefficients.
Development of Pavement Temperature Prediction Model 35
Table 8. Coefficients of Calibrated BELLS2 Model
Variable Coefficient estimate t-value p-value
Intercept 1.5008 (β0) 3.545 0.0004
IR 1.2919 (β1) 37.927 0.0000
[log10(d)-1.25]IR -0.8750 (β2) -16.492 0.0000
[log10(d)-1.25] T(1-day) 0.5300 (β3) 12.061 0.0000
[log10(d)-1.25] x sin
(hr18 – 15.5)
1.4128 (β4) 3.018 0.0026
IR sin (hr18- 13.5) 0.0447 (β5) 3.699 0.0002
Figure 15. Predicted Temperature vs. Measured Temperature using the Calibrated BELLS2 Model with Idaho Parameter Estimates
Development of Pavement Temperature Prediction Model 36
Table 9. Statistical Analysis of Calibrated BELLS2 Model using Idaho Parameter Estimates
N Standard error of
residuals
R2 Adjusted R2
Root-mean-
square error
596 3.264 0.914 0.913 3.265
Alternative Texas Model
In addition to the BELLS models, the researchers evaluated an alternative model proposed by Fernando
et al. (2001) which is referred to as alternative Texas model in this study. The equation for this model is
presented in Equation 2 and the coefficient of the model is presented in Table 3. Figure 16 shows the
predicted versus the measured pavement temperature using the alternative Texas model and the model
coefficients proposed by Fernando et al. (2001) previously presented in Table 3. An adjusted R2 of 0.796
and RMSE of 5.0 °C were obtained for the correlation between measured versus predicted pavement
temperature using the alternative Texas model (Table 10). It should be noted that this model was
developed based on the pavement temperature data obtained from various sites in Texas to suit the
climatic conditions in Texas. Therefore, the researchers attempted to improve accuracy of the alternative
Texas model through calibrating the coefficients of the model to suit the conditions in Idaho.
Table 11 shows the alternative Texas model coefficients after calibration. The calibrated model provided
improved correlation between measured and predicted pavement temperature and reduced bias (Figure
13). The adjusted R2 was improved from 0.796 to 0.90 and RMSE was reduced from 5.0 °C to 3.5 °C using
the calibrated model (Table 12). However, two parameters (i.e., β4 and β6) were found to be insignificant
in the alternative Texas model where the p-values are greater than 0.05 (Table 11). Comparing the
calibrated alternative Texas model to the calibrated BELLS2 model, the latter has higher adjusted R2
(0.913) and lower RMSE (3.3 °C) compared to adjusted R2 (0.90) and RMSE (3.5 °C) of the former. These
results demonstrate that the calibrated BELLS2 model provided more accurate prediction when compared
to the calibrated Texas model.
The researchers also examined further improvements to the prediction of pavement temperature by
developing new statistical-based models using the data collected and distributed over the state of Idaho.
Two new models were developed and proposed: the Idaho First Order model and Idaho 7-Term model.
These two models are discussed in detail in the following section.

Development of Pavement Temperature Prediction Model 37
Figure 16. Predicted Temperature vs. Measured Temperature using Alternative Texas Model with Texas Parameter Estimates
Table 10. Statistical Analysis of Alternative Texas Model using Texas Parameter Estimates
N Standard error of
residuals
R2 Adjusted R2
Root-mean-
square error
596 4.993 0.798 0.796 4.993

Development of Pavement Temperature Prediction Model 38
Table 11. Coefficients of Calibrated Alternative Texas Model for Predicting Pavement Temperature
Calibration Coefficients Estimate t-value p-value
β0 7.2397 10.377 0.0000
β1 0.2796 19.073 0.0000
β2 -0.1027 -13.834 0.0000
β3 -1.1464 -2.554 0.0109
β4 0.7471 1.732 0.0838
β5 0.0306 13.503 0.0000
β6 -2.4508 -1.837 0.0668

Development of Pavement Temperature Prediction Model 39
Figure 17. Predicted Temperature vs. Measured Temperature using Alternative Texas Model with ID parameter estimates and ID data
Table 12. Statistical Analysis of Calibrated Alternative Texas Model using Idaho Parameter Estimates
N Standard error of
residuals
R2 Adjusted R2
Root-mean-
square error
596 3.504 0.9 0.9 3.504
Idaho First Order Model
The researchers used the pavement temperature data collected in this study and developed a new model
as presented in Equation 3. This model is referred to as Idaho First Order model. Table 13 summarizes the
coefficients of the model and estimate and p-value of each parameter. The results showed that all the
model parameters were significant (i.e., p-value < 0.05). Good correlation between the measured and
predicted pavement temperature was obtained as shown in Figure 20. The model provided adjusted R2 of

Development of Pavement Temperature Prediction Model 40
0.906 and RMSE of 3.4 °C (Table 14). The Idaho First Order model is a simple equation compared to other
models, meanwhile the calibrated BELLS2 model provided slightly better adjusted R2 of 0.913 and RMSE
of 3.3 °C when compared to the Idaho First Order model.
… … … Eqn. 3
where,
Td = pavement temperature at depth d, °C
IR = pavement surface temperature measured using an infrared gauge, °C
d = depth at which the temperature is predicted, mm
T (1-day) = average air temperature of previous day (average of high and low temperatures), °C
hr18 = time of the day, in a 24-hr system but calculated using an 18-hr asphalt concrete temperature rise-
and fall-time cycle (Figure 5).
Table 13. Coefficients of Idaho First Order Model
Variable Coefficient Coefficient
Estimate
t-value p-value
Intercept β0 30.6716 10.605 0.0000
IR β1 0.7488 37.022 0.0000
log10(d) β2 -14.6048 -9.982 0.0000
T(1-day) β3 0.2612 7.630 0.0000
sin (hr18 – 13.5) β4 -1.4134 -2.598 0.0096
sin (hr18- 15.5) β5 3.3316 6.065 0.0000
Td = β0+ β1 IR + β2 log10 d + β3 T(1 day) + β4 sin(hr18 - 13.5 + β5 sin(hr18 - 15.5)

Development of Pavement Temperature Prediction Model 41
Figure 18. Predicted Temperature vs. Measured Temperature using the Idaho First Order Model
Table 14. Statistical Analysis of Idaho First Order Model
N Standard error of
residuals R2 Adjusted R2
Root-mean-
square error
596 3.382 0.907 0.906 3.382
Idaho 7-Term Model
The researchers developed another model that utilizes the pavement temperature collected across the
state. This term has seven terms in addition to the intercept (Equation 4) so it is referred to as the Idaho
7-Term model. Table 15 presents the model parameters, estimate of each parameter, and p-value to
assess the significance of each parameter. The results demonstrate that all the model parameters are
significant (p-value < 0.05). This model provides very good correlation between measured pavement
temperatures and predicted ones as shown in Figure 19. This model provides the highest adjusted R2 of
0.919 and lowest RMSE of 3.2 °C when compared to all other models examined in this study (Table 16 and
Table 17).

Development of Pavement Temperature Prediction Model 42
… … … Eqn. 4 where,
Td = pavement temperature at depth d, °C
IR = pavement surface temperature measured using an infrared gauge, °C
d = depth at which the temperature is predicted, mm
T (1-day) = average air temperature of previous day (average of high and low temperatures), °C
hr18 = time of the day, in a 24-hr system but calculated using an 18-hr asphalt concrete temperature rise-
and fall-time cycle (Figure 5).
Table 15. Coefficients of the Idaho 7-Term Model
Variable Coefficient Coefficient
estimate
t-value p-value
Intercept β0 1.7569 4.246 0.0000
IR β1 2.6607 9.348 0.0000
T(1 day) β2 -1.1392 -2.350 0.0191
sin(hr18 - 13.5) β3 -3.9043 -6.499 0.0000
sin(hr18 - 15.5) β4 3.6932 7.137 0.0000
IR log10(d) β5 -0.9829 -6.743 0.0000
IR sin(hr18 - 13.5) β6 0.0901 6.305 0.0000
log10(d) T(1 day) β7 0.7303 2.911 0.0038
Td = β0 + β1 IR + β2T(1 day) + β3 sin (hr18 - 13.5) + β4 sin (hr18 - 15.5) + β5 IR log10(d) +
β6 IR sin (hr18 - 13.5) + β7 log10(d) T(1 day)

Development of Pavement Temperature Prediction Model 43
Figure 19. Predicted Temperature vs. Measured Temperature using the Idaho 7-Term Model
Table 16. Statistical Analysis of the Idaho 7-Term Model
N Standard error of
residuals
R2 Adjusted R2
Root-mean-
square error
596 3.154 0.92 0.919 3.154
Summary of Prediction Models
The researchers examined seven models to obtain pavement temperature predictions with good
accuracy and low bias. These seven cases included:
• Case 1: BELLS2 model with the national coefficient estimates
• Case 2: BELLS3 model with the national coefficient estimates

Development of Pavement Temperature Prediction Model 44
• Case 3: Calibrated BELLS2 model with calibrated (Idaho) coefficient estimates
• Case 4: Alternative Texas model with Texas coefficient estimates
• Case 5: Calibrated Alternative Texas model with calibrated (Idaho) coefficient estimates
• Case 6: Idaho First Order Model
• Case 7: Idaho 7-Term Model
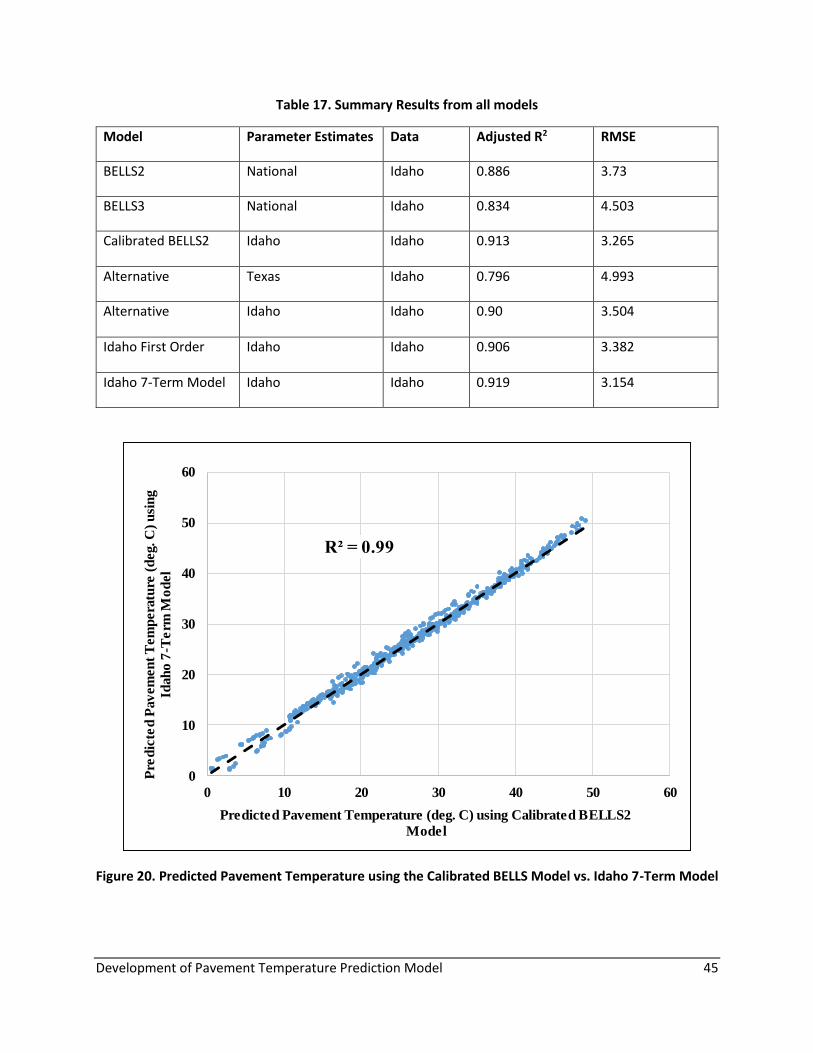
Table 17 summarizes the adjusted R2 and RMSE for all cases evaluated in this study. The results
demonstrate that the calibrated BELLS2 model and Idaho 7-Term model provide higher R2 and lower RMSE
compared to other models evaluated in this study. The Idaho 7-Term model provides the highest R2
(0.919) and lowest RMSE (3.2 °C); therefore, it recommended in this study. However, the calibrated
BELLS2 model still provides good adjusted R2 of 0.913 and low RMSE of 3.3 °C. The original BELLS2 model
was developed based on a larger data set (over 10,000 observations) compared to the Idaho 7-Term
model (total of 596 data points); therefore, both models are recommended and used in the Excel-based
utility developed in this study to assist in ITD engineers in predicting pavement temperature as discussed
in the following section. The data used in the development of Idaho 7-Term model were collected in Idaho,
while the observations used in the development of BELLS2 model were collected across the US. The
calibrated BELLS2 model, recommended in this study, used the data collected in Idaho to estimate the
model coefficients to improve model prediction and reduce the bias. Both models (i.e., the Idaho 7-Term
model and the calibrated BELLS2 model) are highly correlated (R2 of 0.99) as shown in Figure 20.
The statistical analysis clearly demonstrated that pavement temperature can be predicted with
reasonable accuracy without the need of hole drilling. Pavement temperature can be predicted by
measuring pavement surface temperature, previous day’s average air temperature, time of testing, and
depth at which pavement temperature is needed. ITD measures pavement surface temperature during
the routine FWD or TSD testing using infrared sensors mounted on the FWD or TSD trailers. Previous day’s
average temperature can be obtained from the weather records using online resources such as Weather
Underground website where the user enters the geographic location of the site and select the date. ITD
can use the recommended models to predict pavement temperature without the need to drill holes and
employ temperature interpolations to correct the backcalculated moduli in case of FWD testing. Also, the
recommended models can be used to estimate pavement temperature needed to correct the TSD
deflection measurements. The use of these models will also greatly improve the accuracy of pavement
evaluation and assessment processes using FWD and TSD that require pavement temperature corrections.
Development of Pavement Temperature Prediction Model 45
Table 17. Summary Results from all models
Model Parameter Estimates Data Adjusted R2 RMSE
BELLS2 National Idaho 0.886 3.73
BELLS3 National Idaho 0.834 4.503
Calibrated BELLS2 Idaho Idaho 0.913 3.265
Alternative Texas Idaho 0.796 4.993
Alternative Idaho Idaho 0.90 3.504
Idaho First Order Idaho Idaho 0.906 3.382
Idaho 7-Term Model Idaho Idaho 0.919 3.154
Figure 20. Predicted Pavement Temperature using the Calibrated BELLS Model vs. Idaho 7-Term Model
0
10
20
30
40
50
60
0 10 20 30 40 50 60
Pre
dic
ted
Pav
em
en
t T
em
pera
ture
(d
eg. C
) u
sin
g
Idah
o 7
-Te
rm M
od
el
Predicted Pavement Temperature (deg. C) using Calibrated BELLS2
Model
Development of Pavement Temperature Prediction Model 46
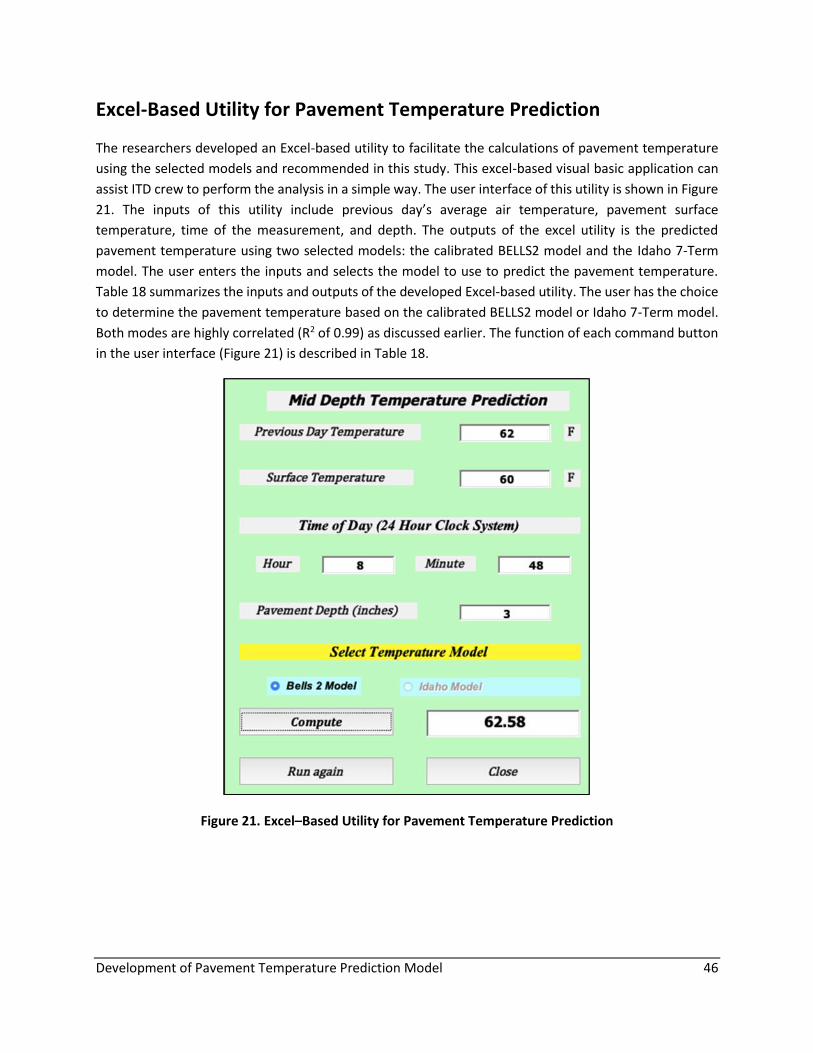
Excel-Based Utility for Pavement Temperature Prediction
The researchers developed an Excel-based utility to facilitate the calculations of pavement temperature
using the selected models and recommended in this study. This excel-based visual basic application can
assist ITD crew to perform the analysis in a simple way. The user interface of this utility is shown in Figure
21. The inputs of this utility include previous day’s average air temperature, pavement surface
temperature, time of the measurement, and depth. The outputs of the excel utility is the predicted
pavement temperature using two selected models: the calibrated BELLS2 model and the Idaho 7-Term
model. The user enters the inputs and selects the model to use to predict the pavement temperature.
Table 18 summarizes the inputs and outputs of the developed Excel-based utility. The user has the choice
to determine the pavement temperature based on the calibrated BELLS2 model or Idaho 7-Term model.
Both modes are highly correlated (R2 of 0.99) as discussed earlier. The function of each command button
in the user interface (Figure 21) is described in Table 18.
Figure 21. Excel–Based Utility for Pavement Temperature Prediction
Development of Pavement Temperature Prediction Model 47
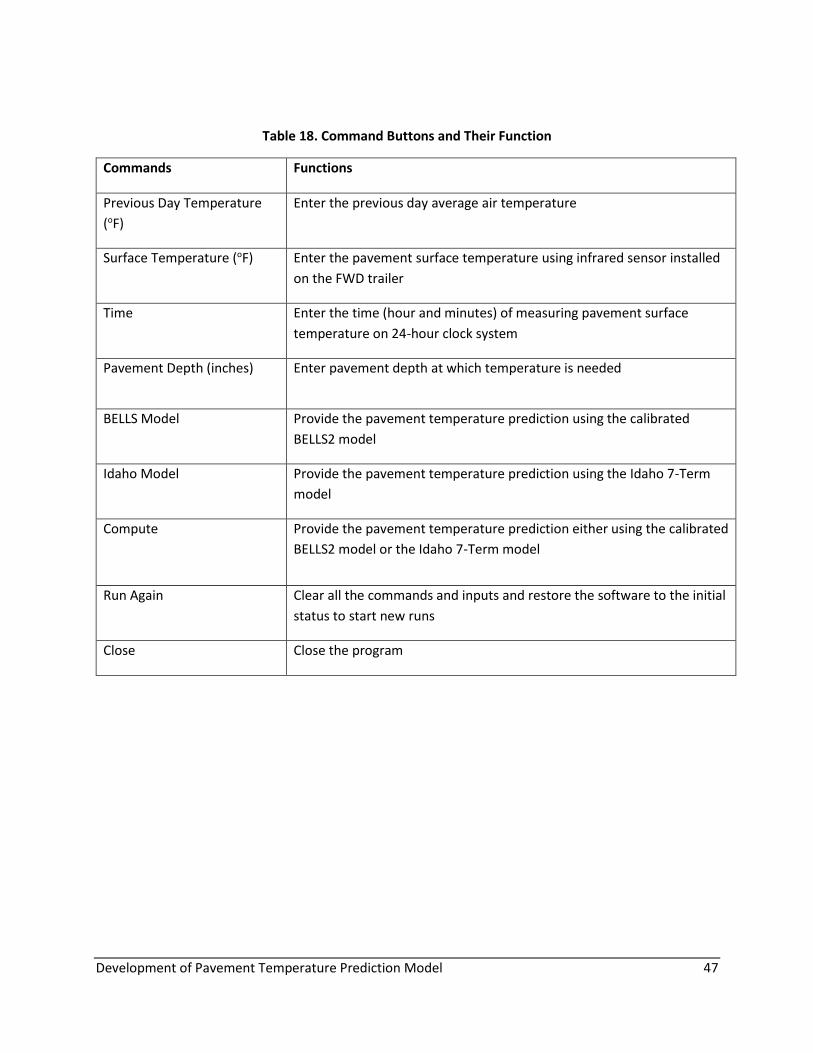
Table 18. Command Buttons and Their Function
Commands Functions
Previous Day Temperature
(oF)
Enter the previous day average air temperature
Surface Temperature (oF) Enter the pavement surface temperature using infrared sensor installed
on the FWD trailer
Time Enter the time (hour and minutes) of measuring pavement surface
temperature on 24-hour clock system
Pavement Depth (inches) Enter pavement depth at which temperature is needed
BELLS Model Provide the pavement temperature prediction using the calibrated
BELLS2 model
Idaho Model Provide the pavement temperature prediction using the Idaho 7-Term
model
Compute Provide the pavement temperature prediction either using the calibrated
BELLS2 model or the Idaho 7-Term model
Run Again Clear all the commands and inputs and restore the software to the initial
status to start new runs
Close Close the program

Development of Pavement Temperature Prediction Model 48
4. Conclusions and Recommendations
Currently ITD measures the pavement temperature during FWD testing by drilling holes every three-mile
interval. Although this practice provides an accurate pavement temperature at the locations of drilled
holes, it requires additional resources (e.g., traffic control and staff time), causes traffic delays, and may
put the crew in line with traffic. In addition, pavement temperature interpolation is used to estimate the
temperature at locations between two consecutive holes since there are drilled every three miles.
Pavement temperature interpolation may not always provide accurate measurements. Furthermore, ITD
recently adapted the use of TSD in evaluating the structural conditions of pavements. TSD measures
pavement deflection at highway speed and drilling holes is not feasible while performing the TSD
evaluations. Alternatively, pavement temperature can be estimated using prediction models.
The study herein was initiated to examine the feasibility of predicting pavement temperature using data
collected in Idaho. The pavement temperature data were collected by ITD FWD crew during their FWD
testing. The data were collected in 2016, 2017, 2018, and 2019 in the six districts of the state. Most of
pavement temperatures were measured at three inches from the surface (the current practice at ITD). An
infrared thermometer is mounted on the FWD trailer to measure the pavement surface temperature
during testing. In addition, the location of the measurements was also documented. The location was
used to determine the previous day’s average air temperature from the weather records using online
resources such as Weather Underground website. A total number of 454 measurements were collected
in the field. The team also collected additional 142 measurements at two sites on campus at the University
of Idaho at two different depths (i.e., three inches and five inches). A total number of 596 observations or
pavement temperature were used in the model development and calibration in this study.
The researchers evaluated seven cases to obtain a pavement temperature prediction model with good
accuracy and low bias. These seven cases included:
• Case 1: BELLS2 model with the national coefficient estimates
• Case 2: BELLS3 model with the national coefficient estimates
• Case 3: Calibrated BELLS2 model with calibrated (Idaho) coefficient estimates
• Case 4: Alternative Texas model with Texas coefficient estimates
• Case 5: Calibrated Alternative Texas model with calibrated (Idaho) coefficient estimates
• Case 6: Idaho First Order Model
• Case 7: Idaho 7-Term Model
The results revealed that the calibrated BELLS2 model and Idaho 7-Term model provide the highest R2 and
lowest RMSE. An adjusted R2 of 0.913 was obtained for the calibrated BELLS2 model and 0.919 for the
Idaho 7-Term model, while RMSE of 3.3 °C was associated with the calibrated BELLS2 model and 3.2 °C for

Development of Pavement Temperature Prediction Model 49
the Idaho 7-Term model. Both models (i.e., the Idaho 7-Term model and the calibrated BELLS2 model) are
highly correlated (R2 of 0.99). It should be noted that BELLS2 model was originally developed using over
10,000 observations and the measurements used in this study (596 observations) were used to calibrate
the model and provide the calibrated BELLS2 model. Whereas Idaho 7-Term model was developed based
on the data collected in Idaho (596 observations). The Idaho 7-Term model provided comparable R2 to
that of the calibrated BELLS2 model but a slightly lower RMSE.
The results of this study demonstrated the feasibility of predicting pavement temperature as a function
of pavement surface temperature, previous day’s average air temperature, depth, and time of testing.
The results also demonstrated the need to calibrate the BELLS models for improved accuracy and reduce
bias. The adjusted R2 of the BELLS2 model improved from 0.886 to 0.913 and RMSE was reduced from 3.7
°C to 3.3 °C after calibration. Based on the statistical analysis, the researchers selected and recommended
two models: the calibrated BELLS2 model and Idaho 7-Term model for predicting pavement temperature.
Both models can predict pavement temperature with good accuracy and low bias. These models are
calibrated and developed based on the data collected in Idaho. ITD can utilize the prediction models to
estimate pavement temperature without the need to drill holes, which saves time and resources and
improves the safety of the ITD FWD crew in the field.

Development of Pavement Temperature Prediction Model 50
5. References
Federal Highway Administration (FHWA). 1998. Techniques for Pavement Rehabilitation. FHWA-NHI-
131008.
National Cooperative Highway Research Program (NCHRP). 1990. Determining Asphaltic Concrete
Pavement Structural Properties by Nondestructive Testing. Lytton, Robert L., F. P. Germann, Eddie Y.
J. Chou, and Shelley Stoffels. NCHRP Report No. 327, Texas Transportation Institute, Texas A&M
University System, College Station, TX.
Federal Highway Administration (FHWA). 2000. Temperature Predictions and Adjustment Factors for
Asphalt Pavement. Lukanen, Erland O., Richard N. Stubstad, and Robert Briggs. FHWA-RD-98-085.
Federal Highway Administration (FHWA). 2001. Development of a Procedure for Temperature Correction
of Backcalculated AC Modulus. Fernando, Emmanuel G., Wenting Liu, and Duchwan Ryu. FHWA/TX-
02/1863-1, Texas Transportation Institute, Texas A&M University System, College Station, TX.
Idaho Transportation Department. 2015. Idaho Transportation System Pavement Performance Report.
Idaho Transportation Department, Boise, Idaho.
United States Department of Transportation (USDOT). 2015. Development of Improved Pavement
Rehabilitation Procedures Based on FWD Backcalculation. Tutumluer, Erol, and Priyanka Sarker.
USDOT Region V Regional University Transportation Center Final Report, NEXTRANS Project No.
094IY04, University of Illinois at Urbana-Champaign, IL.
Inge Jr, Earl H., and Richard Kim. 1995. “Prediction of Effective Asphalt Layer Temperature.”
Transportation Research Record ,1473: 93-100.
Illinois Department of Transportation. 1990. Johnson, Kurt D., Elias H. Rmeili, and Michael I. Darter.
Development of Maintenance and Rehabilitation Strategies—Northern Illinois Toll Highway, East-
West Tollway Extension. Phase II Final Report, Illinois State Toll Highway Authority.
Solatifar, Nader, Mojtaba Abbasghorbani, Amir Kavussi, and Henrikas Sivilevičius. 2018. “Prediction of
Depth Temperature of Asphalt layers in Hot Climate Areas.” Journal of Civil Engineering and
management, 24(7): 516-525.
Liao, Chi-Chou, Bo-Ruei Chen, Shun-Hsing Chen, and Wei-Hsing Huang. 2009. “Temperature Prediction
Model for Flexible Pavements in Taiwan.” Presented at GeoHunan International Conference,
Changsha, Hunan, China, August 3-6, 2009.
SAS. 2013. SAS Software, SAS Institute Inc.
R Core Team. 2013. R: A language and environment for statistical computing. R Foundation for Statistical
Computing, Vienna, Austria. http://www.R-project.org

Development of Pavement Temperature Prediction Model 51
Appendix A. Test Data
Table A.1 Data Collection
Date Time Surf. Temp (°F) Prev. Day's Avg. Temp. Depth (mm) Measured Pavement. Temp. (°F)
19/05/2016 08:48:09 59.60 62.00 76.20 56.50
19/05/2016 10:54:25 61.70 62.00 76.20 65.30
11/05/2016 08:00:05 53.50 52.00 76.20 53.10
11/05/2016 09:45:16 64.50 52.00 76.20 61.60
11/05/2016 12:46:32 82.70 52.00 76.20 77.90
11/05/2016 13:41:33 83.50 52.00 76.20 82.50
12/05/2016 05:26:08 50.60 54.00 76.20 55.10
12/05/2016 06:04:45 48.00 54.00 76.20 53.80
12/05/2016 06:38:01 49.60 54.00 76.20 57.50
10/05/2016 14:30:23 84.20 50.00 76.20 89.30
10/05/2016 15:20:16 92.10 50.00 76.20 95.80
10/05/2016 17:18:14 64.90 49.00 76.20 74.00
10/05/2016 19:38:58 72.20 48.00 76.20 79.70
10/05/2016 07:29:07 50.50 48.00 76.20 52.80
10/05/2016 09:01:13 55.00 48.00 76.20 56.20
10/05/2016 10:45:33 73.60 48.00 76.20 73.50
10/05/2016 12:24:53 80.60 48.00 76.20 72.80
10/05/2016 13:08:03 89.80 48.00 76.20 89.50
18/05/2016 11:02:15 84.40 62.00 76.20 71.70
18/05/2016 11:55:27 82.90 62.00 76.20 81.30
18/05/2016 12:09:56 84.20 62.00 76.20 74.00
26/07/2016 05:43:30 68.60 72.00 76.20 77.00
26/07/2016 06:10:10 70.10 72.00 76.20 77.30

Development of Pavement Temperature Prediction Model 52
Date Time Surf. Temp (°F) Prev. Day's Avg. Temp. Depth (mm) Measured Pavement. Temp. (°F)
18/05/2016 09:26:51 64.80 62.00 76.20 57.40
18/05/2016 10:28:36 69.60 62.00 76.20 64.30
18/05/2016 10:50:46 85.90 62.00 76.20 73.80
26/07/2016 06:19:28 70.70 72.00 76.20 77.20
26/07/2016 06:47:15 69.10 72.00 76.20 75.40
14/09/2016 11:05:43 75.90 48.00 76.20 64.40
14/09/2016 12:26:24 81.90 48.00 76.20 73.80
14/09/2016 14:20:20 94.70 48.00 76.20 80.30
14/09/2016 16:19:07 89.10 48.00 76.20 84.10
14/09/2016 17:36:59 86.90 48.00 76.20 86.20
15/09/2016 09:06:18 49.90 53.00 76.20 48.00
15/09/2016 11:34:18 68.70 53.00 76.20 53.00
15/09/2016 14:27:04 99.30 61.00 76.20 91.00
15/09/2016 15:54:32 105.40 61.00 76.20 95.10
13/09/2016 10:21:02 69.00 60.00 76.20 52.40
13/09/2016 11:45:32 78.50 60.00 76.20 70.20
13/09/2016 13:04:14 88.90 60.00 76.20 84.10
13/09/2016 13:16:19 93.00 52.00 76.20 83.40
13/09/2016 13:35:56 63.70 52.00 76.20 57.50
15/09/2016 11:52:40 76.30 61.00 76.20 66.60
15/09/2016 13:09:53 87.00 61.00 76.20 69.30
06/06/2016 11:48:55 96.50 80.00 76.20 92.50
06/06/2016 12:33:25 98.40 80.00 76.20 97.00
06/06/2016 13:14:59 107.20 80.00 76.20 93.70
06/06/2016 13:31:36 107.80 80.00 76.20 93.70
06/06/2016 14:00:37 108.50 80.00 76.20 104.50

Development of Pavement Temperature Prediction Model 53
Date Time Surf. Temp (°F) Prev. Day's Avg. Temp. Depth (mm) Measured Pavement. Temp. (°F)
06/06/2016 09:27:46 82.60 80.00 76.20 78.70
06/06/2016 10:12:27 88.40 80.00 76.20 83.30
06/06/2016 10:56:42 90.30 80.00 76.20 90.80
06/06/2016 11:25:54 90.70 80.00 76.20 89.70
29/06/2016 00:26:19 84.20 82.00 76.20 96.00
29/06/2016 01:33:06 79.30 82.00 76.20 91.60
29/06/2016 02:18:55 77.90 82.00 76.20 87.00
29/06/2016 03:20:08 77.40 82.00 76.20 86.80
27/06/2016 09:18:43 85.60 75.00 76.20 82.40
27/06/2016 10:08:08 94.00 75.00 76.20 85.70
27/06/2016 10:54:38 99.60 75.00 76.20 94.90
27/06/2016 11:16:37 106.10 75.00 76.20 102.00
23/06/2016 00:33:18 79.50 75.00 76.20 86.60
23/06/2016 00:49:04 79.70 75.00 76.20 85.50
23/06/2016 01:24:58 76.00 75.00 76.20 83.40
04/05/2016 23:10:32 76.00 67.00 76.20 78.00
04/05/2016 23:21:26 75.40 67.00 76.20 79.20
04/05/2016 23:31:59 74.60 67.00 76.20 78.80
22/06/2016 23:45:57 83.40 72.00 76.20 89.70
23/06/2016 00:15:17 80.40 72.00 76.20 83.80
04/05/2016 23:44:37 75.50 67.00 76.20 78.30
05/05/2016 00:02:27 70.30 67.00 76.20 77.30
23/08/2016 09:08:37 72.60 72.00 76.20 72.10
23/08/2016 09:18:38 74.10 72.00 76.20 74.50
23/08/2016 09:29:12 72.20 72.00 76.20 73.40
21/06/2016 08:57:09 70.90 60.00 76.20 67.20

Development of Pavement Temperature Prediction Model 54
Date Time Surf. Temp (°F) Prev. Day's Avg. Temp. Depth (mm) Measured Pavement. Temp. (°F)
21/06/2016 10:17:13 85.90 60.00 76.20 77.70
21/06/2016 11:22:28 87.80 60.00 76.20 86.00
21/06/2016 12:45:31 92.40 60.00 76.20 94.70
21/06/2016 14:02:23 102.90 60.00 76.20 104.10
20/07/2016 10:45:50 90.40 75.00 76.20 88.60
20/07/2016 11:42:16 96.50 75.00 76.20 97.60
20/07/2016 09:25:31 78.80 75.00 76.20 80.70
20/07/2016 10:24:59 86.30 75.00 76.20 85.40
07/09/2016 07:18:46 54.40 56.00 76.20 54.50
07/09/2016 08:37:32 59.50 56.00 76.20 60.90
07/09/2016 09:07:43 61.60 56.00 76.20 61.30
07/09/2016 09:53:53 64.40 56.00 76.20 60.70
07/09/2016 10:38:13 69.20 56.00 76.20 72.00
07/09/2016 11:44:11 86.10 56.00 76.20 80.20
07/09/2016 12:42:23 82.20 56.00 76.20 82.90
07/09/2016 13:07:59 86.50 56.00 76.20 91.40
07/09/2016 13:52:54 85.80 56.00 76.20 89.30
07/09/2016 14:40:32 98.00 56.00 76.20 89.20
07/09/2016 15:21:23 103.80 56.00 76.20 100.10
08/09/2016 08:27:51 58.20 59.00 76.20 57.50
08/09/2016 09:08:02 63.20 59.00 76.20 57.90
08/09/2016 09:53:52 69.80 59.00 76.20 64.40
08/09/2016 10:42:11 72.70 59.00 76.20 78.80
08/09/2016 11:05:44 81.70 59.00 76.20 81.00
01/08/2017 21:26:44 92.60 72.00 76.20 106.00
01/08/2017 22:19:14 87.00 72.00 76.20 99.20
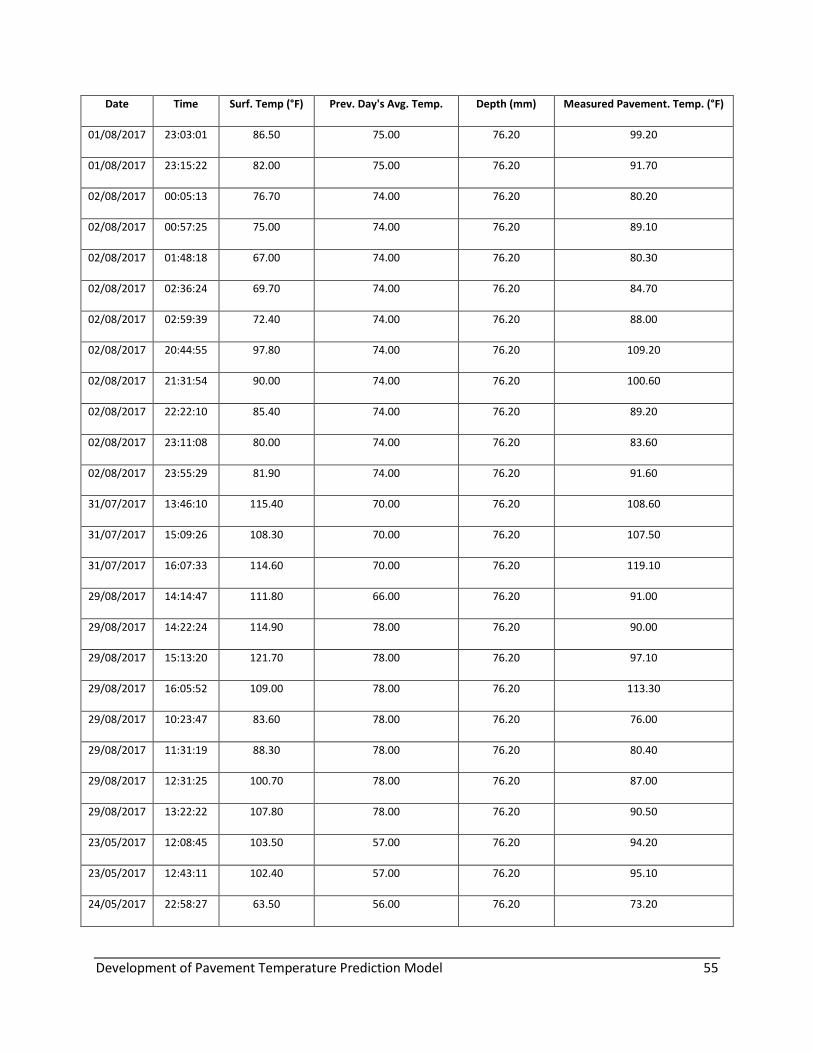
Development of Pavement Temperature Prediction Model 55
Date Time Surf. Temp (°F) Prev. Day's Avg. Temp. Depth (mm) Measured Pavement. Temp. (°F)
01/08/2017 23:03:01 86.50 75.00 76.20 99.20
01/08/2017 23:15:22 82.00 75.00 76.20 91.70
02/08/2017 00:05:13 76.70 74.00 76.20 80.20
02/08/2017 00:57:25 75.00 74.00 76.20 89.10
02/08/2017 01:48:18 67.00 74.00 76.20 80.30
02/08/2017 02:36:24 69.70 74.00 76.20 84.70
02/08/2017 02:59:39 72.40 74.00 76.20 88.00
02/08/2017 20:44:55 97.80 74.00 76.20 109.20
02/08/2017 21:31:54 90.00 74.00 76.20 100.60
02/08/2017 22:22:10 85.40 74.00 76.20 89.20
02/08/2017 23:11:08 80.00 74.00 76.20 83.60
02/08/2017 23:55:29 81.90 74.00 76.20 91.60
31/07/2017 13:46:10 115.40 70.00 76.20 108.60
31/07/2017 15:09:26 108.30 70.00 76.20 107.50
31/07/2017 16:07:33 114.60 70.00 76.20 119.10
29/08/2017 14:14:47 111.80 66.00 76.20 91.00
29/08/2017 14:22:24 114.90 78.00 76.20 90.00
29/08/2017 15:13:20 121.70 78.00 76.20 97.10
29/08/2017 16:05:52 109.00 78.00 76.20 113.30
29/08/2017 10:23:47 83.60 78.00 76.20 76.00
29/08/2017 11:31:19 88.30 78.00 76.20 80.40
29/08/2017 12:31:25 100.70 78.00 76.20 87.00
29/08/2017 13:22:22 107.80 78.00 76.20 90.50
23/05/2017 12:08:45 103.50 57.00 76.20 94.20
23/05/2017 12:43:11 102.40 57.00 76.20 95.10
24/05/2017 22:58:27 63.50 56.00 76.20 73.20

Development of Pavement Temperature Prediction Model 56
Date Time Surf. Temp (°F) Prev. Day's Avg. Temp. Depth (mm) Measured Pavement. Temp. (°F)
24/05/2017 23:41:15 59.20 56.00 76.20 69.80
24/05/2017 23:48:02 57.60 56.00 76.20 69.80
24/05/2017 23:54:57 60.40 56.00 76.20 65.20
23/05/2017 11:13:38 89.20 57.00 76.20 81.10
23/05/2017 11:37:45 97.70 57.00 76.20 87.00
25/05/2017 21:03:24 71.90 45.00 76.20 84.50
25/05/2017 21:31:08 67.70 45.00 76.20 77.40
14/06/2017 11:06:15 71.50 59.00 76.20 59.20
14/06/2017 12:23:20 84.50 59.00 76.20 75.70
14/06/2017 13:19:01 94.50 59.00 76.20 91.70
14/06/2017 15:16:26 96.20 59.00 76.20 101.40
14/06/2017 16:05:48 92.60 59.00 76.20 92.60
14/06/2017 16:48:25 92.50 59.00 76.20 92.50
14/06/2017 17:28:03 82.00 59.00 76.20 88.90
14/06/2017 18:23:56 79.90 59.00 76.20 85.60
15/06/2017 08:58:49 58.70 48.00 76.20 56.50
15/06/2017 09:49:21 55.80 48.00 76.20 57.90
23/05/2017 06:50:32 59.40 57.00 76.20 58.60
23/05/2017 06:51:34 59.60 57.00 76.20 58.60
23/05/2017 08:01:52 63.50 57.00 76.20 65.00
23/05/2017 08:17:37 67.40 57.00 76.20 70.90
23/05/2017 08:51:07 71.30 57.00 76.20 91.70
23/05/2017 10:09:10 80.20 57.00 76.20 73.00
23/05/2017 10:41:40 86.70 57.00 76.20 79.50
19/09/2017 13:37:01 70.60 57.00 76.20 74.80
19/09/2017 14:20:52 57.70 57.00 76.20 66.70
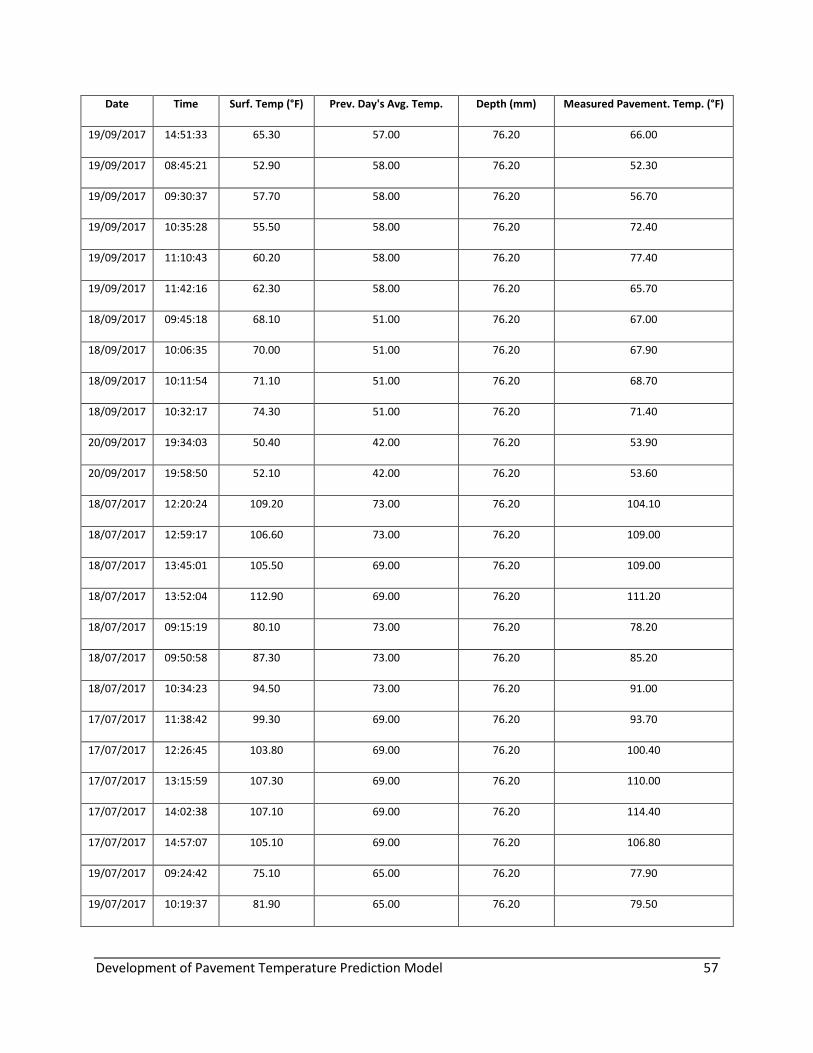
Development of Pavement Temperature Prediction Model 57
Date Time Surf. Temp (°F) Prev. Day's Avg. Temp. Depth (mm) Measured Pavement. Temp. (°F)
19/09/2017 14:51:33 65.30 57.00 76.20 66.00
19/09/2017 08:45:21 52.90 58.00 76.20 52.30
19/09/2017 09:30:37 57.70 58.00 76.20 56.70
19/09/2017 10:35:28 55.50 58.00 76.20 72.40
19/09/2017 11:10:43 60.20 58.00 76.20 77.40
19/09/2017 11:42:16 62.30 58.00 76.20 65.70
18/09/2017 09:45:18 68.10 51.00 76.20 67.00
18/09/2017 10:06:35 70.00 51.00 76.20 67.90
18/09/2017 10:11:54 71.10 51.00 76.20 68.70
18/09/2017 10:32:17 74.30 51.00 76.20 71.40
20/09/2017 19:34:03 50.40 42.00 76.20 53.90
20/09/2017 19:58:50 52.10 42.00 76.20 53.60
18/07/2017 12:20:24 109.20 73.00 76.20 104.10
18/07/2017 12:59:17 106.60 73.00 76.20 109.00
18/07/2017 13:45:01 105.50 69.00 76.20 109.00
18/07/2017 13:52:04 112.90 69.00 76.20 111.20
18/07/2017 09:15:19 80.10 73.00 76.20 78.20
18/07/2017 09:50:58 87.30 73.00 76.20 85.20
18/07/2017 10:34:23 94.50 73.00 76.20 91.00
17/07/2017 11:38:42 99.30 69.00 76.20 93.70
17/07/2017 12:26:45 103.80 69.00 76.20 100.40
17/07/2017 13:15:59 107.30 69.00 76.20 110.00
17/07/2017 14:02:38 107.10 69.00 76.20 114.40
17/07/2017 14:57:07 105.10 69.00 76.20 106.80
19/07/2017 09:24:42 75.10 65.00 76.20 77.90
19/07/2017 10:19:37 81.90 65.00 76.20 79.50

Development of Pavement Temperature Prediction Model 58
Date Time Surf. Temp (°F) Prev. Day's Avg. Temp. Depth (mm) Measured Pavement. Temp. (°F)
19/07/2017 11:00:17 92.40 65.00 76.20 84.60
19/07/2017 11:32:05 95.50 65.00 76.20 87.50
19/07/2017 12:51:11 112.00 65.00 76.20 105.40
19/07/2017 13:37:47 111.90 65.00 76.20 106.80
12/07/2018 10:23:58 82.10 68.00 76.20 79.70
12/07/2018 11:09:12 87.80 68.00 76.20 88.90
12/07/2018 11:23:34 91.90 68.00 76.20 88.50
12/07/2018 12:17:47 94.20 68.00 76.20 90.30
12/07/2018 06:47:34 62.70 68.00 76.20 67.70
12/07/2018 07:43:36 62.70 68.00 76.20 60.20
12/07/2018 05:30:06 62.90 68.00 76.20 71.50
12/07/2018 05:50:10 62.00 68.00 76.20 69.70
11/07/2018 09:39:05 69.60 66.00 76.20 68.60
11/07/2018 10:53:49 90.30 66.00 76.20 79.90
10/07/2018 14:11:11 92.60 65.00 76.20 98.40
10/07/2018 15:01:11 83.00 65.00 76.20 86.30
10/07/2018 16:31:33 85.10 65.00 76.20 85.10
11/07/2018 13:14:02 103.30 66.00 76.20 96.60
11/07/2018 13:58:03 108.50 66.00 76.20 104.20
11/07/2018 15:18:12 96.30 66.00 76.20 100.90
11/07/2018 16:16:35 97.90 66.00 76.20 92.50
11/07/2018 16:45:39 101.80 66.00 76.20 107.80
09/07/2018 11:13:55 87.80 72.00 76.20 75.10
09/07/2018 11:58:38 95.50 72.00 76.20 89.90
09/07/2018 13:59:08 104.90 72.00 76.20 104.30
09/07/2018 14:17:33 107.70 72.00 76.20 105.20

Development of Pavement Temperature Prediction Model 59
Date Time Surf. Temp (°F) Prev. Day's Avg. Temp. Depth (mm) Measured Pavement. Temp. (°F)
09/07/2018 15:30:06 110.40 72.00 76.20 107.90
09/07/2018 16:04:29 116.40 72.00 76.20 111.00
09/07/2018 16:33:32 117.50 72.00 76.20 113.00
16/08/2018 09:21:50 77.80 63.00 76.20 76.70
16/08/2018 10:11:43 78.80 63.00 76.20 77.10
16/08/2018 10:55:38 83.60 63.00 76.20 83.10
22/06/2018 02:32:47 72.70 73.00 76.20 86.80
22/06/2018 02:45:16 75.10 73.00 76.20 86.60
21/06/2018 22:05:06 87.90 82.00 76.20 98.20
21/06/2018 22:12:09 86.60 82.00 76.20 98.20
21/06/2018 22:49:55 83.60 82.00 76.20 95.10
21/06/2018 23:29:23 81.80 82.00 76.20 92.00
21/06/2018 23:55:41 81.00 82.00 76.20 90.90
22/06/2018 03:57:12 70.20 73.00 76.20 80.20
22/06/2018 04:18:53 70.80 73.00 76.20 78.30
22/06/2018 02:15:55 75.20 73.00 76.20 87.10
22/06/2018 02:29:52 73.30 73.00 76.20 86.80
22/06/2018 00:21:02 78.90 73.00 76.20 90.80
22/06/2018 01:00:44 76.10 73.00 76.20 85.00
22/06/2018 01:38:22 75.20 73.00 76.20 84.50
22/06/2018 02:04:05 75.80 73.00 76.20 87.10
22/06/2018 05:15:43 68.40 74.00 76.20 75.30
20/06/2018 21:42:11 87.30 79.00 76.20 96.00
20/06/2018 22:28:54 80.70 79.00 76.20 85.50
20/06/2018 23:15:05 71.50 79.00 76.20 87.20
20/06/2018 23:59:03 69.80 79.00 76.20 81.30

Development of Pavement Temperature Prediction Model 60
Date Time Surf. Temp (°F) Prev. Day's Avg. Temp. Depth (mm) Measured Pavement. Temp. (°F)
21/06/2018 00:45:40 62.60 79.00 76.20 74.20
21/06/2018 01:26:53 66.00 79.00 76.20 74.00
21/06/2018 02:16:41 70.00 79.00 76.20 65.80
19/06/2018 10:26:28 72.60 61.00 76.20 69.80
19/06/2018 11:58:23 72.50 61.00 76.20 69.80
19/06/2018 12:19:04 71.70 61.00 76.20 68.00
19/06/2018 13:18:43 74.70 61.00 76.20 71.60
19/06/2018 14:21:46 77.20 61.00 76.20 73.90
19/06/2018 15:11:14 82.10 61.00 76.20 76.60
25/06/2018 10:49:43 99.80 63.00 76.20 95.00
18/06/2018 10:22:48 76.80 34.00 76.20 72.90
18/06/2018 11:22:58 76.50 34.00 76.20 74.20
18/06/2018 11:36:29 85.30 34.00 76.20 76.20
18/06/2018 12:33:16 79.40 34.00 76.20 76.20
18/06/2018 12:46:31 92.80 34.00 76.20 83.90
18/06/2018 17:30:39 80.80 34.00 76.20 85.00
18/06/2018 17:45:33 77.50 34.00 76.20 80.10
18/06/2018 18:10:38 77.00 34.00 76.20 75.40
28/06/2018 08:42:00 71.60 57.00 76.20 77.20
28/06/2018 09:42:02 84.60 57.00 76.20 81.90
28/06/2018 10:25:13 81.50 57.00 76.20 85.00
23/07/2018 12:38:46 104.50 76.00 76.20 107.50
23/07/2018 13:37:50 111.20 76.00 76.20 116.40
23/07/2018 15:31:30 115.30 76.00 76.20 122.30
23/07/2018 16:48:15 116.20 76.00 76.20 122.10
25/07/2018 08:33:42 77.30 76.00 76.20 76.30
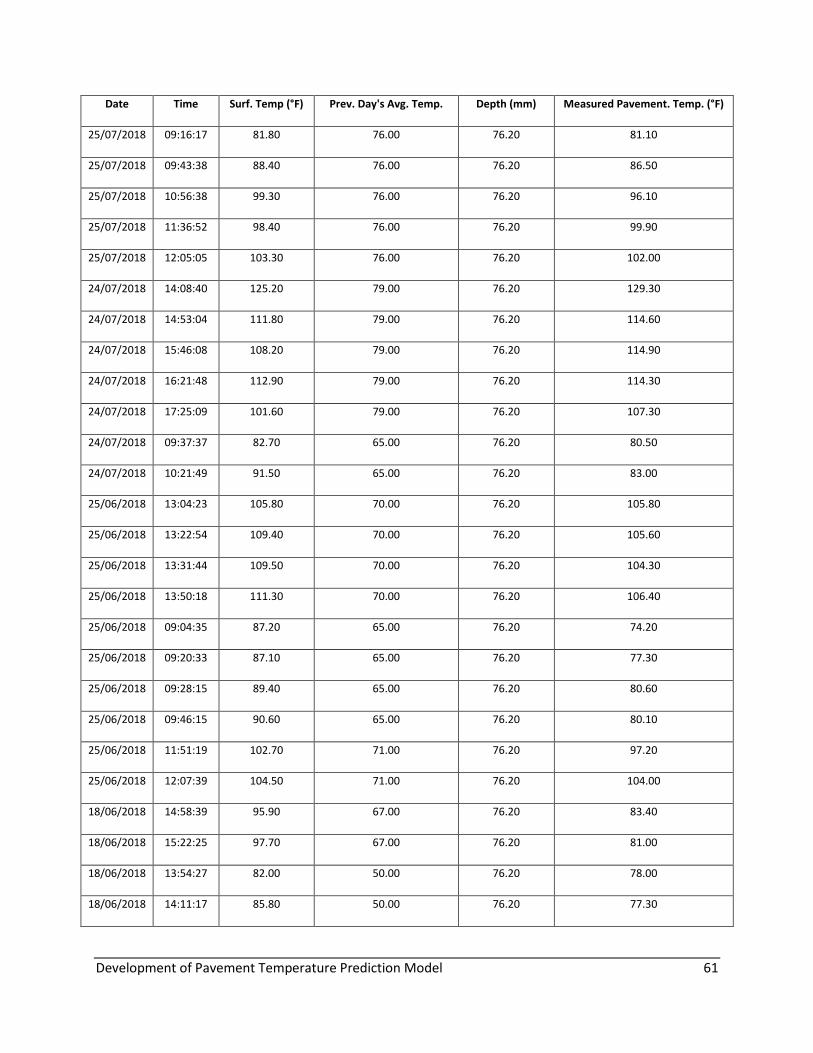
Development of Pavement Temperature Prediction Model 61
Date Time Surf. Temp (°F) Prev. Day's Avg. Temp. Depth (mm) Measured Pavement. Temp. (°F)
25/07/2018 09:16:17 81.80 76.00 76.20 81.10
25/07/2018 09:43:38 88.40 76.00 76.20 86.50
25/07/2018 10:56:38 99.30 76.00 76.20 96.10
25/07/2018 11:36:52 98.40 76.00 76.20 99.90
25/07/2018 12:05:05 103.30 76.00 76.20 102.00
24/07/2018 14:08:40 125.20 79.00 76.20 129.30
24/07/2018 14:53:04 111.80 79.00 76.20 114.60
24/07/2018 15:46:08 108.20 79.00 76.20 114.90
24/07/2018 16:21:48 112.90 79.00 76.20 114.30
24/07/2018 17:25:09 101.60 79.00 76.20 107.30
24/07/2018 09:37:37 82.70 65.00 76.20 80.50
24/07/2018 10:21:49 91.50 65.00 76.20 83.00
25/06/2018 13:04:23 105.80 70.00 76.20 105.80
25/06/2018 13:22:54 109.40 70.00 76.20 105.60
25/06/2018 13:31:44 109.50 70.00 76.20 104.30
25/06/2018 13:50:18 111.30 70.00 76.20 106.40
25/06/2018 09:04:35 87.20 65.00 76.20 74.20
25/06/2018 09:20:33 87.10 65.00 76.20 77.30
25/06/2018 09:28:15 89.40 65.00 76.20 80.60
25/06/2018 09:46:15 90.60 65.00 76.20 80.10
25/06/2018 11:51:19 102.70 71.00 76.20 97.20
25/06/2018 12:07:39 104.50 71.00 76.20 104.00
18/06/2018 14:58:39 95.90 67.00 76.20 83.40
18/06/2018 15:22:25 97.70 67.00 76.20 81.00
18/06/2018 13:54:27 82.00 50.00 76.20 78.00
18/06/2018 14:11:17 85.80 50.00 76.20 77.30

Development of Pavement Temperature Prediction Model 62
Date Time Surf. Temp (°F) Prev. Day's Avg. Temp. Depth (mm) Measured Pavement. Temp. (°F)
18/06/2018 13:52:06 82.40 50.00 76.20 78.00
18/06/2018 14:21:25 87.20 50.00 76.20 78.00
18/06/2018 14:35:18 91.40 50.00 76.20 77.30
Related Documents