Welcome message from author
This document is posted to help you gain knowledge. Please leave a comment to let me know what you think about it! Share it to your friends and learn new things together.
Transcript
ICMA Benchmarking Results
City Council BriefingOctober 15, 2008
2
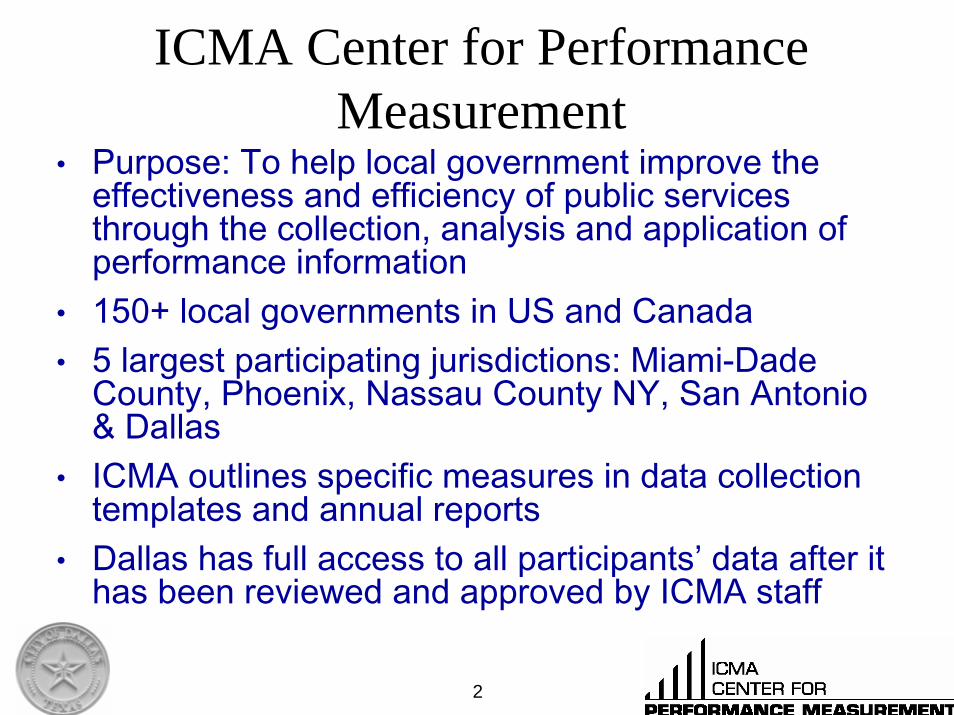
ICMA Center for Performance Measurement
• Purpose: To help local government improve the effectiveness and efficiency of public services through the collection, analysis and application of performance information
• 150+ local governments in US and Canada• 5 largest participating jurisdictions: Miami-Dade
County, Phoenix, Nassau County NY, San Antonio & Dallas
• ICMA outlines specific measures in data collection templates and annual reports
• Dallas has full access to all participants’ data after it has been reviewed and approved by ICMA staff
3
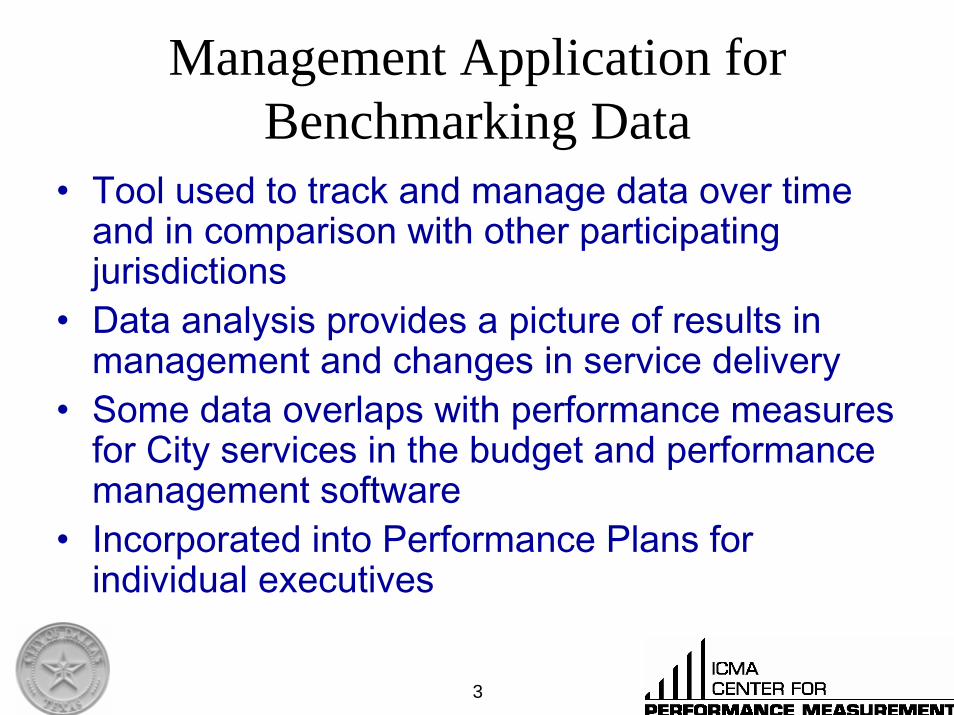
Management Application for Benchmarking Data
• Tool used to track and manage data over time and in comparison with other participating jurisdictions
• Data analysis provides a picture of results in management and changes in service delivery
• Some data overlaps with performance measures for City services in the budget and performance management software
• Incorporated into Performance Plans for individual executives
4
City of Dallas & ICMA Benchmarking
• Fourth year of participation– Dallas received ICMA’s Certificate of Distinction for its
Performance Measurement efforts in the last two years• Departments compiled and submitted data in 14 of the
15 service area templates– Areas Include: Police, Fire, Code Enforcement, Sanitation,
Roadway Maintenance, Housing, Library, Parks & Recreation, Information Technology, Human Resources, Risk Management, Facilities Management, Fleet Management & Purchasing
• Today’s Presentation covers results in selected areas from the past 4 years– Results of Dallas performance over time– Results of how Dallas compares with other participating
jurisdictions
Dallas Performance from FY 2004-2007
6
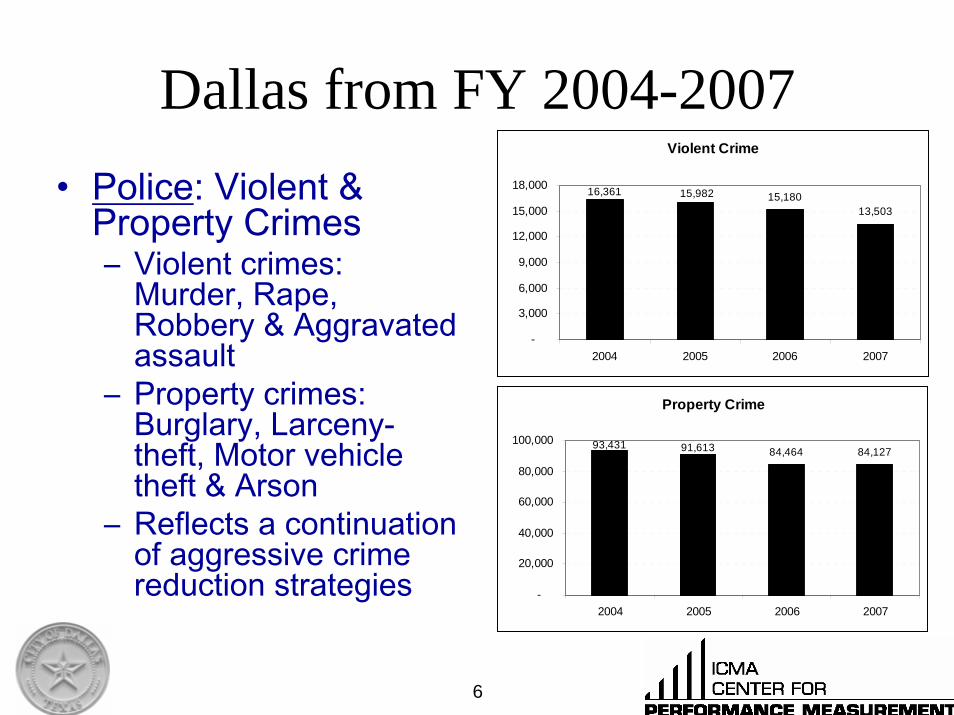
Dallas from FY 2004-2007• Police: Violent &
Property Crimes– Violent crimes:
Murder, Rape, Robbery & Aggravated assault
– Property crimes: Burglary, Larceny-theft, Motor vehicle theft & Arson
– Reflects a continuation of aggressive crime reduction strategies
Violent Crime
15,18013,503
15,98216,361
-
3,000
6,000
9,000
12,000
15,000
18,000
2004 2005 2006 2007
Property Crime
84,464 84,12791,61393,431
-
20,000
40,000
60,000
80,000
100,000
2004 2005 2006 2007
7
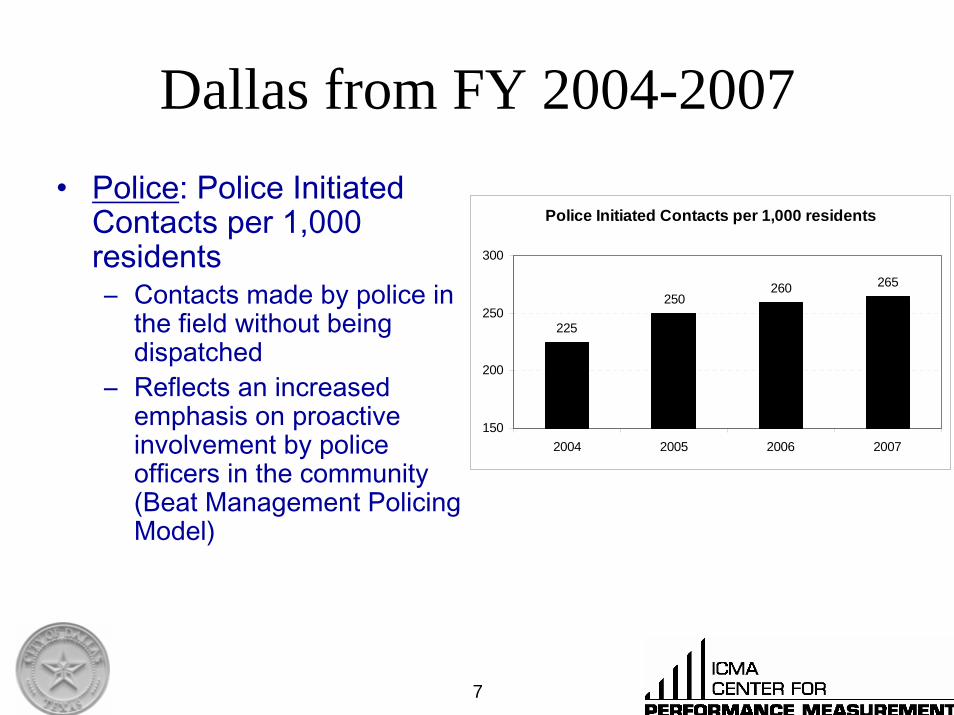
Dallas from FY 2004-2007• Police: Police Initiated
Contacts per 1,000 residents– Contacts made by police in
the field without being dispatched
– Reflects an increased emphasis on proactive involvement by police officers in the community (Beat Management Policing Model)
Police Initiated Contacts per 1,000 residents
225
250260 265
150
200
250
300
2004 2005 2006 2007
8
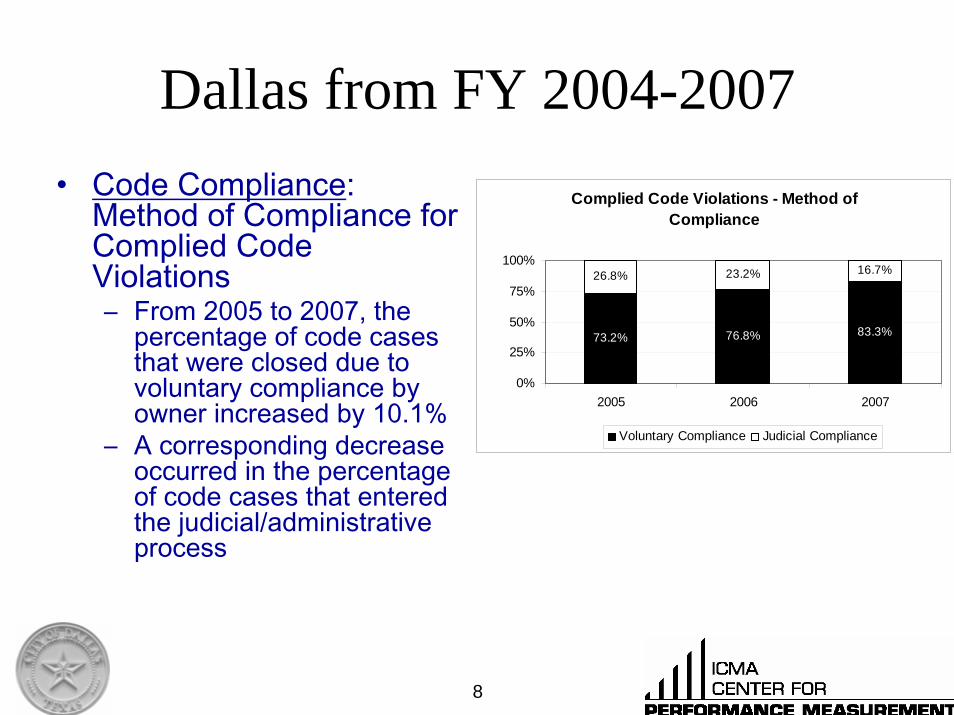
Dallas from FY 2004-2007• Code Compliance:
Method of Compliance for Complied Code Violations– From 2005 to 2007, the
percentage of code cases that were closed due to voluntary compliance by owner increased by 10.1%
– A corresponding decrease occurred in the percentage of code cases that entered the judicial/administrative process
Complied Code Violations - Method of Compliance
73.2% 76.8% 83.3%
26.8% 23.2% 16.7%
0%
25%
50%
75%
100%
2005 2006 2007
Voluntary Compliance Judicial Compliance
9
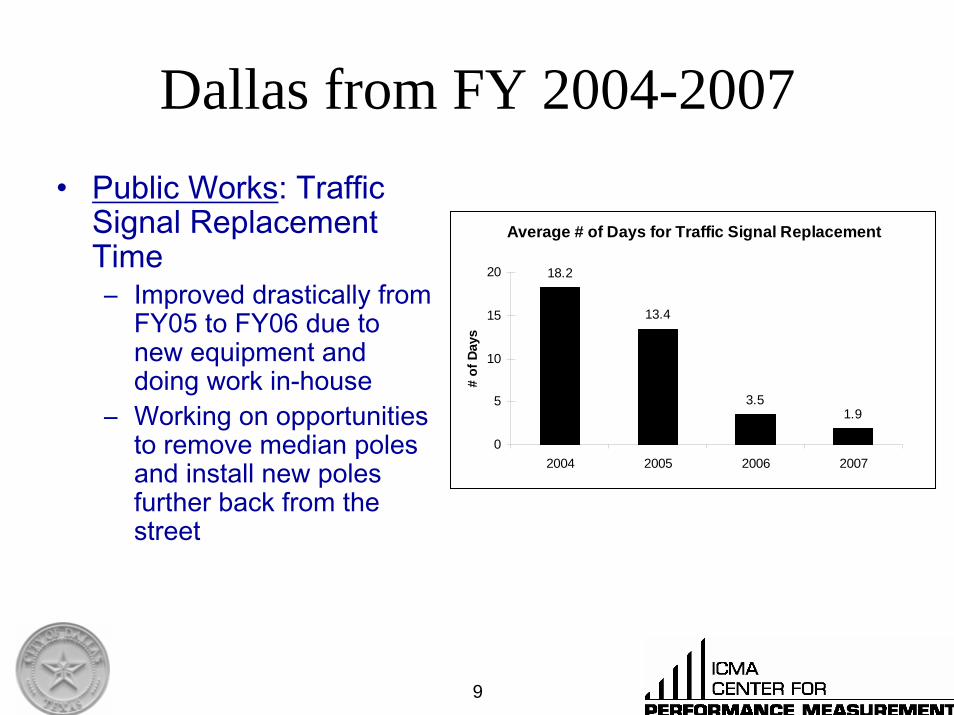
Dallas from FY 2004-2007• Public Works: Traffic
Signal Replacement Time– Improved drastically from
FY05 to FY06 due to new equipment and doing work in-house
– Working on opportunities to remove median poles and install new poles further back from the street
Average # of Days for Traffic Signal Replacement
18.2
13.4
3.51.9
0
5
10
15
20
2004 2005 2006 2007#
of D
ays
10
Dallas from FY 2004-2007
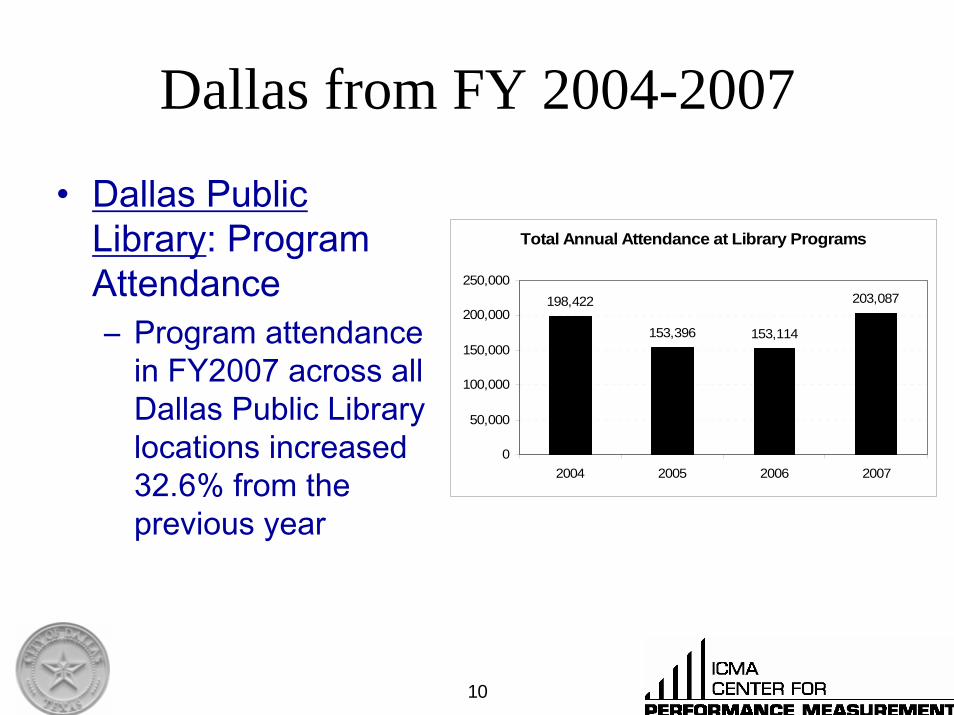
• Dallas Public Library: Program Attendance– Program attendance
in FY2007 across all Dallas Public Library locations increased 32.6% from the previous year
Total Annual Attendance at Library Programs
198,422
153,396 153,114
203,087
0
50,000
100,000
150,000
200,000
250,000
2004 2005 2006 2007
11
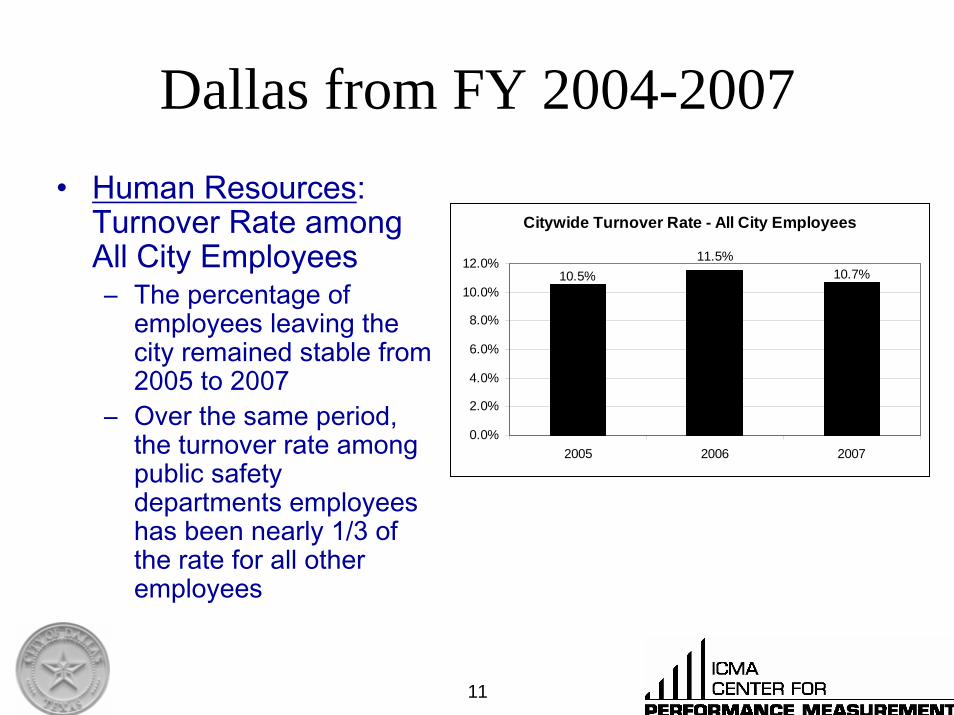
Dallas from FY 2004-2007• Human Resources:
Turnover Rate among All City Employees– The percentage of
employees leaving the city remained stable from 2005 to 2007
– Over the same period, the turnover rate among public safety departments employees has been nearly 1/3 of the rate for all other employees
Citywide Turnover Rate - All City Employees
11.5%10.5% 10.7%
0.0%
2.0%
4.0%
6.0%
8.0%
10.0%
12.0%
2005 2006 2007
12
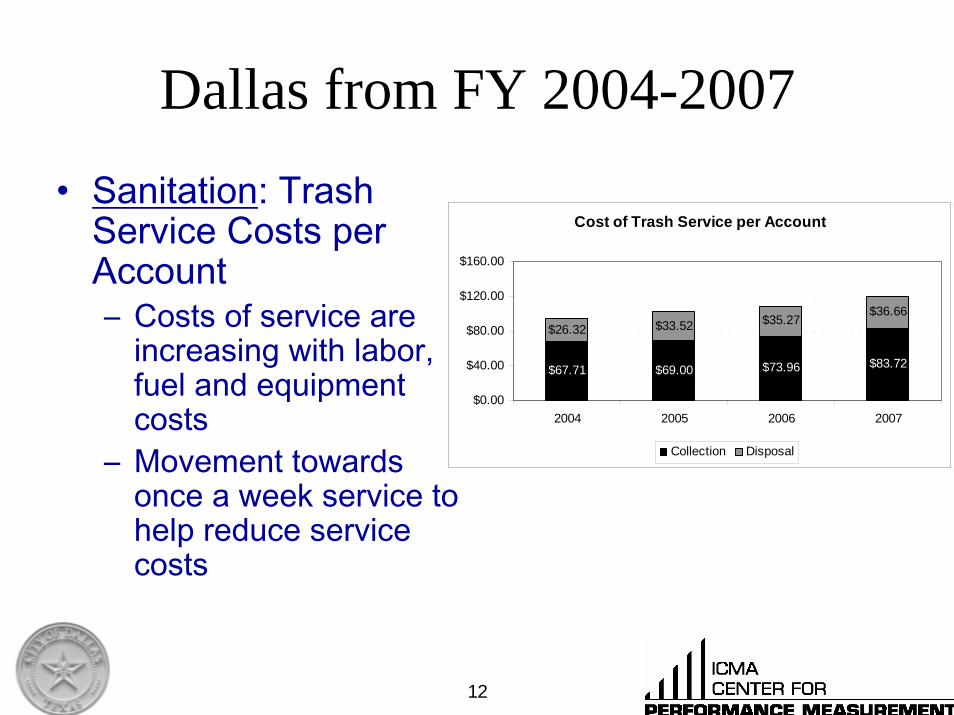
Dallas from FY 2004-2007• Sanitation: Trash
Service Costs per Account– Costs of service are
increasing with labor, fuel and equipment costs
– Movement towards once a week service to help reduce service costs
Cost of Trash Service per Account
$67.71 $69.00 $73.96 $83.72
$26.32 $33.52 $35.27$36.66
$0.00
$40.00
$80.00
$120.00
$160.00
2004 2005 2006 2007
Collection Disposal
13
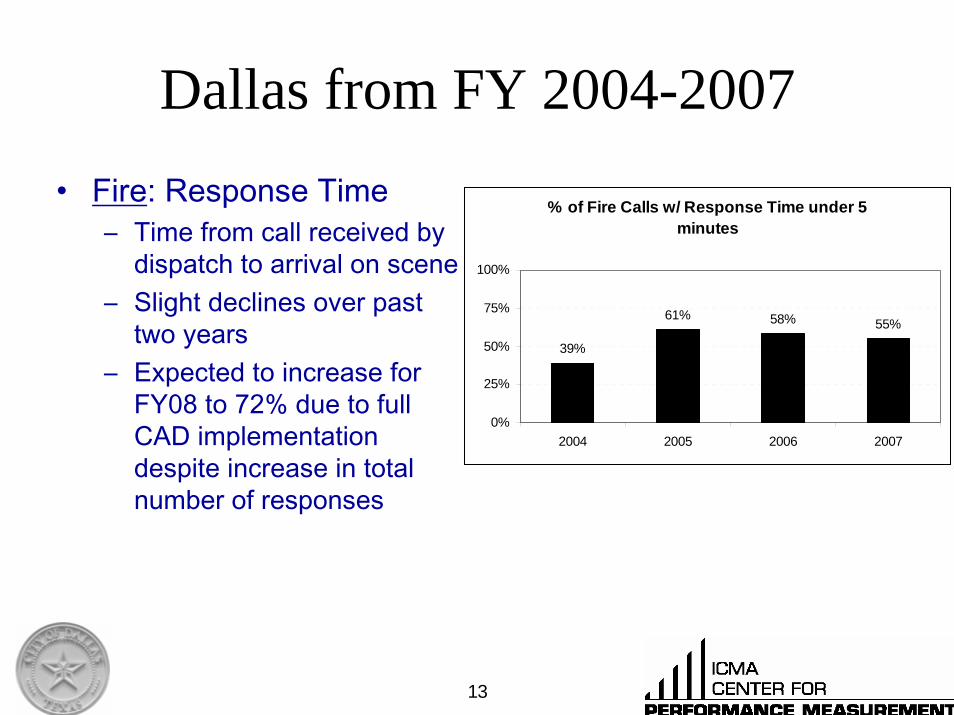
Dallas from FY 2004-2007• Fire: Response Time
– Time from call received by dispatch to arrival on scene
– Slight declines over past two years
– Expected to increase for FY08 to 72% due to full CAD implementation despite increase in total number of responses
% of Fire Calls w/ Response Time under 5 minutes
39%
61% 58% 55%
0%
25%
50%
75%
100%
2004 2005 2006 2007
14
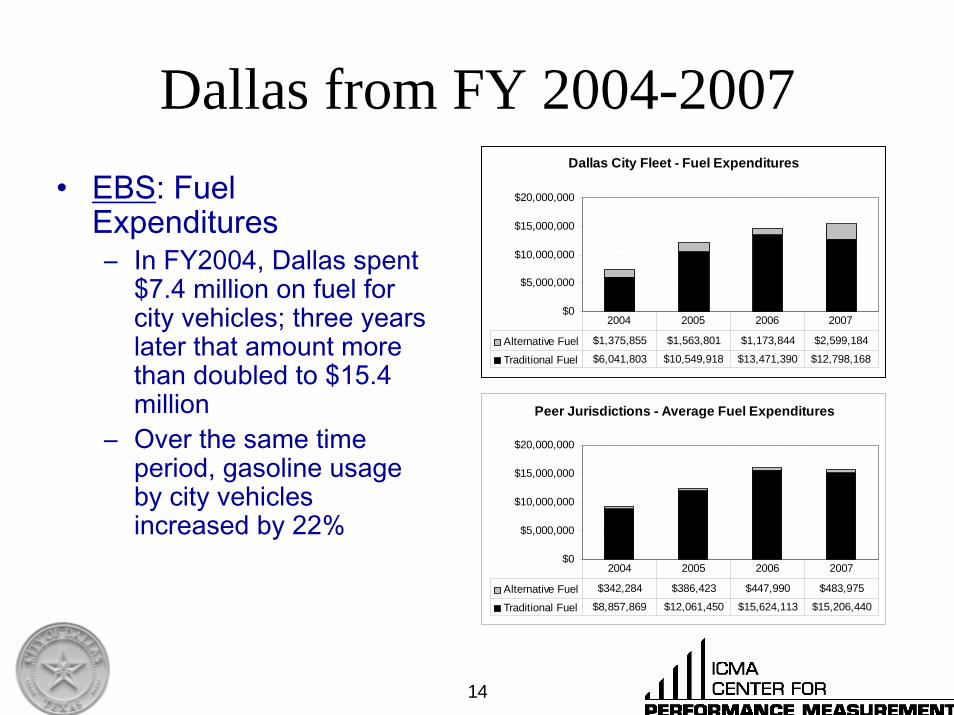
Dallas from FY 2004-2007• EBS: Fuel
Expenditures– In FY2004, Dallas spent
$7.4 million on fuel for city vehicles; three years later that amount more than doubled to $15.4 million
– Over the same time period, gasoline usage by city vehicles increased by 22%
Dallas City Fleet - Fuel Expenditures
$0
$5,000,000
$10,000,000
$15,000,000
$20,000,000
Alternative Fuel $1,375,855 $1,563,801 $1,173,844 $2,599,184
Traditional Fuel $6,041,803 $10,549,918 $13,471,390 $12,798,168
2004 2005 2006 2007
Peer Jurisdictions - Average Fuel Expenditures
$0
$5,000,000
$10,000,000
$15,000,000
$20,000,000
Alternative Fuel $342,284 $386,423 $447,990 $483,975
Traditional Fuel $8,857,869 $12,061,450 $15,624,113 $15,206,440
2004 2005 2006 2007
15
Dallas from FY 2004-2007
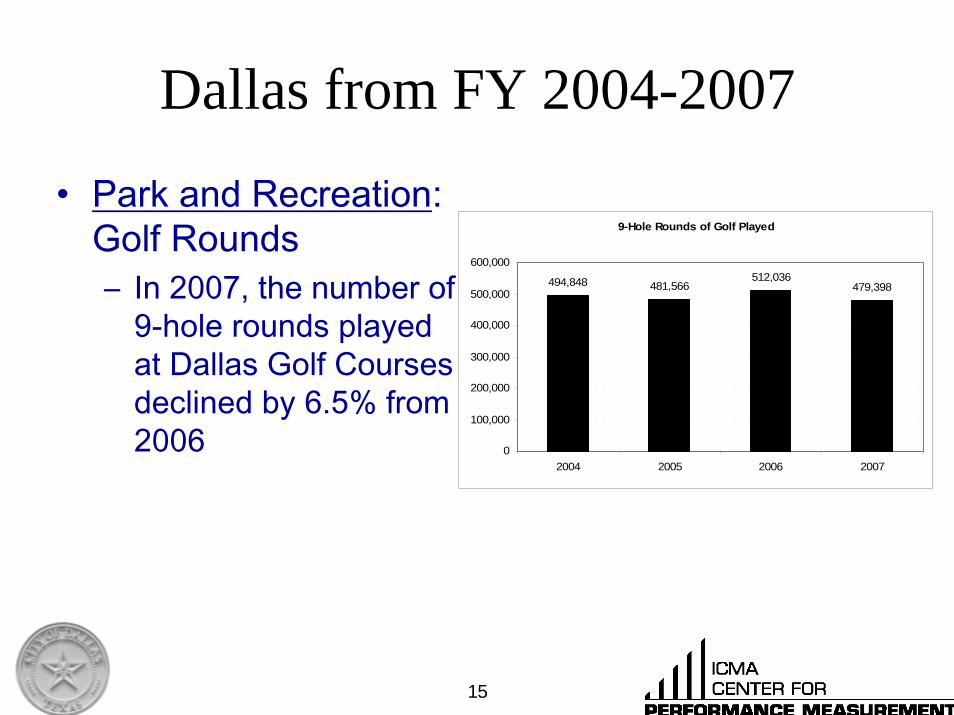
• Park and Recreation: Golf Rounds– In 2007, the number of
9-hole rounds played at Dallas Golf Courses declined by 6.5% from 2006
9-Hole Rounds of Golf Played
494,848 481,566512,036
479,398
0
100,000
200,000
300,000
400,000
500,000
600,000
2004 2005 2006 2007
16
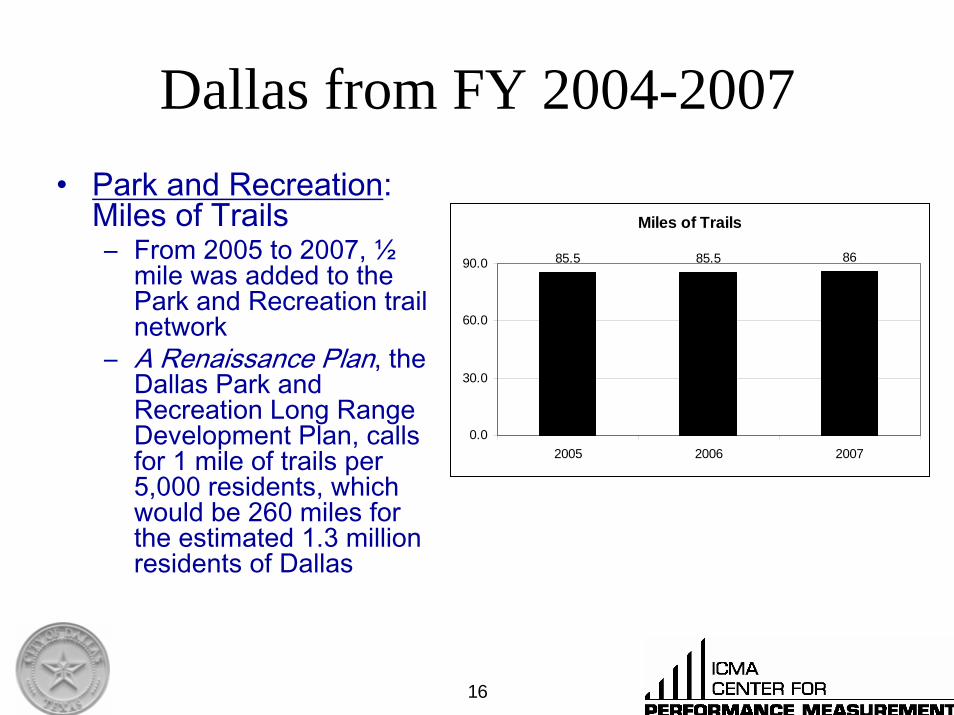
Dallas from FY 2004-2007• Park and Recreation:
Miles of Trails– From 2005 to 2007, ½
mile was added to the Park and Recreation trail network
– A Renaissance Plan, the Dallas Park and Recreation Long Range Development Plan, calls for 1 mile of trails per 5,000 residents, which would be 260 miles for the estimated 1.3 million residents of Dallas
Miles of Trails
85.5 85.5 86
0.0
30.0
60.0
90.0
2005 2006 2007
Dallas Performance compared to similar ICMA Jurisdictions
18
Dallas Compared to Other ICMA participants
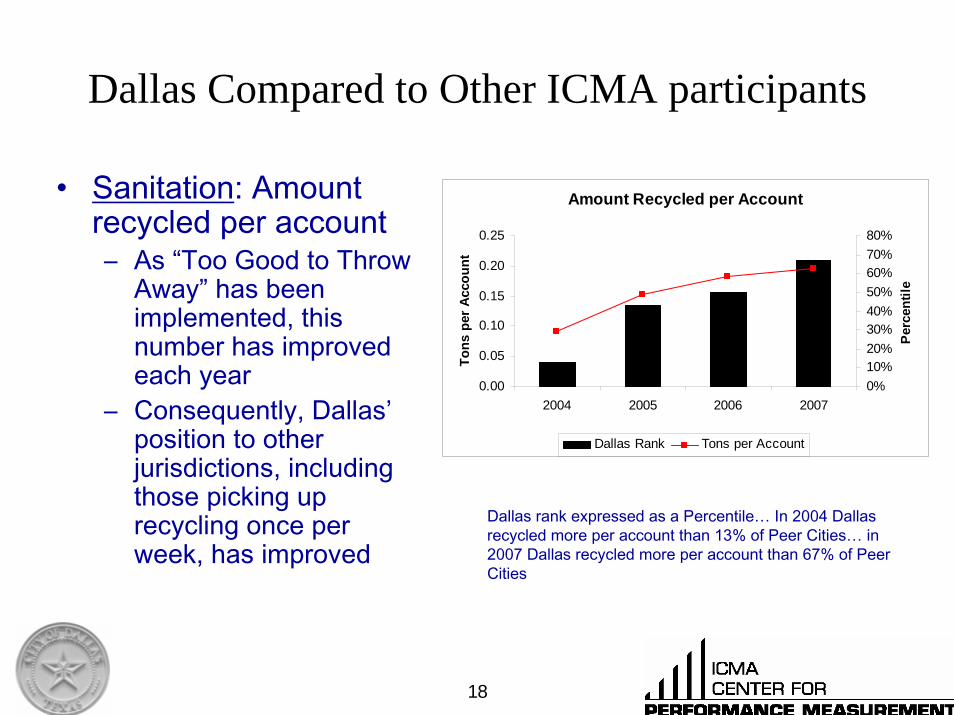
• Sanitation: Amount recycled per account– As “Too Good to Throw
Away” has been implemented, this number has improved each year
– Consequently, Dallas’position to other jurisdictions, including those picking up recycling once per week, has improved
Amount Recycled per Account
0.00
0.05
0.10
0.15
0.20
0.25
2004 2005 2006 2007
Tons
per
Acc
ount
0%10%20%30%40%50%60%70%80%
Perc
entil
e
Dallas Rank Tons per Account
Dallas rank expressed as a Percentile… In 2004 Dallas recycled more per account than 13% of Peer Cities… in 2007 Dallas recycled more per account than 67% of Peer Cities
19
Dallas Compared to Other ICMA participants
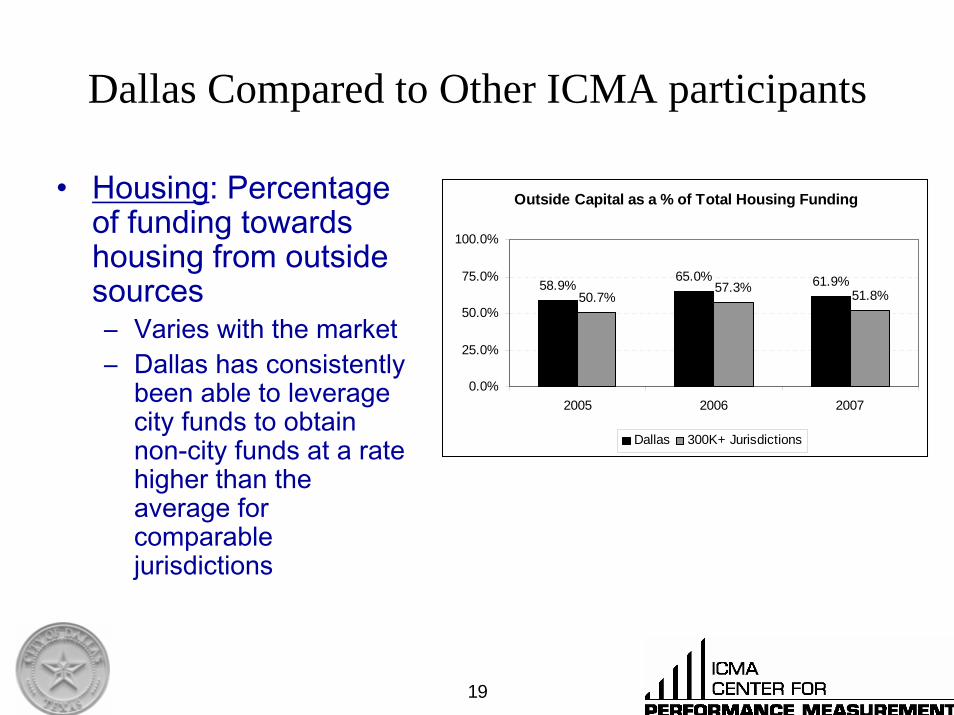
• Housing: Percentage of funding towards housing from outside sources – Varies with the market – Dallas has consistently
been able to leverage city funds to obtain non-city funds at a rate higher than the average for comparable jurisdictions
Outside Capital as a % of Total Housing Funding
58.9%65.0% 61.9%
50.7%57.3% 51.8%
0.0%
25.0%
50.0%
75.0%
100.0%
2005 2006 2007
Dallas 300K+ Jurisdictions
20
Dallas Compared to Other ICMA participants
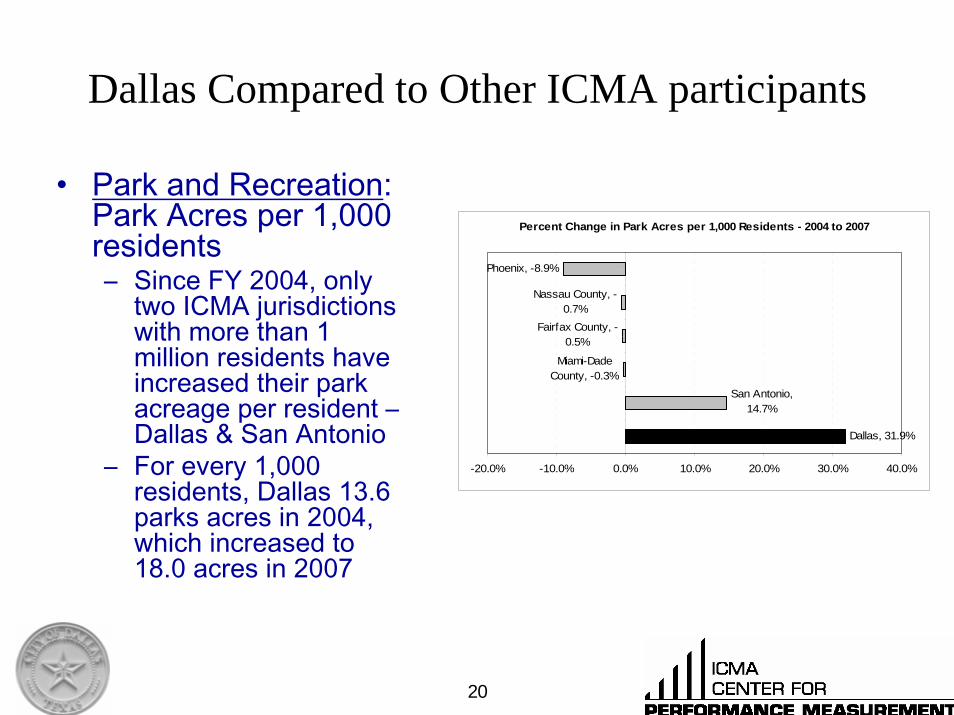
• Park and Recreation: Park Acres per 1,000 residents– Since FY 2004, only
two ICMA jurisdictions with more than 1 million residents have increased their park acreage per resident –Dallas & San Antonio
– For every 1,000 residents, Dallas 13.6 parks acres in 2004, which increased to 18.0 acres in 2007
Percent Change in Park Acres per 1,000 Residents - 2004 to 2007
Dallas, 31.9%
San Antonio, 14.7%
Miami-Dade County, -0.3%
Fairfax County, -0.5%
Nassau County, -0.7%
Phoenix, -8.9%
-20.0% -10.0% 0.0% 10.0% 20.0% 30.0% 40.0%
D a lla s
S a n A n to n io
M ia mi-D a d e C o u n ty
F a irfa x C o u n ty
N a ssa u C o u n ty
P h o e n ix
21
Dallas Compared to Other ICMA participants
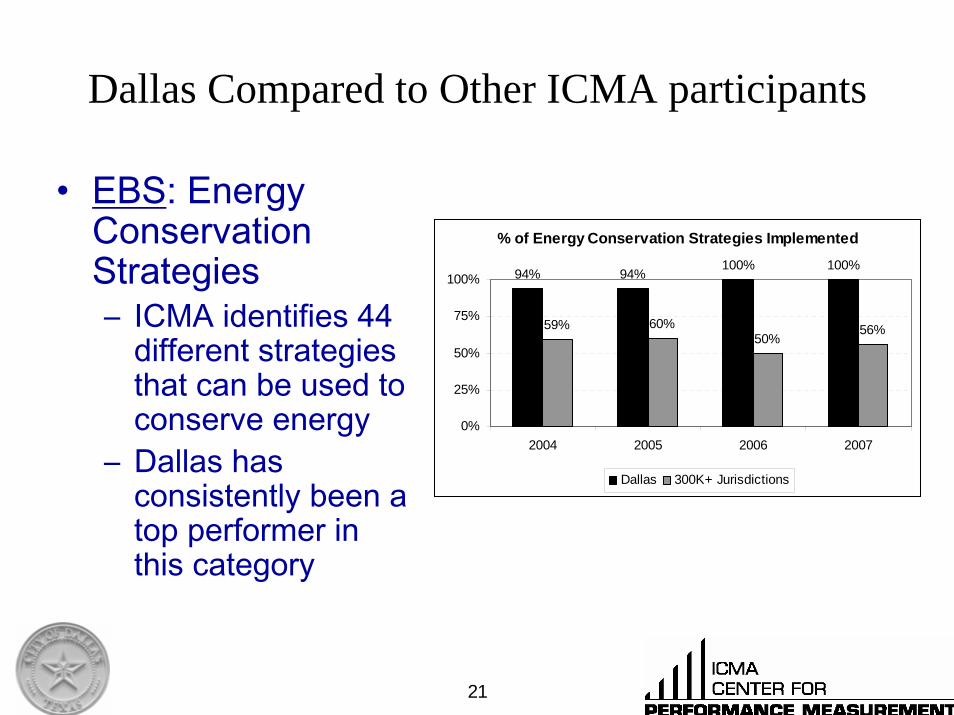
• EBS: Energy Conservation Strategies– ICMA identifies 44
different strategies that can be used to conserve energy
– Dallas has consistently been a top performer in this category
% of Energy Conservation Strategies Implemented
94% 94%100% 100%
59% 60%50%
56%
0%
25%
50%
75%
100%
2004 2005 2006 2007
Dallas 300K+ Jurisdictions
22
Dallas Compared to Other ICMA participants
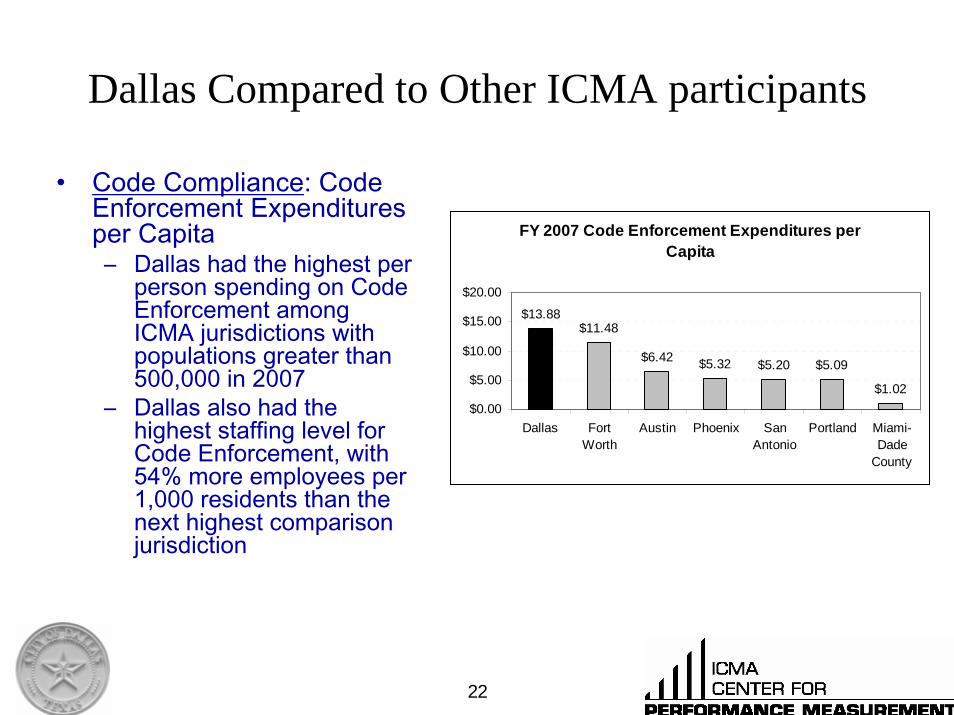
• Code Compliance: Code Enforcement Expenditures per Capita– Dallas had the highest per
person spending on Code Enforcement among ICMA jurisdictions with populations greater than 500,000 in 2007
– Dallas also had the highest staffing level for Code Enforcement, with 54% more employees per 1,000 residents than the next highest comparison jurisdiction
FY 2007 Code Enforcement Expenditures per Capita
$13.88$11.48
$6.42 $5.32 $5.20 $5.09
$1.02$0.00
$5.00
$10.00
$15.00
$20.00
Dallas FortWorth
Austin Phoenix SanAntonio
Portland Miami-Dade
County
23
Dallas Compared to Other ICMA participants
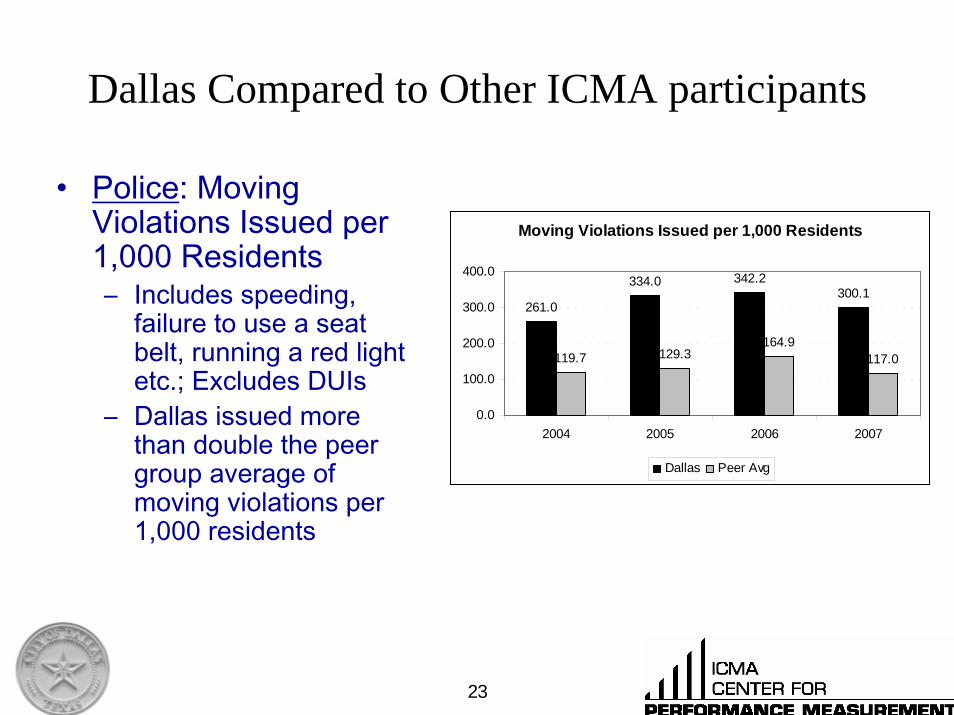
• Police: Moving Violations Issued per 1,000 Residents– Includes speeding,
failure to use a seat belt, running a red light etc.; Excludes DUIs
– Dallas issued more than double the peer group average of moving violations per 1,000 residents
Moving Violations Issued per 1,000 Residents
261.0
334.0 342.2300.1
119.7 129.3164.9
117.0
0.0
100.0
200.0
300.0
400.0
2004 2005 2006 2007
Dallas Peer Avg
24
Dallas Compared to Other ICMA participants
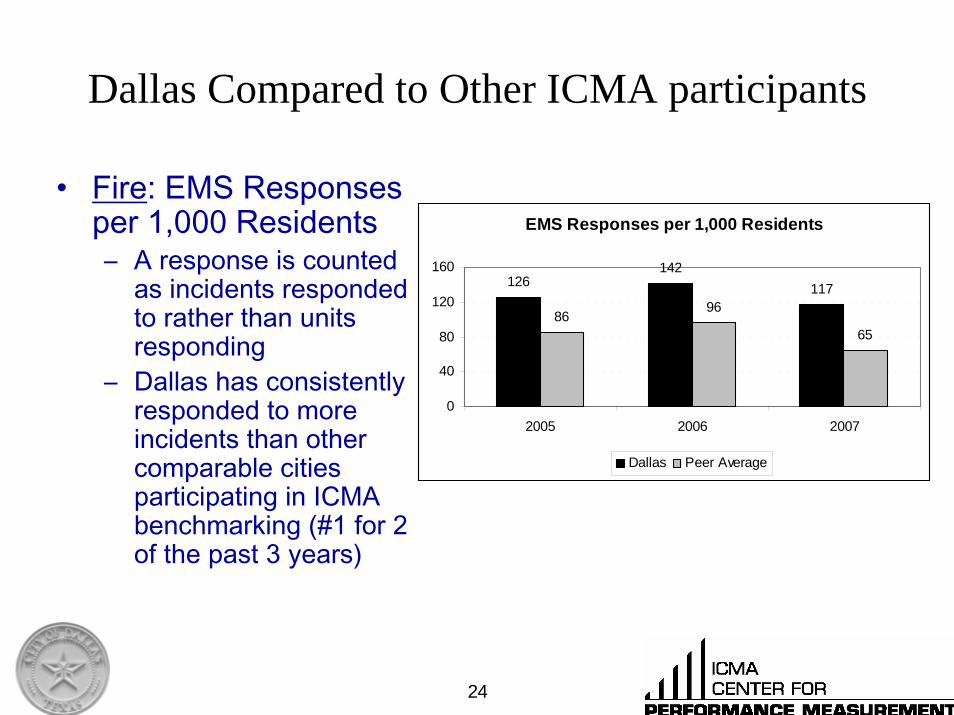
• Fire: EMS Responses per 1,000 Residents– A response is counted
as incidents responded to rather than units responding
– Dallas has consistently responded to more incidents than other comparable cities participating in ICMA benchmarking (#1 for 2 of the past 3 years)
EMS Responses per 1,000 Residents
126142
117
8696
65
0
40
80
120
160
2005 2006 2007
Dallas Peer Average
25
Dallas Compared to Other ICMA participants
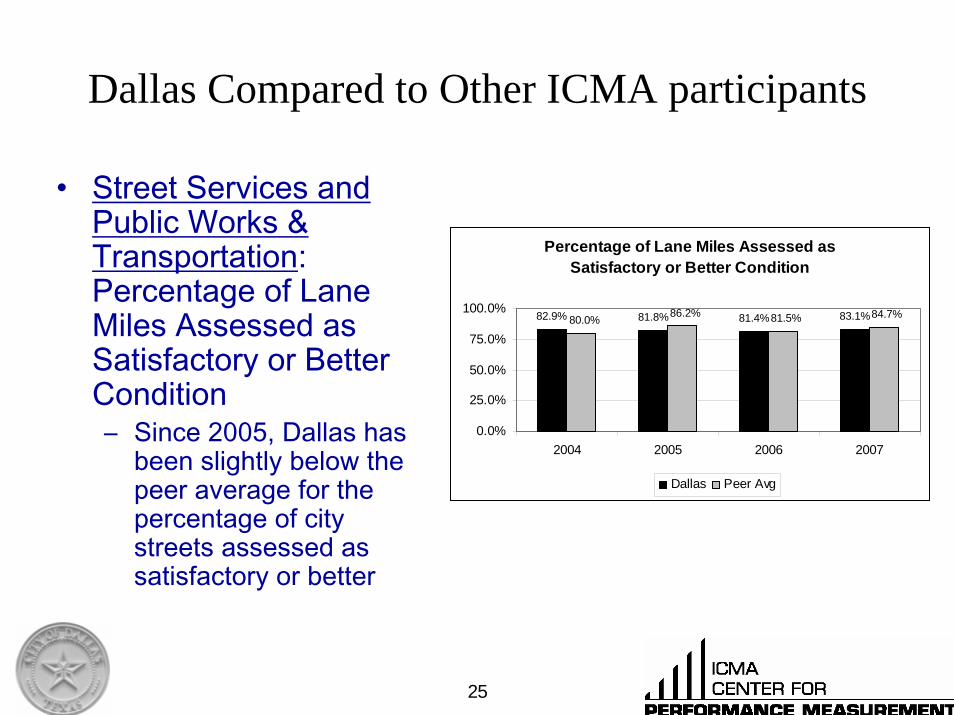
• Street Services and Public Works & Transportation: Percentage of Lane Miles Assessed as Satisfactory or Better Condition– Since 2005, Dallas has
been slightly below the peer average for the percentage of city streets assessed as satisfactory or better
Percentage of Lane Miles Assessed as Satisfactory or Better Condition
82.9% 81.8% 81.4% 83.1%80.0% 86.2% 81.5% 84.7%
0.0%
25.0%
50.0%
75.0%
100.0%
2004 2005 2006 2007
Dallas Peer Avg
26
Dallas Compared to Other ICMA participants
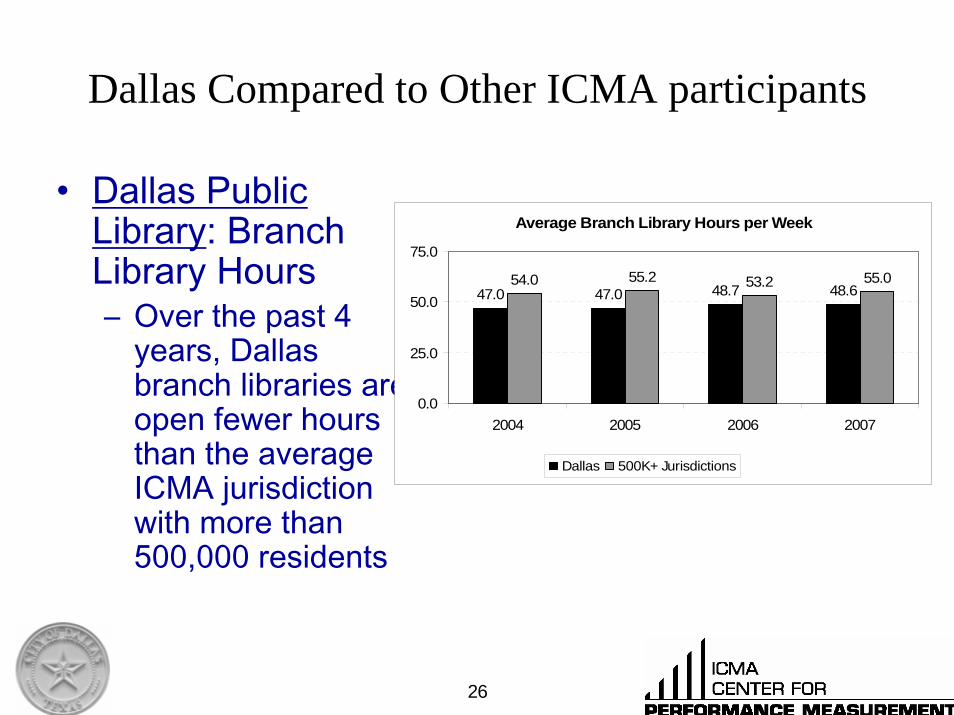
• Dallas Public Library: Branch Library Hours– Over the past 4
years, Dallas branch libraries are open fewer hours than the average ICMA jurisdiction with more than 500,000 residents
Average Branch Library Hours per Week
47.0 47.0 48.7 48.654.0 55.2 53.2 55.0
0.0
25.0
50.0
75.0
2004 2005 2006 2007
Dallas 500K+ Jurisdictions
27
Dallas Compared to Other ICMA participants
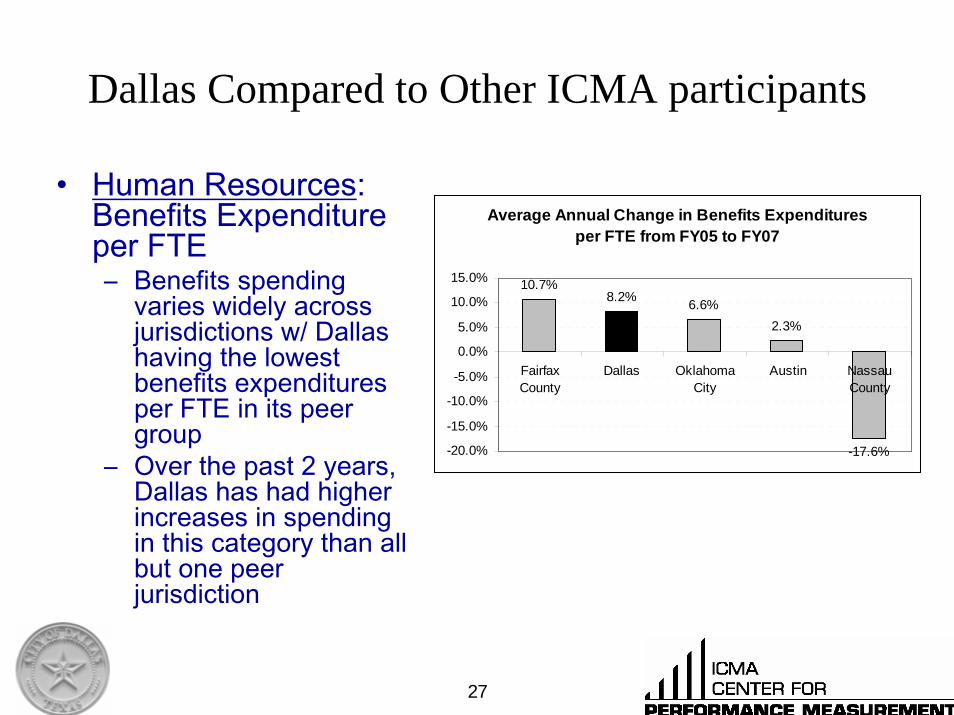
• Human Resources: Benefits Expenditure per FTE– Benefits spending
varies widely across jurisdictions w/ Dallas having the lowest benefits expenditures per FTE in its peer group
– Over the past 2 years, Dallas has had higher increases in spending in this category than all but one peer jurisdiction
Average Annual Change in Benefits Expenditures per FTE from FY05 to FY07
10.7%8.2% 6.6%
2.3%
-17.6%-20.0%
-15.0%
-10.0%
-5.0%
0.0%
5.0%
10.0%
15.0%
FairfaxCounty
Dallas OklahomaCity
Austin NassauCounty
28
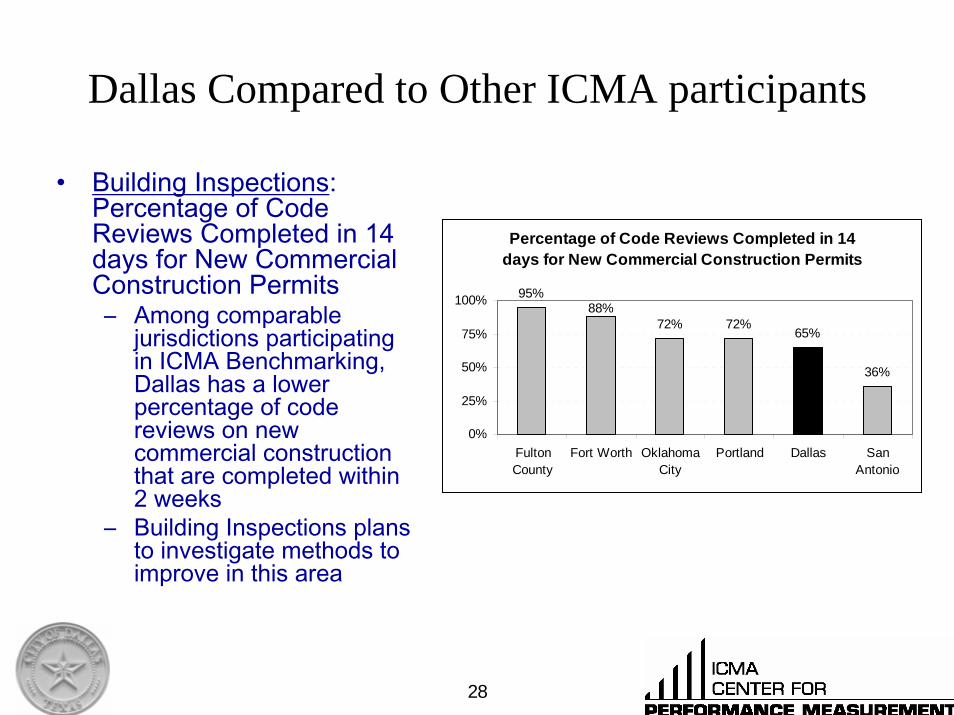
Dallas Compared to Other ICMA participants
• Building Inspections: Percentage of Code Reviews Completed in 14 days for New Commercial Construction Permits– Among comparable
jurisdictions participating in ICMA Benchmarking, Dallas has a lower percentage of code reviews on new commercial construction that are completed within 2 weeks
– Building Inspections plans to investigate methods to improve in this area
Percentage of Code Reviews Completed in 14 days for New Commercial Construction Permits
95%
72% 72%65%
36%
88%
0%
25%
50%
75%
100%
FultonCounty
Fort Worth OklahomaCity
Portland Dallas SanAntonio

29
Questions?
Related Documents