IBM Cognos Analytics 11.1 Best Practices: Multi-Fact, Multi-Grain and Relative Dates Defining Column Dependencies to Prevent Double Counting May 2019 Authors: Ian Henderson, Anthony Koch © Copyright International Business Machines Corporation 2019. All rights reserved. Note to U.S. Government Users Restricted Rights — Use, duplication or disclosure restricted by GSA ADP Schedule Contract with IBM Corp. 1

Welcome message from author
This document is posted to help you gain knowledge. Please leave a comment to let me know what you think about it! Share it to your friends and learn new things together.
Transcript
IBM Cognos Analytics 11.1Best Practices: Multi-Fact, Multi-Grain and Relative Dates
Defining Column Dependencies to Prevent Double Counting
May 2019
Authors: Ian Henderson, Anthony Koch
© Copyright International Business Machines Corporation 2019. All rights reserved.Note to U.S. Government Users Restricted Rights —Use, duplication or disclosure restricted by GSA ADP Schedule Contract with IBM Corp.
�1

�2
Chapter 1- Introduction 6 1. Overview 7 2. Terminology 8
Chapter 2. Double Counting 10 1. Double Counting: Definition 11 2. Repeating Values 11 3. Undesired Aggregation 12 4. IBM Cognos Framework Manager - Determinants 13
Chapter 3. Column Dependencies: Resolving Double Counting 14 1. Column Dependency and Dependency Group 16 2. Defining Column Dependencies 18
2.1 All Tables Normalized 19 2.2 Dimension Table 20 2.3 Degenerate Dimension Table 23 2.4 Fact Table 28
Chapter 4. Relative Dates Feature 29 1. Relative Date Based Facts 30 2. ‘Lookup reference’ Property 31 3. Double Counting 34
Chapter 5. Date Columns at Fact Grain: Resolving Double Counting 35 1. Create Date Columns at Fact Grain 36 2. Date columns: ‘Lookup Reference’ -> Calendar 38 3. Fact columns: ‘Lookup Reference’ -> Date Column 38 4. Date Columns included in Column Dependencies 38 5. An Example: Setup Date Columns at Fact Grain 39
Step 1- Create Date Columns at Fact Grain 40 Step 2 - Date columns: ‘Lookup Reference’ set to Calendar 40 Step 3 - Fact columns: ‘Lookup Reference’ set to Date Column 40 Step 4 - Date Columns included in Column Dependencies 41
Chapter 6. Best Practices to Resolve Double Counting 42
Chapter 7. Use Case A - Normalized Tables 44 Task 1 - Define Column Dependencies 46
�3
Task 2 - Setup Date Columns at Fact Grain 46 Step 1 - Create date columns at fact grain 46 Step 2 - Date columns: ‘Lookup reference’ set to Calendar 46 Step 3 - Fact columns: ‘Lookup reference’ set to Date column 47 Step 4 - Date columns included in column dependencies 47
Chapter 8. Use Case B - Time Dimension Denormalized 48 Task 1 - Define Column Dependencies 50 Task 2 - Setup Date Columns at Fact Grain 51
Step 1 - Create date columns at fact grain 51 Step 2 - Date columns: ‘Lookup reference’ set to Calendar 51 Step 3 - Fact columns: ‘Lookup reference’ set to Date column 51 Step 4 - Date columns included in column dependencies 52
Conclusion 53
Appendices 55 Appendix A - ‘Date’ Calculated Column 56
‘Date’ Column from TimeStamp 56 ‘Date’ Column from Text column ‘mm/dd/yyyy’ 57
Appendix B - ‘FirstOfMonth’ Calculated Column 58 ‘FirstOfMonth’ column from ‘MonthKey’ column 58 ‘FirstOfMonth’ column from ‘Date’ column 59
Appendix C - Time Dimension Denormalized with Two Fact Tables 60 Table Structure 60 Task 1 - Define Column Dependencies 63 Task 2 - Setup Date Columns at Fact Grain 64
Step 1 - Create date columns at fact grain 64 Step 2 - Date Columns ‘Lookup reference’ set to Calendar 64 Step 3 - Fact Columns ‘Lookup reference’ set to Date Column 64 Step 4 - Date Columns included in Column Dependencies 65
Final Result: List Report with No Double Counting 66 Appendix D - One Table with Dimensions and with Facts at Different Grains 67
Table Structure 67 Table Data 68 Task 1 - Define Column Dependencies 69
�4
Task 2 - Setup Date Columns at Fact Grain 70 Step 1 - Create date columns at fact grain 70 Step 2 - Date Column ‘Lookup reference’ set to Calendar 70 Step 3 - Fact Column ‘Lookup reference’ set to Date Column 71 Step 4 - Date Columns included in Column Dependencies 72
Final Result: List Report with No Double Counting 73
�5

Chapter 1- Introduction
�6
When analyzing business data within reports and visualizations, there is an issue known as double counting that can arise in certain situations. Double counting can be prevented by employing IBM Cognos Analytics data modeling to define column dependencies for the business data. This document details the best practices to define column dependencies given that there are various scenarios of table normalization in the business data.
The document consists of the following sections:1. Double Counting: Definition2. Column Dependencies: Resolving Double Counting3. Relative Date Analysis4. Date Columns at Fact Grain: Resolving Double Counting5. Best Practices: 1) Column Dependencies and 2) Date Columns at Fact Grain
1. OverviewAn overview of each of the upcoming sections is given here:
Double Counting: DefinitionThis section defines double counting and includes an example.
Column Dependencies: Resolving Double CountingBusiness data has different situations of table normalization. This section describes how to define column dependencies based on the different situations of data.
Relative Date AnalysisRelative Date analysis examines data using date-filtered measures such as ‘Current Month’ or ‘Year-to-Date (YTD)’. This section applies only to business data that uses Relative Date analysis. The section details the relative dates feature.
Date Columns at Fact Grain: Resolving Double CountingThis section describes how to resolve double counting for business data that uses Relative Date analysis. The technique involves creating Date columns, as required, so that for each fact grain (eg date, month, quarter), there is a Date column at the matching grain (eg Date, FirstOfMonth, FirstOfQuarter).
�7
Best Practices: Based on the previous sections, this section describes the recommended best practices to prevent double counting. The best practices are:1. Define Column Dependencies 2. Setup Date Columns at Fact Grain (only required for Relative Date Analysis)
2. TerminologyA brief description of the various terms used in this document is given here.
Data modeling involves working with business data that consists of dimensions and facts. Dimensions are related to a particular business aspect. Examples of a dimension are the time dimension, the region dimension and the product dimension. Dimensions are built upon of one or more tables that contain columns related to the particular business aspect. Facts are columns that contain measures, or measurable data. Example of facts include quantity, revenue, planned revenue and profit.
The business data can be in various forms of normalized and denormalized tables. In normalized tables, each level of a dimension is in its own table. For example, for a normalized time dimension, there could be a table with various columns for the year level, another table with various columns for the month level and another table with various columns for the day level. In a denormalized table, all levels of a dimension are in a table. For example, a denormalized Time dimension table consists of columns for Year, Month and Day.
The granularity of a fact refers to the level or grain at which the fact is measured. Different facts can be measured at different levels of granularity, or grains. For example, for the fact ‘Quantity’, it could be measured at the day level, whereas the fact ‘Expected volume’ could be measured at the month level.
If business data contains facts at different levels of granularity in different tables, this is termed a multi-fact, multi-grain situation. An example is if business data included one table for fact ‘Quantity’ at date grain level, and another table for fact ‘Expected volume’ at month grain level.
�8
Facts can be analyzed with relative date analysis. For example, the fact ‘Quantity’ can be filtered to be within a range related to ‘Year To Date (YTD)’ or within a range related to ‘Current Month’. The fact ‘Year To Date [Quantity]’ and ‘Current Month [Quantity]’ are relative date based facts for the fact ‘Quantity’.
�9
Chapter 2. Double Counting
�10

1. Double Counting: DefinitionDouble counting is the incorrect aggregation of a measure due to adding a repeated value of the measure multiple times.
In the example below, the value ‘5,785’ of measure ‘Expected volume’ is repeated, as expected, but its ‘Overall - Total’ shows incorrectly as ’23,140’. The correct value is ‘5,785’. The incorrect value is considered to have occurred due to double counting.
2. Repeating ValuesIn a report or visualization, if a fact is projected down to a level below the granularity of the fact, then the fact will appear in a repeating manner. The above example shows a list report that includes both the facts ‘Quantity’ and ‘Expected volume’. The fact ‘Quantity’ has a granularity of date and the fact ‘Expected volume’ has a granularity of month.
In the report, it is expected that the values for ‘Quantity’ differ for each day, and that the values for ‘Expected volume’ differ for each month, and not the day. In the report, the fact ‘Expected volume’ is projected down to the day level. It is expected that the value of ‘Expected volume’ is repeated for every day within a particular month. Regardless of what day in the month of January 2010, the correct value for ‘Expected volume’ is always 5,785, since this is the value for the month of January 2010 for this fact.
�11

3. Undesired AggregationThe term ‘double counting’ refers to the undesired aggregation resulting from adding a fact value too many times. The term ‘double’ is used only as a general description. In fact, the counting can occur multiple times. A more accurate term is ‘over-counting’. In the example above, the row ‘Overall - Total’ shows a value of 23,140 for fact ‘Expected volume’ for the month of January 2010. This value is 4 times larger than the correct value of 5,785. The correct value is incorrectly ‘double counted’ a total of 4 times, once for each day in January in which there is a value for Quantity.
Below is an example list report showing the correct results, with double counting resolved.
�12
4. IBM Cognos Framework Manager - Determinants
In IBM Cognos Framework Manager, the issue of double counting is resolved by using determinants.
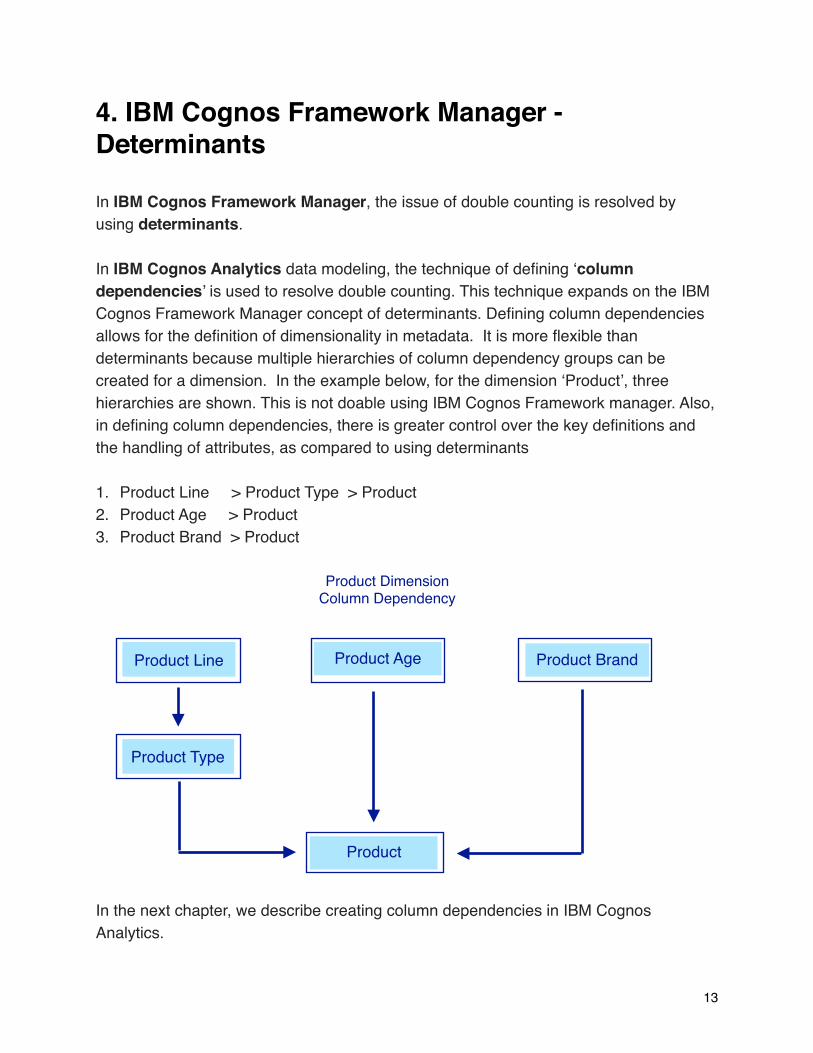
In IBM Cognos Analytics data modeling, the technique of defining ‘column dependencies’ is used to resolve double counting. This technique expands on the IBM Cognos Framework Manager concept of determinants. Defining column dependencies allows for the definition of dimensionality in metadata. It is more flexible than determinants because multiple hierarchies of column dependency groups can be created for a dimension. In the example below, for the dimension ‘Product’, three hierarchies are shown. This is not doable using IBM Cognos Framework manager. Also, in defining column dependencies, there is greater control over the key definitions and the handling of attributes, as compared to using determinants
1. Product Line > Product Type > Product2. Product Age > Product3. Product Brand > Product
In the next chapter, we describe creating column dependencies in IBM Cognos Analytics.
�13
Product Type
Product Line
Product DimensionColumn Dependency
Product Age
Product
Product Brand

Chapter 3. Column Dependencies:
Resolving Double Counting
�14
Double counting is resolved in IBM Cognos Analytics data modeling by specifying one or more column dependencies. In data modeling, if the IBM Cognos Analytics query engine is given a hint as to the hierarchical nature of the levels in a dimension, then the query engine can correctly aggregate facts, even if projected at a granularity level below the granularity of the fact. This hint is achieved by defining column dependencies in the data module.
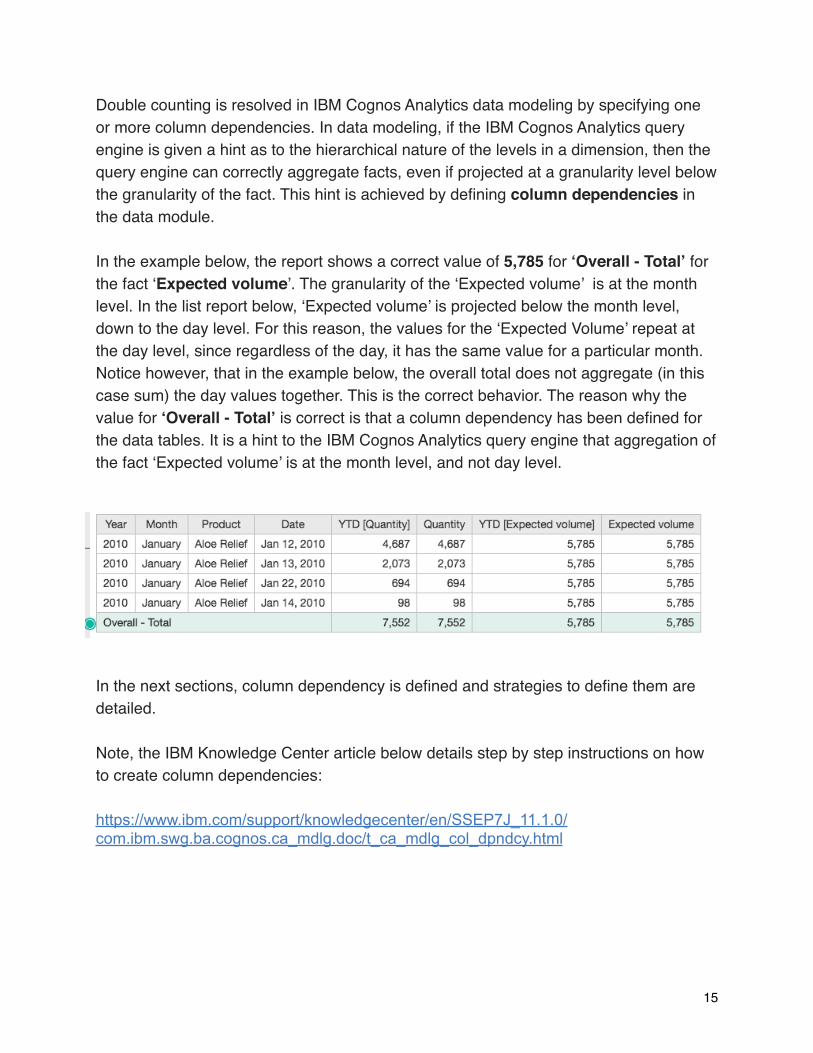
In the example below, the report shows a correct value of 5,785 for ‘Overall - Total’ for the fact ‘Expected volume’. The granularity of the ‘Expected volume’ is at the month level. In the list report below, ‘Expected volume’ is projected below the month level, down to the day level. For this reason, the values for the ‘Expected Volume’ repeat at the day level, since regardless of the day, it has the same value for a particular month. Notice however, that in the example below, the overall total does not aggregate (in this case sum) the day values together. This is the correct behavior. The reason why the value for ‘Overall - Total’ is correct is that a column dependency has been defined for the data tables. It is a hint to the IBM Cognos Analytics query engine that aggregation of the fact ‘Expected volume’ is at the month level, and not day level.
In the next sections, column dependency is defined and strategies to define them are detailed.
Note, the IBM Knowledge Center article below details step by step instructions on how to create column dependencies:
https://www.ibm.com/support/knowledgecenter/en/SSEP7J_11.1.0/com.ibm.swg.ba.cognos.ca_mdlg.doc/t_ca_mdlg_col_dpndcy.html
�15
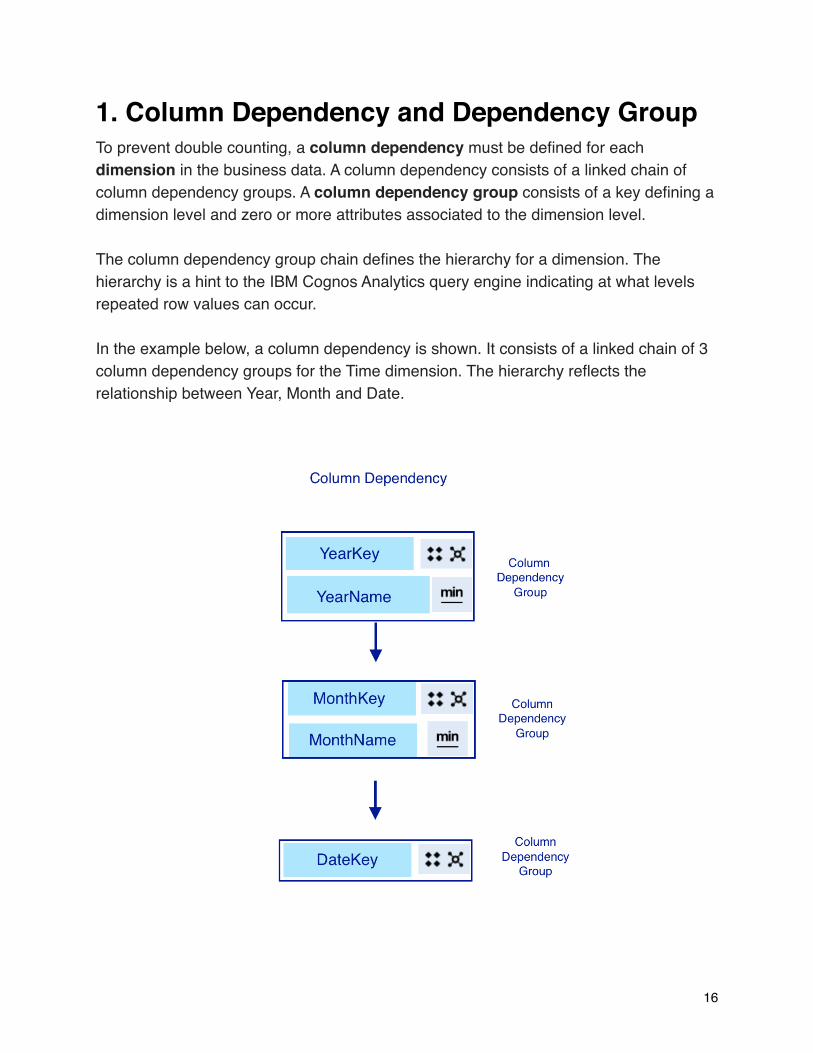
1. Column Dependency and Dependency GroupTo prevent double counting, a column dependency must be defined for each dimension in the business data. A column dependency consists of a linked chain of column dependency groups. A column dependency group consists of a key defining a dimension level and zero or more attributes associated to the dimension level.
The column dependency group chain defines the hierarchy for a dimension. The hierarchy is a hint to the IBM Cognos Analytics query engine indicating at what levels repeated row values can occur.
In the example below, a column dependency is shown. It consists of a linked chain of 3 column dependency groups for the Time dimension. The hierarchy reflects the relationship between Year, Month and Date.
�16
A column dependency group consists of one key and zero or more attributes. Keys have settings to define two elements: the key composition and the key constraint.
The key composition can be either ‘dependent’ or ‘independent’. A ‘dependent’ key is one that requires the keys from the parent column dependency groups. An ‘independent’ key does not require the keys from the parent column dependency groups.
The key constraints specify whether a key is ‘unique’, meaning it does not repeat in the table, or ‘repeating’, meaning the key does repeat in the table.
�17

2. Defining Column DependenciesThe goal in defining column dependencies is to ensure that they are defined for all dimension tables. In particular, ensure that column dependencies are defined for all dimension tables that have relationships to fact tables that use different sets of columns of a dimension table.
Column dependencies are defined at the level of a table. Each table may have zero or more column dependencies defined. The strategy in defining column dependencies is to examine each table in the data module and identify all the different situations of table normalization. For each situation, defining column dependencies may or may not be required.
There are four different situations:
In the next sections, the strategy to define column dependencies is described for each table normalization situation.
Table Normalization Situation Column Dependency Required
All tables normalized No
Dimension Table Yes
Degenerate Dimension Table Yes
Fact Table No
�18

2.1 All Tables NormalizedIf a dimension is based on a set of tables, with one table for each dimension level, then all tables for the dimension are normalized. Each dimension level is in its own table. In this case, no column dependencies need to be defined for the tables.
As an example, if the Time dimension is based on 3 tables: Year Table, Month Table and Date table, and each table contains columns specific only to the dimension level, then the tables are considered normalized. No column dependencies need to be defined for these tables.
For another example, please see Chapter 7 - Use Case A - Normalized Tables.
�19
N
1
N
Month Key
1
YearKey Year Table
Month Table
Date TableDate Key
YearLabel
YearAttribute
Month Label
Month Attribute
Date Attribute
Date Label
Time Dimension
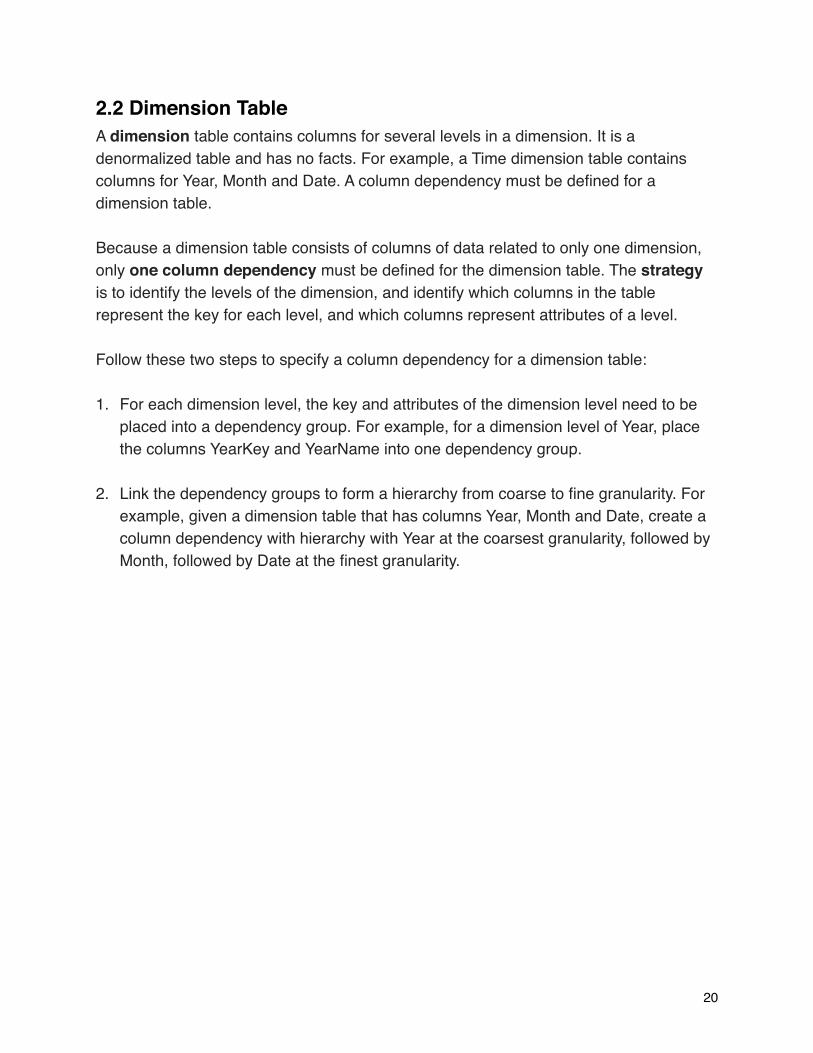
2.2 Dimension TableA dimension table contains columns for several levels in a dimension. It is a denormalized table and has no facts. For example, a Time dimension table contains columns for Year, Month and Date. A column dependency must be defined for a dimension table.
Because a dimension table consists of columns of data related to only one dimension, only one column dependency must be defined for the dimension table. The strategy is to identify the levels of the dimension, and identify which columns in the table represent the key for each level, and which columns represent attributes of a level.
Follow these two steps to specify a column dependency for a dimension table:
1. For each dimension level, the key and attributes of the dimension level need to be placed into a dependency group. For example, for a dimension level of Year, place the columns YearKey and YearName into one dependency group.
2. Link the dependency groups to form a hierarchy from coarse to fine granularity. For example, given a dimension table that has columns Year, Month and Date, create a column dependency with hierarchy with Year at the coarsest granularity, followed by Month, followed by Date at the finest granularity.
�20
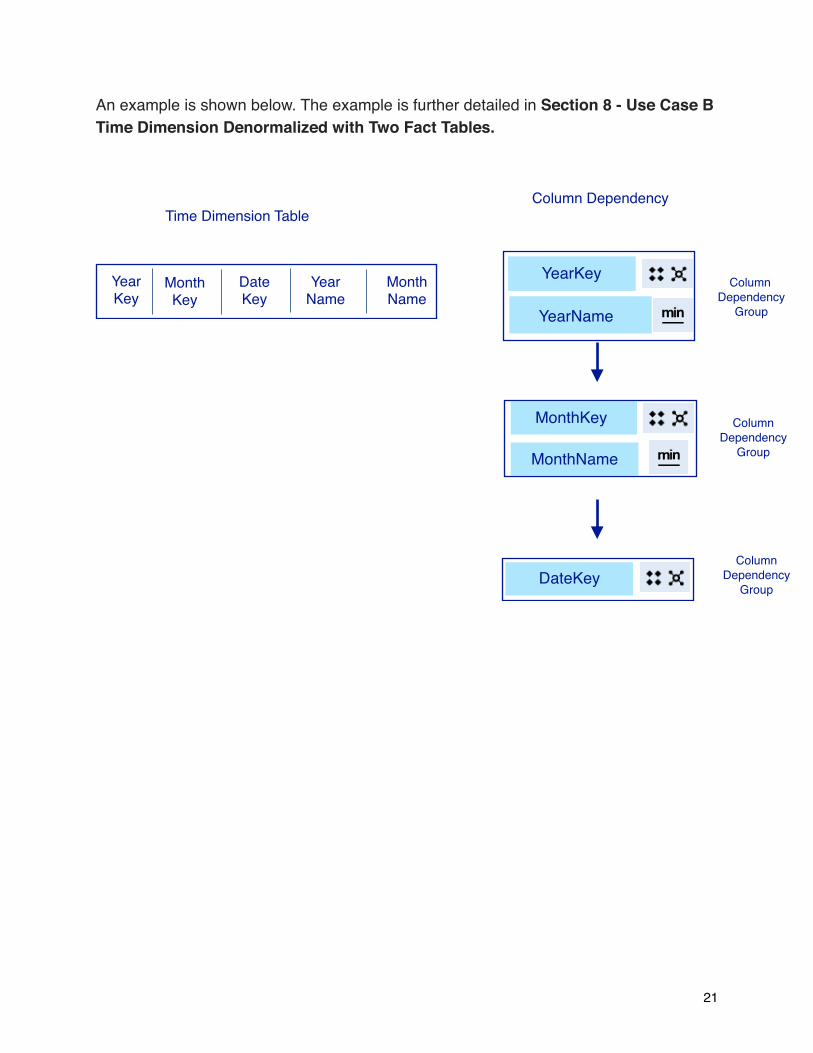
An example is shown below. The example is further detailed in Section 8 - Use Case B Time Dimension Denormalized with Two Fact Tables.
�21
Time Dimension TableColumn Dependency
YearKey
Month Key
Date Key
YearName
Month Name
MonthKey Column Dependency
GroupMonthName
YearName
DateKey
Column Dependency
Group
Column Dependency
Group
YearKey
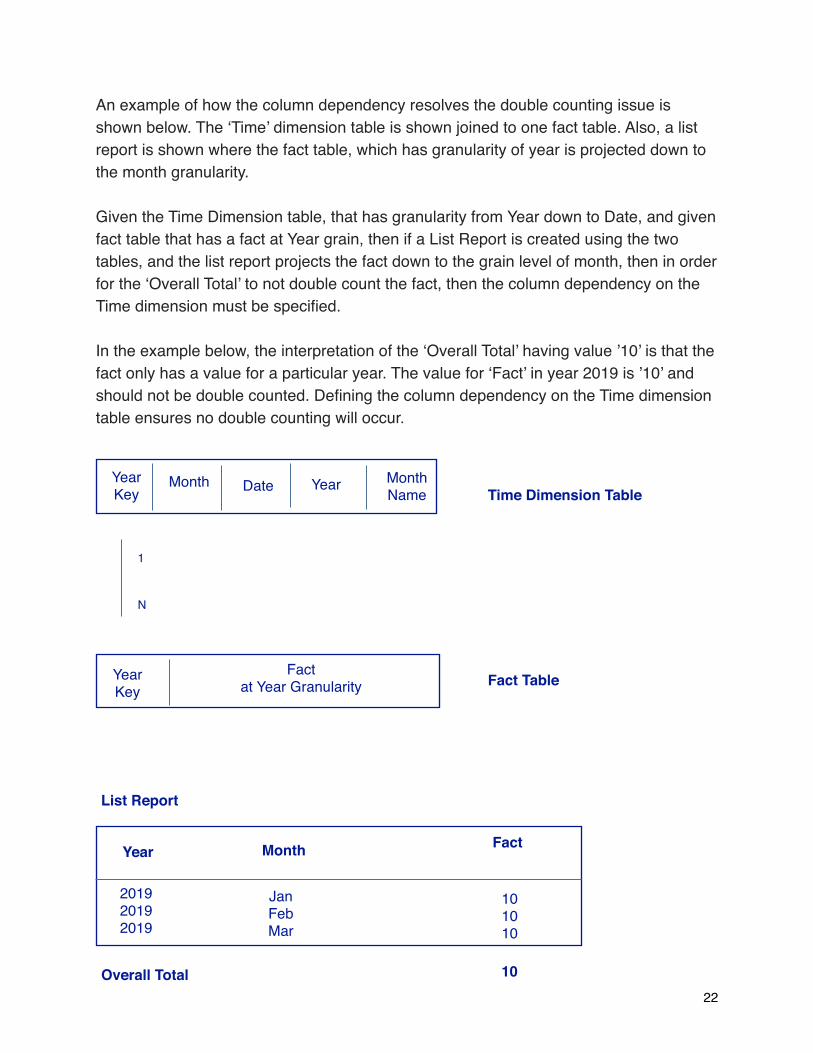
An example of how the column dependency resolves the double counting issue is shown below. The ‘Time’ dimension table is shown joined to one fact table. Also, a list report is shown where the fact table, which has granularity of year is projected down to the month granularity.
Given the Time Dimension table, that has granularity from Year down to Date, and given fact table that has a fact at Year grain, then if a List Report is created using the two tables, and the list report projects the fact down to the grain level of month, then in order for the ‘Overall Total’ to not double count the fact, then the column dependency on the Time dimension must be specified.
In the example below, the interpretation of the ‘Overall Total’ having value ’10’ is that the fact only has a value for a particular year. The value for ‘Fact’ in year 2019 is ’10’ and should not be double counted. Defining the column dependency on the Time dimension table ensures no double counting will occur.
�22
Date YearMonth Month Name
YearKey
Time Dimension Table
Fact Table
N
1
YearKey
List Report
Factat Year Granularity
Fact
201920192019
Year
Overall Total
JanFebMar
Month
10
101010
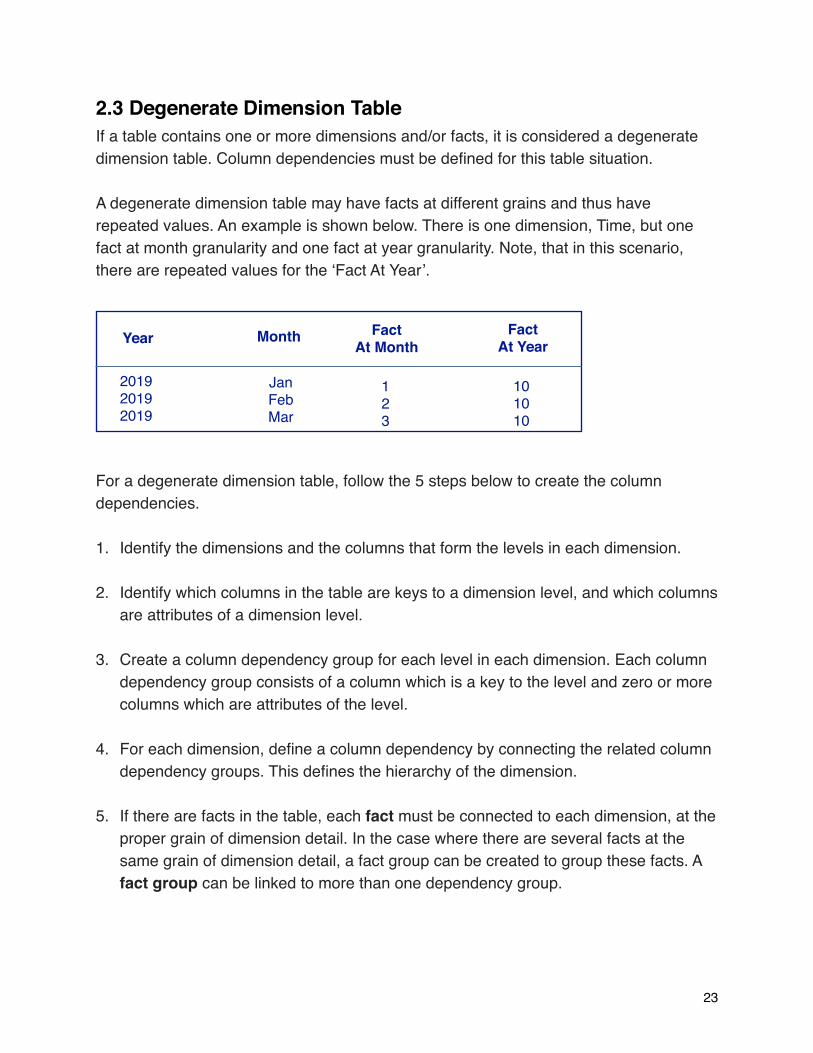
2.3 Degenerate Dimension TableIf a table contains one or more dimensions and/or facts, it is considered a degenerate dimension table. Column dependencies must be defined for this table situation.
A degenerate dimension table may have facts at different grains and thus have repeated values. An example is shown below. There is one dimension, Time, but one fact at month granularity and one fact at year granularity. Note, that in this scenario, there are repeated values for the ‘Fact At Year’.
For a degenerate dimension table, follow the 5 steps below to create the column dependencies.
1. Identify the dimensions and the columns that form the levels in each dimension.
2. Identify which columns in the table are keys to a dimension level, and which columns are attributes of a dimension level.
3. Create a column dependency group for each level in each dimension. Each column dependency group consists of a column which is a key to the level and zero or more columns which are attributes of the level.
4. For each dimension, define a column dependency by connecting the related column dependency groups. This defines the hierarchy of the dimension.
5. If there are facts in the table, each fact must be connected to each dimension, at the proper grain of dimension detail. In the case where there are several facts at the same grain of dimension detail, a fact group can be created to group these facts. A fact group can be linked to more than one dependency group.
�23
201920192019
JanFebMar
101010
Year Month FactAt Year
123
FactAt Month
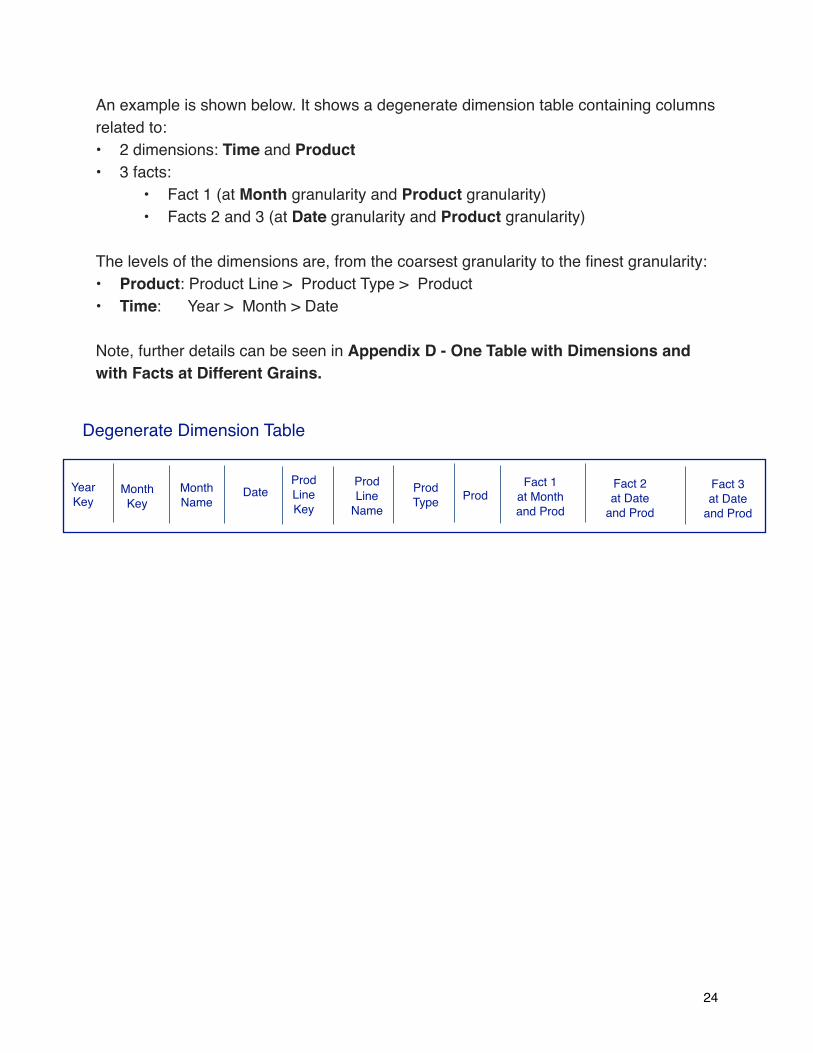
An example is shown below. It shows a degenerate dimension table containing columns related to:• 2 dimensions: Time and Product• 3 facts:
• Fact 1 (at Month granularity and Product granularity)• Facts 2 and 3 (at Date granularity and Product granularity)
The levels of the dimensions are, from the coarsest granularity to the finest granularity:• Product: Product Line > Product Type > Product• Time: Year > Month > Date
Note, further details can be seen in Appendix D - One Table with Dimensions and with Facts at Different Grains.
�24
Degenerate Dimension Table
Month Name
YearKey
Prod LineKey
Fact 1at Month and Prod
Fact 2at Date
and Prod
Fact 3at Date
and Prod
Month Key
DateProd Line
Name
Prod Type Prod
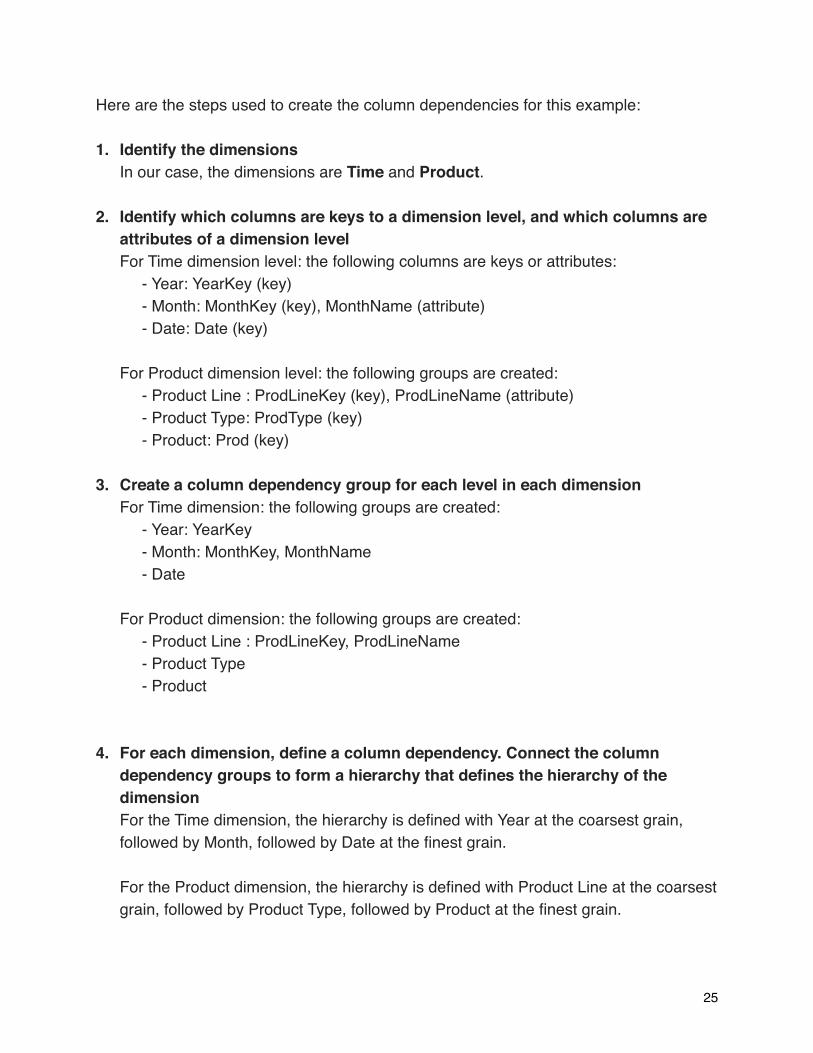
Here are the steps used to create the column dependencies for this example:
1. Identify the dimensions In our case, the dimensions are Time and Product.
2. Identify which columns are keys to a dimension level, and which columns are attributes of a dimension levelFor Time dimension level: the following columns are keys or attributes: - Year: YearKey (key) - Month: MonthKey (key), MonthName (attribute) - Date: Date (key)For Product dimension level: the following groups are created: - Product Line : ProdLineKey (key), ProdLineName (attribute) - Product Type: ProdType (key) - Product: Prod (key)
3. Create a column dependency group for each level in each dimensionFor Time dimension: the following groups are created: - Year: YearKey - Month: MonthKey, MonthName - Date For Product dimension: the following groups are created: - Product Line : ProdLineKey, ProdLineName - Product Type - Product
4. For each dimension, define a column dependency. Connect the column dependency groups to form a hierarchy that defines the hierarchy of the dimensionFor the Time dimension, the hierarchy is defined with Year at the coarsest grain, followed by Month, followed by Date at the finest grain.For the Product dimension, the hierarchy is defined with Product Line at the coarsest grain, followed by Product Type, followed by Product at the finest grain.
�25

5. If there are facts in the table, each fact must be connected to each dimension, at the proper grain of dimension detailColumn ‘Fact 1’ is linked to: - Time dimension at the Month grain - Product dimension at the Product grain Columns ‘Fact 2’ and ‘Fact 3’ are in a fact group that is linked to: - Time dimension at the Date grain - Product dimension at the Product grain
�26
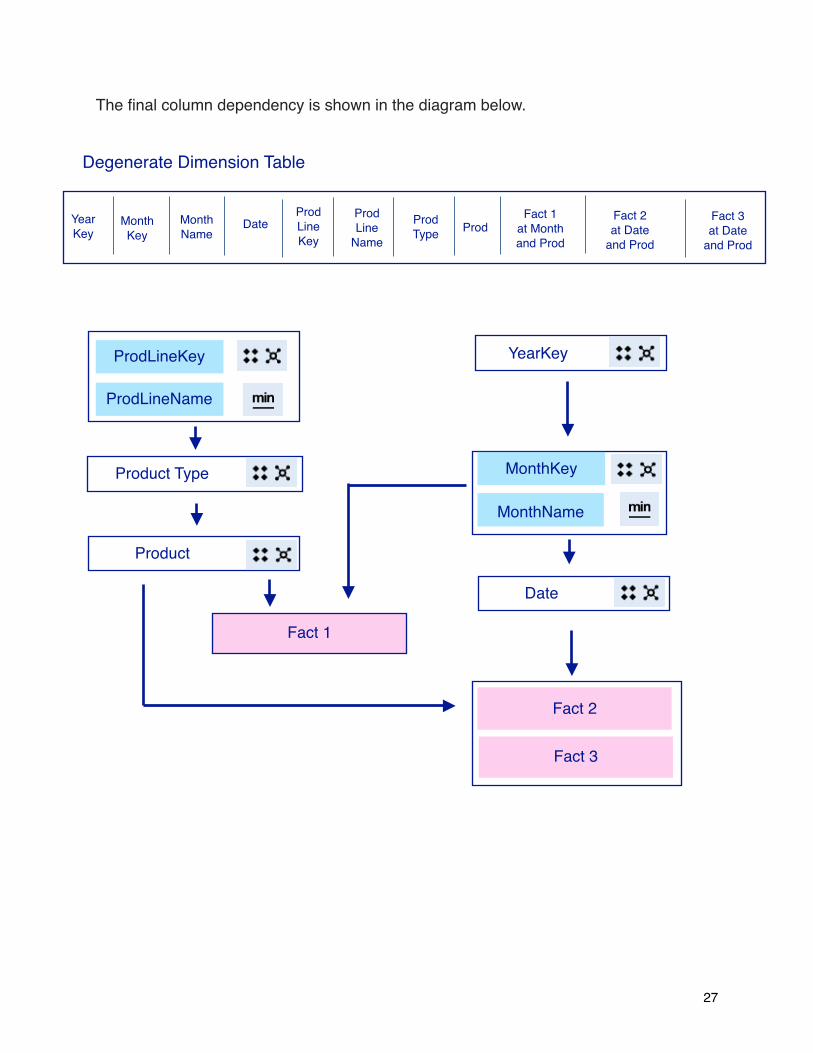
The final column dependency is shown in the diagram below.
�27
YearKey
Product Type
Product
Degenerate Dimension Table
Fact 1at Month and Prod
Fact 3at Date
and Prod
Prod Type
Fact 1
Date
YearKey
Month Key
Month Name
Prod LineKey
Prod Line
NameDate Prod
Fact 2at Date
and Prod
ProdLineKey
ProdLineName
Fact 3
Fact 2
MonthName
MonthKey
2.4 Fact TableA fact table contains one or more fact columns and columns which are keys to different dimension tables. All facts in a fact table should be at the same level of granularity. Since a fact table does not contain dimensional information, no column dependencies need to be defined for a fact table.
For an example please see Section 7 - Use Case A - Normalized Tables.
Note, if a fact table contains facts at different levels of granularity, then it must be handled as a degenerate dimension table. An example of this is if a table contains daily sales and also monthly sale totals that repeat across every day of the month. Handling a degenerate dimension table is detailed in the previous Section 2.3: Degenerate Dimension Table.
�28
Chapter 4. Relative Dates Feature
�29
In the previous chapter, the strategies are sufficient to prevent double counting when facts are not being analyzed with relative date analysis. However, if one or more facts are being analyzed with relative date analysis, then extra steps need to be done in data modeling to prevent double counting for relative date based facts.
In this chapter, an overview of the relative dates feature is described, including the issue of double counting. The relative dates feature is detailed in the IBM Knowledge Center:
https://www.ibm.com/support/knowledgecenter/en/SSEP7J_11.1.0/com.ibm.swg.ba.cognos.ca_mdlg.doc/c_ca_set_rel_date_analysis.html
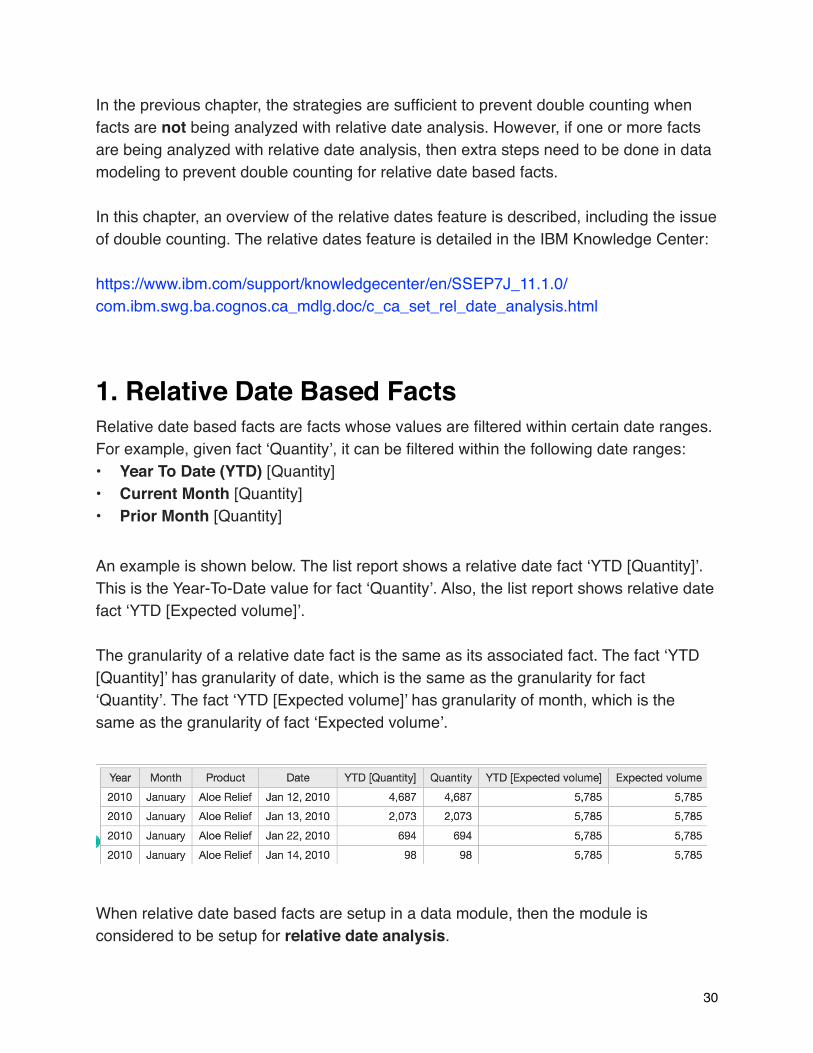
1. Relative Date Based FactsRelative date based facts are facts whose values are filtered within certain date ranges. For example, given fact ‘Quantity’, it can be filtered within the following date ranges:• Year To Date (YTD) [Quantity]• Current Month [Quantity]• Prior Month [Quantity]
An example is shown below. The list report shows a relative date fact ‘YTD [Quantity]’. This is the Year-To-Date value for fact ‘Quantity’. Also, the list report shows relative date fact ‘YTD [Expected volume]’.
The granularity of a relative date fact is the same as its associated fact. The fact ‘YTD [Quantity]’ has granularity of date, which is the same as the granularity for fact ‘Quantity’. The fact ‘YTD [Expected volume]’ has granularity of month, which is the same as the granularity of fact ‘Expected volume’.
When relative date based facts are setup in a data module, then the module is considered to be setup for relative date analysis.
�30
2. ‘Lookup reference’ PropertySetting up a fact for relative date analysis is done in IBM Cognos Analytics data modeling using a property called ‘Lookup reference’. Setting up ‘Lookup reference’ property is described in the following IBM Knowledge Center article:https://www.ibm.com/support/knowledgecenter/en/SSEP7J_11.1.0/com.ibm.swg.ba.cognos.ca_mdlg.doc/c_ca_set_rel_date_analysis.html
The setup consists of two steps:
1. Set the ‘Lookup reference’ property of one or more date columns to an IBM Cognos Analytics Calendar. These date columns are the dates against which the facts are being measured, eg ‘Sales Date’ or ‘Order Date’.
2. Set the ‘Lookup reference’ property for one or more facts to their associated date column
In the example below:
1. Date column ‘TheDate’ has its ‘Lookup reference’ property set to GregorianCalendar
2. Fact ‘Quantity’ has its ‘Lookup reference’ property set to the ‘TheDate’. The fact ‘Quantity’ is associated to date column ‘TheDate’ since this column represents the dates at which the ‘Quantity’ is measured.
�31
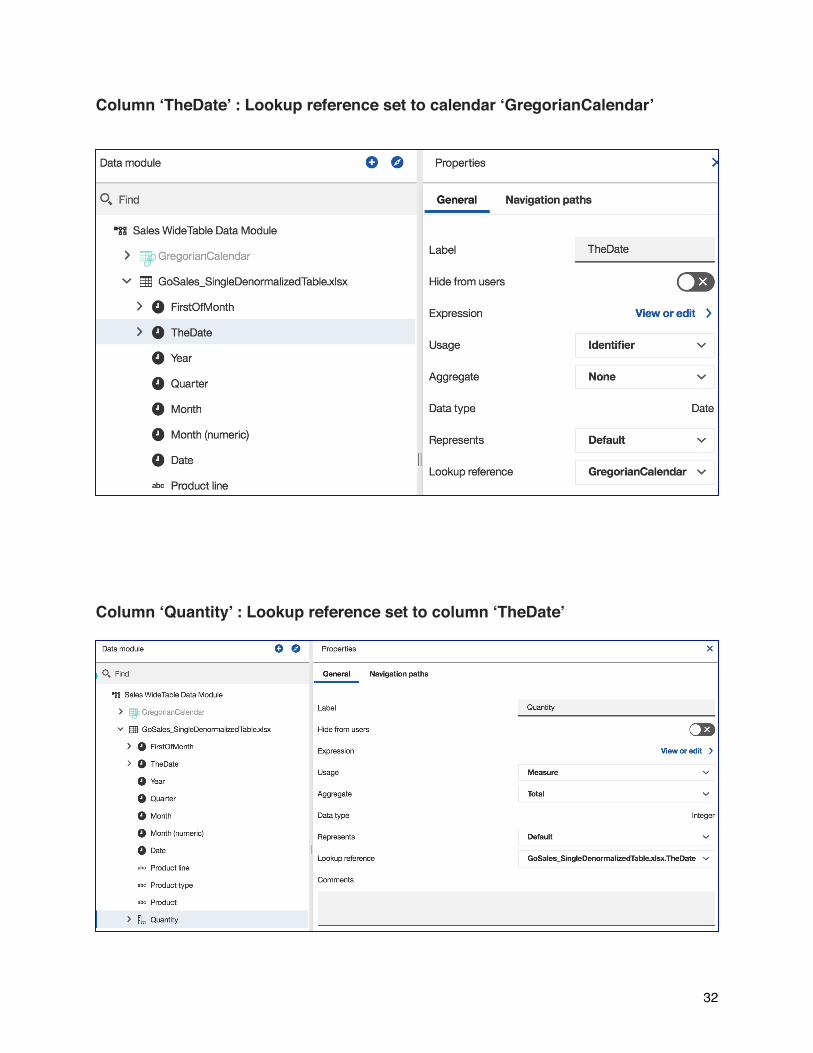
Column ‘TheDate’ : Lookup reference set to calendar ‘GregorianCalendar’
Column ‘Quantity’ : Lookup reference set to column ‘TheDate’
�32
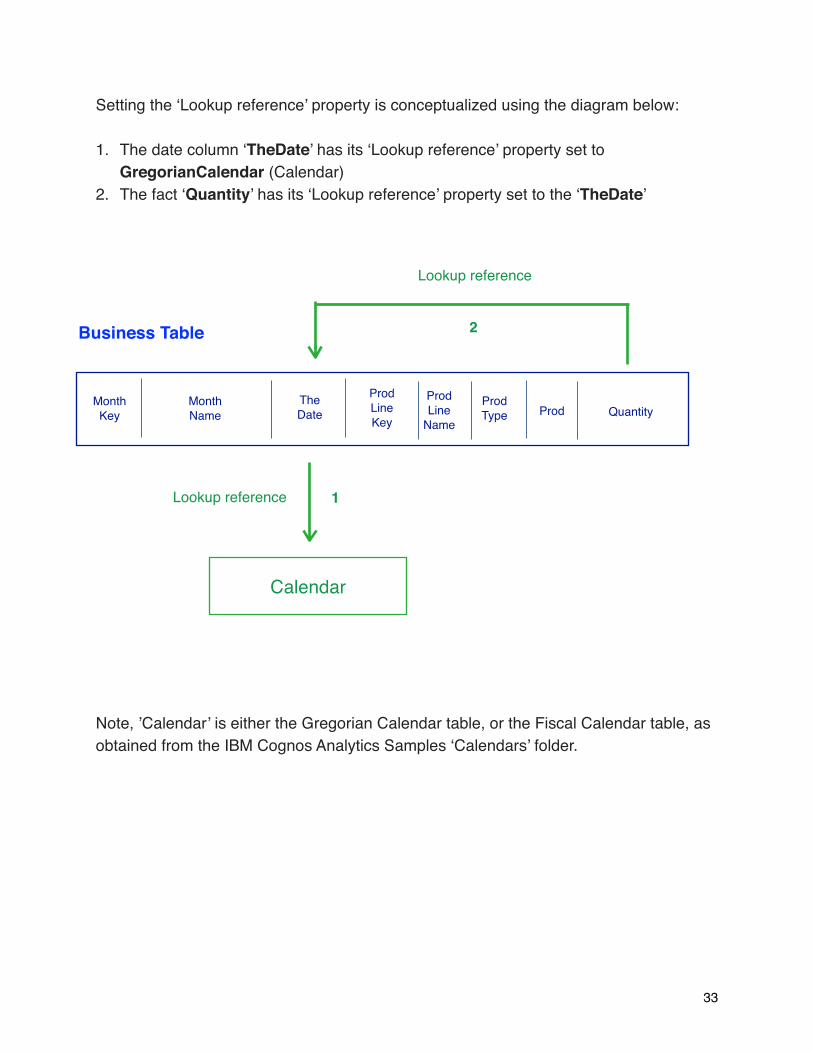
Setting the ‘Lookup reference’ property is conceptualized using the diagram below:
1. The date column ‘TheDate’ has its ‘Lookup reference’ property set to GregorianCalendar (Calendar)
2. The fact ‘Quantity’ has its ‘Lookup reference’ property set to the ‘TheDate’
Note, ’Calendar’ is either the Gregorian Calendar table, or the Fiscal Calendar table, as obtained from the IBM Cognos Analytics Samples ‘Calendars’ folder.
�33
Lookup reference
QuantityMonth Key
Month Name
TheDate
Prod LineKey
Lookup reference
Calendar
Prod Line
Name
Prod Type Prod
Business Table
1
2
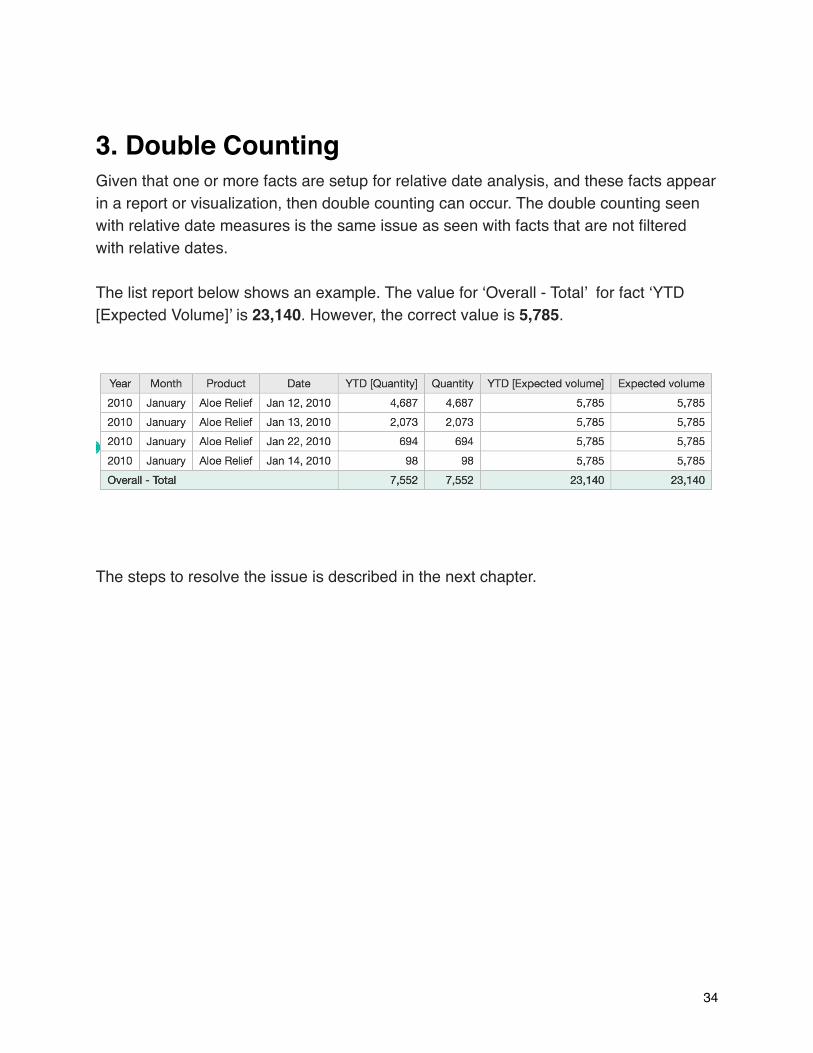
3. Double CountingGiven that one or more facts are setup for relative date analysis, and these facts appear in a report or visualization, then double counting can occur. The double counting seen with relative date measures is the same issue as seen with facts that are not filtered with relative dates.
The list report below shows an example. The value for ‘Overall - Total’ for fact ‘YTD [Expected Volume]’ is 23,140. However, the correct value is 5,785.
The steps to resolve the issue is described in the next chapter.
�34

Chapter 5. Date Columns at Fact Grain: Resolving Double Counting
�35
To prevent double counting for relative date measures, the best practices consist of 4 tasks:
1. As required, create Date columns so that each fact granularity has a Date column of matching granularity
2. For each Date column, set the ‘Lookup reference’ property to a Calendar3. For each fact column, set the ‘Lookup reference’ property to a Date column of
matching granularity4. Define column dependencies and ensure any created Date columns are included at
the correct level of granularity
These steps are detailed below.
1. Create Date Columns at Fact GrainWhat is a Date column that has granularity matching that of a fact? To be matching means that there is only a single date value for the Date column at the fact grain (eg week, month, or year). Below are 3 examples.
Date Column ‘First Of Month’If a fact is at the month grain, then a date column with matching granularity would be ‘FirstOfMonth’ and have dates in the form ‘yyyy-mm-01’. In this way, for all dates in a particular month, the Date column ‘FirstOfMonth’ has date values that are the first of the month.
Date Column ‘First Of Quarter’If a fact is at the quarter grain, then a date column with matching granularity would be ‘FirstOfQuarter’ and have dates in the form ‘yyyy-qq-01’. In this way, for all dates in a particular quarter, the date column ‘FirstOfQuarter’ has date values that are the first of the quarter.
Date Column ‘First Of Week’If a fact is at the week grain, then a Date column with matching granularity would be ‘FirstOfWeek’ and have dates in the form ‘yyyy-ww-01’. In this way, for all dates in a particular week, the date column ‘FirstOfWeek’ has date values that are the first of the week.
�36

The reason the date columns must be in the forms ‘yyyy-mm-01’, ‘yyyy-qq-01’ or ‘yyyy-ww-01’ is that they must be of type Date so that their ‘Lookup Reference’ property can be set to a Cognos Analytics Calendar.
If the above Date columns are required because facts exist at these grains, then the Date columns need to be created.
To create a date column ‘First Of Month’, it must be based on an expression that results in the form of: ‘yyyy-mm-01’. Examples of creating Date column at month grain are shown in Appendix B - Calculated Column ‘FirstOfMonth’.
To create a date column ‘First Of Quarter’, it must be based on an expression that results in the form of: ‘yyyy-qq-01’.
To create a date column ‘First of Week’, it must be based on an expression that results in the form of: ‘yyyy-ww-01’.
Note, in some cases, a Date column with a granularity of day is not in the correct form of ‘yyyy-mm-dd’. For example, the Date column may be a Date Key. In this case a Date column must be created. It must be based on an expression that results in the form of: ‘yyyy-mm-dd’. Examples are shown in Appendix A - ‘Date’ Calculated Column.
Fact Grain Date Column with Matching
Granularity
Example Column Name
Month yyyy-mm-01 2019-01-01 for all dates in Jan 2019
First Of Month
Quarter yyyy-qq-01 2019-01-01 for all dates in Q1 2019
First of Quarter
Week yyyy-ww-01 2019-01-01 for first week in 2019
First Of Week
�37
2. Date columns: ‘Lookup Reference’ -> CalendarIf one or more Date columns are created, then each created Date column must have its ‘Lookup reference’ property set to a Calendar. The Calendar is either the Gregorian Calendar table, or the Fiscal Calendar table, as obtained from the IBM Cognos Analytics Samples ‘Calendars’ folder.
3. Fact columns: ‘Lookup Reference’ -> Date ColumnAll facts must have their ‘Lookup reference’ property set to a Date column with granularity matching that of the fact. For example, for a fact at Month level, its ‘Lookup reference’ property must be set to a Date column such as ‘FirstOfMonth’.
4. Date Columns included in Column DependenciesEnsure that any created Date columns are placed into the column dependency definition at the correct granularity level. For example, the date column ‘FirstOfMonth’ must be an attribute of the month key in the column dependency group for Month.
�38
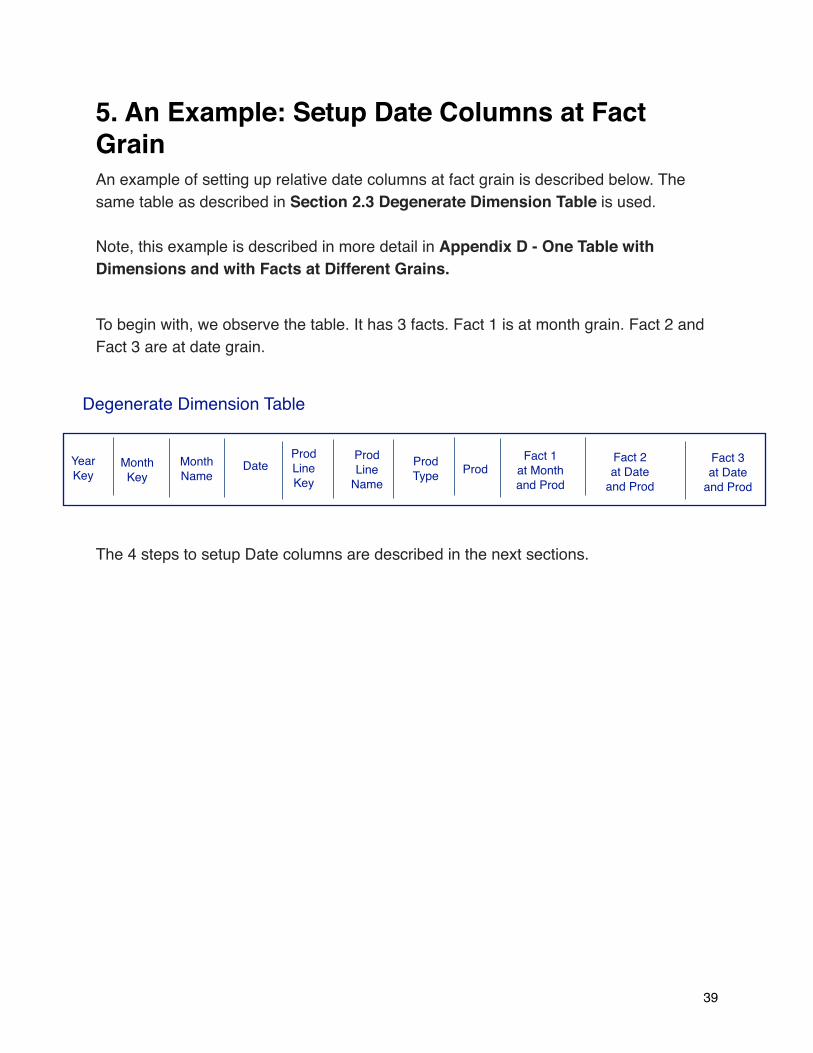
5. An Example: Setup Date Columns at Fact GrainAn example of setting up relative date columns at fact grain is described below. The same table as described in Section 2.3 Degenerate Dimension Table is used.
Note, this example is described in more detail in Appendix D - One Table with Dimensions and with Facts at Different Grains.
To begin with, we observe the table. It has 3 facts. Fact 1 is at month grain. Fact 2 and Fact 3 are at date grain.
The 4 steps to setup Date columns are described in the next sections.
�39
Degenerate Dimension Table
Month Name
YearKey
Prod LineKey
Fact 1at Month and Prod
Fact 2at Date
and Prod
Fact 3at Date
and Prod
Month Key
Date Prod Type
Prod Line
NameProd

Step 1- Create Date Columns at Fact GrainThere are 3 facts in the denormalized table, Fact1, Fact2 and Fact3. For Fact2 and Fact3 which are at the Date level, there already exists a Date column at the date level. For Fact1 which is at the month level, a Date column called ‘FirstOfMonth’ must be created. Further details are described in Appendix B - Calculated Column ‘FirstOfMonth’.
Step 2 - Date columns: ‘Lookup Reference’ set to CalendarFor the columns ‘Date’ and ‘FirstOfMonth’, set the ‘Lookup reference’ property to a Cognos Analytics Calendar, such as Gregorian Calendar or Fiscal Calendar.
Step 3 - Fact columns: ‘Lookup Reference’ set to Date ColumnFor Fact1, being at the month level, set its Lookup reference to date column ‘FirstOfMonth’. For Fact2 and Fact3, set their Lookup reference to date column ‘Date’.
�40
YearKey
Prod LineKey
Fact 1at Month and Prod
Date Prod Type
Prod Line
NameProd
Month Key
Fact 2at Date
and Prod
Fact 3at Date
and Prod
FirstOfMonth
Month Name
Calendar
Lookup reference
Lookup reference
Degenerate Dimension Table
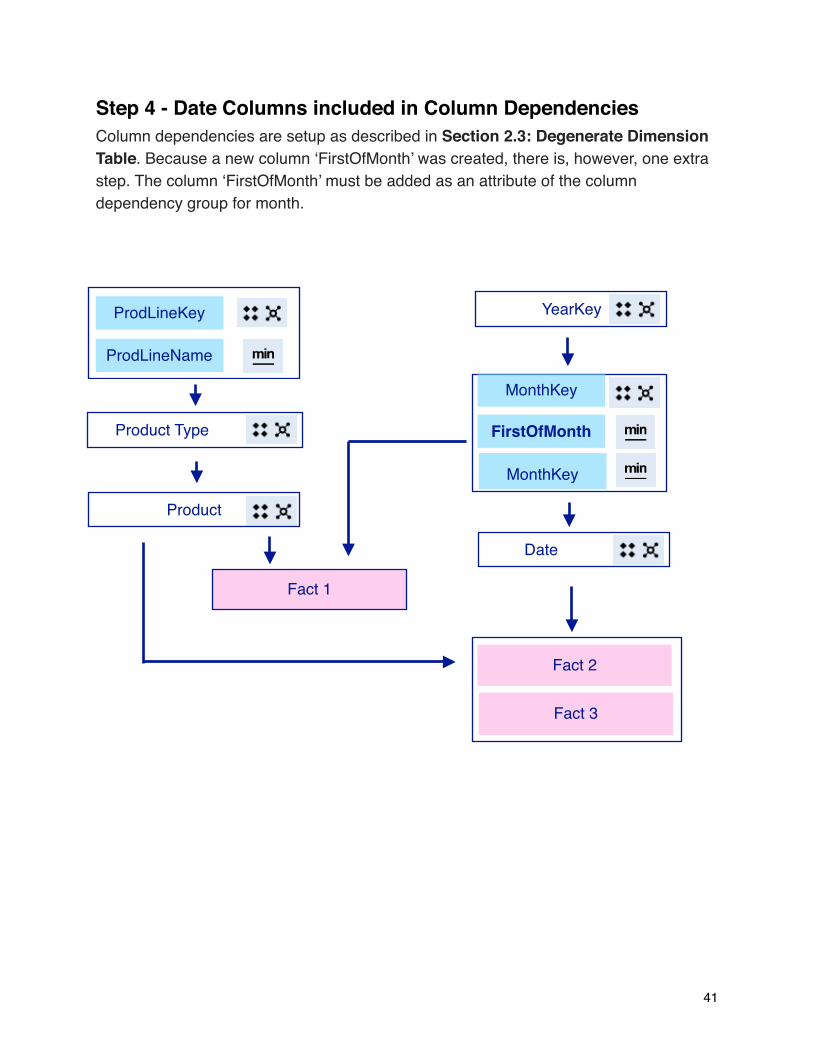
Step 4 - Date Columns included in Column DependenciesColumn dependencies are setup as described in Section 2.3: Degenerate Dimension Table. Because a new column ‘FirstOfMonth’ was created, there is, however, one extra step. The column ‘FirstOfMonth’ must be added as an attribute of the column dependency group for month.
�41
YearKeyProdLineKey
ProdLineName
Product Type
MonthKey
Product
Date
Fact 1
Fact 2
Fact 3
MonthKey
FirstOfMonth

Chapter 6. Best Practices to
Resolve Double Counting
�42
Based on the preceding chapters, the best practices to resolve the issue of double counting are summarized as two tasks:
• Task 1 - Define Column Dependencies• Task 2 - Setup Date Columns at Fact Grain
Task 2 is required only if business data is modeled using relative date analysis. This occurs if facts have their ‘Lookup reference’ property set to a Date column. Task 2 consists of four steps:
1. Create date columns at fact grain2. Date columns: ‘Lookup reference’ property set to Calendar3. Fact columns: ‘Lookup reference’ property set to Date Column4. Date columns included in column dependencies
Following these best practices ensures that facts are aggregated correctly based on their level of granularity in a dimension. This ensures that no double counting occurs.
�43
Chapter 7. Use Case A -
Normalized Tables
�44
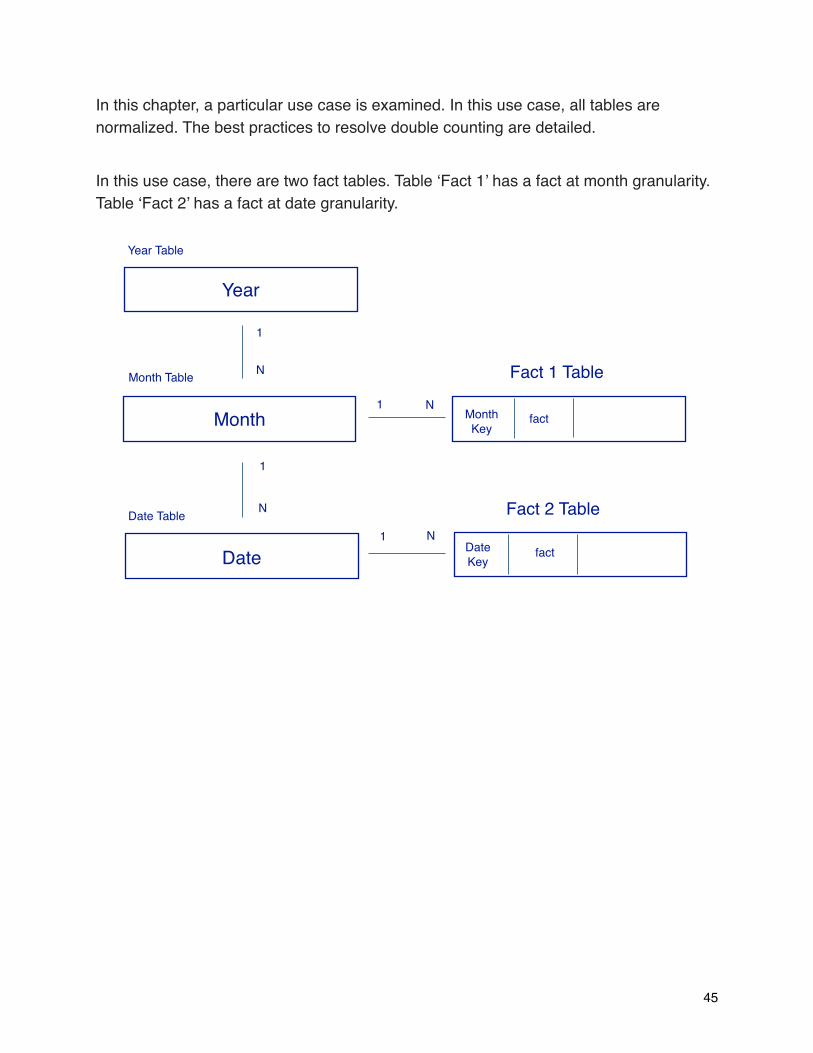
In this chapter, a particular use case is examined. In this use case, all tables are normalized. The best practices to resolve double counting are detailed.
In this use case, there are two fact tables. Table ‘Fact 1’ has a fact at month granularity. Table ‘Fact 2’ has a fact at date granularity.
�45
Year
Month
Date
N
1
1
N
Fact 1 Table
fact1 N
factDate Key
Fact 2 Table1 N
Month Key
Year Table
Month Table
Date Table
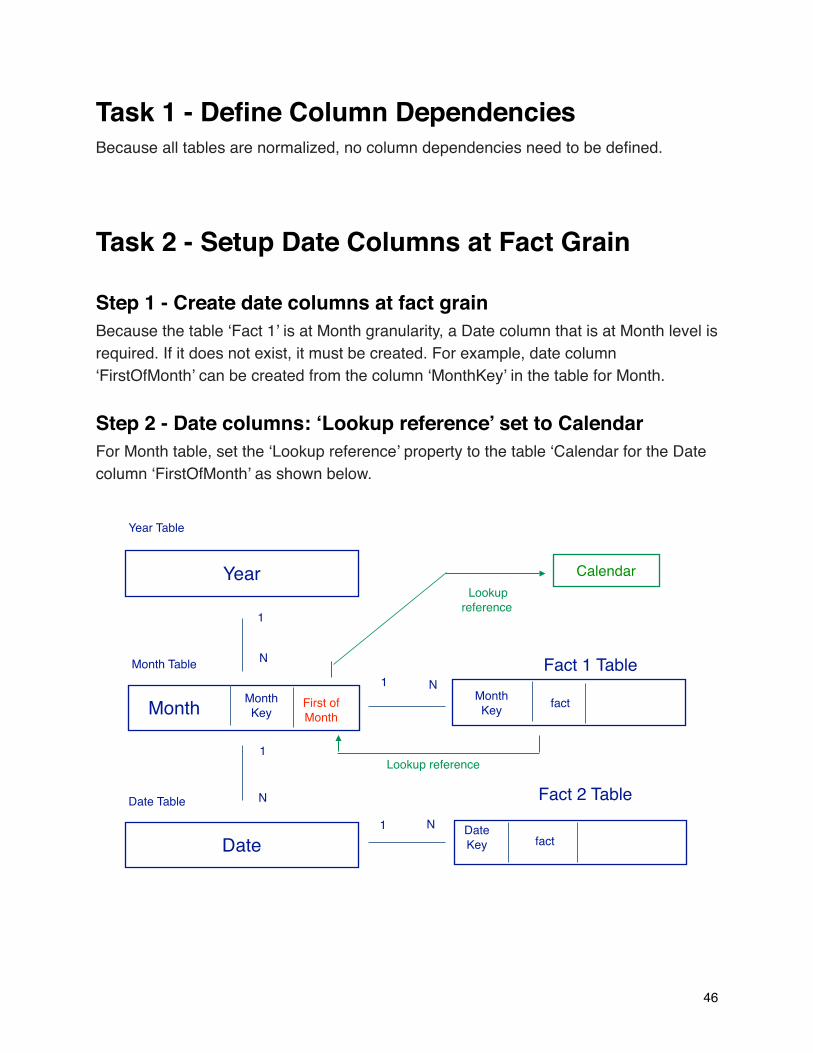
Task 1 - Define Column DependenciesBecause all tables are normalized, no column dependencies need to be defined.
Task 2 - Setup Date Columns at Fact Grain
Step 1 - Create date columns at fact grainBecause the table ‘Fact 1’ is at Month granularity, a Date column that is at Month level is required. If it does not exist, it must be created. For example, date column ‘FirstOfMonth’ can be created from the column ‘MonthKey’ in the table for Month.
Step 2 - Date columns: ‘Lookup reference’ set to CalendarFor Month table, set the ‘Lookup reference’ property to the table ‘Calendar for the Date column ‘FirstOfMonth’ as shown below.
�46
Year
N
fact
Date factDateKey
1 N
1
N
Month
1
Fact 1 Table
Lookup reference
Calendar
Lookup reference
First of Month
Month Key
N1Month Key
Fact 2 Table
Year Table
Month Table
Date Table

Step 3 - Fact columns: ‘Lookup reference’ set to Date columnFor table ‘Fact 1’, set the ‘Lookup reference’ property for fact column ‘fact’ to the Date column ‘FirstOfMonth’.
Repeat Steps 2 and 3 for fact table 2. Because the table ‘Fact 2’ is at the Date granularity, the ‘Lookup reference’ property is done at the Date level, as shown below.
Step 4 - Date columns included in column dependenciesBecause all tables for the Time dimension are normalized, no column dependencies need to be defined. Also, the fact tables do not require a column dependency definition.
�47
Year
Fact 1
1
NMonth
Fact 2
Month1
N
fact
Date fact1 N
Date
Lookup referenceLookup reference
Date
Calendar
Year Table
Month Table
Date Table
Chapter 8. Use Case B - Time
Dimension Denormalized
�48
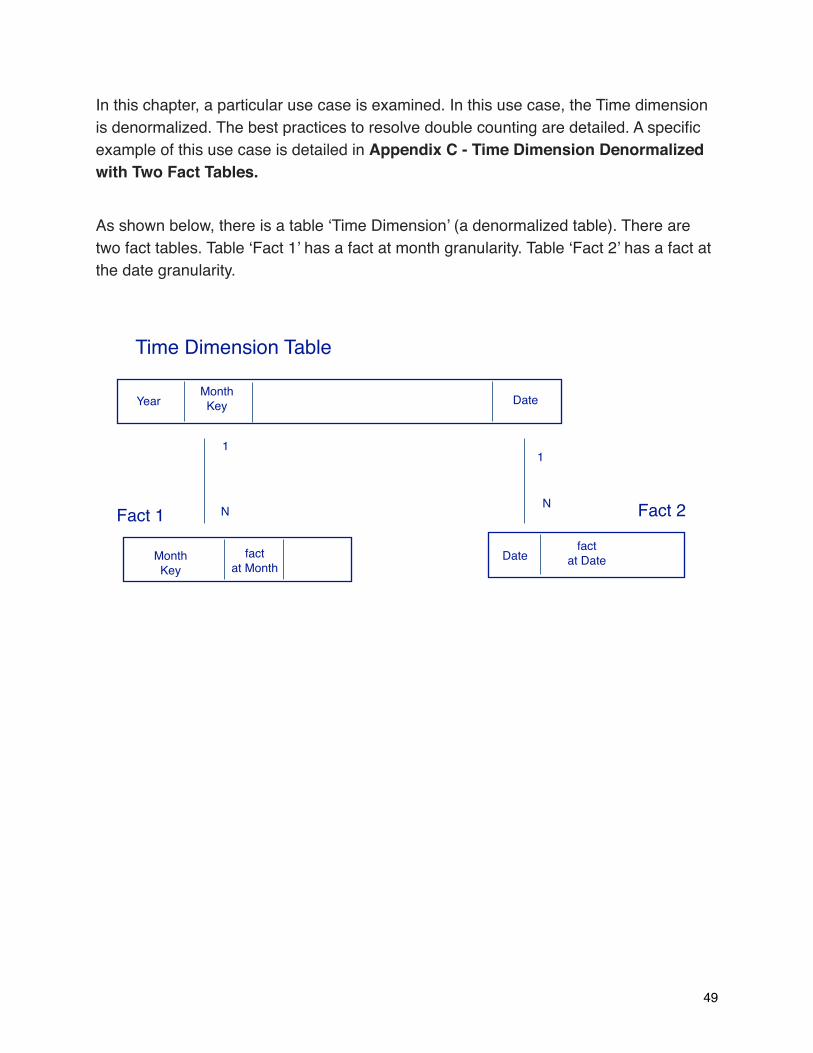
In this chapter, a particular use case is examined. In this use case, the Time dimension is denormalized. The best practices to resolve double counting are detailed. A specific example of this use case is detailed in Appendix C - Time Dimension Denormalized with Two Fact Tables.
As shown below, there is a table ‘Time Dimension’ (a denormalized table). There are two fact tables. Table ‘Fact 1’ has a fact at month granularity. Table ‘Fact 2’ has a fact at the date granularity.
�49
1
factat Month
Month KeyYear Date
Time Dimension Table
Fact 2N
1
N
DateMonth Key
factat Date
Fact 1
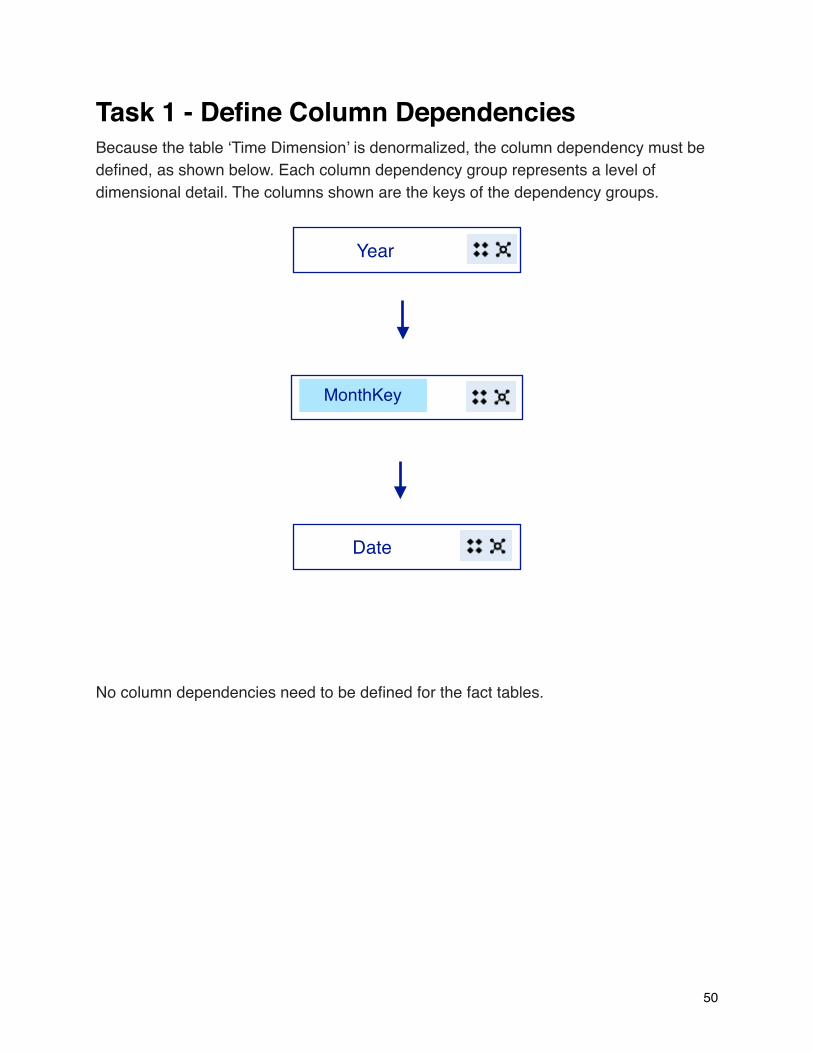
Task 1 - Define Column DependenciesBecause the table ‘Time Dimension’ is denormalized, the column dependency must be defined, as shown below. Each column dependency group represents a level of dimensional detail. The columns shown are the keys of the dependency groups.
No column dependencies need to be defined for the fact tables.
�50
Year
MonthKey
Date

Task 2 - Setup Date Columns at Fact Grain
Step 1 - Create date columns at fact grainBecause the table ‘Fact 1’ is at the Month granularity, a Date column at the Month granularity must exist. If it does not exist, it must be created. In this example, column ‘FirstOfMonth’ must be created and added to table Time Dimension.
Step 2 - Date columns: ‘Lookup reference’ set to CalendarIn ‘Time Dimension’ table, set the ‘Lookup reference’ property to the table ‘Calendar for the Date column ‘FirstOfMonth’ as shown below.
Step 3 - Fact columns: ‘Lookup reference’ set to Date columnFor ‘Fact 1’ table, set the ‘Lookup reference’ property to the Date column ‘FirstOfMonth’ for fact column ‘fact at Month’.
�51
DateYear MonthKey
11
NN
DateMonth Key
Time Dimension Table
First of Month
Fact 1 Fact 2
Calendar
Lookup reference
Lookup reference
Lookup reference
Lookup reference
factat Month
factat Date
Repeat Steps 2 and 3 for fact table ‘Fact2’. Because the table ‘Fact 2’ is at the Date granularity, the ‘Lookup reference’ property is done at the Date level, as shown above.
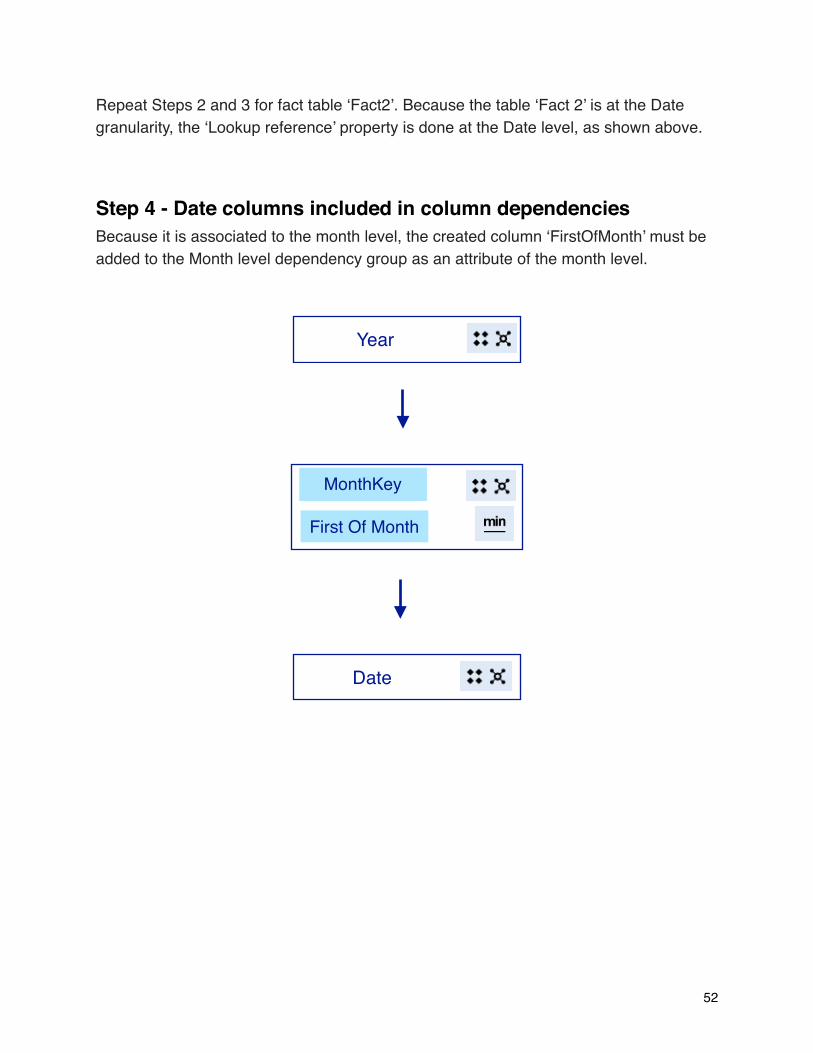
Step 4 - Date columns included in column dependenciesBecause it is associated to the month level, the created column ‘FirstOfMonth’ must be added to the Month level dependency group as an attribute of the month level.
�52
Year
MonthKey
First Of Month
Date
Conclusion
�53

This document describes the best practices to prevent double counting which can occur in multi-fact, multi-grain scenarios, including with relative date analysis. The best practices are summarized as two tasks:
• Task 1 - Define Column Dependencies• Task 2 - Setup Date Columns at Fact Grain
Task 2 is required only if relative date analysis is being modeled. This occurs if facts have their ‘Lookup reference’ property set to a Date column. Task 2 consists of four steps:
1. Create date columns at fact grain2. Date columns: ‘Lookup reference’ property set to Calendar3. Fact columns: ‘Lookup reference’ property set to Date Column4. Date columns included in column dependencies
Following these best practices ensures that facts are aggregated correctly based on their level of granularity in a dimension. This ensures that no double counting occurs.
�54
Appendices
�55
Appendix A - ‘Date’ Calculated Column
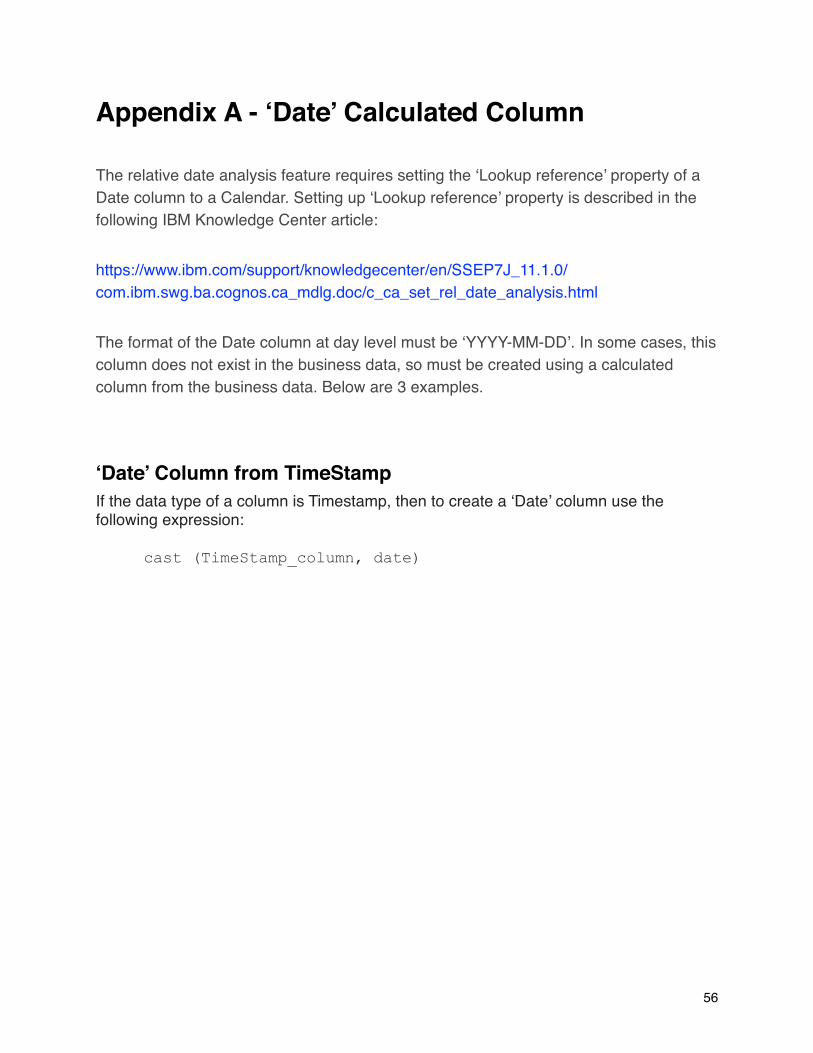
The relative date analysis feature requires setting the ‘Lookup reference’ property of a Date column to a Calendar. Setting up ‘Lookup reference’ property is described in the following IBM Knowledge Center article:
https://www.ibm.com/support/knowledgecenter/en/SSEP7J_11.1.0/com.ibm.swg.ba.cognos.ca_mdlg.doc/c_ca_set_rel_date_analysis.html
The format of the Date column at day level must be ‘YYYY-MM-DD’. In some cases, this column does not exist in the business data, so must be created using a calculated column from the business data. Below are 3 examples.
‘Date’ Column from TimeStampIf the data type of a column is Timestamp, then to create a ‘Date’ column use the following expression:
cast (TimeStamp_column, date)
�56
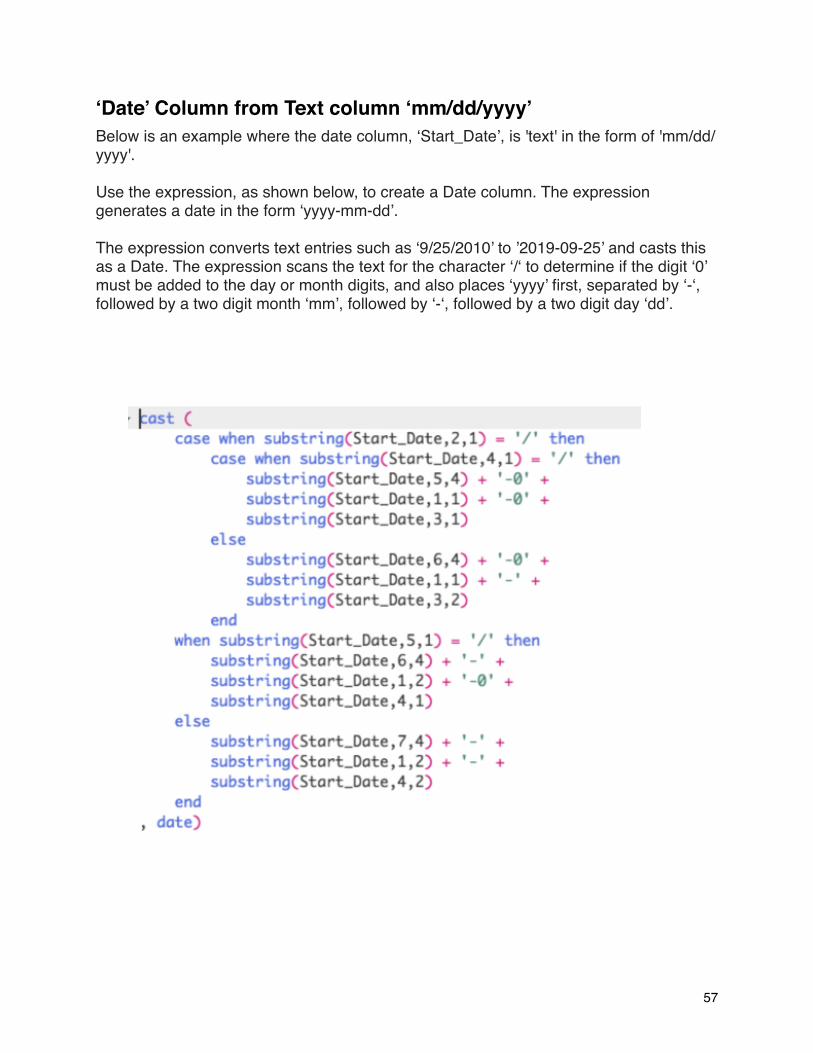
‘Date’ Column from Text column ‘mm/dd/yyyy’Below is an example where the date column, ‘Start_Date’, is 'text' in the form of 'mm/dd/yyyy'.
Use the expression, as shown below, to create a Date column. The expression generates a date in the form ‘yyyy-mm-dd’.
The expression converts text entries such as ‘9/25/2010’ to ’2019-09-25’ and casts this as a Date. The expression scans the text for the character ‘/‘ to determine if the digit ‘0’ must be added to the day or month digits, and also places ‘yyyy’ first, separated by ‘-‘, followed by a two digit month ‘mm’, followed by ‘-‘, followed by a two digit day ‘dd’.
�57

Appendix B - ‘FirstOfMonth’ Calculated ColumnThe relative date analysis feature requires setting the ‘Lookup reference’ property of a Date column to a Calendar. Setting up ‘Lookup reference’ property is described in the following IBM Knowledge Center article:
https://www.ibm.com/support/knowledgecenter/en/SSEP7J_11.1.0/com.ibm.swg.ba.cognos.ca_mdlg.doc/c_ca_set_rel_date_analysis.html
The format of the date column that has month level granularity is suggested to be ‘YYYY-MM-01’. This ensures it is a Date column and that it can have its ‘Lookup reference’ property set to an IBM Cognos Analytics Calendar. Also, because there is only the first day, ’-01’, used for any day within a month, then this format ensures that there is only one date that represents the Month level.
In some cases, this column does not exist in the business data, so must be created using a calculated column from the business data. Below are two examples.
‘FirstOfMonth’ column from ‘MonthKey’ column
Here is an example to calculate the ‘FirstOfMonth’ Date column.
�58
MonthKeyFirstOfMonth

Use this expression:
cast ( substring(cast(MONTH_KEY as varchar(8)),1,4 ) || '-' + substring(cast(MONTH_KEY as varchar(8)),5,2 ) || '-01' , date)
‘FirstOfMonth’ column from ‘Date’ columnHere is an example to calculate ‘FirstOfMonth’ Date column from a Date column.
_first_of_month( Date )
�59
Appendix C - Time Dimension Denormalized with Two Fact Tables
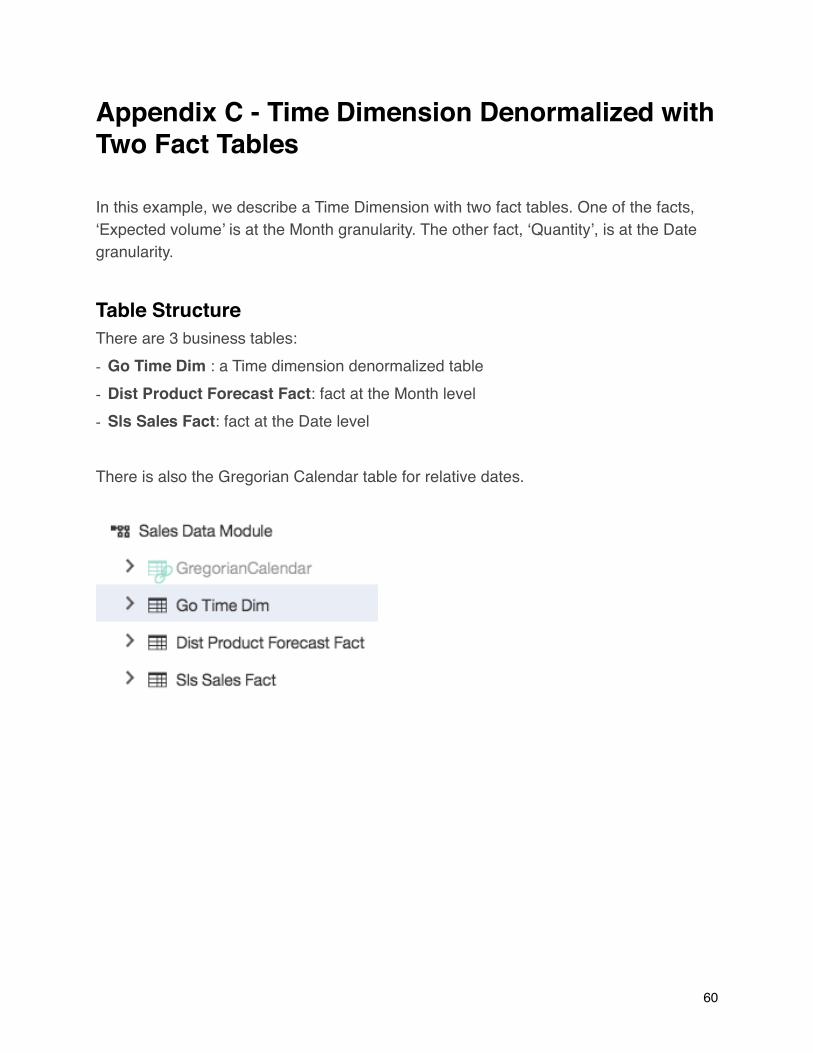
In this example, we describe a Time Dimension with two fact tables. One of the facts, ‘Expected volume’ is at the Month granularity. The other fact, ‘Quantity’, is at the Date granularity.
Table StructureThere are 3 business tables:- Go Time Dim : a Time dimension denormalized table- Dist Product Forecast Fact: fact at the Month level- Sls Sales Fact: fact at the Date level
There is also the Gregorian Calendar table for relative dates.
�60
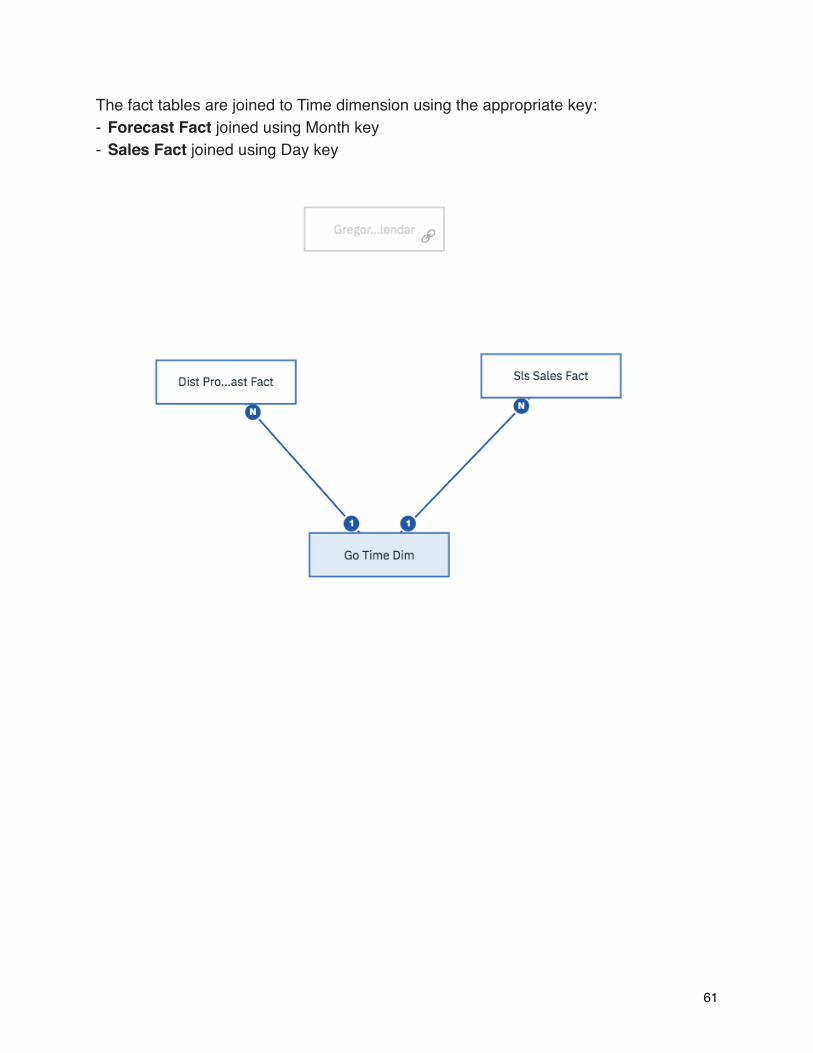
The fact tables are joined to Time dimension using the appropriate key:- Forecast Fact joined using Month key- Sales Fact joined using Day key
�61
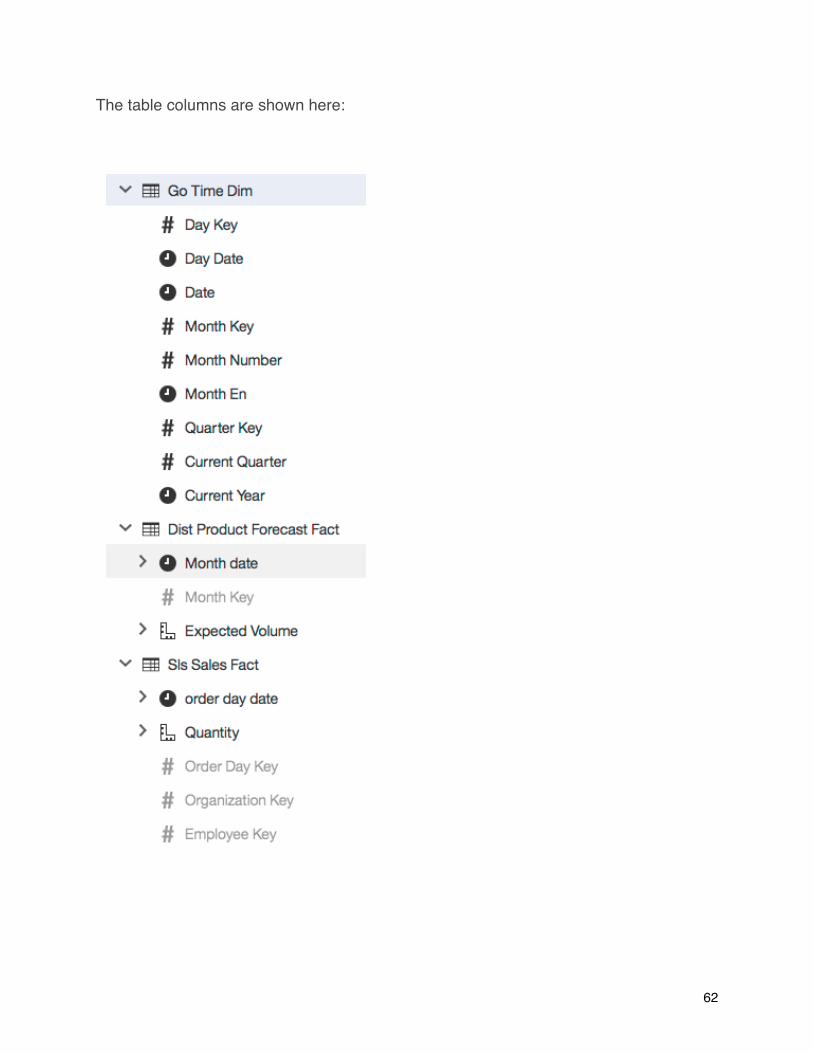
The table columns are shown here:
�62

Task 1 - Define Column DependenciesThe table ‘Go Time Dim’ is a denormalized table. It contains dimension levels Year, Quarter and Date. Being denormalized, it requires a column dependency, as shown below.
�63
Task 2 - Setup Date Columns at Fact Grain
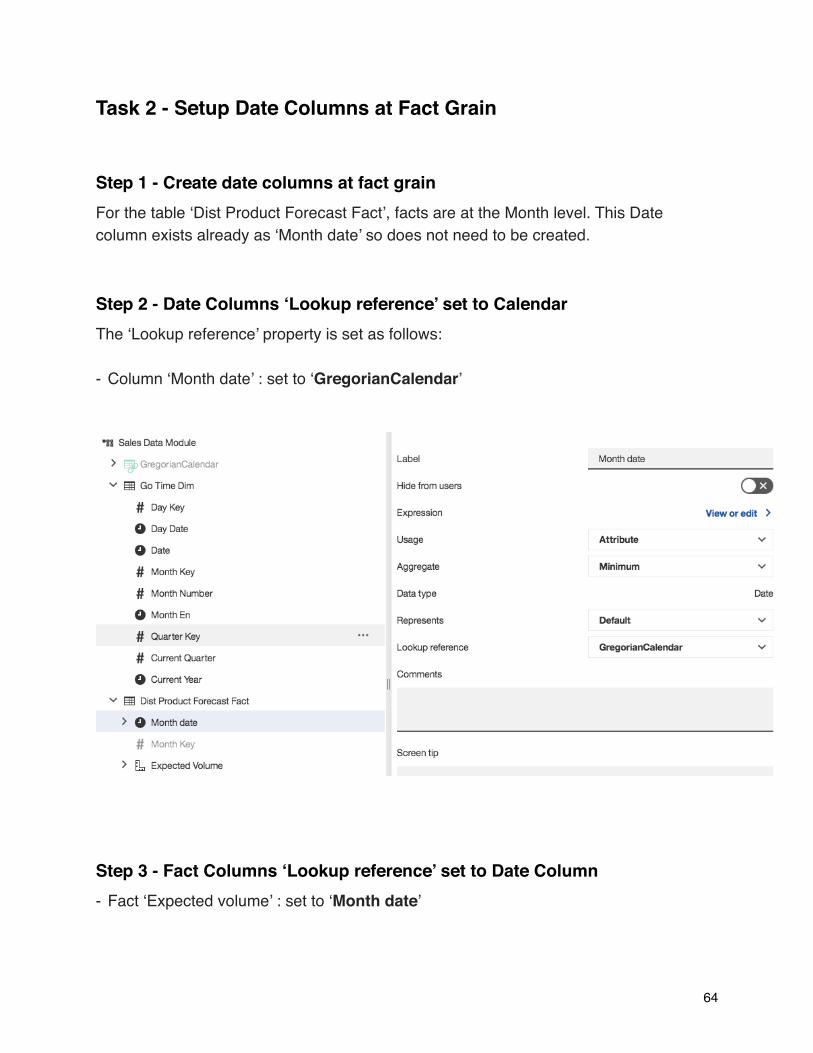
Step 1 - Create date columns at fact grainFor the table ‘Dist Product Forecast Fact’, facts are at the Month level. This Date column exists already as ‘Month date’ so does not need to be created.
Step 2 - Date Columns ‘Lookup reference’ set to CalendarThe ‘Lookup reference’ property is set as follows:
- Column ‘Month date’ : set to ‘GregorianCalendar’
Step 3 - Fact Columns ‘Lookup reference’ set to Date Column- Fact ‘Expected volume’ : set to ‘Month date’
�64

Repeat Steps 2 and 3 for table ‘Sls Sales Fact’, where facts are at Date level. The ‘Lookup reference’ property is set as follows:
- Column ‘order day date’ : set to ‘GregorianCalendar’- Fact ‘Quantity’ : set to ‘order day date’
Step 4 - Date Columns included in Column DependenciesNo extra date columns needed to be created, so the column dependency for the table ‘Go Time Dim’ defined in Task 1 does not need any extra date columns to be added.
�65

Final Result: List Report with No Double CountingA list report generated against the tables shows repeated values for ‘Expected Volume’. This is because the report projects the fact to Date, which is below the fact grain for ‘Expected Volume’, which is month. The objective of this exercise is to demonstrate how column dependency prevents double counting. The list shows values for ‘Overall - Total’ that confirm there is no double counting. This is seen for both the Expected Volume as well as its relative date measure YTD (Year To Date). A correct value of ‘1,224,340’ is shown for ‘Overall - Total’ for fact ‘Expected Volume’. This is the value for the month of January, and is not summed across the days in January.
�66

Appendix D - One Table with Dimensions and with Facts at Different Grains
In this example, we describe a table with two facts (‘Quantity’ and ‘Expected volume’) and two dimensions (Time and Products). One of the facts, ‘Expected volume’, is at the Month granularity. The other fact, ‘Quantity’, is at the Date granularity. The Time dimension has levels: Year, Quarter, Month and Date. The Product dimension has levels: Product Line, Product Type and Product.
Table StructureThe table is a degenerate dimension table, and contains columns as below:
�67

Table DataBelow is an example of the data for the table. Note that the values for ‘Quantity’ have values at the day level. The values for ‘Expected volume’ have values at the month level.
�68
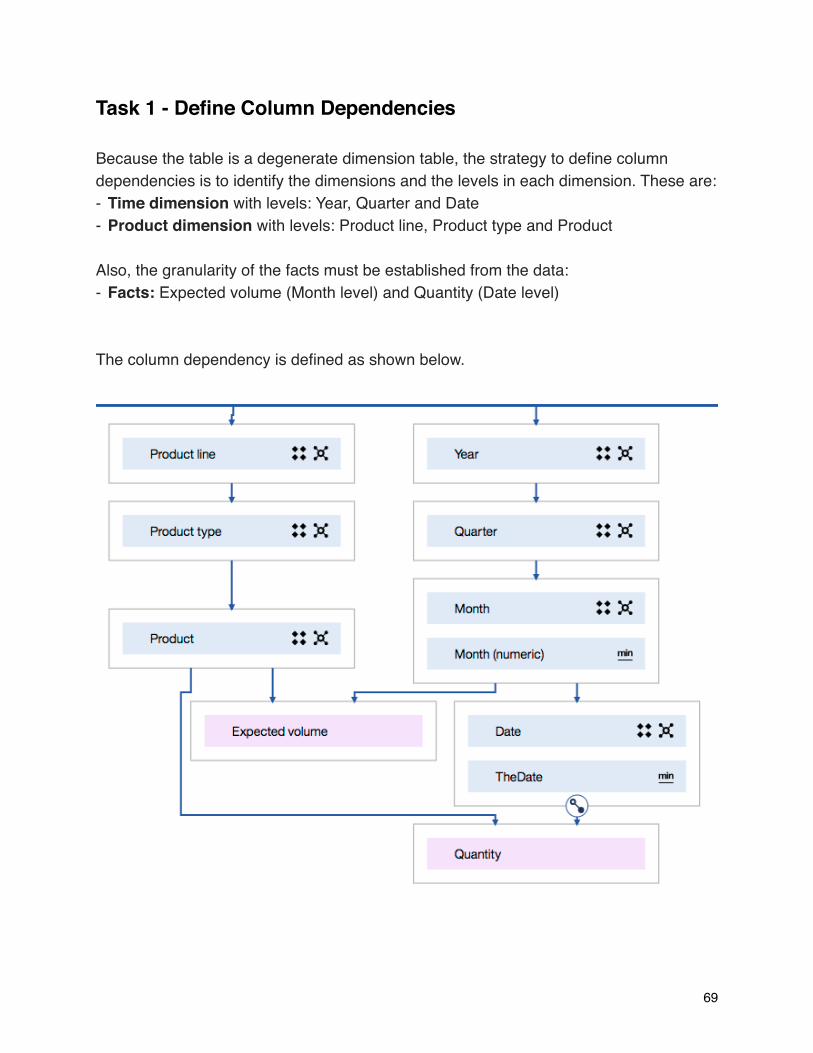
Task 1 - Define Column Dependencies
Because the table is a degenerate dimension table, the strategy to define column dependencies is to identify the dimensions and the levels in each dimension. These are:- Time dimension with levels: Year, Quarter and Date- Product dimension with levels: Product line, Product type and Product
Also, the granularity of the facts must be established from the data:- Facts: Expected volume (Month level) and Quantity (Date level)
The column dependency is defined as shown below.
�69
Task 2 - Setup Date Columns at Fact Grain
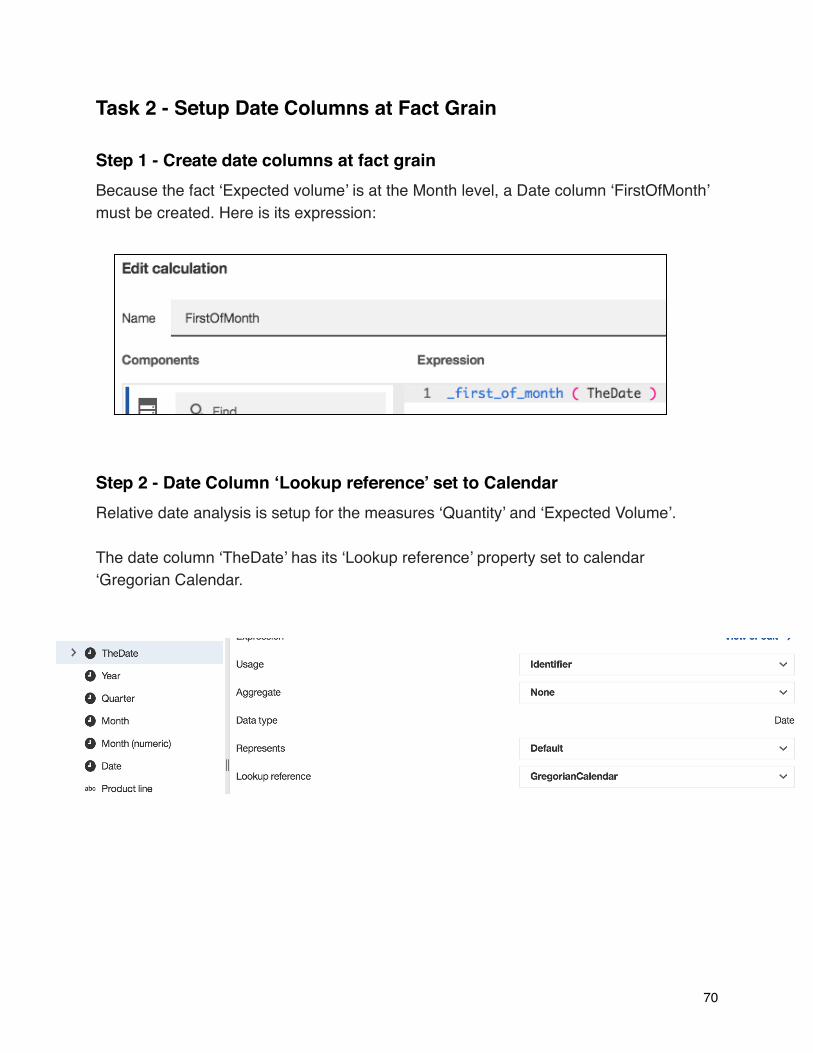
Step 1 - Create date columns at fact grainBecause the fact ‘Expected volume’ is at the Month level, a Date column ‘FirstOfMonth’ must be created. Here is its expression:
Step 2 - Date Column ‘Lookup reference’ set to CalendarRelative date analysis is setup for the measures ‘Quantity’ and ‘Expected Volume’.
The date column ‘TheDate’ has its ‘Lookup reference’ property set to calendar ‘Gregorian Calendar.
�70
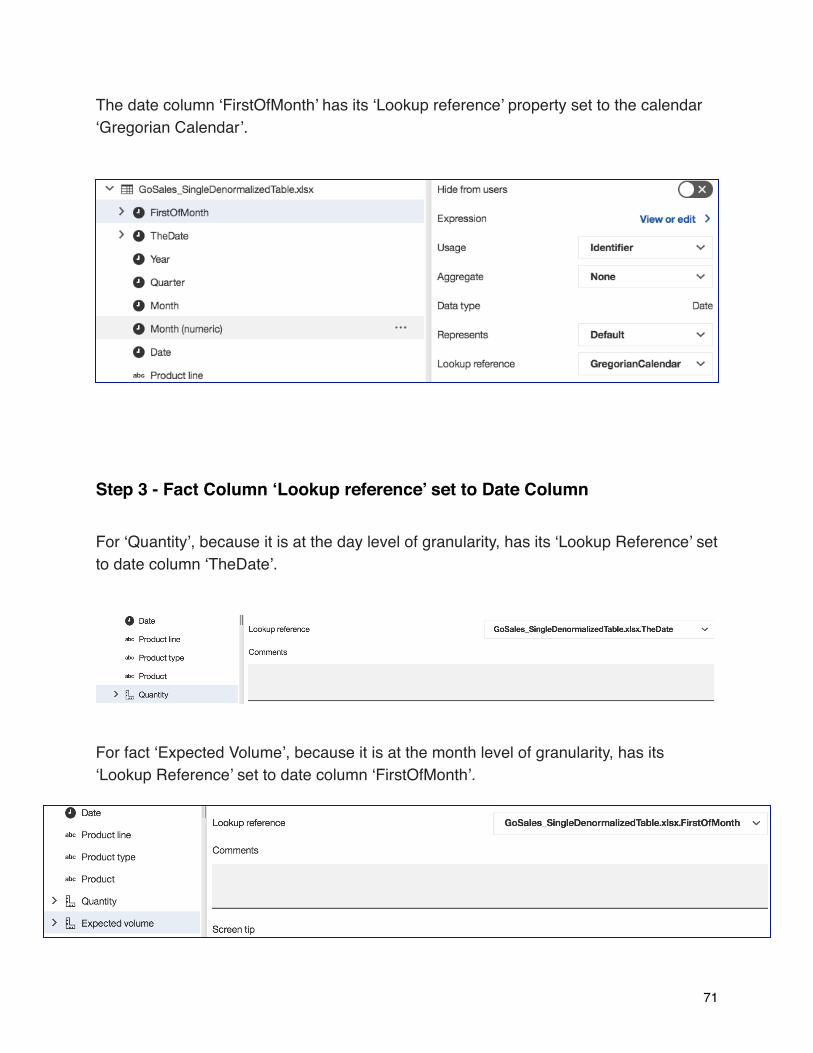
The date column ‘FirstOfMonth’ has its ‘Lookup reference’ property set to the calendar ‘Gregorian Calendar’.
Step 3 - Fact Column ‘Lookup reference’ set to Date Column
For ‘Quantity’, because it is at the day level of granularity, has its ‘Lookup Reference’ set to date column ‘TheDate’.
For fact ‘Expected Volume’, because it is at the month level of granularity, has its ‘Lookup Reference’ set to date column ‘FirstOfMonth’.
�71
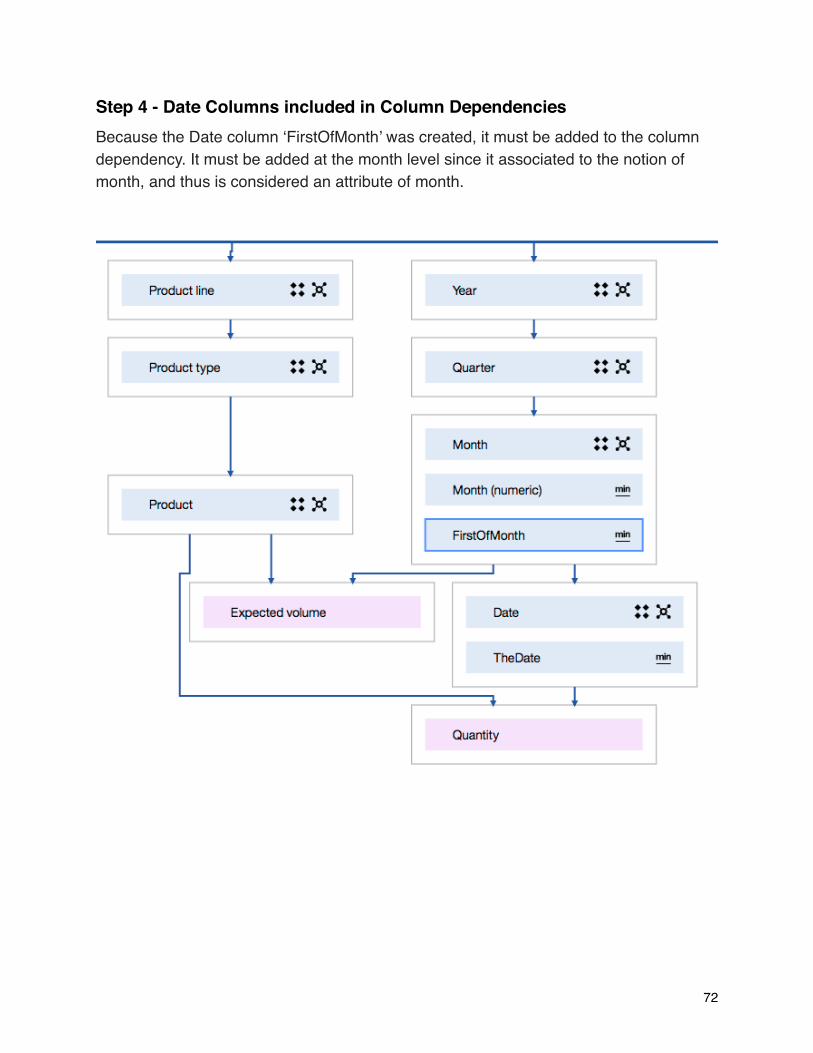
Step 4 - Date Columns included in Column DependenciesBecause the Date column ‘FirstOfMonth’ was created, it must be added to the column dependency. It must be added at the month level since it associated to the notion of month, and thus is considered an attribute of month.
�72
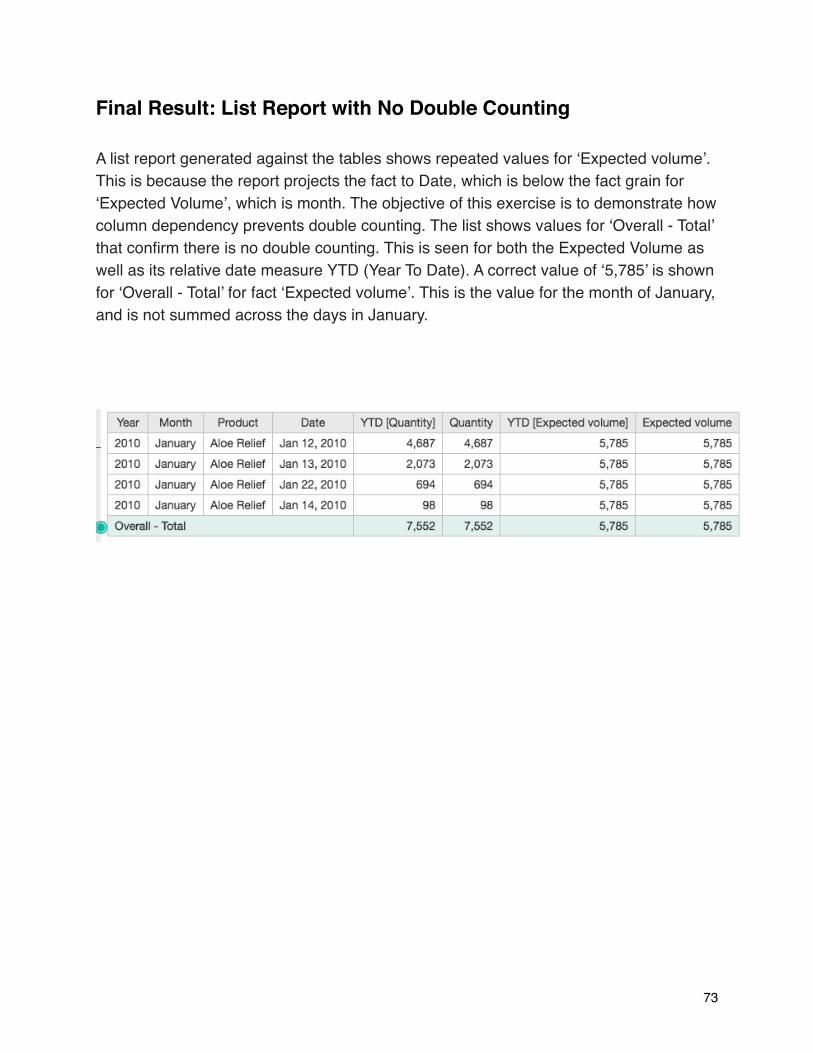
Final Result: List Report with No Double Counting
A list report generated against the tables shows repeated values for ‘Expected volume’. This is because the report projects the fact to Date, which is below the fact grain for ‘Expected Volume’, which is month. The objective of this exercise is to demonstrate how column dependency prevents double counting. The list shows values for ‘Overall - Total’ that confirm there is no double counting. This is seen for both the Expected Volume as well as its relative date measure YTD (Year To Date). A correct value of ‘5,785’ is shown for ‘Overall - Total’ for fact ‘Expected volume’. This is the value for the month of January, and is not summed across the days in January.
�73
Related Documents