IA Clarington Core Plus Bond Fund Semi-Annual Financial Statements September 30, 2021 The Fund’s auditor has not performed a review of the interim financial statements that are included in this report.

Welcome message from author
This document is posted to help you gain knowledge. Please leave a comment to let me know what you think about it! Share it to your friends and learn new things together.
Transcript

IA Clarington Core Plus Bond Fund
Semi-Annual Financial Statements
September 30, 2021
The Fund’s auditor has not performed a review of the interim financial statements that are included in this report.


x
x
x
Table of Contents
Message to Unitholders 1
Management's Responsibility for Financial Reporting 2
Financial Statements
Fixed Income Funds
IA Clarington Core Plus Bond Fund 3
Generic Notes to the Financial Statements 18
.
.
.
.
.
.
.
.
.
.
.
.
.
.
.
.
.
.
.
.
.
.
.
Message to Unitholders
Dear Investor:
We are pleased to enclose the 2021 semi-annual report for IA Clarington Mutual Funds. The accompanying financial
statements contain important information about your investment for the period ended September 30, 2021.
We thank you for your ongoing trust and are committed to providing you with active management solutions that continue to
serve your needs.
Should you have any questions or require further information, please contact your Financial Advisor, the IA Clarington Client
Services Team at 1.800.530.0204, or visit our website at: www.iaclarington.com.
Sincerely,
Adam Elliott
Chief Executive Officer
.
.
.
.
.
.
.
.
.
.
.
.
.
.
.
.
.
.
.
.
.
.
.
.
.
Management's Responsibility for Financial Reporting
Management's Responsibility for Financial Reporting
The accompanying financial statements have been prepared by IA Clarington
Investments Inc., the Manager of the Fund and approved by the board of directors
of the Manager. The Manager is responsible for the information and
representations contained in these financial statements and other sections of this
report.
The Manager has maintained appropriate processes to ensure that relevant and
reliable financial information is produced. The financial statements have been
prepared in accordance with International Financial Reporting Standards (IFRS)
and include certain amounts that are based on estimates and judgements. The
significant accounting policies which management believes are appropriate for the
Fund are described in Generic Note 3 to the Financial Statements.
The Board is responsible for oversight of the financial reporting process and for
reviewing and approving the financial statements of the Fund. The Board also
reviews the adequacy of internal controls over the financial reporting process,
auditing matters and financial reporting issues with management and the external
auditors.
Adam Elliott
Chief Executive Officer
Nancy Cappadocia
Chief Financial Officer
November 12, 2021

{
{
{
{
{
{
{
{
{
{
{
{
{
{
{
{
{
{
{
{
{
{
{
{
{
{
{
{
{
{
{
{
{
{
{
{
{
{
{
{
{
{
{
{
{
{
{
{
{
{
{
{
{
{
{
{
{
{
{
{
{
{
{
{
{
{
{
{
{
{
{
{
{
{
IA Clarington Core Plus Bond Fund
Statements of Financial Position
As at
In thousands (except per unit figures)
September 30
2021
(unaudited)
$
March 31
2021
(audited)
$
ASSETS
CURRENT ASSETS
Investments
773,505
665,667
Derivative financial instruments
Open currency contracts
551
4,004
Cash
21,219
2,670
Subscriptions receivable
4,065
2,745
Receivable for investments sold
1,184
85
Interest, dividends, distributions and other receivable
6,050
5,883
806,574
681,054
LIABILITIES
CURRENT LIABILITIES
Derivative financial instruments
Open currency contracts
2,039
1
Payable for investments purchased
28,631
1,575
Redemptions payable
2,026
2,628
Distributions payable
770
460
Expenses payable
489
435
33,955
5,099
NET ASSETS ATTRIBUTABLE TO HOLDERS OF
REDEEMABLE UNITS
772,619
675,955
NET ASSETS ATTRIBUTABLE TO HOLDERS OF
REDEEMABLE UNITS BY SERIES
Series A
126,038
123,283
Series E
49,541
36,190
Series E4
603
707
Series F
426,076
355,310
Series F4
3,042
2,736
Series F5
694
689
Series I
78,323
99,881
Series L
9,609
9,158
Series L4
1
1
Series L5
217
334
Series O
11,786
12,161
Series P
455
444
Series P4
-
-
Series T4
3,037
3,176
Series T5
540
385
Series W
5,040
4,928
ETF Series
57,617
26,572
UNITS OUTSTANDING
Series A
12,287
12,150
Series E
4,821
3,560
Series E4
68
80
Series F
41,238
34,746
Series F4
331
299
Series F5
69
69
Series I
7,607
9,787
Series L
935
901
Series L4
0.1
0.1
Series L5
22
34
Series O
1,165
1,214
Series P
44
44
Series P4
-
-
Series T4
351
367
Series T5
55
40
Series W
485
479
ETF Series
5,525
2,575
NET ASSETS ATTRIBUTABLE TO HOLDERS OF
REDEEMABLE UNITS PER UNIT
Series A
10.26
10.15
Series E
10.28
10.17
Series E4
8.81
8.81
Series F
10.33
10.23
Series F4
9.18
9.14
Series F5
9.99
9.94
Series I
10.30
10.21
Series L
10.28
10.17
Series L4
8.57
8.60
Series L5
9.72
9.73
Series O
10.11
10.02
Series P
10.29
10.19
Series P4
-
-
Series T4
8.64
8.66
Series T5
9.73
9.73
Series W
10.39
10.28
ETF Series
10.43
10.32
Approved on behalf of the Board of Directors of IA Clarington Investments Inc.
Adam Elliott, Chief Executive Officer Normand Pépin, Director
The accompanying Notes to the Financial Statements are an integral part of these statements.
Statements of Financial Position (continued)
As at September 30 March 31
In thousands (except per unit figures) 2021 2021
(unaudited) (audited)
$ $
IA CLARINGTON INVESTMENTS INC. 3 Semi-Annual Financial Statements

IA Clarington Core Plus Bond Fund
{
{
{
{
{
{
{
{
{
{
{
{
{
{
{
{
{
{
{
{
{
{
{
{
{
{
{
{
{
{
{
{
{
{
{
{
{
{
{
{
{
{
{
{
{
{
{
{
{
{
{
{
{
{
{
{
{
{
{
{
{
Statements of Comprehensive Income (unaudited)
For the periods ended September 30
In thousands (except per unit figures)
2021
$
2020
$
INCOME
Interest for distribution purposes
13,403
10,843
Dividends
256
593
Securities lending
1
-
Other Income
28
-
Foreign exchange gain (loss) on cash (11) (184)
Other changes in fair value of investments and derivative financial
instruments
Investments:
Net realized gain (loss) (1,023) 2,696
Net change in unrealized appreciation (depreciation)
8,483
27,909
Net gain (loss) in fair value of investments
7,460
30,605
Derivative financial instruments:
Net realized gain (loss)
4,213
7,978
Net change in unrealized appreciation (depreciation) (5,243) 2,839
Net gain (loss) in fair value of derivative financial instruments (1,030) 10,817
Total other changes in fair value of investments and derivative financial
instruments
6,430
41,422
20,107
52,674
EXPENSES
Management fees
2,418
2,099
Fixed Administration fees
346
301
Independent Review Committee fees
4
4
Transaction costs
-
29
Foreign withholding taxes
39
73
2,807
2,506
INCREASE (DECREASE) IN NET ASSETS ATTRIBUTABLE TO HOLDERS
OF REDEEMABLE UNITS
17,300
50,168
INCREASE (DECREASE) IN NET ASSETS ATTRIBUTABLE TO HOLDERS
OF REDEEMABLE UNITS BY SERIES
Series A
2,640
9,470
Series E
864
2,318
Series E4
16
20
Series F
9,504
23,500
Series F4
75
202
Series F5
18
60
Series I
2,592
9,683
Series L
194
629
Series L4
-
-
Series L5
5
11
Series O
340
1,098
Series P
12
25
Series P4
-
-
Series T4
68
259
Series T5
7
41
Series W
129
351
ETF Series
836
2,501
INCREASE (DECREASE) IN NET ASSETS ATTRIBUTABLE TO HOLDERS
OF REDEEMABLE UNITS PER UNIT
Series A
0.22
0.72
Series E
0.21
0.73
Series E4
0.21
0.62
Series F
0.26
0.76
Series F4
0.23
0.70
Series F5
0.26
0.76
Series I
0.32
0.83
Series L
0.22
0.73
Series L4
0.16
0.60
Series L5
0.22
0.74
Series O
0.28
0.78
Series P
0.29
0.78
Series P4
-
0.47
Series T4
0.19
0.63
Series T5
0.19
0.73
Series W
0.27
0.78
ETF Series
0.22
0.79
The accompanying Notes to the Financial Statements are an integral part of these statements.
Statements of Comprehensive Income (unaudited)
(continued)
For the periods ended September 30 2021 2020
In thousands (except per unit figures) $ $
IA CLARINGTON INVESTMENTS INC. 4 Semi-Annual Financial Statements

IA Clarington Core Plus Bond Fund
{
{
{
{
{
{
{
{
{
{
{
{
{
{
{
{
{
{
{
{
{
{
{
{
{
{
{
{
{
{
{
{
{
{
{
{
{
{
{
{
{
{
{
{
{
{
{
{
{
{
{
{
{
{
{
{
{
{
{
{
{
{
{
{
{
{
{
{
{
{
{
{
{
{
{
{
{
{
{
{
{
{
{
{
{
{
{
{
{
{
{
{
{
{
{
{
{
{
{
{
{
{
{
{
{
{
{
{
{
{
{
Statements of Changes in Net Assets Attributable to
Holders of Redeemable Units (unaudited)
For the periods ended September 30
In thousands
2021
$
2020
$
NET ASSETS ATTRIBUTABLE TO HOLDERS OF REDEEMABLE
UNITS AT THE BEGINNING OF THE PERIOD
Series A
123,283
125,127
Series E
36,190
29,316
Series E4
707
186
Series F
355,310
275,642
Series F4
2,736
2,513
Series F5
689
745
Series I
99,881
116,390
Series L
9,158
8,469
Series L4
1
1
Series L5
334
149
Series O
12,161
13,099
Series P
444
296
Series P4
-
1
Series T4
3,176
3,215
Series T5
385
548
Series W
4,928
4,256
ETF Series
26,572
36,631
INCREASE (DECREASE) IN NET ASSETS ATTRIBUTABLE TO
HOLDERS OF REDEEMABLE UNITS
Series A
2,640
9,470
Series E
864
2,318
Series E4
16
20
Series F
9,504
23,500
Series F4
75
202
Series F5
18
60
Series I
2,592
9,683
Series L
194
629
Series L4
-
-
Series L5
5
11
Series O
340
1,098
Series P
12
25
Series P4
-
-
Series T4
68
259
Series T5
7
41
Series W
129
351
ETF Series
836
2,501
DISTRIBUTIONS TO HOLDERS OF REDEEMABLE UNITS
From net investment income:
Series A (1,287) (1,207)
Series E (514) (337)
Series E4 (7) (4)
Series F (5,990) (4,235)
Series F4 (47) (41)
Series F5 (10) (12)
Series I (1,663) (1,960)
Series L (94) (78)
Series L4
-
-
Series L5 (2) (2)
Series O (220) (221)
Series P (8) (5)
Series P4
-
-
Series T4 (31) (44)
Series T5 (4) (6)
Series W (80) (64)
ETF Series (630) (431)
From return of capital:
Series A
-
-
Series E
-
-
Series E4 (8) (3)
Series F
-
-
Series F4 (18) (16)
Series F5 (4) (4)
Series I
-
-
Series L
-
-
Series L4
-
-
Series L5 (3) (1)
Series O
-
-
Series P
-
-
Series P4
-
-
Series T4 (40) (37)
Series T5 (5) (6)
Series W
-
-
ETF Series (8) -
(10,673) (8,714)
REDEEMABLE UNITS TRANSACTIONS
Proceeds from redeemable units issued:
Series A
36,305
18,816
Series E
16,639
7,631
Series E4
-
110
Series F
109,141
84,173
Series F4
554
305
Series F5
15
-
Series I
14,448
3,503
Series L
1,125
1,650
Series L4
-
-
Series L5
100
-
Series O
7
100
Series P
-
-
Series P4
-
-
Series T4
258
446
Series T5
180
40
Series W
171
250
ETF Series
37,112
737
Reinvestments of distribution to holders of redeemable units:
Series A
1,205
1,153
Series E
480
328
Series E4
9
-
Series F
3,822
2,947
Series F4
14
9
Series F5
1
2
Series I
1,663
1,960
Series L
92
76
Series L4
-
-
Series L5
3
3
Series O
166
166
Series P
8
5
Series P4
-
-
Series T4
28
30
Series T5
6
7
Series W
1
-
ETF Series
-
-
Statements of Changes in Net Assets Attributable to
Holders of Redeemable Units (unaudited) (continued)
For the periods ended September 30 2021 2020
In thousands $ $
IA CLARINGTON INVESTMENTS INC. 5 Semi-Annual Financial Statements
IA Clarington Core Plus Bond Fund
{
{
{
{
{
{
{
{
{
{
{
{
{
{
{
{
{
{
{
{
{
{
{
{
{
{
{
{
{
{
{
{
{
{
{
{
{
{
{
{
{
{
{
{
{
{
{
{
{
{
{
{
{
{
{
{
{
{
{
{
{
{
{
{
{
{
{
{
{
{
{
{
{
{
{
{
{
{
{
{
{
{
{
{
{
{
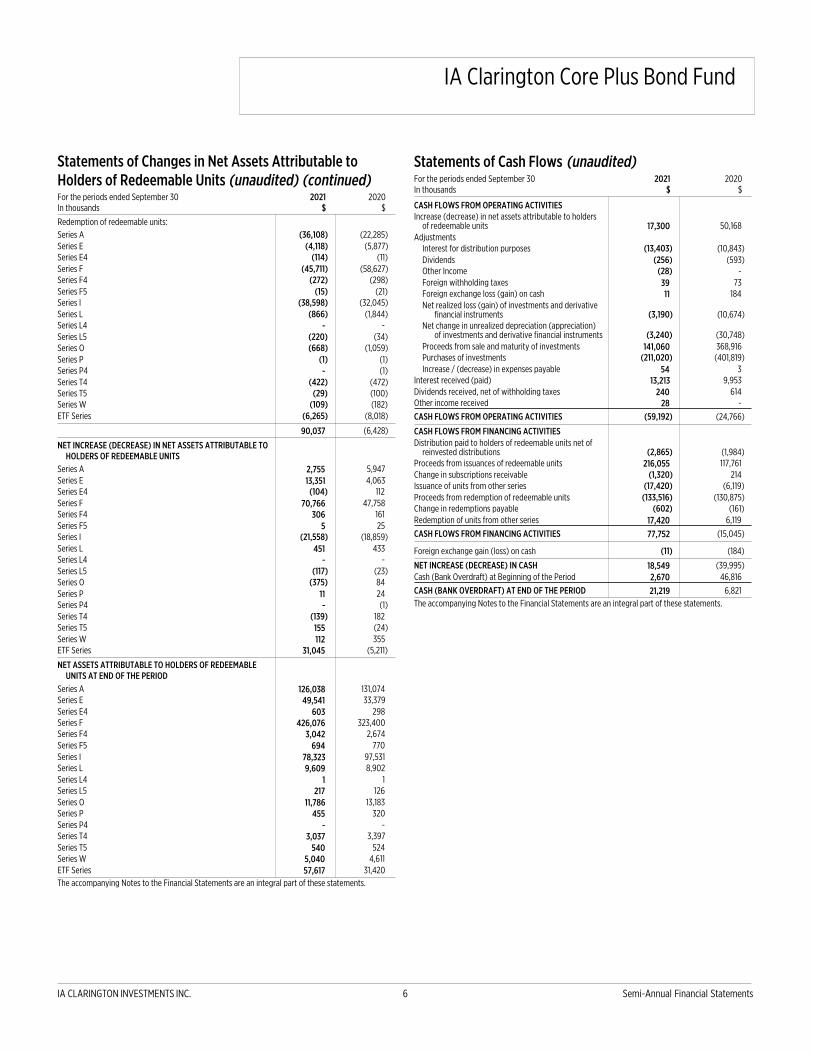
Statements of Changes in Net Assets Attributable to
Holders of Redeemable Units (unaudited) (continued)
For the periods ended September 30
In thousands
2021
$
2020
$
Redemption of redeemable units:
Series A (36,108) (22,285)
Series E (4,118) (5,877)
Series E4 (114) (11)
Series F (45,711) (58,627)
Series F4 (272) (298)
Series F5 (15) (21)
Series I (38,598) (32,045)
Series L (866) (1,844)
Series L4
-
-
Series L5 (220) (34)
Series O (668) (1,059)
Series P (1) (1)
Series P4
-
(1)
Series T4 (422) (472)
Series T5 (29) (100)
Series W (109) (182)
ETF Series (6,265) (8,018)
90,037
(6,428)
NET INCREASE (DECREASE) IN NET ASSETS ATTRIBUTABLE TO
HOLDERS OF REDEEMABLE UNITS
Series A
2,755
5,947
Series E
13,351
4,063
Series E4 (104) 112
Series F
70,766
47,758
Series F4
306
161
Series F5
5
25
Series I (21,558) (18,859)
Series L
451
433
Series L4
-
-
Series L5 (117) (23)
Series O (375) 84
Series P
11
24
Series P4
-
(1)
Series T4 (139) 182
Series T5
155
(24)
Series W
112
355
ETF Series
31,045
(5,211)
NET ASSETS ATTRIBUTABLE TO HOLDERS OF REDEEMABLE
UNITS AT END OF THE PERIOD
Series A
126,038
131,074
Series E
49,541
33,379
Series E4
603
298
Series F
426,076
323,400
Series F4
3,042
2,674
Series F5
694
770
Series I
78,323
97,531
Series L
9,609
8,902
Series L4
1
1
Series L5
217
126
Series O
11,786
13,183
Series P
455
320
Series P4
-
-
Series T4
3,037
3,397
Series T5
540
524
Series W
5,040
4,611
ETF Series
57,617
31,420
The accompanying Notes to the Financial Statements are an integral part of these statements.
Statements of Cash Flows (unaudited)
For the periods ended September 30
In thousands
2021
$
2020
$
CASH FLOWS FROM OPERATING ACTIVITIES
Increase (decrease) in net assets attributable to holders
of redeemable units
17,300
50,168
Adjustments
Interest for distribution purposes (13,403) (10,843)
Dividends (256) (593)
Other Income (28) -
Foreign withholding taxes
39
73
Foreign exchange loss (gain) on cash
11
184
Net realized loss (gain) of investments and derivative
financial instruments (3,190) (10,674)
Net change in unrealized depreciation (appreciation)
of investments and derivative financial instruments (3,240) (30,748)
Proceeds from sale and maturity of investments
141,060
368,916
Purchases of investments (211,020) (401,819)
Increase / (decrease) in expenses payable
54
3
Interest received (paid)
13,213
9,953
Dividends received, net of withholding taxes
240
614
Other income received
28
-
CASH FLOWS FROM OPERATING ACTIVITIES (59,192) (24,766)
CASH FLOWS FROM FINANCING ACTIVITIES
Distribution paid to holders of redeemable units net of
reinvested distributions (2,865) (1,984)
Proceeds from issuances of redeemable units
216,055
117,761
Change in subscriptions receivable (1,320) 214
Issuance of units from other series (17,420) (6,119)
Proceeds from redemption of redeemable units (133,516) (130,875)
Change in redemptions payable (602) (161)
Redemption of units from other series
17,420
6,119
CASH FLOWS FROM FINANCING ACTIVITIES
77,752
(15,045)
Foreign exchange gain (loss) on cash (11) (184)
NET INCREASE (DECREASE) IN CASH
18,549
(39,995)
Cash (Bank Overdraft) at Beginning of the Period
2,670
46,816
CASH (BANK OVERDRAFT) AT END OF THE PERIOD
21,219
6,821
The accompanying Notes to the Financial Statements are an integral part of these statements.
IA CLARINGTON INVESTMENTS INC. 6 Semi-Annual Financial Statements
IA Clarington Core Plus Bond Fund
{
{
{
{
{
{
{
{
{
{
{
{
{
{
{
{
{
{
{
{
{
{
{
{
{
{
{
{
{
{
{
{
{
{
{
{
{
{
{
{
{
{
{
{
{
{
{
{
{
{
{
{
{
{
{
{
{
{
{
{
{
{
{
{
{
{
{
{
{
{
{
{
{
{
{
{
{
{
{
{
{
{
{
{
{
{
{
{
{
{
{
{
{
{
{
{
{
{
{
{
{
{
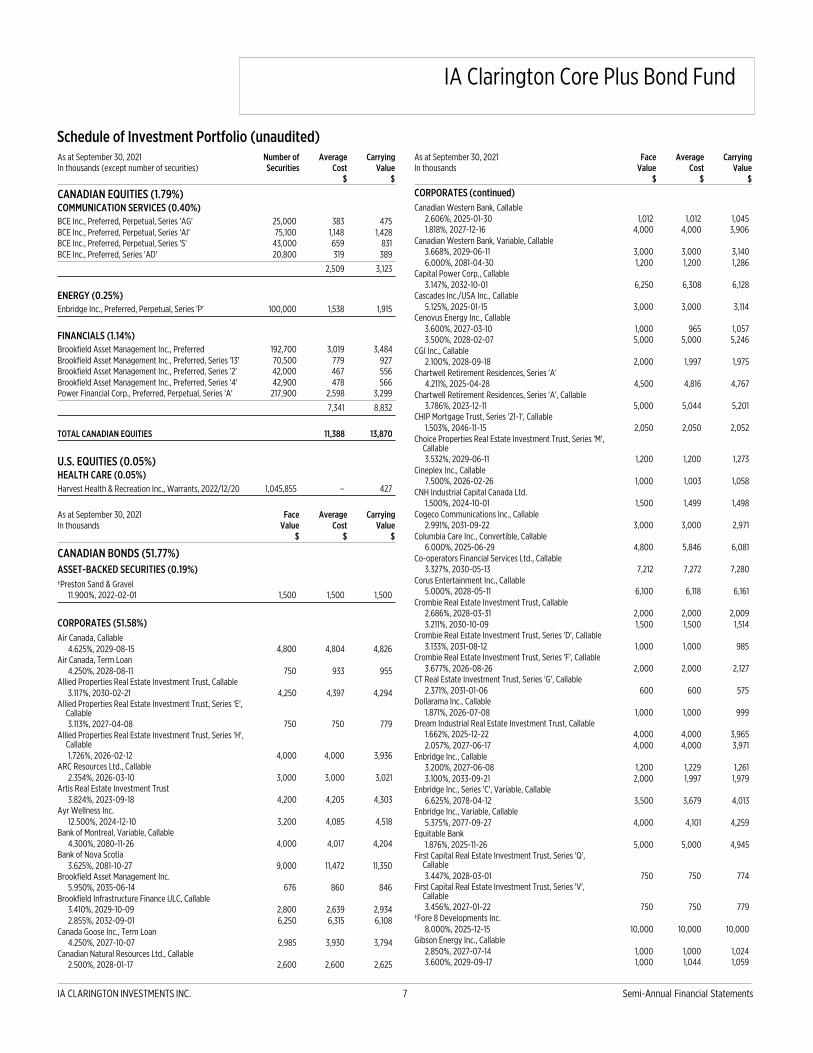
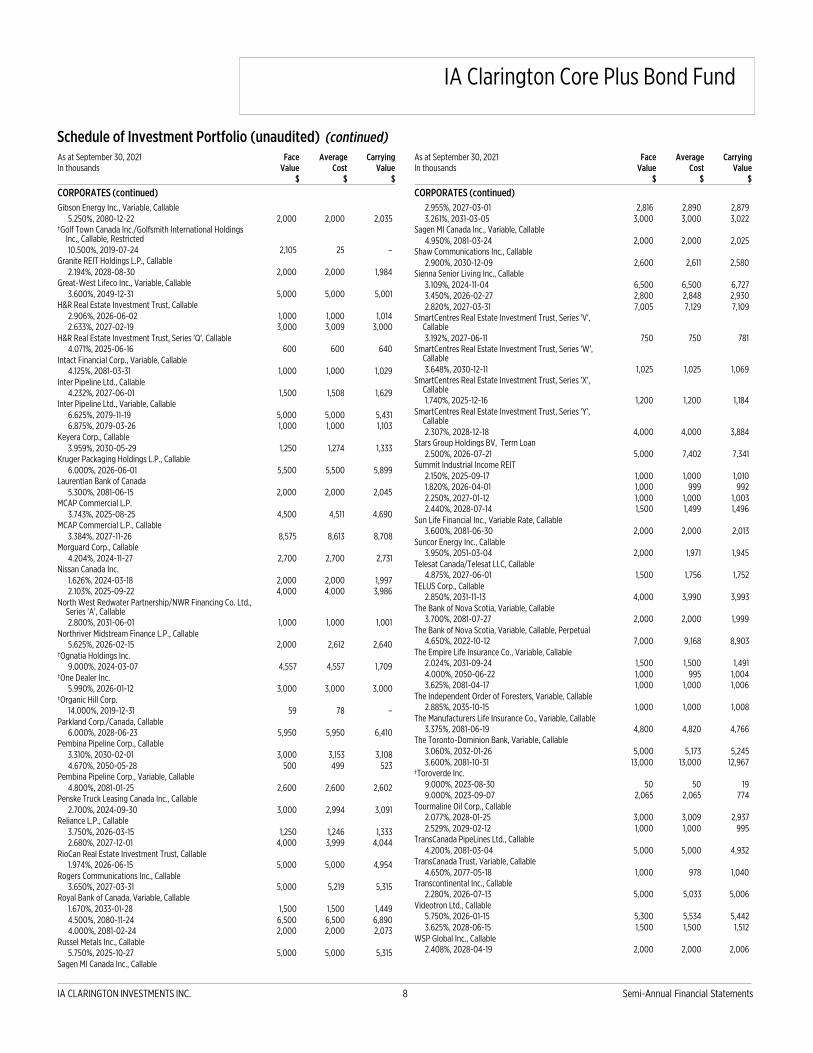
Schedule of Investment Portfolio (unaudited)
As at September 30, 2021
In thousands (except number of securities)
Number of
Securities
Average
Cost
$
Carrying
Value
$
CANADIAN EQUITIES (1.79%)
COMMUNICATION SERVICES (0.40%)
BCE Inc., Preferred, Perpetual, Series 'AG' 25,000 383 475
BCE Inc., Preferred, Perpetual, Series 'AI' 75,100 1,148 1,428
BCE Inc., Preferred, Perpetual, Series 'S' 43,000 659 831
BCE Inc., Preferred, Series 'AD' 20,800 319 389
2,509 3,123
ENERGY (0.25%)
Enbridge Inc., Preferred, Perpetual, Series 'P' 100,000 1,538 1,915
FINANCIALS (1.14%)
Brookfield Asset Management Inc., Preferred 192,700 3,019 3,484
Brookfield Asset Management Inc., Preferred, Series '13' 70,500 779 927
Brookfield Asset Management Inc., Preferred, Series '2' 42,000 467 556
Brookfield Asset Management Inc., Preferred, Series '4' 42,900 478 566
Power Financial Corp., Preferred, Perpetual, Series 'A' 217,900 2,598 3,299
7,341 8,832
TOTAL CANADIAN EQUITIES
{
11,388 13,870
U.S. EQUITIES (0.05%)
HEALTH CARE (0.05%)
Harvest Health & Recreation Inc., Warrants, 2022/12/20 1,045,855 – 427
As at September 30, 2021
In thousands
Face
Value
$
Average
Cost
$
Carrying
Value
$
CANADIAN BONDS (51.77%)
ASSET-BACKED SECURITIES (0.19%)
†Preston Sand & Gravel
11.900%, 2022-02-01 1,500 1,500 1,500
CORPORATES (51.58%)
Air Canada, Callable
4.625%, 2029-08-15 4,800 4,804 4,826
Air Canada, Term Loan
4.250%, 2028-08-11 750 933 955
Allied Properties Real Estate Investment Trust, Callable
3.117%, 2030-02-21 4,250 4,397 4,294
Allied Properties Real Estate Investment Trust, Series 'E',
Callable
3.113%, 2027-04-08 750 750 779
Allied Properties Real Estate Investment Trust, Series 'H',
Callable
1.726%, 2026-02-12 4,000 4,000 3,936
ARC Resources Ltd., Callable
2.354%, 2026-03-10 3,000 3,000 3,021
Artis Real Estate Investment Trust
3.824%, 2023-09-18 4,200 4,205 4,303
Ayr Wellness Inc.
12.500%, 2024-12-10 3,200 4,085 4,518
Bank of Montreal, Variable, Callable
4.300%, 2080-11-26 4,000 4,017 4,204
Bank of Nova Scotia
3.625%, 2081-10-27 9,000 11,472 11,350
Brookfield Asset Management Inc.
5.950%, 2035-06-14 676 860 846
Brookfield Infrastructure Finance ULC, Callable
3.410%, 2029-10-09 2,800 2,639 2,934
2.855%, 2032-09-01 6,250 6,315 6,108
Canada Goose Inc., Term Loan
4.250%, 2027-10-07 2,985 3,930 3,794
Canadian Natural Resources Ltd., Callable
2.500%, 2028-01-17 2,600 2,600 2,625
As at September 30, 2021
In thousands
Face
Value
$
Average
Cost
$
Carrying
Value
$
CORPORATES (continued)
Canadian Western Bank, Callable
2.606%, 2025-01-30
{
1,012 1,012 1,045
1.818%, 2027-12-16
{
4,000 4,000 3,906
Canadian Western Bank, Variable, Callable
3.668%, 2029-06-11
{
3,000 3,000 3,140
6.000%, 2081-04-30
{
1,200 1,200 1,286
Capital Power Corp., Callable
3.147%, 2032-10-01
{
6,250 6,308 6,128
Cascades Inc./USA Inc., Callable
5.125%, 2025-01-15
{
3,000 3,000 3,114
Cenovus Energy Inc., Callable
3.600%, 2027-03-10
{
1,000 965 1,057
3.500%, 2028-02-07
{
5,000 5,000 5,246
CGI Inc., Callable
2.100%, 2028-09-18
{
2,000 1,997 1,975
Chartwell Retirement Residences, Series 'A'
4.211%, 2025-04-28
{
4,500 4,816 4,767
Chartwell Retirement Residences, Series 'A', Callable
3.786%, 2023-12-11
{
5,000 5,044 5,201
CHIP Mortgage Trust, Series '21-1', Callable
1.503%, 2046-11-15
{
2,050 2,050 2,052
Choice Properties Real Estate Investment Trust, Series 'M',
Callable
3.532%, 2029-06-11
{
1,200 1,200 1,273
Cineplex Inc., Callable
7.500%, 2026-02-26
{
1,000 1,003 1,058
CNH Industrial Capital Canada Ltd.
1.500%, 2024-10-01
{
1,500 1,499 1,498
Cogeco Communications Inc., Callable
2.991%, 2031-09-22
{
3,000 3,000 2,971
Columbia Care Inc., Convertible, Callable
6.000%, 2025-06-29
{
4,800 5,846 6,081
Co-operators Financial Services Ltd., Callable
3.327%, 2030-05-13
{
7,212 7,272 7,280
Corus Entertainment Inc., Callable
5.000%, 2028-05-11
{
6,100 6,118 6,161
Crombie Real Estate Investment Trust, Callable
2.686%, 2028-03-31
{
2,000 2,000 2,009
3.211%, 2030-10-09
{
1,500 1,500 1,514
Crombie Real Estate Investment Trust, Series 'D', Callable
3.133%, 2031-08-12
{
1,000 1,000 985
Crombie Real Estate Investment Trust, Series 'F', Callable
3.677%, 2026-08-26
{
2,000 2,000 2,127
CT Real Estate Investment Trust, Series 'G', Callable
2.371%, 2031-01-06
{
600 600 575
Dollarama Inc., Callable
1.871%, 2026-07-08
{
1,000 1,000 999
Dream Industrial Real Estate Investment Trust, Callable
1.662%, 2025-12-22
{
4,000 4,000 3,965
2.057%, 2027-06-17
{
4,000 4,000 3,971
Enbridge Inc., Callable
3.200%, 2027-06-08
{
1,200 1,229 1,261
3.100%, 2033-09-21
{
2,000 1,997 1,979
Enbridge Inc., Series 'C', Variable, Callable
6.625%, 2078-04-12
{
3,500 3,679 4,013
Enbridge Inc., Variable, Callable
5.375%, 2077-09-27
{
4,000 4,101 4,259
Equitable Bank
1.876%, 2025-11-26
{
5,000 5,000 4,945
First Capital Real Estate Investment Trust, Series 'Q',
Callable
3.447%, 2028-03-01
{
750 750 774
First Capital Real Estate Investment Trust, Series 'V',
Callable
3.456%, 2027-01-22
{
750 750 779
†Fore 8 Developments Inc.
8.000%, 2025-12-15
{
10,000 10,000 10,000
Gibson Energy Inc., Callable
2.850%, 2027-07-14
{
1,000 1,000 1,024
3.600%, 2029-09-17 1,000 1,044 1,059
IA CLARINGTON INVESTMENTS INC. 7 Semi-Annual Financial Statements
IA Clarington Core Plus Bond Fund
{
{
{
{
{
{
{
{
{
{
{
{
{
{
{
{
{
{
{
{
{
{
{
{
{
{
{
{
{
{
{
{
{
{
{
{
{
{
{
{
{
{
{
{
{
{
{
{
{
{
{
{
{
{
{
{
{
{
{
{
{
{
{
{
{
{
{
{
{
{
{
{
{
{
{
{
{
{
{
{
{
{
{
{
{
{
{
{
{
{
{
{
{
{
{
Schedule of Investment Portfolio (unaudited) (continued)
As at September 30, 2021
In thousands
Face
Value
$
Average
Cost
$
Carrying
Value
$
CORPORATES (continued)
Gibson Energy Inc., Variable, Callable
5.250%, 2080-12-22 2,000 2,000 2,035
†Golf Town Canada Inc./Golfsmith International Holdings
Inc., Callable, Restricted
10.500%, 2019-07-24 2,105 25 –
Granite REIT Holdings L.P., Callable
2.194%, 2028-08-30 2,000 2,000 1,984
Great-West Lifeco Inc., Variable, Callable
3.600%, 2049-12-31 5,000 5,000 5,001
H&R Real Estate Investment Trust, Callable
2.906%, 2026-06-02 1,000 1,000 1,014
2.633%, 2027-02-19 3,000 3,009 3,000
H&R Real Estate Investment Trust, Series 'Q', Callable
4.071%, 2025-06-16 600 600 640
Intact Financial Corp., Variable, Callable
4.125%, 2081-03-31 1,000 1,000 1,029
Inter Pipeline Ltd., Callable
4.232%, 2027-06-01 1,500 1,508 1,629
Inter Pipeline Ltd., Variable, Callable
6.625%, 2079-11-19 5,000 5,000 5,431
6.875%, 2079-03-26 1,000 1,000 1,103
Keyera Corp., Callable
3.959%, 2030-05-29 1,250 1,274 1,333
Kruger Packaging Holdings L.P., Callable
6.000%, 2026-06-01 5,500 5,500 5,899
Laurentian Bank of Canada
5.300%, 2081-06-15 2,000 2,000 2,045
MCAP Commercial L.P.
3.743%, 2025-08-25 4,500 4,511 4,690
MCAP Commercial L.P., Callable
3.384%, 2027-11-26 8,575 8,613 8,708
Morguard Corp., Callable
4.204%, 2024-11-27 2,700 2,700 2,731
Nissan Canada Inc.
1.626%, 2024-03-18 2,000 2,000 1,997
2.103%, 2025-09-22 4,000 4,000 3,986
North West Redwater Partnership/NWR Financing Co. Ltd.,
Series 'A', Callable
2.800%, 2031-06-01 1,000 1,000 1,001
Northriver Midstream Finance L.P., Callable
5.625%, 2026-02-15 2,000 2,612 2,640
†Ognatia Holdings Inc.
9.000%, 2024-03-07 4,557 4,557 1,709
†One Dealer Inc.
5.990%, 2026-01-12 3,000 3,000 3,000
†Organic Hill Corp.
14.000%, 2019-12-31 59 78 –
Parkland Corp./Canada, Callable
6.000%, 2028-06-23 5,950 5,950 6,410
Pembina Pipeline Corp., Callable
3.310%, 2030-02-01 3,000 3,153 3,108
4.670%, 2050-05-28 500 499 523
Pembina Pipeline Corp., Variable, Callable
4.800%, 2081-01-25 2,600 2,600 2,602
Penske Truck Leasing Canada Inc., Callable
2.700%, 2024-09-30 3,000 2,994 3,091
Reliance L.P., Callable
3.750%, 2026-03-15 1,250 1,246 1,333
2.680%, 2027-12-01 4,000 3,999 4,044
RioCan Real Estate Investment Trust, Callable
1.974%, 2026-06-15 5,000 5,000 4,954
Rogers Communications Inc., Callable
3.650%, 2027-03-31 5,000 5,219 5,315
Royal Bank of Canada, Variable, Callable
1.670%, 2033-01-28 1,500 1,500 1,449
4.500%, 2080-11-24 6,500 6,500 6,890
4.000%, 2081-02-24 2,000 2,000 2,073
Russel Metals Inc., Callable
5.750%, 2025-10-27 5,000 5,000 5,315
Sagen MI Canada Inc., Callable
As at September 30, 2021
In thousands
Face
Value
$
Average
Cost
$
Carrying
Value
$
CORPORATES (continued)
2.955%, 2027-03-01
{
2,816 2,890 2,879
3.261%, 2031-03-05
{
3,000 3,000 3,022
Sagen MI Canada Inc., Variable, Callable
4.950%, 2081-03-24
{
2,000 2,000 2,025
Shaw Communications Inc., Callable
2.900%, 2030-12-09
{
2,600 2,611 2,580
Sienna Senior Living Inc., Callable
3.109%, 2024-11-04
{
6,500 6,500 6,727
3.450%, 2026-02-27
{
2,800 2,848 2,930
2.820%, 2027-03-31
{
7,005 7,129 7,109
SmartCentres Real Estate Investment Trust, Series 'V',
Callable
3.192%, 2027-06-11
{
750 750 781
SmartCentres Real Estate Investment Trust, Series 'W',
Callable
3.648%, 2030-12-11
{
1,025 1,025 1,069
SmartCentres Real Estate Investment Trust, Series 'X',
Callable
1.740%, 2025-12-16
{
1,200 1,200 1,184
SmartCentres Real Estate Investment Trust, Series 'Y',
Callable
2.307%, 2028-12-18
{
4,000 4,000 3,884
Stars Group Holdings BV, Term Loan
2.500%, 2026-07-21
{
5,000 7,402 7,341
Summit Industrial Income REIT
2.150%, 2025-09-17
{
1,000 1,000 1,010
1.820%, 2026-04-01
{
1,000 999 992
2.250%, 2027-01-12
{
1,000 1,000 1,003
2.440%, 2028-07-14
{
1,500 1,499 1,496
Sun Life Financial Inc., Variable Rate, Callable
3.600%, 2081-06-30
{
2,000 2,000 2,013
Suncor Energy Inc., Callable
3.950%, 2051-03-04
{
2,000 1,971 1,945
Telesat Canada/Telesat LLC, Callable
4.875%, 2027-06-01
{
1,500 1,756 1,752
TELUS Corp., Callable
2.850%, 2031-11-13
{
4,000 3,990 3,993
The Bank of Nova Scotia, Variable, Callable
3.700%, 2081-07-27
{
2,000 2,000 1,999
The Bank of Nova Scotia, Variable, Callable, Perpetual
4.650%, 2022-10-12
{
7,000 9,168 8,903
The Empire Life Insurance Co., Variable, Callable
2.024%, 2031-09-24
{
1,500 1,500 1,491
4.000%, 2050-06-22
{
1,000 995 1,004
3.625%, 2081-04-17
{
1,000 1,000 1,006
The Independent Order of Foresters, Variable, Callable
2.885%, 2035-10-15
{
1,000 1,000 1,008
The Manufacturers Life Insurance Co., Variable, Callable
3.375%, 2081-06-19
{
4,800 4,820 4,766
The Toronto-Dominion Bank, Variable, Callable
3.060%, 2032-01-26
{
5,000 5,173 5,245
3.600%, 2081-10-31
{
13,000 13,000 12,967
†Toroverde Inc.
9.000%, 2023-08-30
{
50 50 19
9.000%, 2023-09-07
{
2,065 2,065 774
Tourmaline Oil Corp., Callable
2.077%, 2028-01-25
{
3,000 3,009 2,937
2.529%, 2029-02-12
{
1,000 1,000 995
TransCanada PipeLines Ltd., Callable
4.200%, 2081-03-04
{
5,000 5,000 4,932
TransCanada Trust, Variable, Callable
4.650%, 2077-05-18
{
1,000 978 1,040
Transcontinental Inc., Callable
2.280%, 2026-07-13
{
5,000 5,033 5,006
Videotron Ltd., Callable
5.750%, 2026-01-15
{
5,300 5,534 5,442
3.625%, 2028-06-15
{
1,500 1,500 1,512
WSP Global Inc., Callable
2.408%, 2028-04-19 2,000 2,000 2,006
IA CLARINGTON INVESTMENTS INC. 8 Semi-Annual Financial Statements

IA Clarington Core Plus Bond Fund
{
{
{
{
{
{
{
{
{
{
{
{
{
{
{
{
{
{
{
{
{
{
{
{
{
{
{
{
{
{
{
{
{
{
{
{
{
{
{
{
{
{
{
{
{
{
{
{
{
{
{
{
{
{
{
{
{
{
{
{
{
{
{
{
{
{
{
{
{
{
{
{
{
{
{
{
{
{
{
{
{
{
{
{
{
{
{
{
{
{
{
{
{
{
{
{
{
{
{
{
{
{
{
{
{
{
{
Schedule of Investment Portfolio (unaudited) (continued)
As at September 30, 2021
In thousands
Face
Value
$
Average
Cost
$
Carrying
Value
$
CORPORATES (continued)
398,029 398,469
TOTAL CANADIAN BONDS
{
399,529 399,969
U.S. BONDS (27.99%)
ASSET-BACKED SECURITIES (0.36%)
Hardee's Funding LLC, Class 'A2', Series '21-1A', Callable
2.865%, 2051-06-20 1,995 2,458 2,541
Icon Brand Holdings LLC, Series '13-1A', Class 'A2', Callable
4.352%, 2043-01-25 370 418 213
2,876 2,754
CORPORATES (27.63%)
Air Lease Corp., Callable
2.625%, 2024-12-05 6,000 5,898 6,151
2.875%, 2026-01-15 250 332 331
3.125%, 2030-12-01 250 320 324
Aircastle Ltd., Callable
5.250%, 2025-08-11 500 656 708
2.850%, 2028-01-26 3,600 4,477 4,619
Alterra Mountain Co., Term Loan
4.000%, 2028-08-17 992 1,245 1,256
Altria Group Inc., Callable
3.400%, 2030-05-06 1,000 1,404 1,340
American Airlines Inc., Term Loan
1.837%, 2027-01-29 5,940 7,776 7,238
American Airlines Inc./AAdvantage Loyalty IP Ltd.
5.500%, 2026-04-20 400 505 533
5.750%, 2029-04-20 400 506 547
Ascend Wellness Holdings, Term Loan
9.500%, 2025-08-27 2,900 3,645 3,637
Asurion LLC, Term Loan
5.335%, 2029-01-20 250 310 316
5.335%, 2028-01-31 500 639 632
Athene Global Funding
2.100%, 2025-09-24 8,000 7,990 8,080
2.450%, 2027-08-20 3,000 3,949 3,921
Block Financial LLC, Callable
2.500%, 2028-07-15 500 617 642
3.875%, 2030-08-15 500 666 689
Broadcom Inc., Callable
2.450%, 2031-02-15 1,000 1,272 1,228
4.300%, 2032-11-15 1,000 1,404 1,419
Brookfield Property Finance ULC, Callable
3.926%, 2025-08-24 4,500 4,502 4,591
3.930%, 2027-01-15 3,000 3,000 3,036
Callaway Golf Co., Term Loan
4.586%, 2026-01-02 1,952 2,617 2,487
CenturyLink Inc., Term Loan
2.085%, 2025-01-31 4,563 6,070 5,749
Dell International LLC/EMC Corp., Callable
6.100%, 2027-07-15 1,000 1,407 1,572
6.200%, 2030-07-15 1,000 1,408 1,621
Diamond Sports Group LLC, Term Loan
3.340%, 2026-08-24 1,980 2,001 1,575
Diamond Sports Group LLC/Finance Co., Callable
5.375%, 2026-08-15 750 641 628
DRW Holdings LLC, Term Loan
3.835%, 2028-03-01 1,585 1,963 2,004
Eastern Power LLC, Term Loan
4.750%, 2025-10-02 4,933 6,510 5,591
Flowserve Corp., Callable
3.500%, 2030-10-01 500 656 661
Ford Credit Canada Co.
4.460%, 2024-11-13 1,000 1,035 1,061
General Motors Financial Co. Inc., Callable
As at September 30, 2021
In thousands
Face
Value
$
Average
Cost
$
Carrying
Value
$
CORPORATES (continued)
3.600%, 2030-06-21
{
1,000 1,349 1,358
General Motors Financial of Canada Ltd.
5.950%, 2024-05-14
{
3,000 3,242 3,340
General Motors Financial of Canada Ltd., Callable
1.750%, 2026-04-15
{
1,250 1,249 1,234
†Halo Woods LLC
12.000%, 2022-08-31
{
4,900 6,307 6,208
†Harvest Health & Recreation Inc., Callable
9.250%, 2022-12-19
{
9,595 12,455 12,155
HCN Canadian Holdings-1 L.P., Callable
2.950%, 2027-01-15
{
6,000 6,081 6,203
IIP Operating Partnership L.P., Callable
5.500%, 2026-05-25
{
2,600 3,165 3,455
Instant Brands Holdings Inc., Term Loan
5.750%, 2028-04-12
{
1,500 1,872 1,896
JPMorgan Chase & Co., Variable, Callable, Perpetual
3.465%, 2021-10-01
{
3,000 3,808 3,795
3.598%, 2021-10-30
{
6,351 8,582 8,090
Jushi Holdings Inc., Callable
10.000%, 2023-01-15
{
2,100 2,693 2,865
†LGSA20 Inc., Convertible
15.000%, 2023-05-31
{
1,750 2,201 2,217
Lindblad Expeditions LLC, Term Loan
6.000%, 2025-03-27
{
1,343 1,797 1,608
Lindblad Maritime Enterprises Ltd., Term Loan
6.000%, 2025-03-27
{
336 449 402
Marriott International Inc., Callable
5.750%, 2025-05-01
{
53 74 77
Meredith Corp., Term Loan
5.250%, 2025-01-31
{
1,290 1,655 1,672
Metropolitan Life Global Funding I
3.394%, 2030-04-09
{
8,000 8,642 8,593
Mileage Plus Holdings LLC, Term Loan
6.250%, 2027-06-21
{
4,500 6,118 6,059
Molson Coors International L.P., Callable
3.440%, 2026-07-15
{
6,000 6,324 6,346
NRG Energy Inc., Callable
2.000%, 2025-12-02
{
500 654 644
2.450%, 2027-12-02
{
500 654 643
Omega Healthcare Investors Inc., Callable
3.375%, 2031-02-01
{
500 653 645
Oracle Corp., Callable
2.875%, 2031-03-25
{
1,000 1,251 1,306
Perrigo Finance Unlimited Co., Callable
3.150%, 2030-06-15
{
2,250 3,149 2,950
PharmaCann LLC, Callable
12.000%, 2025-06-30
{
2,870 3,448 3,775
Pitney Bowes Inc., Term Loan
4.090%, 2028-03-17
{
4,780 5,979 6,081
Ralph Lauren Corp., Callable
2.950%, 2030-06-15
{
1,000 1,381 1,337
Royalty Pharma PLC, Callable
1.750%, 2027-09-02
{
500 649 631
Seagate HDD Cayman, Callable
3.375%, 2031-07-15
{
1,500 1,779 1,850
Securus Technologies Holdings Inc., Term Loan
5.500%, 2024-11-01
{
193 247 234
Smithfield Foods Inc., Callable
2.625%, 2031-09-13
{
1,000 1,256 1,231
Sotheby's, Term Loan
5.000%, 2027-01-15
{
1,969 2,498 2,505
Staples Inc., Term Loan
4.626%, 2024-09-12
{
782 1,031 967
Sysco Canada Inc., Callable
3.650%, 2025-04-25
{
6,500 6,780 6,896
The Boeing Co., Callable
5.150%, 2030-05-01
{
500 694 742
5.705%, 2040-05-01
{
1,000 1,389 1,616
The Walt Disney Co.
3.057%, 2027-03-30 2,000 2,000 2,107
IA CLARINGTON INVESTMENTS INC. 9 Semi-Annual Financial Statements

IA Clarington Core Plus Bond Fund
{
{
{
{
{
{
{
{
{
{
{
{
{
{
{
{
{
{
{
{
{
{
{
{
{
{
{
{
{
{
{
{
{
{
{
{
{
{
{
{
{
{
{
{
{
{
{
{
{
{
{
{
{
{
{
{
{
{
{
{
{
{
{
{
{
{
{
{
{
{
{
{
{
{
{
{
{
{
{
{
{
{
{
{
{
{
{
{
{
{
{
{
{
{
{
{
{
{
{
Schedule of Investment Portfolio (unaudited) (continued)
As at September 30, 2021
In thousands
Face
Value
$
Average
Cost
$
Carrying
Value
$
CORPORATES (continued)
T-Mobile US Inc., Callable
3.750%, 2027-04-15 500 706 698
Trulieve Cannabis Corp., Callable
8.000%, 2026-10-06 8,600 10,967 10,895
Viatris Inc., Callable
2.300%, 2027-06-22 1,000 1,355 1,294
Vistage International Inc., Term Loan
5.000%, 2025-02-10 1,200 1,495 1,522
Wahoo Fitness Acquisition LLC, Term Loan
6.750%, 2028-08-11 1,450 1,759 1,800
Walgreens Boots Alliance Inc., Callable
3.200%, 2030-04-15 1,500 2,131 2,035
Wells Fargo & Co.
2.493%, 2027-02-18 4,850 4,901 4,950
West Corp., Term Loan
5.000%, 2024-10-10 1,907 2,422 2,383
214,712 213,497
TOTAL U.S. BONDS
{
217,588 216,251
FOREIGN BONDS (18.51%)
ASSET-BACKED SECURITIES (11.10%)
Blackrock European CLO V DAC, Series '5A', Class 'A1',
Floating Rate, Callable
0.720%, 2031-07-16 5,000 7,864 7,301
Blackrock Rainier CLO VI Ltd., Series '21-6A', Class 'A',
Floating Rate, Callable
1.834%, 2033-04-20 2,500 3,188 3,167
Blackrock Rainier CLO VI Ltd., Series '21-6A', Class 'B',
Floating Rate, Callable
2.184%, 2033-04-20 1,500 1,913 1,901
Brightwood Capital MM CLO 2019-1 Ltd., Series '19-1A', Class
'A1', Floating Rate, Callable
1.976%, 2031-01-15 5,000 6,599 6,338
Crosthwaite Park CLO DAC, Class 'A1BR', Series '1A',
Floating Rate, Callable
1.200%, 2034-03-18 5,000 7,495 7,281
Deerpath Capital CLO 2018-1 Ltd., Series '18-1A', Class 'A1',
Floating Rate, Callable
1.826%, 2031-01-15 4,000 5,321 5,058
Deerpath Capital CLO 2018-1 Ltd., Series '18-1A', Class 'B',
Floating Rate, Callable
2.626%, 2031-01-15 2,000 2,659 2,556
Deerpath Capital CLO 2020-1 Ltd., Series '20-1A', Class 'A1',
Floating Rate, Callable
1.984%, 2032-04-17 3,000 4,020 3,808
Deerpath Capital CLO 2020-1 Ltd., Series '20-1A', Class
'A2A', Floating Rate, Callable
2.334%, 2032-04-17 1,000 1,340 1,271
Dryden 29 Euro CLO 2013 BV, Series '13-29X', Class 'ARR',
Floating Rate, Callable
0.750%, 2032-07-15 5,000 7,557 7,332
Dryden 59 Euro CLO 2017 BV, Series '17-59X', Class 'A',
Floating Rate, Callable
0.750%, 2032-05-15 5,000 7,992 7,283
Dryden 85 CLO Ltd., Series '20-85A', Class 'CR', Floating
Rate, Callable
0.000%, 2035-10-15 5,000 6,408 6,334
Golub Capital Partners 48 L.P., Series '20-48A', Class 'A1',
Floating Rate, Callable
1.444%, 2033-04-17 5,000 6,618 6,341
Madison Park Euro Funding X DAC, Series '10X', Class 'A1',
Floating Rate, Callable
0.740%, 2030-10-25 5,000 7,500 7,338
Man GLG Euro CLO IV DAC, Series '4A', Class 'A1', Floating
Rate, Callable
0.700%, 2031-05-15 5,000 7,590 7,332
Southwick Park CLO LLC, Series '19-4A', Class 'A1', Floating
Rate, Callable
1.434%, 2032-07-20 4,000 5,235 5,072
As at September 30, 2021
In thousands
Face
Value
$
Average
Cost
$
Carrying
Value
$
ASSET-BACKED SECURITIES (continued)
{
{
89,299 85,713
CORPORATES (7.41%)
AerCap Ireland Capital DAC/Global Aviation Trust, Callable
1.750%, 2026-01-30
{
1,000 1,256 1,254
Australia and New Zealand Banking Group Ltd., Variable,
Callable
2.570%, 2035-11-25
{
500 655 615
Aviva PLC
4.000%, 2030-10-02
{
8,000 7,992 8,660
Avolon Holdings Funding Ltd., Callable
2.125%, 2026-02-21
{
500 628 627
2.750%, 2028-02-21
{
500 628 632
BAT Capital Corp., Callable
2.259%, 2028-03-25
{
1,000 1,334 1,257
2.726%, 2031-03-25
{
1,000 1,333 1,247
BNP Paribas S.A. Variable, Callable, Perpetual
4.625%, 2031-02-25
{
250 318 324
2.588%, 2030-08-12
{
500 662 614
Heathrow Funding Ltd.
3.400%, 2030-03-08
{
4,584 4,878 4,806
Heathrow Funding Ltd., Callable
2.694%, 2029-10-13
{
2,800 2,825 2,838
3.661%, 2033-01-13
{
4,500 4,709 4,739
3.726%, 2035-04-13
{
800 800 832
Luxembourg Investment Co. SARL, Facility B
3.250%, 2024-12-05
{
1,500 2,207 2,202
Macquarie Group Ltd., Variable, Callable
2.723%, 2029-08-21
{
5,500 5,508 5,465
National Australia Bank Ltd., Variable, Callable
3.515%, 2030-06-12
{
10,000 10,000 10,461
National Grid Electricity Transmission PLC, Callable
2.301%, 2029-06-22
{
3,000 3,000 2,984
NXP BV/NXP Funding LLC/NXP USA Inc., Callable
3.150%, 2027-05-01
{
500 695 676
SMBC Aviation Capital Finance DAC, Callable
2.300%, 2028-06-15
{
500 604 636
UniCredit SpA, Variable, Callable
2.569%, 2026-09-22
{
3,500 4,612 4,508
Vmed O2 UK Financing I PLC, Callable
4.250%, 2031-01-31
{
{
{
1,500 1,821 1,898
{
56,465 57,275
TOTAL FOREIGN BONDS
{
145,764 142,988
TRANSACTION COSTS
{
–
TOTAL INVESTMENT PORTFOLIO (100.11%)
{
774,269 773,505
DERIVATIVE ASSETS (0.07%)
{
551
DERIVATIVE LIABILITES (-0.26%)
{
(2,039)
OTHER ASSETS LESS LIABILITIES (0.08%)
{
602
TOTAL NET ASSETS ATTRIBUTABLE TO HOLDERS OF
REDEEMABLE UNITS (100.00%)
{
772,619
† Denotes Level 3 financial assets
IA CLARINGTON INVESTMENTS INC. 10 Semi-Annual Financial Statements

IA Clarington Core Plus Bond Fund
{
{
{
{
{
{
{
{
{
{
{
{
{
{
{
{
{
{
{
{
{
{
{
{
{
{
{
{
{
{
{
{
{
{
{
{
{
{
Discussion of Financial Instrument Risk Management
(unaudited)
September 30, 2021 (Generic Notes 3 and 5, in thousands of $, except per unit
figures)
In the sections Discussion of Financial Instrument Risk Management and
Supplementary Notes to Financial Statements - Fund Specific Information, Net
Assets is defined as "Net Assets Attributable to Holders of Redeemable Units",
please refer to Generic Note 3.
Fair Value Measurements
For more information on fair value measurements and inputs, and the aggregation
into the fair value hierarchy levels, please refer to Methods and Assumptions Used
to Estimate Fair Values of Financial Instruments section in Generic Note 5
Management of Financial Risks.
The following tables present the hierarchy of financial instruments recorded at fair
value, based on the hierarchy levels of input used at measurement date.
As at September 30, 2021
Financial Instruments at Fair Value
Level 1
($)
{
Level 2
($)
Level 3
($)
Total
($)
ASSETS
Investments
Equities 13,870 427 – 14,297
Investment funds – – – –
Bonds – 721,626 37,582 759,208
Short-term investments – – – –
13,870 722,053 37,582 773,505
Derivatives
Derivative financial instruments – 551 – 551
LIABILITIES
Derivatives
Derivative financial instruments – (2,039) – (2,039)
Total
13,870 720,565 37,582 772,017
As at March 31, 2021
Financial Instruments at Fair Value
Level 1
($)
{
Level 2
($)
Level 3
($)
Total
($)
ASSETS
Investments
Equities 11,768 1,107 - 12,875
Investment funds - - - -
Bonds - 605,512 47,280 652,792
Short-term investments - - - -
11,768 606,619 47,280 665,667
Derivatives
Derivatives financial instruments - 4,004 - 4,004
LIABILITIES
Derivatives
Derivatives financial instruments - (1) - (1)
Total
11,768 610,622 47,280 669,670
During the period ended September 30, 2021, there was a transfer of $779 from
Level 2 to Level 1 related to a change in the fair value measurement of certain
equity holdings. There were no significant transfers between the levels for the
period ended March 31, 2021.
The following table provides financial instruments recognized at fair value and for
which Level 3 inputs were used in determining fair value:
Fair Value Measuremen ts for Level 3 Securities
Septembe r 30, 2021 March 31, 2021
Bonds
($)
Equities
($)
Bonds
($)
Equities
($)
Balance - beginning of the period 47,280 - 31,493 -
Net realized gain (loss) on
investments (33) - - -
Net realized gain (loss) on derivatives - - - -
Net change in unrealized
appreciation (depreciation) on
investments 95 - (2,514) -
Net change in unrealized
appreciation (depreciation) on
derivatives - - - -
Purchases 8,507 - 23,435 -
Sales (18,267) - (5,134) -
Transfers into Level 3 - - - -
Transfers out of Level 3 - - - -
Balance - end of the period 37,582 - 47,280 -
Change in unrealized gain (loss) of
investments and derivatives held at
end of the period 13 - (2,514) -
The tables below summarize the valuation techniques and the unobservable inputs
used in the fair value measurement of Level 3 financial instruments as of
September 30, 2021 and March 31, 2021 . The unobservable inputs used in
valuation of Level 3 financial instruments can vary considerably over time
depending on company specific factors and economic or market conditions. The
table also illustrates the potential impact on the Fund if the unobservable inputs
used in the valuation techniques had increased or decreased with all other
variables held constant. Certain unobservable inputs used in the valuation
techniques are not reasonably expected to shift and are indicated in the tables
below as ‘‘n/a’’. Securities where the reasonable shift in the unobservable input did
not result in a material impact on the Fund are indicated in the table below as nil.
IA CLARINGTON INVESTMENTS INC. 11 Semi-Annual Financial Statements

IA Clarington Core Plus Bond Fund
{
{
{
{
{
{
{
{
{
{
{
{
{
{
{
{
{
{
{
{
{
{
{
{
{
{
{
{
{
{
{
{
{
{
{
{
{
As at September 30, 2021
Holdings
Valuation
technique
Unobservable
Input
Carrying
Value
Reasonable
shift (+/-)
Change in
Valuation
(+/1)
Bonds
Fair Value at
Cost Purchase Price 14,500 n/a n/a
U.S. Dollar-
Denominated
Bonds*
Fair Value at
Cost Purchase Price 20,580 n/a n/a
Bonds
Internal
Fundamental
Model
Liquidity
Discount 2,502 +10%/-10% +/-250
37,582
As at March 31, 2021
Holdings
Valuation
technique
Unobservable
Input
Carrying
Value
Reasonable
shift (+/-)
Change in
Valuation
(+/1)
Bonds
Fair Value at
Cost Purchase Price 28,366 n/a n/a
U.S. Dollar-
Denominated
Bonds*
Fair Value at
Cost Purchase Price 16,412 n/a n/a
Bonds
Internal
Fundamental
Model
Liquidity
Discount 2,502 +10%/-10% +/-250
47,280
* Level 3 U.S. dollar-denominated holdings are translated into Canadian Dollars at the applicable daily
closing foreign exchange rate.
Credit Risk
As at September 30, 2021 and March 31, 2021, the Fund had invested in debt
instruments with the following credit rating(s):
Debt Instruments*
by Credit Rating
Percentage of Net Assets
As at September 30, 2021
(%)
Percentage of Net Assets
As at March 31, 2021
(%)
AAA 9.97 10.01
AA 2.33 3.59
A 13.58 8.05
BBB 48.05 50.04
BB 10.37 12.36
B 3.60 4.33
CCC 0.28 0.13
Pfd-2 1.14 1.20
Pfd-3 0.65 0.64
Not rated 10.09 8.07
* Excludes other Net Assets attributable to holders of redeemable units
Credit ratings are obtained from DBRS, Standard & Poor's or Moody's. The DBRS rating is presented
and, if not available, the DBRS equivalent rating is presented.
Concentration Risk
The following table summarizes the Fund's concentration risk:
Market Segments
Percentage of Net
Assets
As at September 30, 2021
(%)
Percentage of Net
Assets
As at March 31, 2021
(%)
Canadian Investment Grade
Corporate Bonds 39.38 33.73
U.S. Investment Grade Corporate
Bonds 13.80 17.89
Asset-Backed Securities 11.65 14.65
Canadian High Yield Corporate
Bonds 10.64 10.66
Floating Rate Term Loans 9.32 9.40
Foreign Investment Grade
Corporate Bonds 6.87 6.28
U.S. High Yield Corporate Bonds 6.36 3.96
Financials 1.14 1.20
Other 0.95 0.70
Cash and Other Net Assets (0.11) 1.53
Liquidity Risk
As at September 30, 2021 and March 31, 2021 , the Fund's redeemable units are
due on demand. All other financial liabilities of the Fund have maturities of less
than 30 days. Refer to Generic Note 5 for further information.
The Fund may hold derivatives assets or liabilities. These assets or liabilities may
have a contractual maturity date of greater than 30 days.
As at September 30, 2021 and March 31, 2021, the highest percentage of private
placement securities held between all periods made up approximately 6.99% of
the Net Assets as such exposes the Fund to liquidity risk since no available market
exists for these securities hence are not readily disposed of.
Interest Rate Risk
The tables below summarize the Fund's exposure to interest rate risk by remaining
terms to maturity as at September 30, 2021 and March 31, 2021 . If the prevailing
interest rates had been raised or lowered by 1%, assuming a parallel shift in the
yield curve, with all other factors remaining constant, the Net Assets would have
respectively decreased or increased by the amount presented under "Impact on
Net Assets". The Fund’s sensitivity to interest rate changes was estimated using
the weighted average duration of the portfolio. In practice, actual results may differ
from this sensitivity analysis and the difference could be material.
As at September 30, 2021
< 1 year
($)
1-5
years
($)
6-10
years
($)
> 10
years
($)
Non-
interest
Bearing
($)
Total
($)
Impact on
Net
Assets
($)
Investments 19,592 245,410 316,094 178,112 14,297 773,505 39,257
Cash/Margin/
(Bank
overdraft)
21,219 - - - - 21,219 -
Other assets - - - - 11,850 11,850 -
Liabilities - - - - 33,955 33,955 -
Discussion of Financial Instrument Risk Management
(unaudited) (continued)
September 30, 2021 (Generic Notes 3 and 5, in thousands of $, except per unit figures)
IA CLARINGTON INVESTMENTS INC. 12 Semi-Annual Financial Statements
IA Clarington Core Plus Bond Fund
{
{
{
{
{
{
{
{
{
{
{
{
{
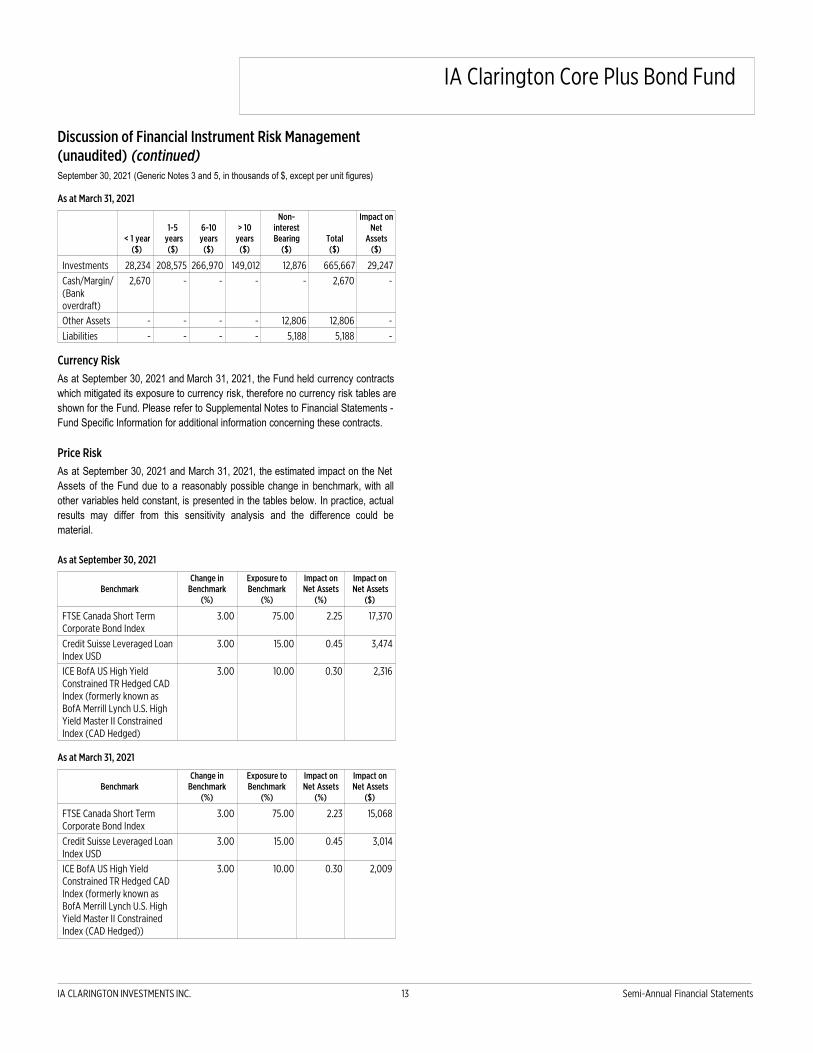
As at March 31, 2021
< 1 year
($)
1-5
years
($)
6-10
years
($)
> 10
years
($)
Non-
interest
Bearing
($)
Total
($)
Impact on
Net
Assets
($)
Investments 28,234 208,575 266,970 149,012 12,876 665,667 29,247
Cash/Margin/
(Bank
overdraft)
2,670 - - - - 2,670 -
Other Assets - - - - 12,806 12,806 -
Liabilities - - - - 5,188 5,188 -
Currency Risk
As at September 30, 2021 and March 31, 2021, the Fund held currency contracts
which mitigated its exposure to currency risk, therefore no currency risk tables are
shown for the Fund. Please refer to Supplemental Notes to Financial Statements -
Fund Specific Information for additional information concerning these contracts.
Price Risk
As at September 30, 2021 and March 31, 2021 , the estimated impact on the Net
Assets of the Fund due to a reasonably possible change in benchmark, with all
other variables held constant, is presented in the tables below. In practice, actual
results may differ from this sensitivity analysis and the difference could be
material.
As at September 30, 2021
Benchmark
Change in
Benchmark
(%)
Exposure to
Benchmark
(%)
Impact on
Net Assets
(%)
Impact on
Net Assets
($)
FTSE Canada Short Term
Corporate Bond Index
3.00 75.00 2.25 17,370
Credit Suisse Leveraged Loan
Index USD
3.00 15.00 0.45 3,474
ICE BofA US High Yield
Constrained TR Hedged CAD
Index (formerly known as
BofA Merrill Lynch U.S. High
Yield Master II Constrained
Index (CAD Hedged)
3.00 10.00 0.30 2,316
As at March 31, 2021
Benchmark
Change in
Benchmark
(%)
Exposure to
Benchmark
(%)
Impact on
Net Assets
(%)
Impact on
Net Assets
($)
FTSE Canada Short Term
Corporate Bond Index
3.00 75.00 2.23 15,068
Credit Suisse Leveraged Loan
Index USD
3.00 15.00 0.45 3,014
ICE BofA US High Yield
Constrained TR Hedged CAD
Index (formerly known as
BofA Merrill Lynch U.S. High
Yield Master II Constrained
Index (CAD Hedged))
3.00 10.00 0.30 2,009
Discussion of Financial Instrument Risk Management
(unaudited) (continued)
September 30, 2021 (Generic Notes 3 and 5, in thousands of $, except per unit figures)
IA CLARINGTON INVESTMENTS INC. 13 Semi-Annual Financial Statements
IA Clarington Core Plus Bond Fund
{
{
{
{
{
{
{
{
{
{
{
{
{
{
{
{
{
{
{
{
{
{
{
{
{
{
{
{
{
{
{
{
{
{
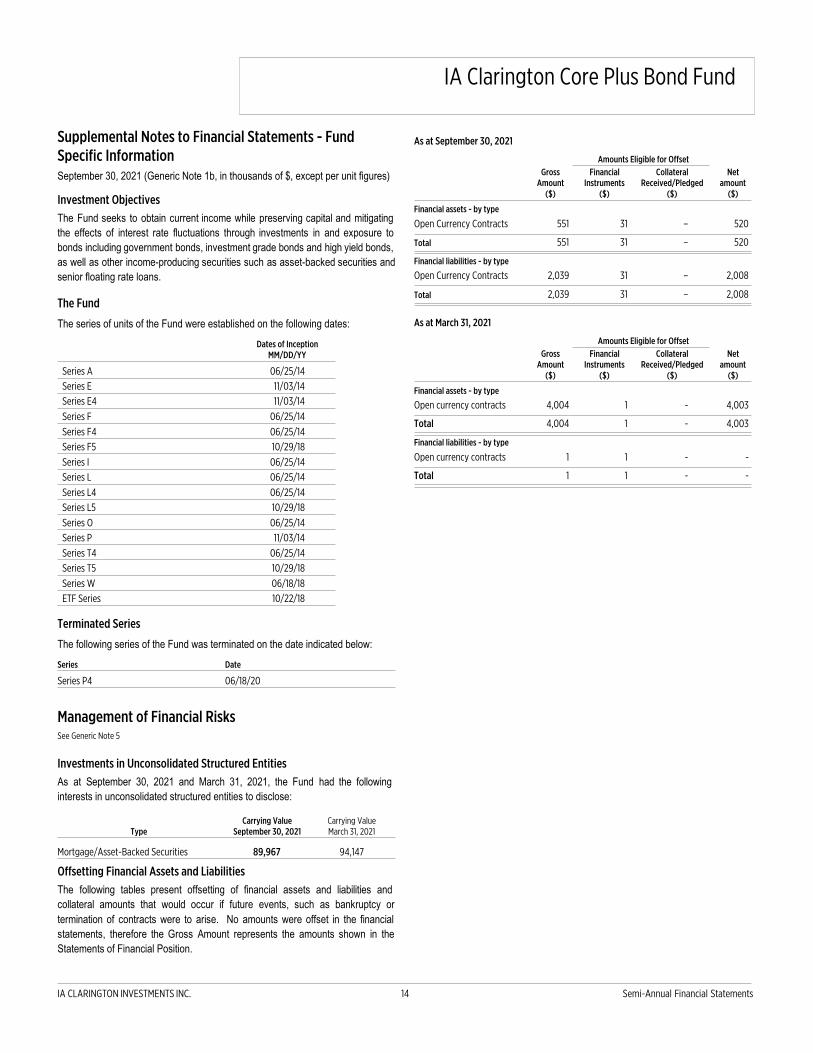
Supplemental Notes to Financial Statements - Fund
Specific Information
September 30, 2021 (Generic Note 1b, in thousands of $, except per unit figures)
Investment Objectives
The Fund seeks to obtain current income while preserving capital and mitigating
the effects of interest rate fluctuations through investments in and exposure to
bonds including government bonds, investment grade bonds and high yield bonds,
as well as other income-producing securities such as asset-backed securities and
senior floating rate loans.
The Fund
The series of units of the Fund were established on the following dates:
Dates of Inception
MM/DD/YY
Series A 06/25/14
Series E 11/03/14
Series E4 11/03/14
Series F 06/25/14
Series F4 06/25/14
Series F5 10/29/18
Series I 06/25/14
Series L 06/25/14
Series L4 06/25/14
Series L5 10/29/18
Series O 06/25/14
Series P 11/03/14
Series T4 06/25/14
Series T5 10/29/18
Series W 06/18/18
ETF Series 10/22/18
Terminated Series
The following series of the Fund was terminated on the date indicated below:
Series Date
Series P4 06/18/20
Management of Financial Risks
See Generic Note 5
Investments in Unconsolidated Structured Entities
As at September 30, 2021 and March 31, 2021, the Fund had the following
interests in unconsolidated structured entities to disclose:
Type
Carrying Value
September 30, 2021
Carrying Value
March 31, 2021
Mortgage/Asset-Backed Securities 89,967 94,147
Offsetting Financial Assets and Liabilities
The following tables present offsetting of financial assets and liabilities and
collateral amounts that would occur if future events, such as bankruptcy or
termination of contracts were to arise. No amounts were offset in the financial
statements, therefore the Gross Amount represents the amounts shown in the
Statements of Financial Position.
As at September 30, 2021
Amounts Eligible for Offset
Gross
Amount
($)
{
Financial
Instruments
($)
Collateral
Received/Pledged
($)
Net
amount
($)
Financial assets - by type
{
Open Currency Contracts
{
{
551 31 – 520
Total
{
551 31 – 520
Financial liabilities - by type
{
Open Currency Contracts
{
2,039 31 – 2,008
Total
{
2,039 31 – 2,008
As at March 31, 2021
Amounts Eligible for Offset
Gross
Amount
($)
{
Financial
Instruments
($)
Collateral
Received/Pledged
($)
Net
amount
($)
Financial assets - by type
{
Open currency contracts
{
{
4,004 1 - 4,003
Total
{
4,004 1 - 4,003
Financial liabilities - by type
{
Open currency contracts
{
{
1 1 - -
Total
{
1 1 - -
IA CLARINGTON INVESTMENTS INC. 14 Semi-Annual Financial Statements

IA Clarington Core Plus Bond Fund
)
{
{
{
{
{
{
{
{
{
{
{
{
{
{
{
{
{
{
{
{
{
{
{
{
{
{
{
Open Currency Contracts
*
The Fund entered into currency contracts to reduce its foreign currency exposure. No cash collateral was pledged for the below currency contracts, therefore no cash
collateral information will be shown. The details of these currency contracts are as follows:
As at September 30, 2021
Settlement
Date
Number of
Contracts To Purchase ($ To Sell ($)
Unrealized
Gain (Loss) - CAD ($) Counterparty
Credit
Rating
November 10, 2021 1 CAD 1,272
USD
1,000 5 BMO Capital Markets A
November 10, 2021 1 CAD 1,926
USD
1,500 26 Toronto Dominion Securities Inc. A
November 24, 2021 1 CAD 53,796
EUR
36,247 520 Canadian Imperial Bank of Commerce A
3
551
October 6, 2021 4 CAD 75,409
USD
60,500 (1,236) BMO Capital Markets A
November 10, 2021 2 CAD 44,869
USD
35,791 (475) Toronto Dominion Securities Inc. A
November 10, 2021 1 CAD 25,061
USD
20,000 (278) BMO Capital Markets A
December 10, 2021 1 CAD 73,430
USD
58,000 (50) RBC Dominion Securities A
8
(2,039)
As at March 31, 2021
Settlement Date
Number of
Contracts
To Purchase
($)
To Sell
($)
Unrealized Gain
(Loss) - CAD ($) Counterparty Credit Rating
April 7, 2021 3 CAD 67,338
USD
53,100 600 BMO Capital Markets A
May 5, 2021 1 CAD 46,620
USD
36,491 758 Toronto Dominion Securities Inc. AA
May 5, 2021 2 CAD 24,629
USD
19,300 373 BMO Capital Markets A
May 27, 2021 1 CAD 54,918
EUR
35,817 1,954 Canadian Imperial Bank of Commerce A
June 9, 2021 1 CAD 62,026
USD
49,100 319 RBC Dominion Securities AA
8
4,004
April 7, 2021 1 CAD 502
USD
400 (1) BMO Capital Markets A
1
(1)
*See Generic Note 6 for counterparty information
Supplemental Notes to Financial Statements - Fund Specific Information (continued)
September 30, 2021 (Generic Note 1b, in thousands of $, except per unit figures)
IA CLARINGTON INVESTMENTS INC. 15 Semi-Annual Financial Statements

IA Clarington Core Plus Bond Fund
{
{
{
{
{
{
{
{
{
{
{
{
{
{
{
{
{
{
{
{
{
{
{
{
{
{
{
{
{
{
{
{
{
{
{
{
{
{
{
{
{
{
{
{
{
{
Related Party Transactions
See Generic Note 7
Management Fees
As at September 30, 2021 and March 31, 2021 , the annualized management fee
rate applicable for each series of the Fund, net of waivers, if any, is as follows:
Series
Management Fee
as at
September 30, 2021
(%)
Management Fee
as at
March 31, 2021
(%)
Series A 1.20 1.20
Series E 1.00 1.00
Series E4 1.00 1.00
Series F 0.50 0.50
Series F4 0.50 0.50
Series F5 0.50 0.50
Series I - -
Series L 1.20 1.20
Series L4 1.20 1.20
Series L5 1.20 1.20
Series O - -
Series P - -
Series T4 1.20 1.20
Series T5 1.20 1.20
Series W 0.45 0.45
ETF Series 0.50 0.50
The amount of management fees incurred during the period end is included in
"Management Fees" in the Statement of Comprehensive Income.
Fixed Administration Fees
As at September 30, 2021 and March 31, 2021 , the rate of the annual Fixed
Administration Fee for each series of the Fund, net of waivers, if any, is as follows:
Series
Fixed Administration Fees
as at
September 30, 2021
(%)
Fixed Administration Fees
as at
March 31, 2021
(%)
Series A 0.17 0.17
Series E 0.09 0.09
Series E4 0.09 0.09
Series F 0.09 0.09
Series F4 0.09 0.09
Series F5 0.09 0.09
Series I - -
Series L 0.17 0.17
Series L4 0.17 0.17
Series L5 0.17 0.17
Series O 0.15 0.15
Series P 0.21 0.21
Series T4 0.17 0.17
Series T5 0.17 0.17
Series W 0.09 0.09
ETF Series 0.09 0.09
The amount of fixed administration fees incurred during the period end is included
in "Fixed Administration Fees" in the Statement of Comprehensive Income.
Investments in the Fund
IA Clarington Investments Inc. and Industrial Alliance Insurance and Financial
Services Inc. (Industrial Alliance) had investments in the Fund, at fair value, as at
the following dates:
As at
September 30, 2021
As at
March 31, 2021
9 9
The preceding table excludes investments from other funds, including those
managed by Industrial Alliance Investment Management Inc. (“IAIM”), a
wholly-owned subsidiary of Industrial Alliance and related party to IA Clarington.
Redeemable Units
See Generic Note 8
For the periods ended September 30, 2021 and September 30, 2020 , the following
units were issued/reinvested and redeemed:
Period
ended
Beginning
of Period
Issued/
Reinvested
during Period
Redeemed
during
Period
End of
Period
Weighted
Average
Units
Series A 2021 12,150 3,653 3,516 12,287 12,277
2020 13,260 2,018 2,260 13,018 13,034
Series E 2021 3,560 1,662 401 4,821 4,092
2020 3,104 804 596 3,312 3,154
Series E4 2021 80 1 13 68 74
2020 22 13 1 34 33
Series F 2021 34,746 10,908 4,416 41,238 37,656
2020 29,048 8,805 5,915 31,938 30,945
Series F4 2021 299 62 30 331 325
Supplemental Notes to Financial Statements - Fund
Specific Information (continued)
September 30, 2021 (Generic Note 1b, in thousands of $, except per unit figures)
IA CLARINGTON INVESTMENTS INC. 16 Semi-Annual Financial Statements

IA Clarington Core Plus Bond Fund
{
{
{
{
{
{
{
{
{
{
{
{
{
{
{
{
{
{
{
{
{
{
{
{
{
securities of the Fund included in the investments is as follows:
{
{
{
{
As at September 30, 2021 and March 31, 2021 , the fair value of the loaned
Period
ended
Beginning
of Period
Issued/
Reinvested
during Period
Redeemed
during
Period
End of
Period
Weighted
Average
Units
2020 292 35 34 293 288
{
Series F5 2021 69 2 2 69 70
2020 80 – 2 78 79
{
Series I 2021 9,787 1,558 3,738 7,607 8,256
2020 12,307 551 3,192 9,666 11,742
{
Series L 2021 901 118 84 935 912
2020 896 174 188 882 866
{
Series L4 2021 0.1 – – 0.1 0.1
2020 0.1 – – 0.1 0.1
{
Series L5 2021 34 11 23 22 25
2020 16 – 3 13 15
{
Series O 2021 1,214 17 66 1,165 1,192
2020 1,410 27 107 1,330 1,399
{
Series P 2021 44 1 1 44 44
2020 31 1 – 32 32
{
Series P4 2021 – – – – –
2020 0.1 - 0.1 - 0.1
{
Series T4 2021 367 33 49 351 360
2020 390 56 55 391 411
{
Series T5 2021 40 19 4 55 42
2020 59 5 10 54 57
{
Series W 2021 479 17 11 485 484
2020 446 25 18 453 452
{
ETF Series 2021 2,575 3,550 600 5,525 3,899
2020 3,825 75 825 3,075 3,161
ETF Series Units are available to investors that purchase such securities over the
TSX or another exchange or marketplace. The units are listed on the TSX under
the symbol ICPB. The last close price at the end of the period was $10.43.
Securities Lending
See Generic Note 10
For the periods ended September 30, 2021 and September 30, 2020 , the Fund's
securities lending income, net of withholding tax, was as follows:
2021
($)
2020
($)
Gross securities lending income
1 -
Securities lending charges - -
Net securities lending income received by the Fund
1 -
During the period ended September 30, 2021 , securities lending charges paid to
the Fund’s custodian, CIBC Mellon Trust Company, represented approximately
18% of the gross securities lending income.
For the period ended September 30, 2020, the Fund did not receive significant
securities lending income.
As at September 30, 2021
Aggregate Value of
Securities on Loan ($)
Aggregate Value of
Collateral for Loan ($)
1,468 1,541
As at March 31, 2021
Aggregate Value of
Securities on Loan ($)
Aggregate Value of
Collateral for Loan ($)
879 925
The collateral held for the loaned securities may consist of bonds, treasury bills,
banker's acceptances and letters of credit.
Supplemental Notes to Financial Statements - Fund
Specific Information (continued)
September 30, 2021 (Generic Note 1b, in thousands of $, except per unit figures)
IA CLARINGTON INVESTMENTS INC. 17 Semi-Annual Financial Statements

.
.
.
.
.
.
.
.
.
.
.
.
.
.
.
Generic Notes to the Financial Statements
September 30, 2021
(also see Supplemental Notes to the Financial Statements - Fund Specific Information)
1. General Information
a) The Funds
The funds (the "Funds") are comprised of unincorporated open-end mutual
fund trusts and unit trusts established under the laws of the Province of Ontario
and governed by the Declaration of Trust. IA Clarington Investments Inc. ("IA
Clarington" or the "Manager") is the manager and the trustee of the Funds. The
Manager is a wholly-owned subsidiary of Industrial Alliance Insurance and
Financial Services Inc. ("iA").
The Funds invest primarily in different types of securities depending on their
investments policies. Refer to Schedule of Investment Portfolio specific to each
fund for further details on their investments.
The Funds' functional and presentation currency is Canadian dollars, except for
IA Clarington U.S. Dollar Floating Rate Income Fund, whose functional and
presentation currency is U.S. dollars.
These financial statements were authorized for issue by the Manager on
November 12, 2021.
The address of the Funds' administrative office is 522 University Avenue, Suite
700, Toronto, Ontario, Canada, M5G 1Y7.
b) Financial Reporting Dates
For Funds established before April 1, 2021, the Statements of Financial
Position are as at September 30, 2021 and March 31, 2021 and the Statements
of Comprehensive Income, the Statements of Changes in Net Assets
Attributable to Holders of Redeemable Units and the Statements of Cash Flows
are for the 6-month periods ended September 30, 2021 and September 30,
2020.
For the IA Clarington Loomis Global Multisector Bond Fund, IA Wealth
Enhanced Bond Pool, IA Clarington Loomis U.S. All Cap Growth Fund and iA
Clarington Inhance Global Equity SRI Fund, the Statements of Financial
Position are as at September 30, 2021 and March 31, 2021. The Statements of
Comprehensive Income, the Statements of Changes in Net Assets Attributable
to Holders of Redeemable Units and the Statements of Cash Flows are for the
6-month period ended September 30, 2021.
2. Basis of Presentation
These unaudited interim financial statements have been prepared in compliance
with International Financial Reporting Standards ("IFRS"), as published by the
International Accounting Standards Board ("IASB") and in accordance with IAS34,
Interim Financial Reporting. The Funds' auditor has not performed a review of the
interim financial statements.
3. Summary of Significant Accounting Policies
The significant accounting policies are as follows:
a) Significant judgments and assumptions
The preparation of financial statements requires the Manager to use judgment
in applying its accounting policies and make estimates and assumptions that
affect the reported amounts of assets, liabilities, income and expenses during
the reporting periods and complementary information. The most significant
estimates and judgments include the fair value of financial instruments, the
classification and measurement of investments and application of the fair value
option.
The Funds hold financial instruments that are not quoted in active markets,
including derivative financial instruments. Fair values of such instruments are
determined using established valuation techniques. Actual results may differ
from the Manager's best estimates. Estimates and assumptions are periodically
reviewed according to changing facts and circumstances. Changes in
assumptions could affect the reported fair values of financial instruments.
i) Classification and Measurement of Investments
In classifying and measuring financial instruments held by the Funds, the
Manager is required to make significant judgments in determining the most
appropriate classification in accordance with IFRS 9. IFRS 9 contains three
principal classification categories for financial assets: measured at
amortized cost, fair value through other comprehensive income (“FVOCI”),
and fair value through profit and loss (“FVTPL”). The classification of
financial assets under IFRS 9 is generally based on the business model in
which a financial asset is managed and its contractual cash flow
characteristics. Assessment and decision on the business model approach
used is an accounting judgement.
b) Financial Instruments
i) Classification of Financial Instruments
The Funds initially recognize financial instruments at fair value, plus
transaction costs in the case of financial instruments measured at
amortized cost. Ongoing purchases and sales of financial assets are
recognized at their trade date, with the exception of term loans which are
recognized on their settlement date.
The Funds classify their investments (equity securities, investment funds
and bonds), short-term investments, and derivative financial instruments at
fair value through profit or loss.
The Funds’ accounting policies for measuring the fair value of their
investments and derivative financial instruments are identical to those used
in measuring their Net Asset Value ("NAV") for transactions with
unitholders.
The Funds’ obligation for net assets attributable to holders of redeemable
units which are classified as an “other financial liability”, is presented at the
redemption amount, which approximates fair value or amortized cost for the
Target Click Funds. All other financial assets and liabilities are measured at
amortized cost. Under this method, the financial assets and liabilities reflect
the amount required to be received or paid, discounted when appropriate,
at the contract’s effective rates.
As at September 30, 2021 and March 31, 2021, there were no differences
between the Funds' net asset value per unit for transactions and their net
assets attributable to holders of redeemable units per unit in accordance
with IFRS.
ii) Fair Value Measurements
Fair value is the price that would be received for selling an asset or paid to
transfer a liability in an orderly transaction between market participants at
the measurement date. In circumstances where the last traded price for
equities and the mid price for bonds is not within the bid-ask spread, the
Manager determines the point within the bid-ask spread that is most
representative of fair value based on the specific facts and circumstances,
and in cases where the last traded price has a traded volume lower than
100, the mid price is used.
iii) Impairment of Financial Assets
At each reporting period, the Funds assess whether the credit risk of a
financial asset classified at amortized cost has increased significantly since
the initial recognition and whether an expected credit loss needs to be
recognized. To assess this, the funds compare the impairment risk of the
financial instrument on the reporting date with the impairment risk on the
initial recognition date. Considering the short-term nature of financial
instruments at amortized cost, the Funds apply the simplified method to
recognize expected credit losses. The amount recognized as expected
credit loss corresponds to the expected shortfall in discounted cash flows
over the lifetime of the financial instrument.
IA CLARINGTON INVESTMENTS INC. 18 Semi-Annual Financial Statements
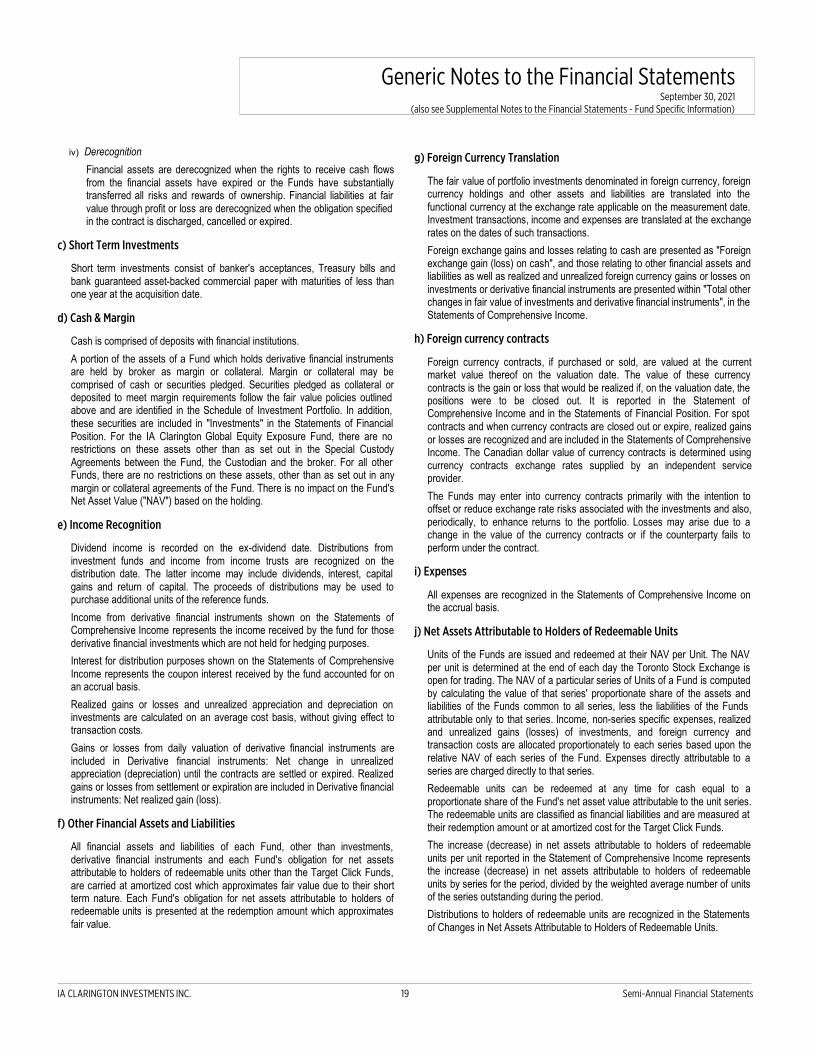
iv) Derecognition
Financial assets are derecognized when the rights to receive cash flows
from the financial assets have expired or the Funds have substantially
transferred all risks and rewards of ownership. Financial liabilities at fair
value through profit or loss are derecognized when the obligation specified
in the contract is discharged, cancelled or expired.
c) Short Term Investments
Short term investments consist of banker's acceptances, Treasury bills and
bank guaranteed asset-backed commercial paper with maturities of less than
one year at the acquisition date.
d) Cash & Margin
Cash is comprised of deposits with financial institutions.
A portion of the assets of a Fund which holds derivative financial instruments
are held by broker as margin or collateral. Margin or collateral may be
comprised of cash or securities pledged. Securities pledged as collateral or
deposited to meet margin requirements follow the fair value policies outlined
above and are identified in the Schedule of Investment Portfolio. In addition,
these securities are included in "Investments" in the Statements of Financial
Position. For the IA Clarington Global Equity Exposure Fund, there are no
restrictions on these assets other than as set out in the Special Custody
Agreements between the Fund, the Custodian and the broker. For all other
Funds, there are no restrictions on these assets, other than as set out in any
margin or collateral agreements of the Fund. There is no impact on the Fund's
Net Asset Value ("NAV") based on the holding.
e) Income Recognition
Dividend income is recorded on the ex-dividend date. Distributions from
investment funds and income from income trusts are recognized on the
distribution date. The latter income may include dividends, interest, capital
gains and return of capital. The proceeds of distributions may be used to
purchase additional units of the reference funds.
Income from derivative financial instruments shown on the Statements of
Comprehensive Income represents the income received by the fund for those
derivative financial investments which are not held for hedging purposes.
Interest for distribution purposes shown on the Statements of Comprehensive
Income represents the coupon interest received by the fund accounted for on
an accrual basis.
Realized gains or losses and unrealized appreciation and depreciation on
investments are calculated on an average cost basis, without giving effect to
transaction costs.
Gains or losses from daily valuation of derivative financial instruments are
included in Derivative financial instruments: Net change in unrealized
appreciation (depreciation) until the contracts are settled or expired. Realized
gains or losses from settlement or expiration are included in Derivative financial
instruments: Net realized gain (loss).
f) Other Financial Assets and Liabilities
All financial assets and liabilities of each Fund, other than investments,
derivative financial instruments and each Fund's obligation for net assets
attributable to holders of redeemable units other than the Target Click Funds,
are carried at amortized cost which approximates fair value due to their short
term nature. Each Fund's obligation for net assets attributable to holders of
redeemable units is presented at the redemption amount which approximates
fair value.
g) Foreign Currency Translation
The fair value of portfolio investments denominated in foreign currency, foreign
currency holdings and other assets and liabilities are translated into the
functional currency at the exchange rate applicable on the measurement date.
Investment transactions, income and expenses are translated at the exchange
rates on the dates of such transactions.
Foreign exchange gains and losses relating to cash are presented as "Foreign
exchange gain (loss) on cash", and those relating to other financial assets and
liabilities as well as realized and unrealized foreign currency gains or losses on
investments or derivative financial instruments are presented within "Total other
changes in fair value of investments and derivative financial instruments", in the
Statements of Comprehensive Income.
h) Foreign currency contracts
Foreign currency contracts, if purchased or sold, are valued at the current
market value thereof on the valuation date. The value of these currency
contracts is the gain or loss that would be realized if, on the valuation date, the
positions were to be closed out. It is reported in the Statement of
Comprehensive Income and in the Statements of Financial Position. For spot
contracts and when currency contracts are closed out or expire, realized gains
or losses are recognized and are included in the Statements of Comprehensive
Income. The Canadian dollar value of currency contracts is determined using
currency contracts exchange rates supplied by an independent service
provider.
The Funds may enter into currency contracts primarily with the intention to
offset or reduce exchange rate risks associated with the investments and also,
periodically, to enhance returns to the portfolio. Losses may arise due to a
change in the value of the currency contracts or if the counterparty fails to
perform under the contract.
i) Expenses
All expenses are recognized in the Statements of Comprehensive Income on
the accrual basis.
j) Net Assets Attributable to Holders of Redeemable Units
Units of the Funds are issued and redeemed at their NAV per Unit. The NAV
per unit is determined at the end of each day the Toronto Stock Exchange is
open for trading. The NAV of a particular series of Units of a Fund is computed
by calculating the value of that series' proportionate share of the assets and
liabilities of the Funds common to all series, less the liabilities of the Funds
attributable only to that series. Income, non-series specific expenses, realized
and unrealized gains (losses) of investments, and foreign currency and
transaction costs are allocated proportionately to each series based upon the
relative NAV of each series of the Fund. Expenses directly attributable to a
series are charged directly to that series.
Redeemable units can be redeemed at any time for cash equal to a
proportionate share of the Fund's net asset value attributable to the unit series.
The redeemable units are classified as financial liabilities and are measured at
their redemption amount or at amortized cost for the Target Click Funds.
The increase (decrease) in net assets attributable to holders of redeemable
units per unit reported in the Statement of Comprehensive Income represents
the increase (decrease) in net assets attributable to holders of redeemable
units by series for the period, divided by the weighted average number of units
of the series outstanding during the period.
Distributions to holders of redeemable units are recognized in the Statements
of Changes in Net Assets Attributable to Holders of Redeemable Units.
Generic Notes to the Financial Statements
September 30, 2021
(also see Supplemental Notes to the Financial Statements - Fund Specific Information)
IA CLARINGTON INVESTMENTS INC. 19 Semi-Annual Financial Statements
.
.
k) Investments in Subsidiaries, Joint Ventures and Associates
In determining whether a Fund is an investment entity, the Manager may be
required to make significant judgements about whether the Fund has the typical
characteristics of an investment entity. An investment entity is an entity that
may hold only one investment, an underlying fund, however, consistent with the
investment entity definition, the Fund primarily obtains funds from one or more
investors for the purpose of providing them with investment management
services, commits to its investors that the business purpose is to invest the
funds solely for returns from capital appreciation, investment income or both,
and measures and evaluates the performance of its investments on a fair value
basis.
Each Fund has determined that it meets the definition of an investment entity
and it is required to account for investments in associates, joint ventures and
subsidiaries at fair value through profit and loss.
Subsidiaries are all entities, including investments in other investment entities,
over which a fund has control. A fund is deemed to control an entity when it has
rights to or is entitled to variable returns from its involvement with the entity,
and has the ability to affect those returns through its power over the entity. The
Funds are investment entities and therefore account for investments in
subsidiaries, if any, at fair value through profit and loss. The Funds also
designate any investments in associates and joint ventures at fair value through
profit and loss.
l) Transaction Costs
The transaction costs related to investments are expensed as incurred in the
Statements of Comprehensive Income in the item line "Transaction costs".
Transaction costs are incremental costs that are directly attributable to the
acquisition, issuance or disposal of an investment, including fees and
commissions paid to agents, advisors, brokers and dealers.
4. New Accounting Policies
On January 23, 2020, the IASB published an amendment to IAS-1 "Presentation of
Financial Statements". The amendment concerns the classification of liabilities as
current or non-current and only affects the presentation of liabilities in the
statement of financial position, and not the amount or timing of recognition of any
asset, liability income or expense, or the information that entities disclose about
those items. The provisions of this amendment will apply retrospectively to
financial statements beginning on or after January 1, 2022. Early adoption is
permitted. The Company has evaluated this amendment and has determined that
there is no impact on the Fund's financial statements.
5. Management of Financial Risks
a) Methods and Assumptions Used to Estimate Fair Values of Financial
Instruments
Disclosures regarding financial instruments must be presented as a hierarchy
that categorizes the inputs to valuation techniques used to value assets and
liabilities at measurement date. The hierarchy gives the highest priority to
readily available unadjusted quoted prices in active markets for identical assets
or liabilities and lowest priority to unobserved inputs when market prices are not
readily available or reliable. The three levels of the hierarchy are described
below:
Level 1 - Valuation based on quoted prices in active markets (unadjusted) for
identical assets or liabilities.
Level 2 - Valuation model based on inputs other than quoted prices included in
Level 1 that are observable for the asset or liability, either directly or indirectly.
Level 3 - Valuation model based on significant unobservable inputs that are
supported by little or no market activity.
All fair value measurements in the Funds are recurring. The financial
instruments are classified as Level 1 when the related security or derivative is
actively traded and a quoted price is available. If an instrument classified as
Level 1 subsequently ceases to be actively traded, it is transferred out of Level
1. In such cases, instruments are reclassified into Level 2, unless the
measurement of its fair value requires the use of significant unobservable
inputs, in which case it is classified as Level 3.
Invested assets are accounted for using the methods described below and the
hierarchy of financial instruments at fair value is disclosed in the Discussion of
Financial Instrument Risk Management section of each Fund.
i) Equities
Each equity listed is valued at the close price reported on the principal
securities exchange on which the issue is traded or, if no active market
exists, the fair value is estimated using equity valuation methods, which
analyze the fair value of the net asset, and other techniques that rely on
comparisons with reference data, such as market indices. In circumstances
where the last traded price is not within the bid-ask spread, the Manager
determines the point within the bid-ask spread that is most representative of
fair value based on the specific facts and circumstances.
ii) Investments in Reference funds
Investments in reference funds are valued at fair value which generally
corresponds to the NAV of the reference fund at the valuation date.
iii) Bonds
Fixed-income investments, which include primarily government bonds,
corporate bonds, zero coupon bonds, residue bonds and municipal bonds
are valued on mid prices using independent pricing services, or by dealers
who trade such securities. Pricing services consider yield or price of
fixed-income securities of comparable quality, coupon, maturity and type as
well as dealer supplied prices.
The par value and cost base of real return bonds are adjusted daily by the
inflation adjustment. Interest is accrued on each valuation date based on
the inflation adjusted to par at that time. The daily change in the inflation
adjusted to par is recognized as income. At maturity, the bonds will pay
their final coupon interest payment, plus the cumulative inflation
compensation accrued from the original issue date.
No efficient market has been developed for certain bonds. The Manager
estimates the fair value of these investments according to a valuation
model that it believes is appropriate under the circumstances. The valuation
is modelled on an individual basis according to the category of reference
assets, including traditional or synthetic assets.
iv) Valuation of Unlisted Securities and Other Investments
When the valuation principles of the aforementioned investments are not
appropriate, fair value is determined according to the Manager's best
estimates, based on established valuation procedures. These procedures
cover, among others, securities no longer traded, securities issued by
private corporations and illiquid securities. The fair value of these securities
established for the purpose of calculating the Funds' net assets attributable
to holders of redeemable units may differ from the securities' most recent
bid or ask price.
Equity investments consist of common shares, purchase warrants and
preferred shares. The equity investments are valued based on the last
round of financing, third party valuations, financial statements and liquidity
discounts. Fixed income investments are valued at fair value based on
operating results and financial condition of the company. The manager will
assess the ability of the company to meet financial covenants, including the
ability to make interest and principal payments, the need for further
financing and the ability to cover the amount of the Fund’s investment with
Generic Notes to the Financial Statements
September 30, 2021
(also see Supplemental Notes to the Financial Statements - Fund Specific Information)
IA CLARINGTON INVESTMENTS INC. 20 Semi-Annual Financial Statements
.
the assets of the investee company. In addition to the range of valuation
methods employed, a significant number of key assumptions used in the
valuation of individual investments are specific to the investee company.
v) Short-term Investments
Short-term investments are accounted for at the mid rate using valuations
based on a matrix system which considers such factors as security prices,
yields and maturities of similar benchmarks. For the Money Market Fund,
the cost of short-term investments together with interest accrued
approximates the fair value.
For items 5i to 5v, the difference, if any, between the total fair value and the
total cost of securities corresponds to Investments: Net change in
unrealized appreciation (depreciation).
vi) Cash
Cash and Bank overdraft are accounted for at amortized cost.
vii) Derivative Financial Instruments
The fair value of currency contracts is based on a matrix of market forward
quotes. The forward quotes are calculated with a linear interpolation. If the
matrix is not available, current market quotes for the reference currencies
are used.
Options, futures and swaps are marked-to-market on each valuation day
according to the gain or loss that would be realized if the contracts were
settled.
The difference between the fair value and cost of securities corresponds to
Derivative financial instruments: Net change in unrealized appreciation
(depreciation).
viii) Other information
If an investment security cannot be valued under the above criteria, or
under any valuation criteria set out in securities legislation, or if any of the
valuation criteria adopted by the Manager but not set out in securities
legislation, are at any time considered by the Manager to be inappropriate
in the circumstances, then the Manager shall use a valuation that it
considers to be fair in the circumstances.
ix) Fair Value Pricing
For the purpose of calculating the NAV, the Funds use fair value pricing
with a view to deter excessive short-term trading in the Funds and to
mitigate market timing opportunities. Fair value pricing is designed to
provide a more accurate NAV by making fair value factor adjustments to
quoted or published prices of the non-North-American equities for
significant events occurring between the earlier of close of
non-North-American markets, and the time at which NAV is determined.
Therefore, the fair value of equities for the purpose of calculating the NAV
of the Funds may differ from the closing market price of the equities.
b) Financial Risks
A Fund’s investment activities expose it to a variety of financial risks which may
include: credit risk, concentration risk, liquidity risk and market risk (including
interest rate risk, currency risk and price risk). The value of investments within
a Fund’s portfolio can fluctuate from day to day, reflecting changes in interest
rates, economic conditions, market and company news related to specific
securities within the Funds. The Schedule of Investment Portfolio presents
securities by asset type, geographic region, and market segment. The level of
risk depends on the Fund’s investment objectives and strategy.
The Manager manages the potential adverse effects of financial risks on a
Fund's performance by employing and overseeing professional and
experienced portfolio advisors that regularly monitors the Fund's positions and
market events and diversifies the investment portfolios, within the constraints of
the investment guidelines.
A Fund’s overall risk management practice involves oversight of investment
activities and monitoring and testing of compliance with the Fund’s investment
strategy and securities regulations.
Reference Fund Units
Some Funds can invest in units of other investment funds ("reference funds")
whose investment policies permit investments in vehicles such as bonds,
stocks or other fund units. Certain risk disclosure in the Discussion of Financial
Instrument Risk Management section look through to the reference funds'
information, if applicable. The manager of each reference fund is responsible
for ensuring investments comply with the fund's investment policy. These
investments are presented in the Schedule of Investment Portfolio.
i) Credit Risk
Credit risk is the risk that a Fund will sustain a financial loss if a
counterparty or a debtor does not meet its commitments to the Fund. The
maximum credit risk associated with financial instruments corresponds to
the carrying value of the financial instruments presented in the Statements
of Financial Position.
Credit risk can also occur when there is a concentration of investments in
entities with similar characteristics or that operate in the same sector of
activity or the same geographic region, or when a substantial investment is
made with a single entity. Credit Risk is disclosed in the Discussion of
Financial Instrument Risk Management of each Fund.
The Fund’s investment strategies aim to limit this risk by ensuring sound
diversification, by limiting exposure to a same issuer and by seeking a
relatively high quality of issuers. The Funds invest in financial assets, which
generally have an investment grade as rated by a well known rating
agency. The fair value of debt instruments includes consideration of the
creditworthiness of the issuer, and represents the maximum credit risk
exposure of the Fund.
All transactions in listed securities are settled or paid for upon delivery
using approved brokers. The risk of default is considered minimal, as
delivery of securities sold is only made once the broker has received
payment. Payment is made on a purchase once the securities have been
received by the broker. The trade will fail if either party fails to meet its
obligation.
ii) Concentration Risk
Concentration risk arises as a result of the concentration of exposures
within the same category, whether due to geographical location, product
type, industry sector or counterparty type and are affected similarly by
changes in economic or other conditions. The Fund’s investment strategies
aim to limit this risk by ensuring sound diversification.
iii) Liquidity Risk
Liquidity risk is the risk that a Fund will encounter difficulty to respect its
financial obligations at the appropriate time and under reasonable
conditions. The Funds' exposure to liquidity risk is concentrated in the daily
cash redemption of units. Liquidity risk is managed by investing the majority
of the Funds' assets in investments that are traded in an active market and
can be readily disposed of. In addition, the Funds retain sufficient cash and
short-term investments to maintain liquidity for the purpose of funding
redemptions. Each Fund also has the ability to borrow up to 5% of its Net
Asset Value for the purpose of funding redemptions.
Redeemable units are redeemable on demand at the holder’s option.
However, the Manager does not expect that the contractual maturity
disclosed in the Discussion of Financial Instrument Risk Management’s
section of each Fund will be representative of the actual cash outflows, as
holders of these instruments typically retain them for a longer period.
Generic Notes to the Financial Statements
September 30, 2021
(also see Supplemental Notes to the Financial Statements - Fund Specific Information)
IA CLARINGTON INVESTMENTS INC. 21 Semi-Annual Financial Statements

.
.
Some Funds may invest in financial instruments that are not traded in
active markets and may be illiquid. Such investments include private equity
and bonds and are included in the Schedule of Investment Portfolio.
The recent international spread of COVID-19 has caused volatility and
decline in global financial markets, as well as significant disruptions to
global business activity, which have caused losses for investors. The
impact of unanticipated market disruptions, including COVID-19, may
cause exchanges to suspend trading and/or investment funds to suspend
dealing (which could be for an extended period of time), may exacerbate
pre-existing political, social or economic risk, and may disproportionately
affect certain issuers, industries or types of securities. These impacts may
have an effect on the performance of the Funds, the performance of the
securities in which the Funds invest and may lead to an increase in the
amount of redemptions experienced by the Funds, including redemptions
by large investors. Each of these effects may lead to illiquidity and losses
on your investment. Such unanticipated market disruptions, including
COVID-19, may be short-term or may last for an extended period of time,
and could have effects that cannot necessarily be presently foreseen. Even
if general economic conditions do not change or improve, the value of an
investment in a Fund could decline if the particular industries, sectors,
companies or types of securities in which the Fund invests do not perform
well or are adversely affected by such unanticipated events.
iv) Market Risk
a) Interest Rate Risk
Interest rate risk arises from the possibility that changes in interest rates
will affect future cash flows or the fair values of interest-bearing financial
instruments. The Funds are exposed to the risk that the value of such
financial instruments will fluctuate due to changes in the prevailing levels
of market interest rates. There is minimal sensitivity to interest rate
fluctuations on any cash or short-term investments since they are
invested at short-term market interest rates and usually held to maturity.
Interest Rate Risk is disclosed in the Discussion of Financial Instrument
Risk Management of each Fund.
The Fund’s investment strategies aim to limit this risk by ensuring sound
diversification, by limiting exposure to a same issuer and by seeking a
relatively high quality of issuers.
b) Currency Risk
Some Funds may invest in monetary and non-monetary assets
denominated in currencies other than Canadian dollar. These
investments result in currency risk, which is the risk that the fair value or
future cash flows of the financial instrument will fluctuate because of
changes in foreign exchange rates. The Funds may enter into foreign
exchange forward contracts to reduce their foreign currency exposure.
The sensitivity analysis is disclosed in the Discussion of Financial
Instrument Risk Management of each Fund.
c) Price Risk
Price risk is the risk that the fair value or future cash flows of financial
instruments will fluctuate as a result of changes in market prices (other
than those arising from interest rate risk or currency risk) whether those
changes are caused by factors specific to the individual financial
instrument or its issuer, or factors affecting all similar financial
instruments traded in a market. All investments present a risk of loss of
capital. The Fund’s portfolio advisor moderates this risk through a careful
selection and diversification of securities and other financial instruments
within the parameters of the Fund’s investment objectives and strategies.
Except for derivative financial instruments, the maximum risk resulting
from financial instruments is equivalent to their fair value. The Fund’s
overall market positions are monitored on a daily basis by the Fund’s
portfolio advisor.
Details of the Fund's price sensitivity is disclosed in the Discussion of
Financial Instrument Risk Management’s section of each Fund.
Refer to the Discussion of Financial Instrument Risk Management for Funds
specific risk disclosure.
c) Investments in Unconsolidated Structured Entities
Each Fund has determined that its investments in reference funds are
investments in unconsolidated structured entities. Some Funds may invest in
reference funds to achieve their investment objectives and apply various
investment strategies to accomplish their objectives.
A Fund’s investments in reference funds are susceptible to market price risk
arising from uncertainty about future values of those reference funds.
A Fund’s maximum exposure to loss from its interests in reference funds is
equal to the total carrying value of its investments in reference funds.
d) Offsetting Financial Assets and Liabilities
Some Funds may invest in derivative financial instruments through an
International Swaps and Derivatives Association’s (ISDA) Master Agreement.
This agreement requires guarantees by the counterparty or by the Funds. The
amount of assets to pledge is based on changes in fair value of financial
instruments. The fair value is monitored daily. The assets pledged by the
Funds as collateral can consist of, but are not limited to cash, Treasury bills
and Government of Canada bonds. The Funds may receive assets as collateral
from the counterparty. According to the conditions set forth in the Credit
Support Annex to the ISDA, the Funds may be authorized to sell or re-pledge
the assets they receive. In addition, under the ISDA, the Funds have the right
to offset in the event of default, insolvency, bankruptcy or other early
termination.
6. Open currency contracts
The following is a list of abbreviations used in the Currency Contracts table which
can be found in the Supplemental Notes to Financial Statements - Fund Specific
Information and is applicable for a Fund who engages in Currency Contracts:
AUD - Australian Dollar; ARS - Argentine Peso; BMD - Bermudian Dollar; BRL -
Brazilian Real; CAD - Canadian Dollar; CHF - Swiss Franc; CLP - Chile Peso;
CNH - Chinese Yuan; CNY - Chinese Yuan; COP - Columbian Peso; CZK - Czech
Koruna; DKK - Danish Krone; EGP - Egyptian Pound; EUR - Euro; GBP - British
Pound; GHS - Ghanaian Cedi; HKD - Hong Kong Dollar; HUF - Hungarian Forint;
IDR - Indonesian Rupiah; ILS - New Israeli Shekel; INR - Indian Rupee; JPY -
Japanese Yen; KES - Kenya Shilling; KRW - South Korean Won; KZT -
Kazakhstani Tenge; MXN - Mexico Peso; MYR - Malaysian Ringgit; NGN - Nigeria
Naira; NOK - Norwegian Krone; NZD - New Zealand Dollar; PEN - Peruvian Sol;
PHP - Philippine Peso; PLN - Polish Zloty; RON - Romanian Leu; RUB - Russian
Ruble; SEK - Swedish Krona; SGD - Singapore Dollar; THB - Thai Baht; TRY -
Turkey Lira; TWD - New Taiwan Dollar; USD - United States Dollar; UYU -
Uruguayan Peso; ZAR - South African Rand.
7. Related Party Transactions
a) Management Fees
Each series of the Funds, except Series I, Series O and Series V, pays an
annual management fee to the Manager which is calculated daily based on the
daily NAV of each series and payable monthly in arrears plus applicable taxes,
as disclosed in the Management Fees section of the Supplemental Notes to
Financial Statements - Fund Specific Information.
Generic Notes to the Financial Statements
September 30, 2021
(also see Supplemental Notes to the Financial Statements - Fund Specific Information)
IA CLARINGTON INVESTMENTS INC. 22 Semi-Annual Financial Statements
.
Management fees for Series I, Series O, and Series V units are negotiated and
paid directly by the investor or the portfolio manager, not by the Fund. These
fees will not exceed the Series A or Series T management fees of the Funds.
Management fees for Series P units are paid directly by the investor, not by the
Fund, and will not exceed the Series E management fees of that Fund. The
Series P management fee is paid by a redemption of Series P units held by the
investor.
The Manager may reduce the effective management fee payable by some
unitholders, by causing the Funds to make management fee distributions to
these unitholders so that the effective management fee will equal a target rate.
All expense payable amounts located in the Statements of Financial Position, if
any, are composed of Management Fees and Fixed Administration Fees which
are related party transactions.
At its sole discretion, the Manager may waive management fees or absorb
expenses of the Funds. Such waivers and absorptions can be terminated at
any time, but can be expected to continue until such time as the Funds are of
sufficient size to reasonably absorb all management fees and expenses
incurred in their operation. Even where continued, the amount of waivers and
absorptions can fluctuate from time to time.
b) Fixed Administration Fees and Operating Expenses
i) For all Funds, except for IA Clarington Global Equity Exposure Fund
The Manager pays the operating expenses of each Fund, other than the
"Fund Costs" (as defined below) (the “Operating Expenses”), in exchange
for the payment by each Fund of an annual fixed rate administration fee
(the "Administration Fee") with respect to each series of a Fund, except for
the IA Clarington Global Equity Exposure Fund.
The Administration Fee is equal to a specified percentage of the NAV of
each series of a Fund, calculated and paid in the same manner as the
management fees for such Fund. The Operating Expenses payable by the
Manager include, but are not limited to, audit fees, fund accounting costs,
transfer agency and recordkeeping costs, custodian costs, administration
costs and trustee services relating to registered tax plans, costs of printing
and disseminating prospectuses, annual information forms, fund facts and
continuous disclosure materials, legal fees, investor communication costs
and regulatory filing fees. The Manager is not obligated to pay any other
expense, cost or fee, including those arising from new government or
regulatory requirements relating to the foregoing expenses, costs and fees.
Dealer compensation programs and any advertising, marketing and
promotional costs are the responsibility of the Manager.
In addition to the Administration Fee, the Funds also pay certain expenses,
"Fund Costs", which include fees, costs and expenses associated with all
taxes, borrowing or interest, directors' fees, securityholder meetings,
Independent Review Committee or other advisory committees, compliance
with any governmental and regulatory requirements imposed commencing
after June 20, 2013 (including relating to the Operating Expenses), and any
new types of costs, expenses or fees not incurred prior to June 20, 2013,
including arising from new government or regulatory requirements relating
to the Operating Expenses or related to external services that were not
commonly charged in the Canadian mutual fund industry as of June 20,
2013. The Manager may, in some years and in certain cases, pay a portion
of a series' Administration Fee or Fund Costs. The decision to absorb the
Administration Fee or Fund Costs, or a portion thereof, is reviewed annually
and determined at the discretion of the Manager without notice to
securityholders.
ii) For IA Clarington Global Equity Exposure Fund
The IA Clarington Global Equity Exposure Fund ("GEEF"), is responsible
for payment of all expenses relating to its operation and the carrying on of
its business. This includes, but is not limited to, legal, audit and custodial
fees, taxes, brokerage fees, interest, operating and administrative fees,
various costs and expenses. The GEEF is responsible for the fees, costs
and expenses of financial and other reports and prospectuses required to
comply with all regulatory requirements in connection with the distribution of
securities. The GEEF is also responsible for its operating expenses, which
are calculated and accrued daily based on its average net asset value. The
Manager pays for these operating expenses on behalf of the GEEF, except
for certain expenses such as interest and taxes, and is then reimbursed by
the GEEF. Dealer compensation programs and any advertising, marketing
and promotional costs are the responsibility of the Manager.
For the provision of Fund accounting services beginning April 1, 2016, the
GEEF paid a service fee to Industrial Alliance Insurance and Financial
Services Inc. ("Industrial Alliance"). As at September 30, 2021 and
September 30, 2020, the total service fee paid to Industrial Alliance was
approximately $1,978 and $11,865, respectively, and there was no accrued
portion outstanding. IA Clarington is wholly owned by Industrial Alliance.
8. Redeemable Units
Each Fund's redeemable units are managed in accordance with its investment
objectives, as outlined in the Fund's prospectus. Each Fund seeks to achieve its
investment objectives, while managing liquidity in order to meet redemptions. The
Statements of Changes in Net Assets Attributable to Holders of Redeemable Units
identifies the changes in the Fund's redeemable unit during the periods.
The increase (decrease) in net assets attributable to holders of redeemable units
per unit reported in the Statement of Comprehensive Income represents the
increase (decrease) in net assets attributable to holders of redeemable units by
series for the period, divided by the weighted average number of units of the series
outstanding during the period.
The authorized redeemable units of each series of the Trusts consists of an
unlimited number of units without nominal or par value.
Units of a series of a Trust are redeemable at the option of the holder in
accordance with the Declaration of Trust at the current NAV of that series.
Units of each Fund are deemed to be a financial liability because of each Fund's
multiple series structure and each series has non-identical features. The Funds'
outstanding units include a contractual obligation to distribute any net income and
net realized capital gains annually (in cash at the request of the unitholder).
Therefore the ongoing redemption feature is not the units' only contractual
obligation. The Fund’s outstanding redeemable units are classified as financial
liabilities in accordance with the requirements of International Accounting Standard
32 Financial Instruments: Presentation.
The purchase and redemption charges to investors in Series A, Series B, Series
B5, Series T4, Series T5, Series T6, Series T8, Series X, Series X5 and Series Y
units of a Trust differ depending on the purchase option. They can be charged
either an upfront sales commission upon purchase that is payable to their dealer,
or a redemption fee upon redemption that is payable to the Manager. The
Manager also charges the Series a management fee.
Series E, Series E4, Series E5, Series E6, Series EX, Series EX5 and Series EX6
units are available to investors who invest at least $100,000. The Manager also
charges the Series a management fee.
Investors in Series EF, Series EF4, Series EF5, Series EF6, Series F, Series F4,
Series F5, Series F6, Series F8, Series FX, Series FX5, Series FX6 and Series W
units of a Trust do not pay sales commission upon purchase, nor redemption fees
upon redemption. Investors pay an annual fee, the amount of which is negotiated
with their dealer, to their dealer for investment advice and other services. The
Manager also charges the Series a management fee.
Generic Notes to the Financial Statements
September 30, 2021
(also see Supplemental Notes to the Financial Statements - Fund Specific Information)
IA CLARINGTON INVESTMENTS INC. 23 Semi-Annual Financial Statements

.
.
.
Investors in Series I, Series O and Series V units of the Trust do not pay sales
commission upon purchase, nor redemption fees upon redemption. Investors
negotiate a separate fee that is paid directly to the Manager. No management fees
are charged to the Funds with respect to Series I, Series O and Series V units.
For investors in Series L, Series L4, Series L5, Series L6, Series L8, Series LX
and Series LX5 units their dealer will pay a redemption charge to the Manager.
The Manager also charges the Series a management fee.
Series P, Series P4, Series P5 and Series P6 units are available to investors who
invest at least $100,000. Investors are charged a management fee based on the
amount of their investment which are paid directly to the Manager. No
management fees are charged to the Funds with respect to Series P, Series P4,
Series P5 and Series P6 units.
ETF Series Securities may be redeemed on any trading day for cash proceeds at
a redemption price equal to 95% of the closing price of the ETF Series Securities
on the effective date of the redemption, subject to a maximum redemption price of
the applicable net asset value per ETF Series Security.
The management fees charged by the Manager to each Fund for all units other
than Series I, Series O and Series V units are listed in the Supplemental Notes to
Financial Statements - Fund Specific Information.
A Fund may offer series which distribute monthly. Monthly distributions will
generally consist of net income and/or return of capital. Distributions can either be
reinvested in additional units or paid in cash.
9. Soft Dollar Commissions
In addition to paying for the cost of brokerage services in respect to security
transactions, commissions paid to certain brokers may also cover research
services provided to the investment manager. The value of the research services
included in the commissions paid by the Funds to those brokers can be found in
the Supplemental Notes to Financial Statements - Fund Specific Information.
10. Securities Lending
Certain Funds may enter into securities lending transactions. These transactions
will be used in conjunction with other investment strategies in order to seek
enhanced returns. The credit risk related to securities lending transactions is
limited by the fact that the value of cash or securities held as collateral by the
Funds in connection with these transactions is at least 105% of the fair value of
loaned securities, except on loans for U.S. securities or global fixed-income
securities, for which the applicable percentage will be 102%. This amount is
deposited by the borrower with a lending agent until the underlying security has
been returned to the Funds in order to provide for the risk of counterparty default
or collateral deficiency. The fair value of the loaned securities is monitored on a
daily basis with additional collateral obtained or refunded as the market values
fluctuate. It is the Funds’ practice to obtain a guarantee from the lending agent
against counterparty default, including collateral deficiency. Income from securities
lending is disclosed separately in the Statements of Comprehensive Income.
11. Income Taxes
The Funds each qualify or are expected to qualify as a mutual fund trust, under the
provisions of the Canadian Income Tax Act and, accordingly, are not subject to
income tax on that portion of their net investment income, including net realized
gains, that is distributed to Unitholders. Such distributed income is taxable in the
hands of the Unitholders. Income tax on net realized capital gains is generally
recoverable, as redemptions occur, by virtue of the refunding provisions contained
in the Canadian Income Tax Act. Sufficient income and net realized capital gains
have been distributed to the Unitholders, therefore no provision for income taxes
has been recorded in the accompanying financial statements.
The IA Clarington International Equity Fund and IA Clarington Inhance Global
Equity SRI Fund are deemed to be a quasi-mutual fundtrusts.
As at the December 31, 2020 tax year end, the Funds, had capital and non-capital
loss carry forwards for income tax purposes as disclosed in the Supplemental
Notes to Financial Statements - Fund Specific Information. Non-capital losses
expire as noted. Capital losses may be carried forward indefinitely to be applied
against future capital gains.
Income from investments held by the Funds may be subject to withholding taxes in
the jurisdictions other than those of the Funds as imposed by the country of origin.
Withholding taxes, if any, are shown in a separate item in the Statements of
Comprehensive Income.
Generic Notes to the Financial Statements
September 30, 2021
(also see Supplemental Notes to the Financial Statements - Fund Specific Information)
IA CLARINGTON INVESTMENTS INC. 24 Semi-Annual Financial Statements

IA CLARINGTON INVESTMENTS INC.
Administrative Office: 522 University Avenue, Suite 700 • Toronto, Ontario • M5G 1Y7 • 1 888 860-9888
Head Office: 1080 Grande Allée West • PO Box 1907, Station Terminus • Quebec City, Quebec • G1K 7M3
email: [email protected] • www.iaclarington.com
Related Documents


