International Standard Serial Number (ISSN): 2249-6807 300 Full Text Available On www.ijipls.com International Journal of Institutional Pharmacy and Life Sciences 6(3): May-June 2016 I I N N T T E E R R N N A A T T I I O O N N A A L L J J O O U U R R N N A A L L O O F F I I N N S S T T I I T T U U T T I I O O N N A A L L P P H H A A R R M M A A C C Y Y A A N N D D L L I I F F E E S S C C I I E E N N C C E E S S Research Article……!!! Rece ived: 15-06-2015; Revised: 13-05-2016; Accepted: 14-05-2016 STATISTICAL OPTIMIZATION OF TOPICAL GEL CONTAINING AZELAIC ACID FOR EFFECTIVE TREATMENT OF ACNE Darekar A B 1 *, Kadam Trupti V 1 , Waghmare Sneha S 1 , Saudagar R B 2 1.*Department of Pharmaceutics, R. G. Sapkal College of Pharmacy, Anjaneri, Nashik-422213, Maharashtra, India. 2. Department of Pharmaceutical chemistry, R. G. Sapkal College of Pharmacy, Anjaneri, Nashik- 422213, Maharashtra, India. Keywords: Azelaic acid, topical gel, acne For Correspondence: Dr. Darekar A B Department of Pharmaceutics, R. G. Sapkal College of Pharmacy, Anjaneri, Nashik- 422213, Maharashtra, India E-mail: [email protected] ABSTRACT Acne is a common inflammatory skin disease that mainly affects the face, neck, chest and upper back. Treatment depends on severity. Azelaic acid has anti-keratinizing, antibacterial and anti-inflammatory activity. Bacteriostatic activity which inhibits the growth of bacteria. They mainly act by inhibiting cellular protein synthesis in aerobic and anaerobic bacteria. Azelaic acid is also used as antineoplastic agent. Azelaic acid is used to treat mild to moderate acnes. Azelaic acid works to treat acne by reducing the proliferation of bacteria called Propionibacterium, it also lessens inflammation and redness and also it normalize keratinization. The present study was conducted for statistical optimization of topical gel containing azelaic acid for effective treatment of acne. A 3 2 full factorial designs was successfully applied for the optimization. All the formulated gels were evaluated for clarity, homogeneity, pH, viscosity, drug content, spreadibility, extrudability, antibacterial activity and In-vitro drug release. In- vitro release data were fitted to different models to know exact mechanism of drug release. The antibacterial activity of Azelaic acid against Staphylococcus aureus (S. aureus) was investigated using agar plate method and zone of inhibition was measured. Formulation F8 showed the maximum drug content, in-vitro drug release and the zone of inhibition among all the formulations. Pharmaceutical Sciences

Welcome message from author
This document is posted to help you gain knowledge. Please leave a comment to let me know what you think about it! Share it to your friends and learn new things together.
Transcript
International Standard Serial Number (ISSN): 2249-6807
300 Full Text Available On www.ijipls.com
International Journal of Institutional Pharmacy and Life Sciences 6(3): May-June 2016
IINNTTEERRNNAATTIIOONNAALL JJOOUURRNNAALL OOFF IINNSSTTIITTUUTTIIOONNAALL
PPHHAARRMMAACCYY AANNDD LLIIFFEE SSCCIIEENNCCEESS
Research Article……!!!
Received: 15-06-2015; Revised: 13-05-2016; Accepted: 14-05-2016
STATISTICAL OPTIMIZATION OF TOPICAL GEL CONTAINING AZELAIC ACID
FOR EFFECTIVE TREATMENT OF ACNE
Darekar A B1*, Kadam Trupti V
1, Waghmare Sneha S
1, Saudagar R B
2
1.*Department of Pharmaceutics, R. G. Sapkal College of Pharmacy, Anjaneri, Nashik-422213,
Maharashtra, India.
2. Department of Pharmaceutical chemistry, R. G. Sapkal College of Pharmacy, Anjaneri, Nashik-
422213, Maharashtra, India.
Keywords:
Azelaic acid,
topical gel, acne
For Correspondence:
Dr. Darekar A B
Department of Pharmaceutics,
R. G. Sapkal College of
Pharmacy, Anjaneri, Nashik-
422213, Maharashtra, India
E-mail:
ABSTRACT
Acne is a common inflammatory skin disease that mainly affects the face,
neck, chest and upper back. Treatment depends on severity. Azelaic acid
has anti-keratinizing, antibacterial and anti-inflammatory activity.
Bacteriostatic activity which inhibits the growth of bacteria. They mainly
act by inhibiting cellular protein synthesis in aerobic and anaerobic
bacteria. Azelaic acid is also used as antineoplastic agent. Azelaic acid is
used to treat mild to moderate acnes. Azelaic acid works to treat acne by
reducing the proliferation of bacteria called Propionibacterium, it also
lessens inflammation and redness and also it normalize keratinization.
The present study was conducted for statistical optimization of topical gel
containing azelaic acid for effective treatment of acne. A 32 full factorial
designs was successfully applied for the optimization. All the formulated
gels were evaluated for clarity, homogeneity, pH, viscosity, drug content,
spreadibility, extrudability, antibacterial activity and In-vitro drug release.
In- vitro release data were fitted to different models to know exact
mechanism of drug release. The antibacterial activity of Azelaic acid
against Staphylococcus aureus (S. aureus) was investigated using agar
plate method and zone of inhibition was measured. Formulation F8
showed the maximum drug content, in-vitro drug release and the zone of
inhibition among all the formulations.
Pharmaceutical Sciences
International Standard Serial Number (ISSN): 2249-6807
301 Full Text Available On www.ijipls.com
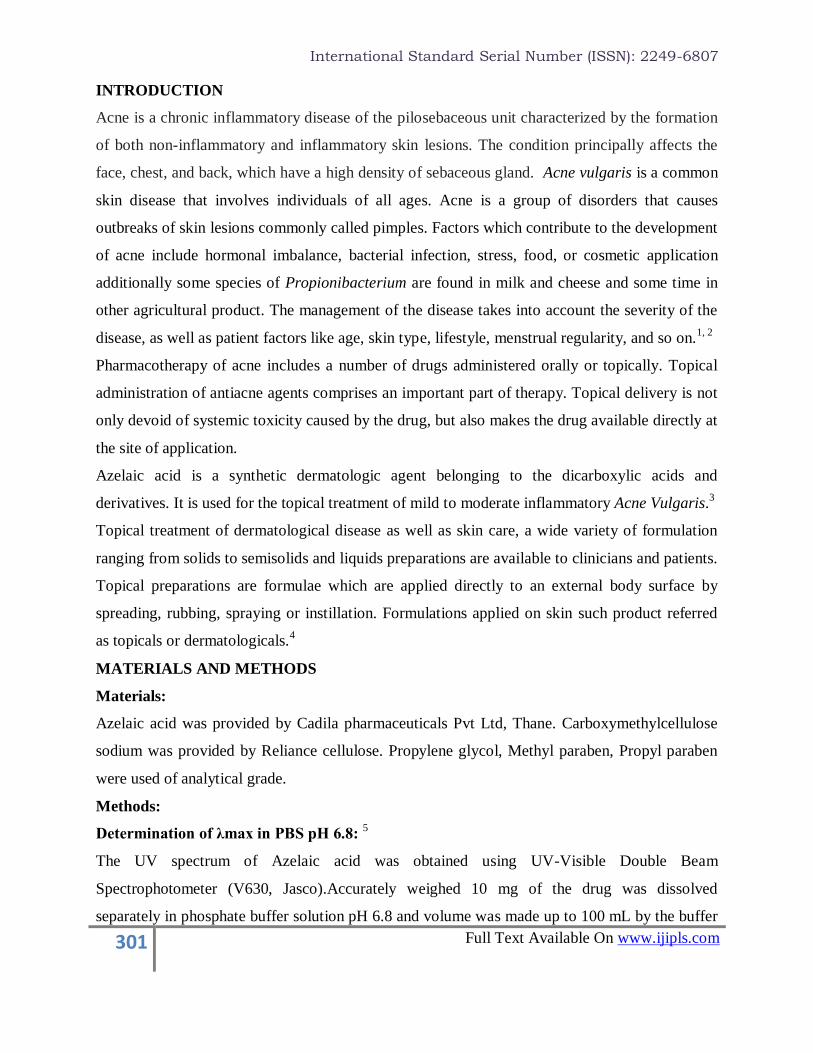
INTRODUCTION
Acne is a chronic inflammatory disease of the pilosebaceous unit characterized by the formation
of both non-inflammatory and inflammatory skin lesions. The condition principally affects the
face, chest, and back, which have a high density of sebaceous gland. Acne vulgaris is a common
skin disease that involves individuals of all ages. Acne is a group of disorders that causes
outbreaks of skin lesions commonly called pimples. Factors which contribute to the development
of acne include hormonal imbalance, bacterial infection, stress, food, or cosmetic application
additionally some species of Propionibacterium are found in milk and cheese and some time in
other agricultural product. The management of the disease takes into account the severity of the
disease, as well as patient factors like age, skin type, lifestyle, menstrual regularity, and so on.1, 2
Pharmacotherapy of acne includes a number of drugs administered orally or topically. Topical
administration of antiacne agents comprises an important part of therapy. Topical delivery is not
only devoid of systemic toxicity caused by the drug, but also makes the drug available directly at
the site of application.
Azelaic acid is a synthetic dermatologic agent belonging to the dicarboxylic acids and
derivatives. It is used for the topical treatment of mild to moderate inflammatory Acne Vulgaris.3
Topical treatment of dermatological disease as well as skin care, a wide variety of formulation
ranging from solids to semisolids and liquids preparations are available to clinicians and patients.
Topical preparations are formulae which are applied directly to an external body surface by
spreading, rubbing, spraying or instillation. Formulations applied on skin such product referred
as topicals or dermatologicals.4
MATERIALS AND METHODS
Materials:
Azelaic acid was provided by Cadila pharmaceuticals Pvt Ltd, Thane. Carboxymethylcellulose
sodium was provided by Reliance cellulose. Propylene glycol, Methyl paraben, Propyl paraben
were used of analytical grade.
Methods:
Determination of λmax in PBS pH 6.8: 5
The UV spectrum of Azelaic acid was obtained using UV-Visible Double Beam
Spectrophotometer (V630, Jasco).Accurately weighed 10 mg of the drug was dissolved
separately in phosphate buffer solution pH 6.8 and volume was made up to 100 mL by the buffer
International Standard Serial Number (ISSN): 2249-6807
302 Full Text Available On www.ijipls.com
solution to obtain a stock solution of final concentration 100 µg/mL. Aliquot (1 mL) of stock
solution of Azelaic acid was transferred into a series 10 mL volumetric flask and volume was
made up to the mark with the buffer solution to produce the concentration range 10 µg/mL. The
resultant solution was scanned from 200 to 400 nm and the spectrum was recorded to obtain the
value of maximum wavelength. The λmax was found to be 204 nm.
Drug excipient compatibility study 6
FTIR:
Compatibility study was carried out by using Fourier transform Infrared spectrophotometer
(Shimadzu). FTIR study was carried on pure drug. Physical mixture of drug and polymers were
prepared and samples kept for 1 month at 400C. The infrared absorption spectrum of physical
mixture of drug and polymerswas recorded using KBr disc over the wave number 4000 to 650
cm-1
.
Preparation of acne gel of azelaic acid: 7
Acne gels were prepared by dispersion technique. Preparation of Solution A:Accurately weighed
(3 gm) quantity of azelaic acid was dissolved in sufficient quantity of propylene glycol and then
parabens were added. Preparation of Solution B: Na CMC was weighed, dispersed in sufficient
quantity of water and allowed to hydrate. Solution A was added to solution B with continuous
stirring. pH of gel was adjusted using 0.1N NaOH.
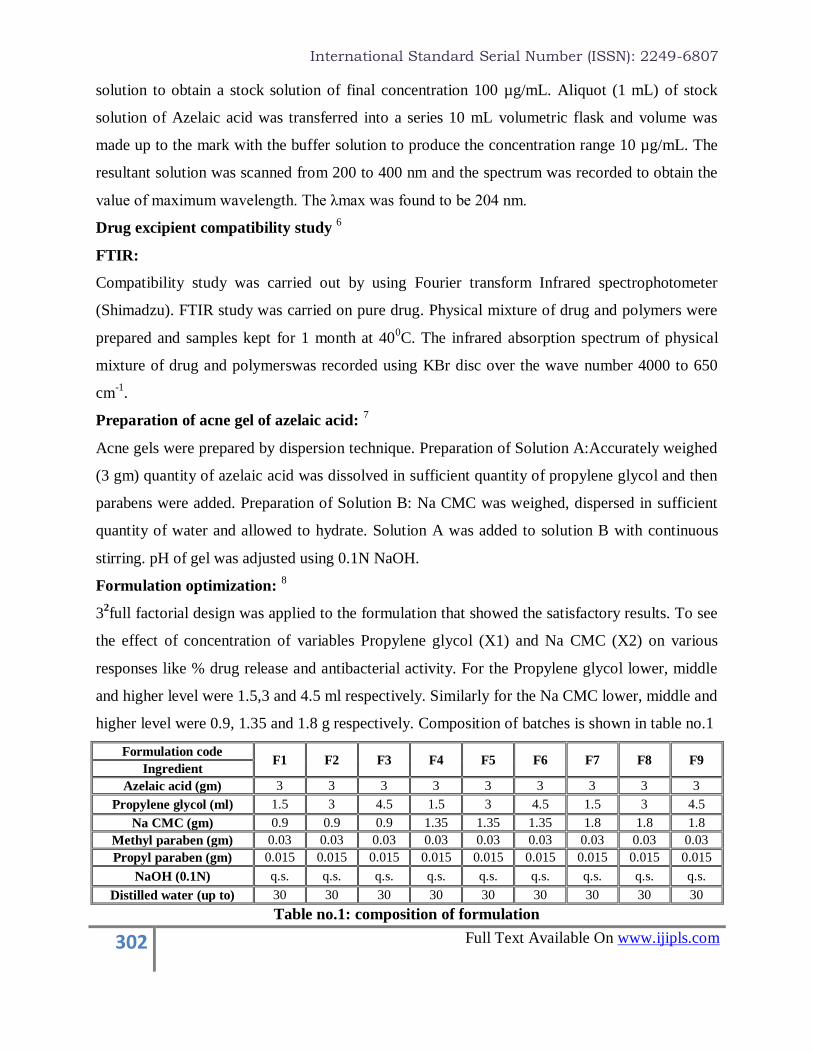
Formulation optimization: 8
32full factorial design was applied to the formulation that showed the satisfactory results. To see
the effect of concentration of variables Propylene glycol (X1) and Na CMC (X2) on various
responses like % drug release and antibacterial activity. For the Propylene glycol lower, middle
and higher level were 1.5,3 and 4.5 ml respectively. Similarly for the Na CMC lower, middle and
higher level were 0.9, 1.35 and 1.8 g respectively. Composition of batches is shown in table no.1
Formulation code F1 F2 F3 F4 F5 F6 F7 F8 F9
Ingredient
Azelaic acid (gm) 3 3 3 3 3 3 3 3 3
Propylene glycol (ml) 1.5 3 4.5 1.5 3 4.5 1.5 3 4.5
Na CMC (gm) 0.9 0.9 0.9 1.35 1.35 1.35 1.8 1.8 1.8
Methyl paraben (gm) 0.03 0.03 0.03 0.03 0.03 0.03 0.03 0.03 0.03
Propyl paraben (gm) 0.015 0.015 0.015 0.015 0.015 0.015 0.015 0.015 0.015
NaOH (0.1N) q.s. q.s. q.s. q.s. q.s. q.s. q.s. q.s. q.s.
Distilled water (up to) 30 30 30 30 30 30 30 30 30
Table no.1: composition of formulation
International Standard Serial Number (ISSN): 2249-6807
303 Full Text Available On www.ijipls.com
Evaluation of acne gel
1. Clarity: 9
On careful visual inspection against dark and white background, all the prepared gel
formulations were found to be free from any suspended particulate matter. All the formulations
were found to be clear.
2. Homogeneity: 10
All developed gels were tested for homogeneity by visual inspection after the gels have been set
in the container. They were tested for their appearance and presence of any aggregates.
3. pH: 11
The pH of the various gel formulations was determined by using digital pH meter.
4.Viscosity Determination: 9
The viscosity of the prepared hydrogel formulations were measured at room temperature by
Brookfield viscometer (DV-II +) attached with spindle 64. The spindle was rotated at varying
Rpm and readings were recorded to study the effect of shearing stress on viscosity.
5. Drug content: 11
The drug content of the gel formulations was determined by dissolving an accurately weighed
quantity 1gm of gel in 100ml of solvent phosphate buffer pH 6.8. The volumetric flask
containing gel solution was shaken for the specific period of time period until the gel gets
completely dissolved. Then the solutions were filtered through suitable filter paper and proper
dilutions were made and solutions were subjected to the Spectrophotometric analysis. The drug
content was calculated from the linear regression equation obtained from the calibration data.
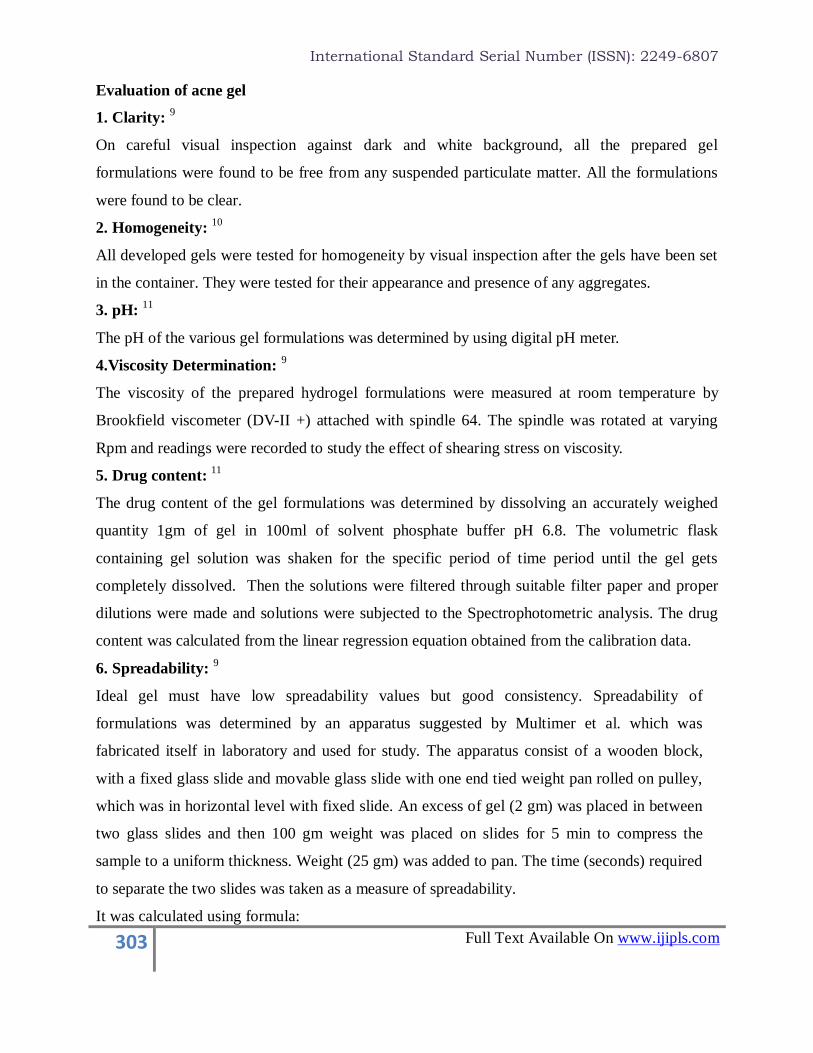
6. Spreadability: 9
Ideal gel must have low spreadability values but good consistency. Spreadability of
formulations was determined by an apparatus suggested by Multimer et al. which was
fabricated itself in laboratory and used for study. The apparatus consist of a wooden block,
with a fixed glass slide and movable glass slide with one end tied weight pan rolled on pulley,
which was in horizontal level with fixed slide. An excess of gel (2 gm) was placed in between
two glass slides and then 100 gm weight was placed on slides for 5 min to compress the
sample to a uniform thickness. Weight (25 gm) was added to pan. The time (seconds) required
to separate the two slides was taken as a measure of spreadability.
It was calculated using formula:
International Standard Serial Number (ISSN): 2249-6807
304 Full Text Available On www.ijipls.com
S = m. l / t
Where, S = spreadability
m = weight tied to upper slide
l= length of glass slide
t = time taken
.
Figure no.1: spreadability assembly
7. Extrudability: 10
The gel formulation were filled in standard caped collapsible lami-tube and sealed. The tube was
weighed and recorded. The tube was placed between two glass slides and was clamped. A 500 g
weight was placed over the glass slide and then cap was opened. The amount of gel extruded
were collected and weighed. The % of gel extruded was calculated; and grades were allotted (+ +
+ Good, + + fair, + Poor).
8.Antibacterial Activity: 9, 12, 13, 14
An Agar diffusion method was used for the determination of antibacterial activity of
formulations. Standard Petri dishes (9 cm diameter) containing medium to a depth of 0.5 cm
were used. The sterility of the plates and all other glassware was controlled before performing
the test, by keeping them in autoclave at 1210C for 15 mins. Fresh colonies of S. Aureus were
prepared on Nutrient agar slants by incubating the slants for 24 hrs at 37±0.5o C. Inoculum were
prepared from these freshly prepared colonies of S. Aureus by suspending 2-3 colonies in 1 mL
of sterile saline solution with the help of nichrome wire loop. The inoculum (0.5 ml) was spread
over the surface of nutrient agar plates and the plates were allowed to solidify prior to addition of
the formulation. The bores of 0.5 cm diameter were made with the borer and the formulation gel
samples were added in the bores. Plates were then kept for incubation at 37± 0.50C for 24 hrs.
After incubation the zone of inhibition (in mm) around the bores was measured.

International Standard Serial Number (ISSN): 2249-6807
305 Full Text Available On www.ijipls.com
9.In-vitro Drug Release Study: 15, 11, 16, 17
Figure no. 2Laboratory-assembled apparatus for Diffusion study
Laboratory-assembled apparatus resembling a Franz diffusion cell was used to determine the
release profile of drug from topical gel. The cell consisted of two chambers, the donor and the
receptor compartment between which a diffusion membrane (egg membrane) was mounted. The
donor compartment, with inner diameter 24 mm, was open i.e. exposed to the atmosphere at one
end and the receptor compartment was such that it permitted sampling. The diffusion medium
used was phosphate buffer solution pH 6.8 (PBS). 1 gm of the drug containing topical gel was
placed in the donor compartment separated from the receptor compartment by the egg
membrane. The egg membrane was previously soaked for 24 hr. in PBS. The donor and receptor
compartments were held together using a clamp. The position of the donor compartment was
adjusted so that egg membrane just touches the diffusion medium. The whole assembly was
fixed on a magnetic stirrer. The receptor compartment with 100 mL PBS was placed on a
thermostatically controlled magnetic stirrer. It was maintained at 37 ± 0.5ºC and stirred
constantly at 50 rpm. Samples of 1 mL were collected at predetermined time intervals and
analysed for drug content by UV Spectrophotometer at λmax against blank. The receptor phase
was replenished with an equal volume of phosphate buffer at each time of sample withdrawal.
(y=0.0025x + 0.0213, R2=0.9878)
International Standard Serial Number (ISSN): 2249-6807
306 Full Text Available On www.ijipls.com
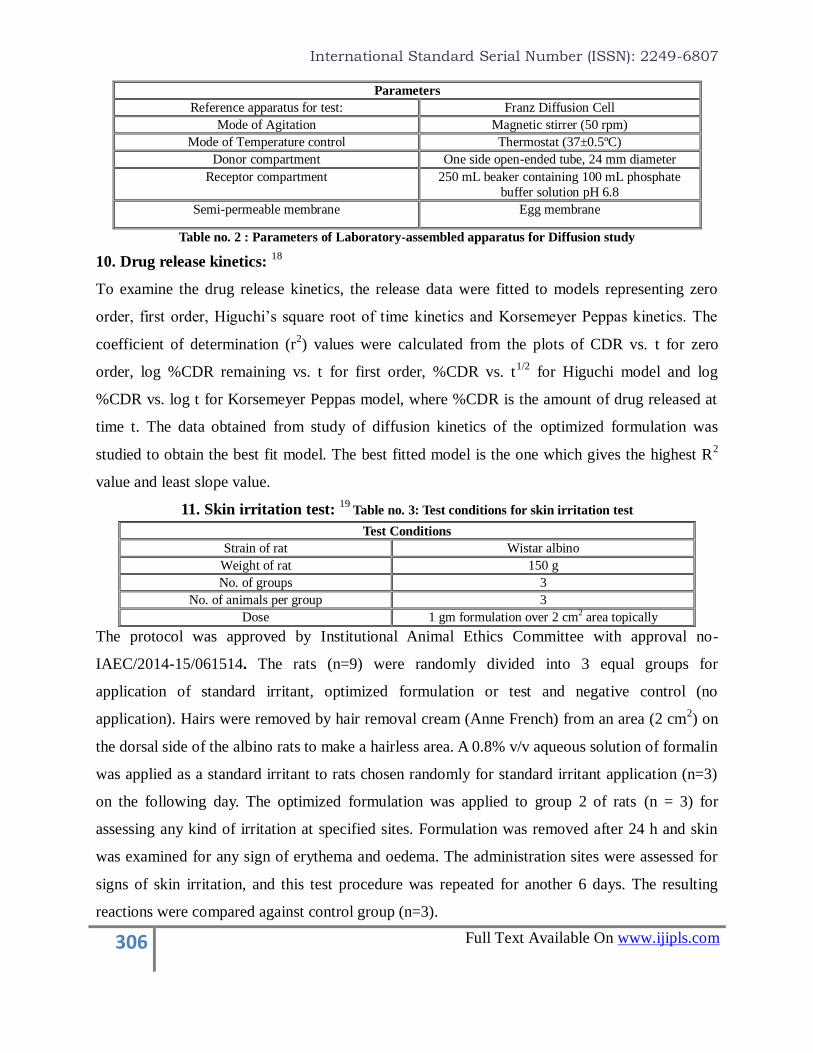
Parameters
Reference apparatus for test: Franz Diffusion Cell
Mode of Agitation Magnetic stirrer (50 rpm)
Mode of Temperature control Thermostat (37±0.5ºC)
Donor compartment One side open-ended tube, 24 mm diameter
Receptor compartment 250 mL beaker containing 100 mL phosphate
buffer solution pH 6.8
Semi-permeable membrane Egg membrane
Table no. 2 : Parameters of Laboratory-assembled apparatus for Diffusion study
10. Drug release kinetics: 18
To examine the drug release kinetics, the release data were fitted to models representing zero
order, first order, Higuchi’s square root of time kinetics and Korsemeyer Peppas kinetics. The
coefficient of determination (r2) values were calculated from the plots of CDR vs. t for zero
order, log %CDR remaining vs. t for first order, %CDR vs. t1/2
for Higuchi model and log
%CDR vs. log t for Korsemeyer Peppas model, where %CDR is the amount of drug released at
time t. The data obtained from study of diffusion kinetics of the optimized formulation was
studied to obtain the best fit model. The best fitted model is the one which gives the highest R2
value and least slope value.
11. Skin irritation test: 19
Table no. 3: Test conditions for skin irritation test
Test Conditions
Strain of rat Wistar albino
Weight of rat 150 g
No. of groups 3
No. of animals per group 3
Dose 1 gm formulation over 2 cm2 area topically
The protocol was approved by Institutional Animal Ethics Committee with approval no-
IAEC/2014-15/061514. The rats (n=9) were randomly divided into 3 equal groups for
application of standard irritant, optimized formulation or test and negative control (no
application). Hairs were removed by hair removal cream (Anne French) from an area (2 cm2) on
the dorsal side of the albino rats to make a hairless area. A 0.8% v/v aqueous solution of formalin
was applied as a standard irritant to rats chosen randomly for standard irritant application (n=3)
on the following day. The optimized formulation was applied to group 2 of rats (n = 3) for
assessing any kind of irritation at specified sites. Formulation was removed after 24 h and skin
was examined for any sign of erythema and oedema. The administration sites were assessed for
signs of skin irritation, and this test procedure was repeated for another 6 days. The resulting
reactions were compared against control group (n=3).

International Standard Serial Number (ISSN): 2249-6807
307 Full Text Available On www.ijipls.com
Sr. no. Score Rating
1. 0 Nil
2. 0-2 Mild
3. 2-4 Moderate
4. 4-6 Severe
5. 6 and above Very severe
Table no. 4: Score rating for skin irritation study
12. Accelerated Stability study: 20
Stability studies were conducted according to ICH guidelines 40°C± 2°C/75%RH ± 5%RH to
test physical appearance in terms of clarity, pH, viscosity and drug content were evaluated.
RESULTS AND DISCUSSION
Compatibility study FTIR:
The IR spectra of azelaic acid, polymer and physical mixture were generated. The IR absorption
bands observed in the IR spectrum of drug and polymers resembles with that of found in the
physical mixture proves compatibility of drug with polymers
Clarity:
On careful visual inspection against dark and white background, all the prepared gel
formulations were found to be free from any suspended particulate matter. All the formulations
were found to be clear.
Homogeneity:
After the visual inspection all the formulations were found to be free from aggregates, the
appearance was clear and gels were homogenous with no lumps or precipitate. Homogeneity test
of the gels showed that the drug was completely dissolved in the co-solvent, also all the
polymers and the drug solutions were mixed properly.
pH: Table no.6: pH values of formulations
Sr. no. Formulation code Observed pH (±SD)
1. F1 6.72±0.045
2. F2 6.73±0.044
3. F3 6.83±0.01
4. F4 6.89±0.02
5. F5 6.93±0.037
6. F6 6.91±0.049
7. F7 6.80±0.018
8. F8 6.96±0.032
9. F9 6.84±0.035
The pH of all the formulations from F1 to F9 was found to be in the range of 6.7 to 6.9.

International Standard Serial Number (ISSN): 2249-6807
308 Full Text Available On www.ijipls.com
Viscosity Determination:
The viscosity values of formulations are shown in table no.7
Rpm
Viscosity (cP) at Room Temperature
Formulation code
F1 F2 F3 F4 F5 F6 F7 F8 F9
1. 59990 64786 48556 53501 54397 54589 49190 46790 42556
2. 53991 57288 46321 52009 53225 50212 46091 35195 39568
3. 52490 46790 42115 51254 52597 45625 37392 25595 37432
Table no.7: Viscosity of formulations
Figure no.3: Viscosity profile of formulations
Viscosity v/s rpm plots for all formulations shows decrease in viscosity as shear rate (rpm) was
increased. Concentration of Na CMC and PG was a major factor affecting viscosity of
formulations.
Drug content: The Drug content of formulations is shown in table no.8.
Sr. no. Formulation code Drug content (%) (±S.D.)
1. F1 98.28±0.000091
2. F2 98.62±0.00005
3. F3 98.2±0.0002
4. F4 99.08±0.000014
5. F5 98.52±0.0042
6. F6 98.08±0.00016
7. F7 98.2±0.00013
8. F8 100.16±0.00016
9. F9 98.24±0.001
Table no.8: Drug content of topical gel
The percentage drug content of all prepared formulations was found to be in the range of 98-102 %.
0
10000
20000
30000
40000
50000
60000
70000
0 0.5 1 1.5 2 2.5 3 3.5
Vis
cosi
ty (C
p)
Speed (rpm)
ViscosityF2
F1
F3
F4
F5
F6
F7
F8
F9

International Standard Serial Number (ISSN): 2249-6807
309 Full Text Available On www.ijipls.com
Spreadability:
Sr.no. Formulation code Spreadability (gm.cm/sec)(± S.D)
1. F1 22.13±0.40
2. F2 16.25±0.70
3. F3 15.71±1.08
4. F4 20.31±0.70
5. F5 25.63±0.40
6. F6 16.25±1.73
7. F7 17.39±1.08
8. F8 22.13±0.81
9. F9 15.73±0.40
Table no.9: Spreadability of topical gel
Spreadability of gel is very important in the topical gel formulations. Spreadability shows direct
relation with the viscosity of the gel. Formulations with higher viscosities i.e. are very thick in
nature are difficult to spread, on the contrary gels having very low viscosities have fluid like
appearance, both the extremes are not suitable for any of the topical gel preparation. Hence gel
having optimum viscosity provides proper spreadability to the formulations.
Extrudability:
Sr.no. Formulation code Extrudability
1. F1 +
2. F2 +
3. F3 ++
4. F4 ++
5. F5 ++
6. F6 ++
7. F7 ++
8. F8 ++
9. F9 +++
Table no.10: Extrudability of topical gel
Antibacterial activity:
Sr.no. Formulation code S. Aureus
Zone Of Inhibition (mm) % Efficiency
1. Standard 10 100
2. F1 8 80
3. F2 7.3 73
4. F3 6.3 63
5. F4 7.2 72
6. F5 7.9 79
7. F6 7 70
8. F7 8 80
9. F8 9 90
10. F9 8.6 86
11. Marketed 10 100
Table no.11: zone of inhibition and % efficiency of topical gel
International Standard Serial Number (ISSN): 2249-6807
310 Full Text Available On www.ijipls.com
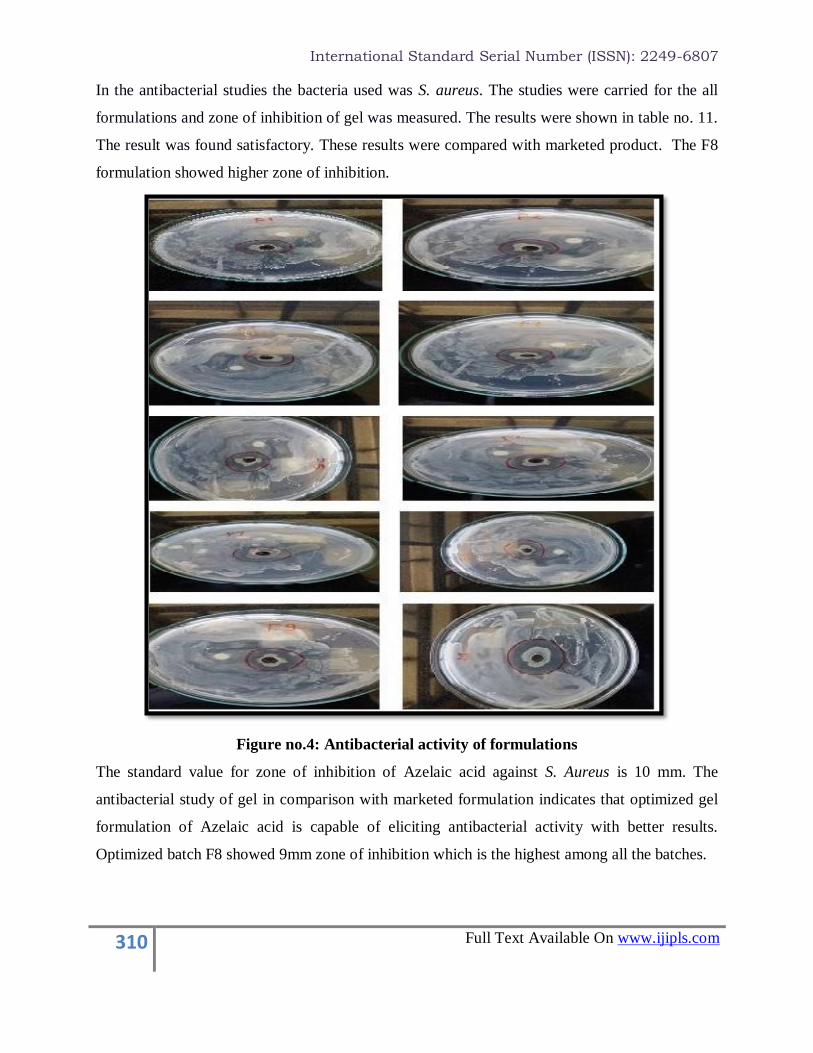
In the antibacterial studies the bacteria used was S. aureus. The studies were carried for the all
formulations and zone of inhibition of gel was measured. The results were shown in table no. 11.
The result was found satisfactory. These results were compared with marketed product. The F8
formulation showed higher zone of inhibition.
Figure no.4: Antibacterial activity of formulations
The standard value for zone of inhibition of Azelaic acid against S. Aureus is 10 mm. The
antibacterial study of gel in comparison with marketed formulation indicates that optimized gel
formulation of Azelaic acid is capable of eliciting antibacterial activity with better results.
Optimized batch F8 showed 9mm zone of inhibition which is the highest among all the batches.
International Standard Serial Number (ISSN): 2249-6807
311 Full Text Available On www.ijipls.com
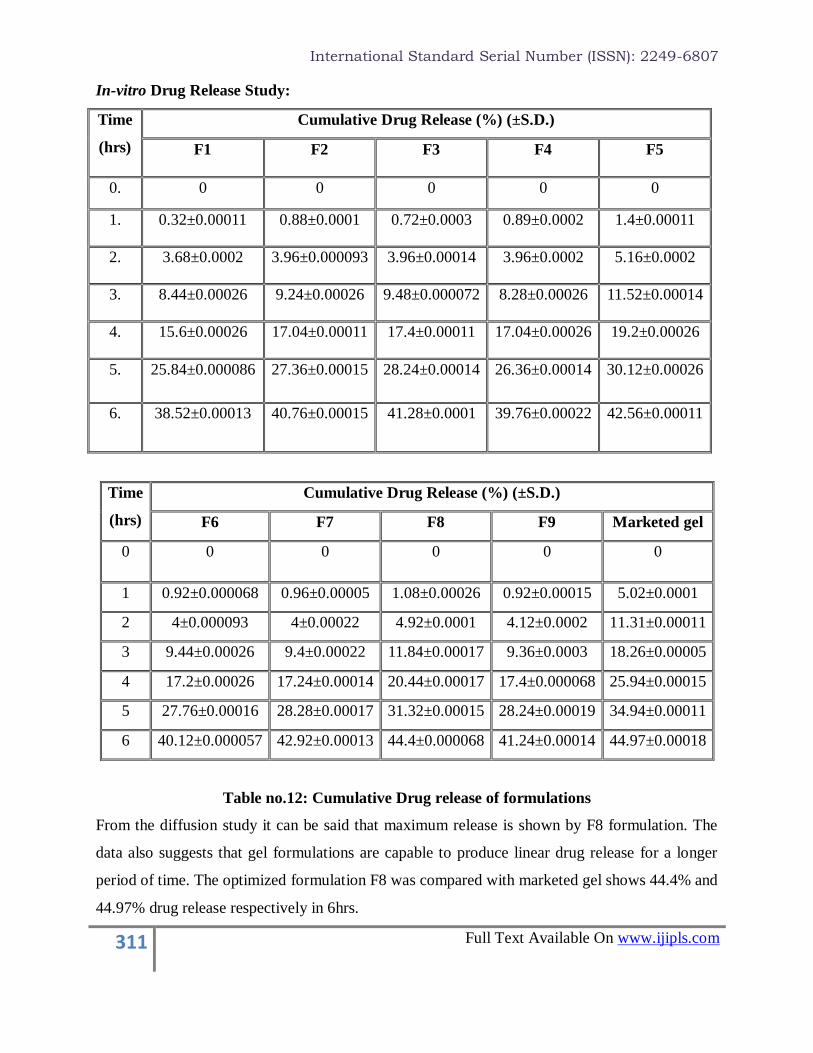
In-vitro Drug Release Study:
Time
(hrs)
Cumulative Drug Release (%) (±S.D.)
F1 F2 F3 F4 F5
0. 0 0 0 0 0
1. 0.32±0.00011 0.88±0.0001 0.72±0.0003 0.89±0.0002 1.4±0.00011
2. 3.68±0.0002 3.96±0.000093 3.96±0.00014 3.96±0.0002 5.16±0.0002
3. 8.44±0.00026 9.24±0.00026 9.48±0.000072 8.28±0.00026 11.52±0.00014
4. 15.6±0.00026 17.04±0.00011 17.4±0.00011 17.04±0.00026 19.2±0.00026
5. 25.84±0.000086 27.36±0.00015 28.24±0.00014 26.36±0.00014 30.12±0.00026
6. 38.52±0.00013 40.76±0.00015 41.28±0.0001 39.76±0.00022 42.56±0.00011
Time
(hrs)
Cumulative Drug Release (%) (±S.D.)
F6 F7 F8 F9 Marketed gel
0 0 0 0 0 0
1 0.92±0.000068 0.96±0.00005 1.08±0.00026 0.92±0.00015 5.02±0.0001
2 4±0.000093 4±0.00022 4.92±0.0001 4.12±0.0002 11.31±0.00011
3 9.44±0.00026 9.4±0.00022 11.84±0.00017 9.36±0.0003 18.26±0.00005
4 17.2±0.00026 17.24±0.00014 20.44±0.00017 17.4±0.000068 25.94±0.00015
5 27.76±0.00016 28.28±0.00017 31.32±0.00015 28.24±0.00019 34.94±0.00011
6 40.12±0.000057 42.92±0.00013 44.4±0.000068 41.24±0.00014 44.97±0.00018
Table no.12: Cumulative Drug release of formulations
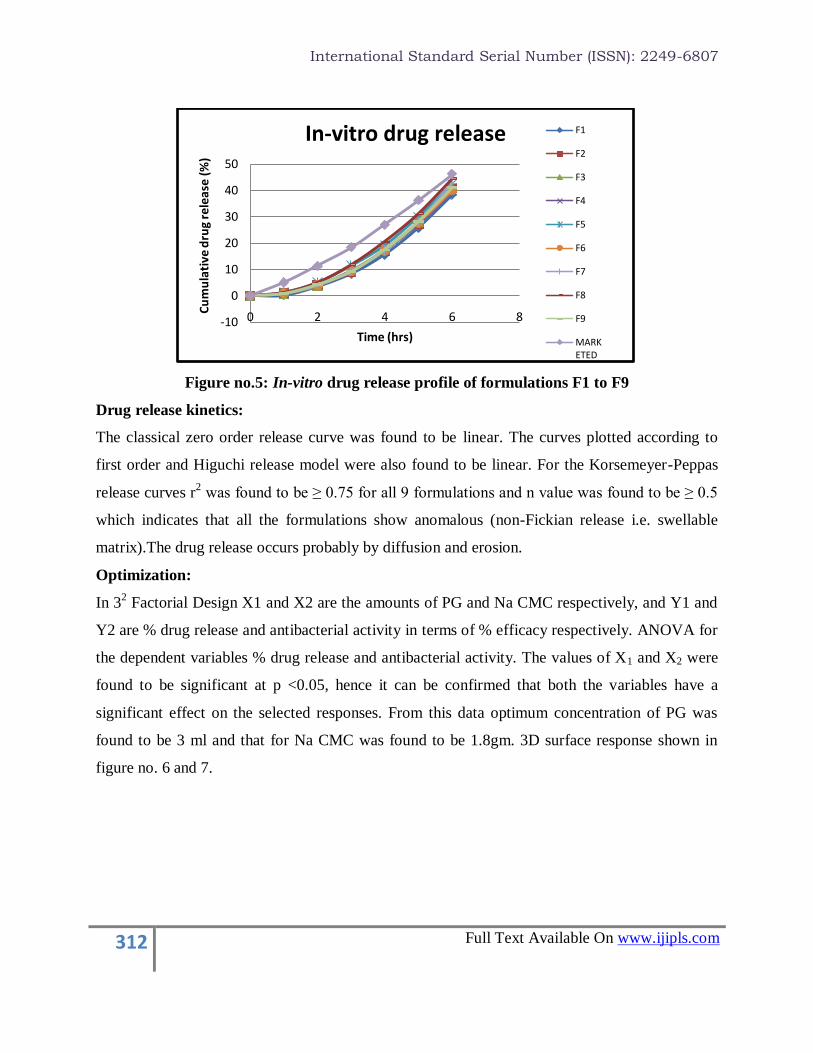
From the diffusion study it can be said that maximum release is shown by F8 formulation. The
data also suggests that gel formulations are capable to produce linear drug release for a longer
period of time. The optimized formulation F8 was compared with marketed gel shows 44.4% and
44.97% drug release respectively in 6hrs.
International Standard Serial Number (ISSN): 2249-6807
312 Full Text Available On www.ijipls.com
Figure no.5: In-vitro drug release profile of formulations F1 to F9
Drug release kinetics:
The classical zero order release curve was found to be linear. The curves plotted according to
first order and Higuchi release model were also found to be linear. For the Korsemeyer-Peppas
release curves r2 was found to be ≥ 0.75 for all 9 formulations and n value was found to be ≥ 0.5
which indicates that all the formulations show anomalous (non-Fickian release i.e. swellable
matrix).The drug release occurs probably by diffusion and erosion.
Optimization:
In 32 Factorial Design X1 and X2 are the amounts of PG and Na CMC respectively, and Y1 and
Y2 are % drug release and antibacterial activity in terms of % efficacy respectively. ANOVA for
the dependent variables % drug release and antibacterial activity. The values of X1 and X2 were
found to be significant at p <0.05, hence it can be confirmed that both the variables have a
significant effect on the selected responses. From this data optimum concentration of PG was
found to be 3 ml and that for Na CMC was found to be 1.8gm. 3D surface response shown in
figure no. 6 and 7.
-10
0
10
20
30
40
50
0 2 4 6 8
Cu
mu
lati
ve d
rug
rele
ase
(%
)
Time (hrs)
In-vitro drug release F1
F2
F3
F4
F5
F6
F7
F8
F9
MARKETED

International Standard Serial Number (ISSN): 2249-6807
313 Full Text Available On www.ijipls.com
Figure no.6: Surface response plot showing effect of propylene glycol and carboxymethyl
cellulose sodium on Drug release
It is shown that both the independent variables have a significant effect on the dependent
variable (drug release).
Figure no.7: Surface response plot showing effect of propylene glycol and carboxymethyl
cellulose sodium on antibacterial activity
International Standard Serial Number (ISSN): 2249-6807
314 Full Text Available On www.ijipls.com
The figures above show the effect of concentration of PG and Na CMC on drug release and
antibacterial activity. It is shown that both the independent variables have a significant effect on
the dependent variables.
Optimized formula:
After generating model equations relating main effects and responses various gel formulations
containing azelaic acid were optimized based on In-vitro drug release at 6 hours (Y1) and
antibacterial activity (Y2). The optimal values for responses were obtained by numerical analysis
based on the criteria of desirability and optimal batch was selected. Optimized batch (F8) having
highest drug release and antibacterial activity. This reveals that mathematical model obtained by
factorial design to produce optimized responses was well fitted.
Accelerated stability study:
Results of the stability studies showed that there is no change in the physical parameters of the
formulation. Drug content of the formulation was found to be same as that before stability
testing.
CONCLUSION
The present study was conducted with the view to formulate a topical gel formulation of Azelaic
acid for effective treatment of acne. In the present investigation, an attempt was made to develop
antiacne topical gel of Azelaic acid using Propylene glycol as co-solvent and penetration
enhancer and Na CMC used as gelling agent and bioadhesive polymer which would increase the
residence time of applied gel thus prolonging the drug delivery which would thus increase the
patient compliance due to reduced frequency of application. The prepared topical gels were
characterized by clarity, homogeneity, pH, drug content, spreadability, extrudability, in-vitro
drug release, antibacterial activity, skin irritation test and stability studies.
REFERENCES
1. Singh Deepak, Hatwar Bhushan, Nayak S. Herbal Plants and Propionibacterium Acnes: An Overview.
International Journal of Biomedical Research 2011; 2(9):486-98.
2. Victoria Goulden. Guidelines for the Management of Acne Vulgaris in Adolescents.Pediatr Drugs 2003; 5 (5):
301-313.
3. http://www.drugbank.ca/drugs/DB00548 Accessed On 13 Aug. At 12.25pm.
4. Banker GS, Rhodes CT. Modern Pharmaceutics. Fourth Edition, Revised and Expanded, New York: Marcel
Dekker, pn.193, 202-08, 607-24.
5. Muhammed Alzweiri, Yusuf M. Al-Hiari, Talal Aburjai, Osama Abdel-Aldaem. On-Column Approach in the
HPLC-UV Analysis of Non-chromophoric Compounds Using Azelaic Acid as a Model. Jordan Journal of
Pharmaceutical Sciences 2012; 5(3): 243-50.
International Standard Serial Number (ISSN): 2249-6807
315 Full Text Available On www.ijipls.com
6. Pavia DL, Lampman GM, Kriz GS, Vyvyan JR. Spectroscopy. New Delhi: Cengage learning; 2007: 38.
7. Saroha K, Singh S, Aggarwal A, Nanda S. Transdermal Gels- An Alternative Vehicle For Drug Delivery
International Journal Of Pharmaceutical, Chemical And Biological Sciences. 2013; 3(3): 495-503.
8. Banker GS, Rhodes CT. Modern Pharmaceutics. Fourth Edition, Revised and Expanded, New York: Marcel
Dekker, pn.193, 202-08, 607-24.
9. Gurjar NB, Barot BS, Shelat PK. Development and Evaluation of Cinnamon and Aloe Vera Containing Herbal
Antiacne Gel. International Journal of Pharmacy and Industrial Research 2012; 2(4): 446-51.
10. Asif Nawaz, Syed Umer Jan, Nauman Rahim Khan, Abid Hussain, Gul Majid Khan. Formulation and In-
vitroEvaluation of Clotrimazole Gel Containing Almond Oil and Tween 80 as Penetration Enhancer for Topical
Application.Pak J Pharm Sci 2013; 26(3):617-22.
11. Chandira RM, Pradeep, Pasupathi A, Bhowmik D, Chiranjib, Jayakar B, Tripathi K , Sampath Kumar KP.
Design, Development and Formulation of Antiacne Dermatological Gel.Journal of Chemical and Pharmaceutical
Research 2010, 2(1): 401-414.
12. Patel Kalpesh K, Mehta Neel J, Dhandhalia Milan C, Bhanupriy Alkesh K, Shastri Divyesh H, Shelat Pragna K,
Shah Gaurang B.Development and Evaluation Of Herbal Anti-Acne Formulation. Research Journal of
Pharmaceutical, Biological and Chemical Sciences 2012; 3(3):334-39.
13. Andrew Fitton,Karen L Goa. Azelaic Acid: A Review of its Pharmacological Properties and Therapeutic
Efficacy in Acne and Hyperpigmentary Skin Disorders. Drugs 1991; 41 (5): 780-798.
14. Colin Charnock, Bjarne Brudeli, Jo Klaveness. Evaluation of the antibacterial efficacy of diesters of Azelaic
acid. European Journal of Pharmaceutical Sciences 2004; 21:589–596.
15. Barry BW. Drug Delivery Routes in Skin: A Novel Approach. Advanced Drug Delivery Reviews 54 Suppl. 1
(2002): S31–S40.
16. Ravi R, Senthil Kumar SK, Parthiban S. Formulation and Evaluation of the Microsponges Gel for an anti-acne
agent for the treatment of acne. Indian Journal of Pharmaceutical Science and Research 2013; 3(1):32-38.
17. Nataraj KS, Surya GNV, Narasimha Raju, Bevara Anusha. UV Spectrophotometric Method Development for
Estimation of Clindamycin Phosphate in Bulk And Dosage Form. International Journal of Pharmacy and Biological
Sciences 2013; 3(4):164-67.
18. Costa L, Lobo JMS, Modeling and comparison of dissolution profiles, European Journal of pharmaceutical
sciences 2001; 13:123-33.
19. Charde YM et al. Development and Evaluation of Herbal Formulation for the treatment of Acne. International
Journal of Pharmaceutical Sciences and Research 2014; 5(6): 2250-60.
20. International Conference on Harmonization Steering Committee. ICH Harmonized Tripartite Guideline-
Stability Testing of New Drug Substances and Products. ICH Q1A (R2); February 6, 2003.
Related Documents