INVESTOR PRESENTATION FY13-Q4 | July 31, 2013 Unleashing the Power of Information

Welcome message from author
This document is posted to help you gain knowledge. Please leave a comment to let me know what you think about it! Share it to your friends and learn new things together.
Transcript

I N V E S T O R P R E S E N T A T I O N
FY13-Q4 | July 31, 2013
Unleashing the Power of Information

Safe Harbor Statement
Certain statements in this presentation, including statements about the focus of Open Text Corporation (“OpenText” or
“the Company”) in fiscal 2014 on growth in earnings and cash flows, creating value through investments in broader EIM
capabilities, distribution, the Company’s presence in the cloud and in growth markets, its financial conditions, results of
operations and earnings; declaration of quarterly dividends; and other matters, are considered forward-looking
statements or information under applicable securities laws. Such forward-looking statements involve known and
unknown risks, uncertainties and other factors and assumptions that may cause the actual results, performance or
achievements to differ materially. Such factors include, but are not limited to, (i) the future performance, financial and
otherwise, of OpenText; (ii) the ability of OpenText to bring new products to market and to increase sales; (iii) the
strength of the Company's product development pipeline; (iv) the Company's growth and profitability prospects; (v) the
estimated size and growth prospects of the EIM market; (vi) the Company's competitive position in the EIM market and
its ability to take advantage of future opportunities in this market; (vii) the benefits of the Company's products to be
realized by customers; (viii) the demand for the Company's product and the extent of deployment of the company's
products in the EIM marketplace; and (ix) the Company's financial condition and capital requirements. The risks and
uncertainties that may affect forward-looking statements include, but are not limited to: (i) integration of acquisitions and
related restructuring efforts, including the quantum of restructuring charges and the timing thereof; (ii) the possibility that
the Company may be unable to meet its future reporting requirements under the Securities Exchange Act of 1934, as
amended, and the rules promulgated there under; (iii) the risks associated with bringing new products to market; (iv)
fluctuations in currency exchange rates; (v) delays in the purchasing decisions of the Company's customers; (vi) the
competition the Company faces in its industry and/or marketplace; (vii) the possibility of technical, logistical or planning
issues in connection with the deployment of the Company's products or services; (viii) the continuous commitment of the
Company's customers; and (ix) demand for the Company's products. For additional information with respect to risks and
other factors which could occur, see the Company's Annual Report on Form 10-K, Quarterly Reports on Form 10-Q and
other securities filings with the SEC and other securities regulators. Readers are cautioned not to place undue reliance
upon any such forward-looking statements, which speak only as of the date made. Unless otherwise required by
applicable securities laws, the Company disclaims any intention or obligation to update or revise any forward-looking
statements, whether as a result of new information, future events or otherwise.
COPYRIGHT © 2013 OPEN TEXT CORPORATION. ALL RIGHTS RESERVED. 2

(NASDAQ: OTEX, TSX: OTC) $1.3B+ global revenue EIM $13B market* (ECM, BPM, CEM, iX, Discovery)
20 years of proven innovation 31 country offices, 141 countries supported
Scale and Momentum
*as per notes on slide 6
3

Investment Highlights
Demonstrated earnings power and operational discipline
Grew organic licenses 6% for 2HFY13 over 2HFY12
Cloud services continue to perform well
Non-cumulative quarterly dividend of US$0.30 per
Common Share*
Growth drivers:
o Sales force expansion
o Opportunities in fast growing markets
o Partner channel expansion
o New products and cloud services offerings
*As of June 30, 2012
4
*The Board of Directors is under no obligation to declare dividends in the future and the declaration of
future dividends is wholly within its discretion

Information Transformation
5
EIM
Information-Based Strategies
Internet / World-wide Web
Client / Server Technologies
Mainframe Computing
40 Years 20 Years
15 Years
5 Years
2 Years
Today
10 Years
Enterprise Resource Planning
Web 2.0 3 Years
SAAS / Social Media
Mobile 1 Year
Cloud
1950

SOURCES
• ECM, BPM: Gartner Forecast Enterprise Software Markets, 2009-2016 1Q12
Update
• InfoExchange: Research and Markets, Computer-based Fax Markets, 2010-2015,
Gartner Enterprise Software Markets, 2009-2016
1Q12 Update, Davidson Consulting, Fax Server Industry Forecast, 2011-2016
Customer win:
Emergency Medicine
Physicians Information
Exchange
Discovery CEM BPM ECM
2012
$4.6B Market
7.2% Growth
2011-2016
9.9 % CAGR
2012
$2.6B Market
7.9% Growth
2011-2016
7.2% CAGR
2012
$1.35B Market
14% Growth
2011-2016
14.3% CAGR
2012
$3.2B Market
11.4% Growth
2011-2015
11.4% CAGR
2012
$1.4B Market
14% Growth
2011-2015
15.9% CAGR
• CEM: Gartner Magic Quadrant for Web Content Management, 10 Nov. 2011
• Discovery: Gartner Market Trends: Expect Disruption and Divergence in the
E-Discovery Software Market, 16 Dec. 2011
Enterprise Information Management
$13 Billion Opportunity, 10% Growth*
*Growing to $19B market in 2016
*Based on projected annualized growth rate as applied to current $13B market opportunity 6

Why OpenText Will Lead the EIM Market
1. Market Evolution The market evolving from ECM to Enterprise Information Management (EIM)
2. Well Positioned OpenText is well positioned in EIM with market leading product offerings and industry
expertise
3. Trusted Vendor A world class customer base and strong history of partner relationships with SAP and
global SI influencers establish OpenText as a trusted, dependable vendor
4. Packaged Apps A clear focus on delivering packaged applications that are EIM information-centric
(not transaction-centric)
5. Cloud Services Services and applications offered in a cloud deployment to effectively manage
EIM assets and optimize business processes
COPYRIGHT © 2012 OPEN TEXT CORPORATION. ALL RIGHTS RESERVED. 7
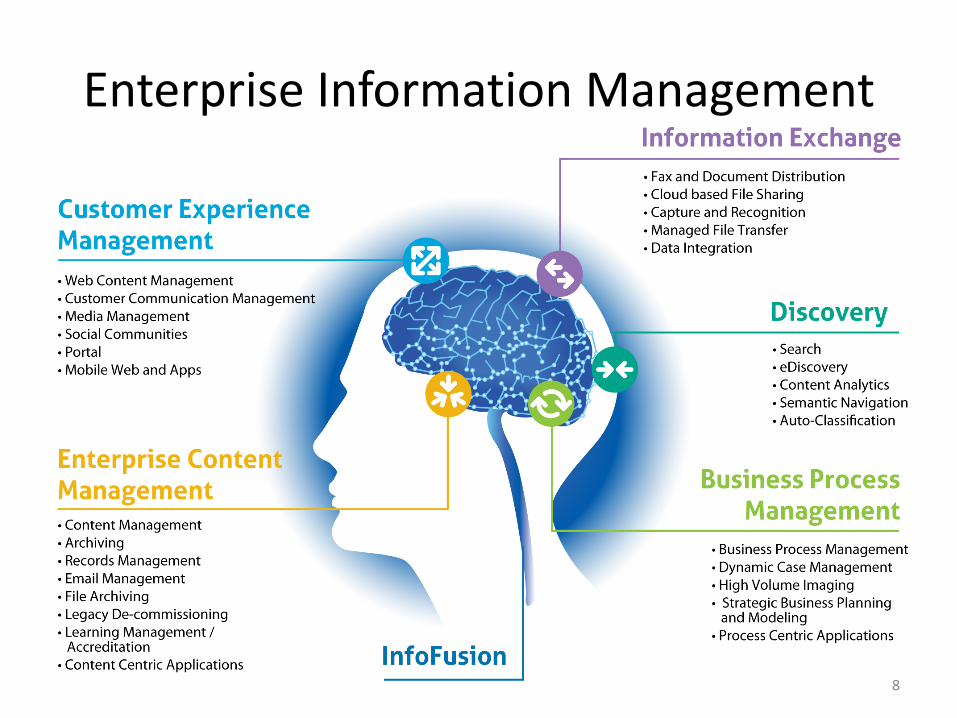
Enterprise Information Management Unleashing the Power of Information Enterprise Information Management
8

Distribution Model
Direct Sales Force AE, ISR, Specialists
Strategic Alliances
System Integrators SI / FSI
VARs
Distributors
OEM
Technology Alliances
Gro
wth
an
d O
pp
ort
un
ity
9
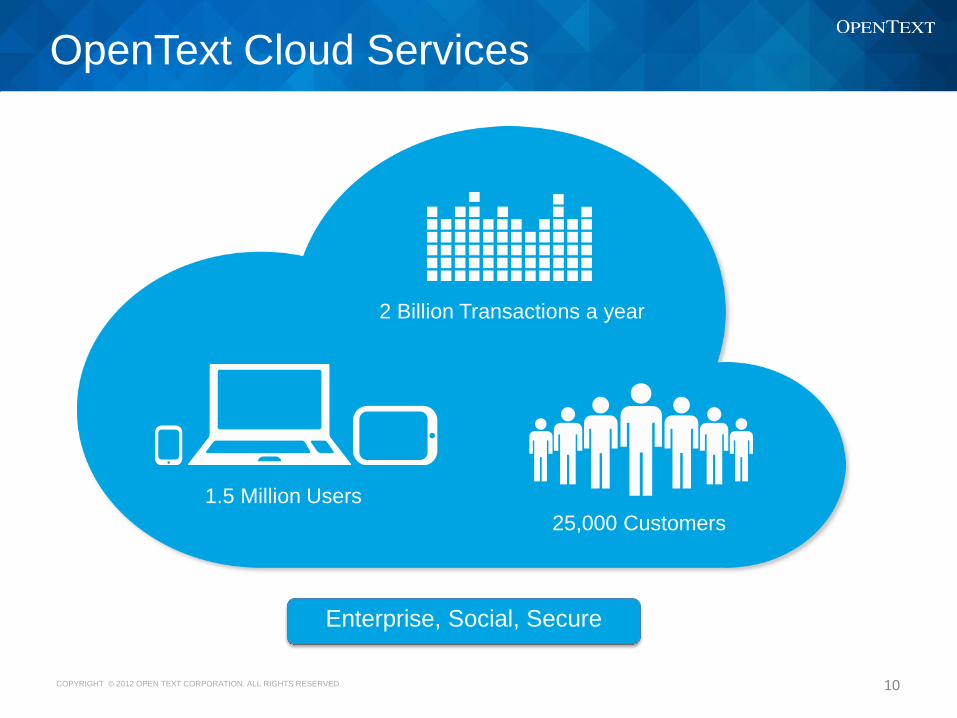
OpenText Cloud Services
COPYRIGHT © 2012 OPEN TEXT CORPORATION. ALL RIGHTS RESERVED.
Enterprise, Social, Secure
2 Billion Transactions a year
1.5 Million Users
25,000 Customers
10

From ‘on Premises’ to ‘the Cloud’
• TempoBox
• TempoSocial
• Capture & OCR
• EIM Cloud Services
• ECM, BPM, CEM,
iX, Discovery
11
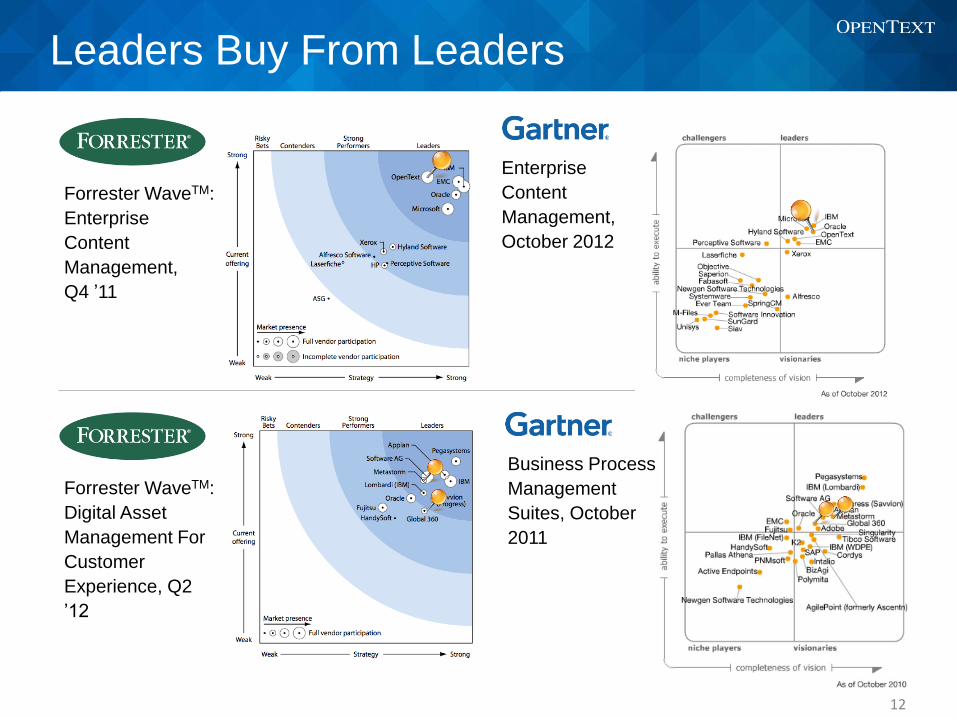
Leaders Buy From Leaders
Forrester WaveTM:
Digital Asset
Management For
Customer
Experience, Q2
’12
Business Process
Management
Suites, October
2011
Enterprise
Content
Management,
October 2012
Forrester WaveTM:
Enterprise
Content
Management,
Q4 ’11
12
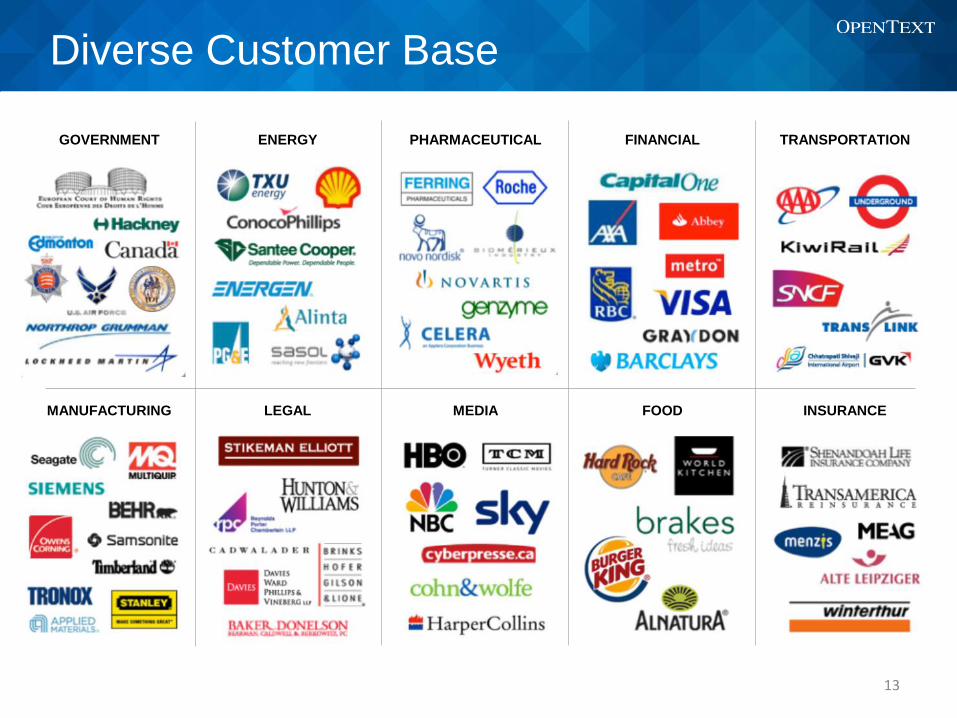
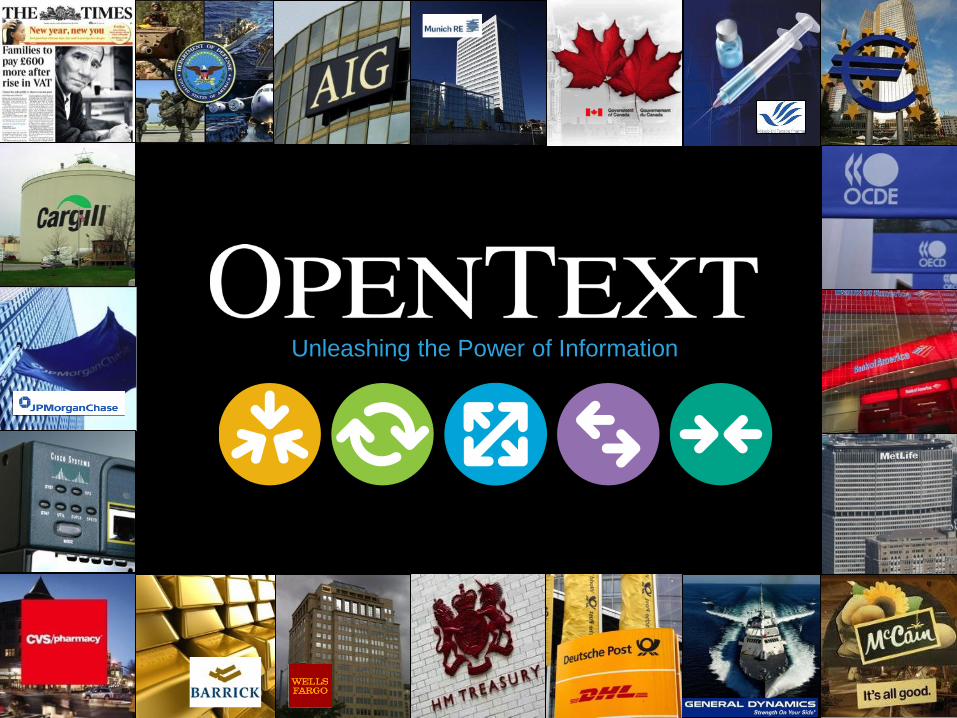
Diverse Customer Base
GOVERNMENT ENERGY PHARMACEUTICAL FINANCIAL TRANSPORTATION
MANUFACTURING LEGAL MEDIA FOOD INSURANCE
13

14
Customer Win | CONSOL Energy
CONSOL Energy, the leading diversified energy producer in the Appalachian basin, producing both natural gas and high-BTU coal, is a long standing customer of OpenText Content Server for document management. CONSOL Energy has extended their investment in OpenText, adding OpenText enhancements for Report Management, Secure file sharing, Advanced reporting capabilities, CAD Drawing management and additional user licensing.
15
Customer Win | The U.S. Department of Education
Through the Office of Federal Student Aid, the U.S. Department of Education (DoED) awards about $150 billion a year in grants, work-study funds, and low-interest loans to more than 14 million students. The DoED has extended its investment in the OpenText MetaStorm Integration & Managed File Transfer solution, providing the DoED with a single platform to manage both batch and real-time, system-based integrations and processes complete with an audit trail to ensure operational success.
16
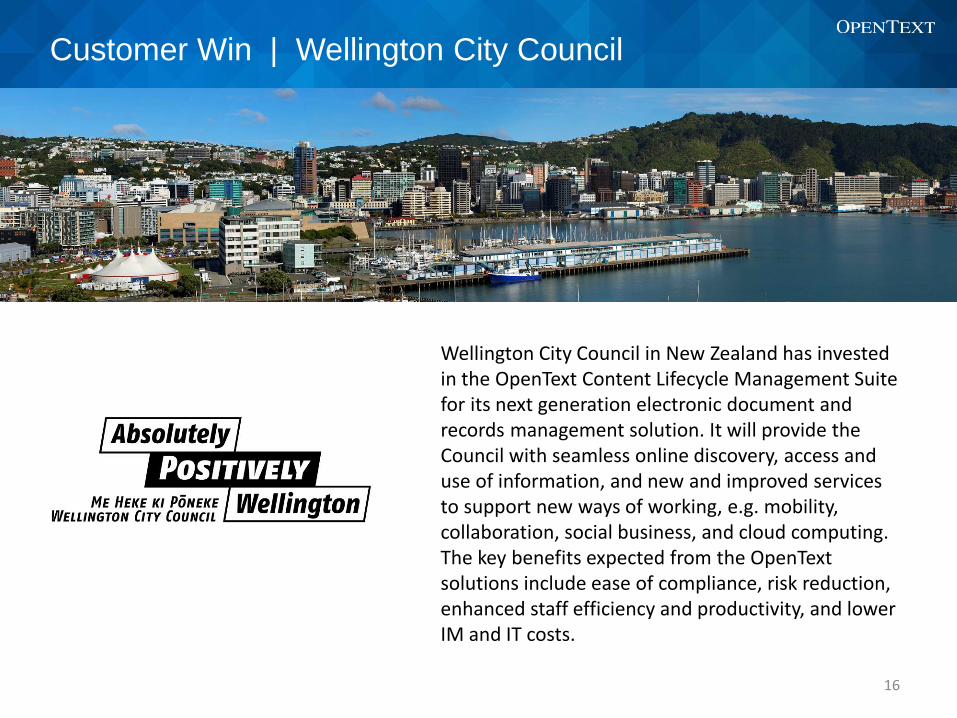
Customer Win | Wellington City Council
Wellington City Council in New Zealand has invested in the OpenText Content Lifecycle Management Suite for its next generation electronic document and records management solution. It will provide the Council with seamless online discovery, access and use of information, and new and improved services to support new ways of working, e.g. mobility, collaboration, social business, and cloud computing. The key benefits expected from the OpenText solutions include ease of compliance, risk reduction, enhanced staff efficiency and productivity, and lower IM and IT costs.

17
Customer Win | Apotex
Apotex Inc., the largest Canadian-owned pharmaceutical company, is a long time Enterprise Content Management customer, using OpenText solutions to distribute all GxP related documentation and procedures to their employees. Most recently, Apotex extended their strategic investment in OpenText by expanding usage to include affiliates and added capabilities to enhance the user experience, greatly simplifying deployment.

18
Customer Win | MAN Diesel & Turbo
MAN Diesel & Turbo, the world market leader for large diesel engines for use in ships and power stations, and one of the three leading suppliers of turbo machines, has extended its investment in OpenText with the purchase of OpenText Email Management/ Archiving for Microsoft Exchange, Extended ECM for SAP® Solutions and Application Governance & Archiving for Microsoft SharePoint, to provide employees with 360 degree views on documents for cases and business processes; extend SharePoint functionality; and provide unified archiving and compliant records.

19
Customer Win | Hasbro
A long time customer, Hasbro continues to accelerate their blueprint for growth by taking advantage of OpenText’s EIM Suite of technologies. Hasbro has invested in the full EIM suite of OpenText to service all of their content management platforms from Digital Assets to Marketing, to Licensing, extending SAP, Hasbro Studios and much more. Hasbro Content Services is a key part of Hasbro’s plan to reinvent itself as a global brand and media empire as they have expanded from being purely a toy manufacturer to now launching Hasbro Studio’s and launching full feature length movies such as GI Joe and the Transformers.
20
Customer Win | Marvel Entertainment, LLC
Marvel Entertainment, LLC, is undergoing initiatives to modernize their infrastructure of technologies, and has invested with OpenText to support a variety of technologies and use-cases. Starting with the modernization of their publishing operations, OpenText Media Management will be utilized to provide greater efficiencies in how content is produced and distributed, and more importantly, their global licensing operations will be powered by the OpenText CEM suite of products. Marvel interacts with thousands of licensees globally, and with the OpenText WEM/Portal platform along with OpenText Assure BPM to facilitate the review and routing of approvals with their licensees, Marvel looks to expand their revenue generating capabilities utilizing OpenText technologies.

21
Customer Win
Daimler South East Asia Pte. Ltd., currently using OpenText Content Server for their DMS, has invested in OpenText Capture Centre (OCC), for their Optical Character Recognition (OCR) initiative. The OCR Process Automation project will automate one of the core business processes for Financial Services. Customer information will be scanned and OCC will be used to extract the relevant data, validate the missing fields, and request for additional information. The scanned documents will be stored and archived in OpenText Archive Server.

History of Growing Revenue Y/Y in $M: 7 Fiscal Years
125.6 142.8 150.5 166.5 203.6 257.2 251.7
287.6 363.6
405.3
507.5
560.5
656.6 658.2
173.8
182.5
219.1 229.8
238.1
269.2
293.7
279.6
0
200
400
600
800
1000
1200
1400
1600
FY07$595.7
FY08$725.5
FY09$785.7
FY10$912.0
FY11$1033.3
FY12$1207.5
FY13$1363.3
Service Customer Support Cloud License
7 Year CAGR 18.7%*
*FY06 Revenue $409.6 million
COPYRIGHT © 2012 OPEN TEXT CORPORATION. ALL RIGHTS RESERVED. 22

History of Growing Non-GAAP EPS Y/Y: 7 Fiscal Years
$-
$1.00
$2.00
$3.00
$4.00
$5.00
$6.00
FY07$1.46
FY08$2.03
FY09$2.51
FY10$3.12
FY11$4.07
FY12$4.60
FY13$5.57
7 Year CAGR 27.6%*
COPYRIGHT © 2012 OPEN TEXT CORPORATION. ALL RIGHTS RESERVED. 23 *FY06 non-GAAP EPS $1.01
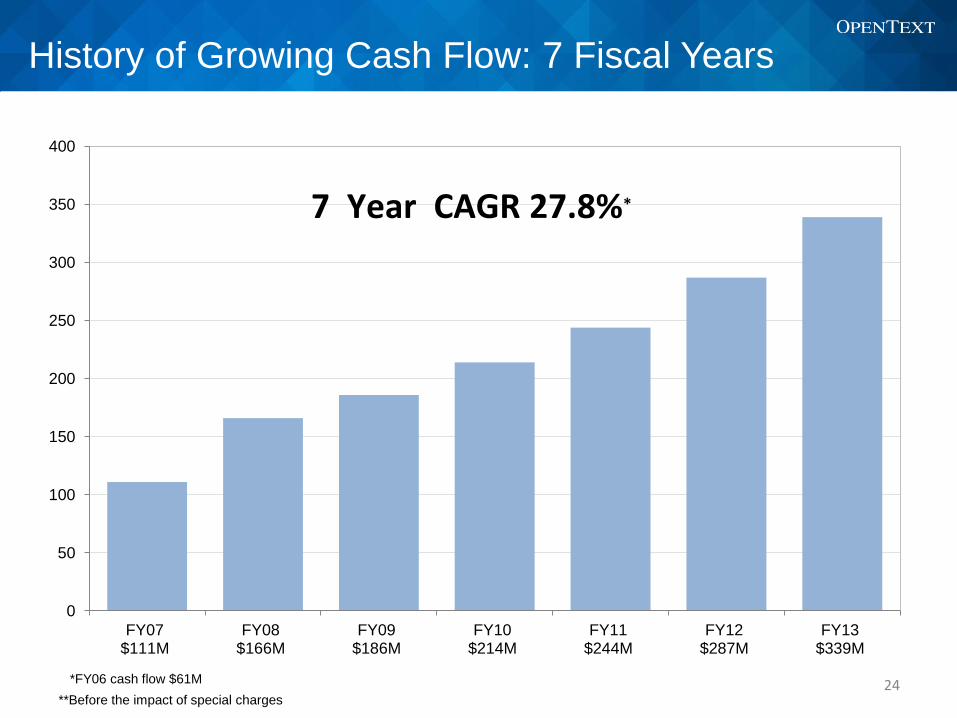
History of Growing Cash Flow: 7 Fiscal Years
0
50
100
150
200
250
300
350
400
FY07$111M
FY08$166M
FY09$186M
FY10$214M
FY11$244M
FY12$287M
FY13$339M
7 Year CAGR 27.8%*
B**Before the impact of special charges 24 *FY06 cash flow $61M

OpenText delivered:
$1.43 Non-GAAP-based
Earnings Per Share –
Diluted* Up 22.2 percent
$347.3 million Revenue Up 13.6 percent
$78.8 million License Up 1.0 percent
$84.7 million Non-GAAP-based
Net Income* Up 22.5 percent
$65.2 million** Operating Cash Flow Down 18.3 percent
$1.17
$1.43
22.2%
Q4
FY12
Q4
FY13
25
Q4 FY13 Overview (Y/Y)
* See reconciliation of Non-GAAP measures to GAAP measures at the end of this presentation
** Inclusive of a $27.0 million litigation settlement relating to a legacy EasyLink liability. Absent the
impact of this settlement operating cash flow was up15.5%.

FY13 – Q4 Financial Highlights
26
Total revenue $347.3 million up 14% Y/Y
Revenue by Geography:
Americas 54%
EMEA 36%
Asia Pacific 10%
5 deals over $1 million, compared to 8 Y/Y
15 deals between $500K and $1 million,
compared to 12 Y/Y
Total Revenue Up 14% Y/Y Non-GAAP EPS Up 22% Y/Y
Non-GAAP-based EPS, diluted was $1.43 compared
to $1.17 Y/Y(1)
GAAP–based EPS, diluted was $0.71 compared to
$0.14 Y/Y
Non-GAAP-based operating margin 29.5%(1)
GAAP-based operating margin 14.2%
Non-GAAP tax rate: 14%
Total Revenue Up 7%
$78.8 million up 1% Y/Y
License revenue from new accounts: 38%
Partners contributed 31%
Average deal size > $75K: $294K
License Revenue Up 1% Y/Y Operating Cash Flow Down 18% Y/Y
$65.2 million in operating cash flow, compared
to $79.8 million Y/Y(2)
Cash and cash equivalents $470.4 million
Total debt $565.5 million as of June 30, 2013
(1) See reconciliation of Non-GAAP measures to GAAP measures at the end of this presentation
(2) Inclusive of a $27.0 million litigation settlement primarily relating to a legacy EasyLink
liability. Absent the impact of this settlement operating cash flow was up16%.
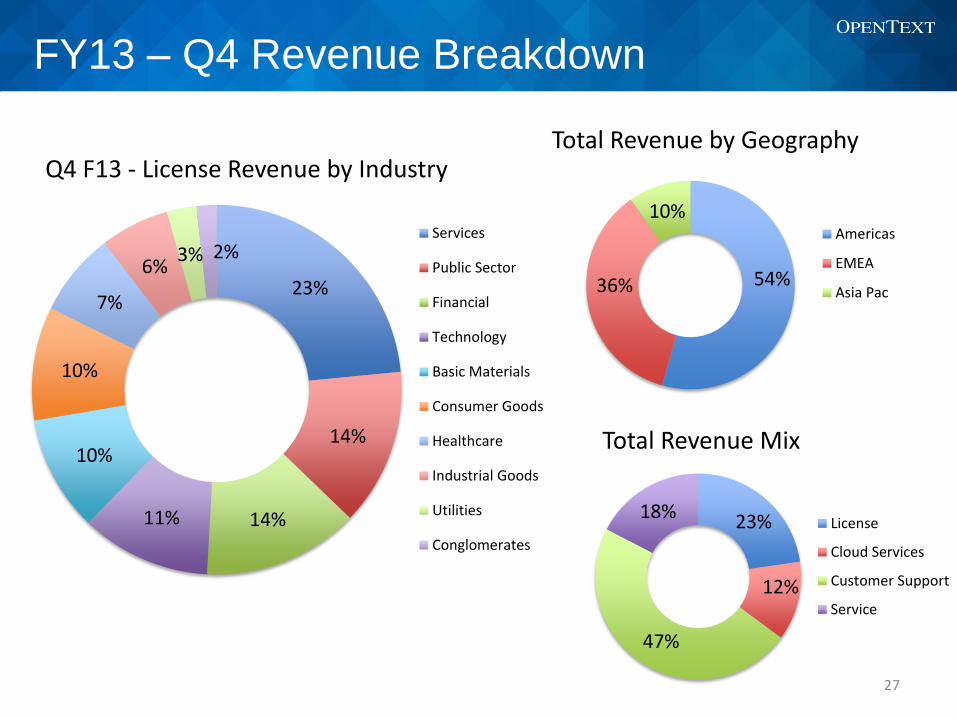
FY13 – Q4 Revenue Breakdown
27
23%
14%
14% 11%
10%
10%
7%
6% 3% 2%
Q4 F13 - License Revenue by Industry
Services
Public Sector
Financial
Technology
Basic Materials
Consumer Goods
Healthcare
Industrial Goods
Utilities
Conglomerates
54% 36%
10%
Total Revenue by Geography
Americas
EMEA
Asia Pac
23%
12%
47%
18%
Total Revenue Mix
License
Cloud Services
Customer Support
Service

FY13 – Financial Highlights
Total Revenue Up 13% Y/Y
Total revenue of $1.4 billion, up 13% Y/Y
Revenue by geography:
Americas 54%
EMEA 36%
Asia Pacific 10%
23 deals >$1 million, compared to 23 Y/Y
45 deals between $500K and $1 million, compared
to 60 Y/Y
License Revenue Up 6% 2H/2H Strong Balance Sheet
(1) See reconciliation of Non-GAAP measures to GAAP measures at the end of this presentation
Operating Cash Flow Up 20% Y/Y
Operating cash flow $318.5 million compared
to $266.5 million Y/Y(3)
Cash and cash equivalents $470.4 million
Total debt $565.5 million as of June 30, 2013
Non-GAAP EPS Up 21% Y/Y
Non-GAAP-based EPS, diluted was $5.57
compared to $4.60 up 21.1% Y/Y(1)
GAAP–based EPS, diluted was $2.51 compared
to $2.13Y/Y
Non-GAAP-based operating margin was 29.3%(2)
GAAP-based operating margin was 14.5%
Non-GAAP tax rate: 14%
License revenue $279.6 million, down 4.8% Y/Y
Partners contributed 41%
Average deal size: $279K
(2)before taxes and interest expense
28
(3) Inclusive of a $27.0 million litigation settlement primarily relating to a legacy EasyLink
liability. Absent the impact of this settlement operating cash flow was up 30%.

FY13 –Revenue Breakdown
COPYRIGHT © 2012 OPEN TEXT CORPORATION. ALL RIGHTS RESERVED.
20%
16%
14% 11%
11%
10%
6%
6% 5% 1%
F13 - License Revenue by Industry
Services
Financial
Technology
Consumer Goods
Public Sector
Basic Materials
Healthcare
Industrial Goods
Utilities
Conglomerates
54% 36%
10%
Total Revenue by Geography
Americas
EMEA
Asia Pac
21%
13%
48%
18%
Total Revenue Mix
License
Cloud Services
Customer Support
Service
29

Global Business
30
Americas
F13 Revenue $734.6m
Y/Y Growth 16%
% of Business 53.89%
EMEA
FY13 Revenue $492.9m
Y/Y Growth 4%
% of Business 36.15%
APJ
FY13 Revenue $135.8m
Y/Y Growth 39%
% of Business 9.96%
Fiscal 2013
WW HQ
Waterloo, ON
New York, NY
Washington, DC
Atlanta, GA
San Francisco,
CA
Austin, TX
Tucson, AZ
Bellevue, WA
Sao Paulo, SP
Reading, UK
Paris, FR
EMEA HQ
Grasbrunn, DE
Ottawa, ON
Stockholm, SE
Richmond Hill, ON
Johannesburg, SA
APJ HQ
Sydney, AU
Singapore
Tokyo, JN
Melbourne, AU
Hyderabad,
IN
Mumbai
IN
Hong Kong

Business Highlights
31
Services, public sector, financial and technology industries saw the most demand
5 license transactions over $1 million and 15 license transactions between $500K
and $1 million
Customer successes in the quarter include Apotex, CONSOL Energy, Daimler South
East Asia Pte Ltd, Hasbro, MAN Diesel & Turbo, Marvel Entertainment, LLC, The
U.S. Department of Education and Wellington City Council.
OpenText unveils responsive, intuitive web experience management solution for
targeted, more interactive online customer experiences and extends partner
ecosystem for web experience management
OpenText EIM products to support SAP HANA®, cloud and mobility offerings, and
expands reach of its cloud-based solutions now included in SAP® Cloud for Travel
solution
OpenText acquires long-standing partner ICCM Professional Services Limited
(ICCM), on May 23, 2013. Based in Malmesbury, United Kingdom, ICCM is focused
on BPM Smart Process Applications.
OpenText named a leader in independent research firm's Smart Process Applications
report
OpenText appoints Noriyuki Hayakawa as President, OpenText Japan
Dividend Program Highlights
32
To reward stockholders’ investments OpenText has adopted a policy
to declare non-cumulative quarterly dividends
The Board of Directors has declared a dividend of US$0.30 per
Common Share*
Payable to shareholders of record on August 30, 2013
Dividend to be paid on September 20, 2013
OpenText has declared the dividend in U.S. dollars
Registered holders may elect to receive dividends in U.S. dollars or
Canadian dollars
OpenText does not currently have a dividend reinvestment program
(DRIP)
*The Board of Directors is under no obligation to declare dividends
in the future and the declaration of future dividends is wholly within
its discretion
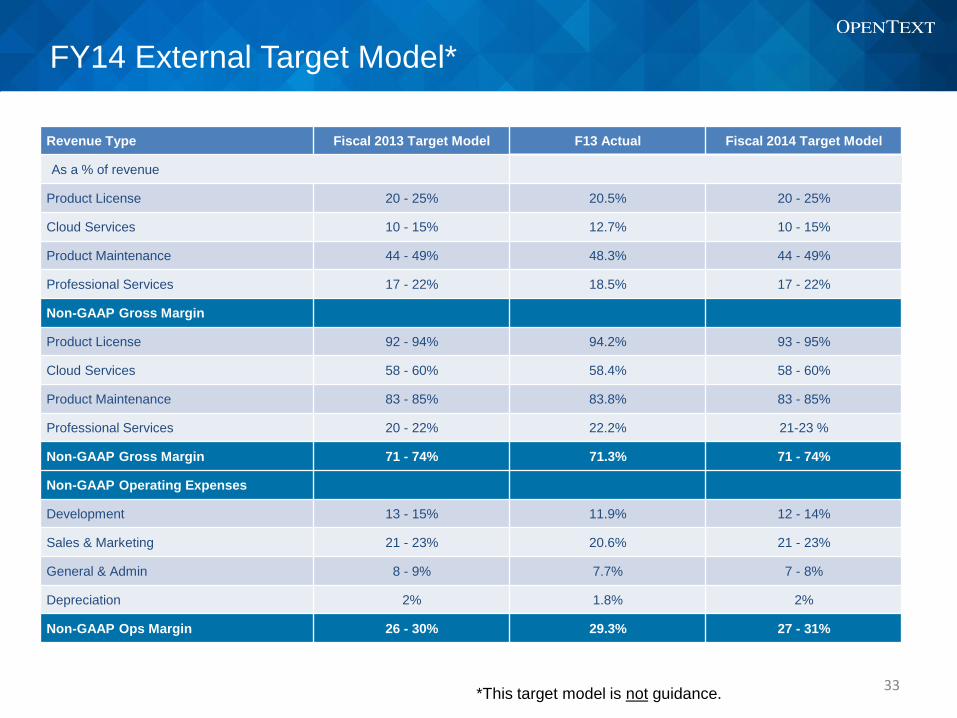
FY14 External Target Model*
33 *This target model is not guidance.
Revenue Type Fiscal 2013 Target Model F13 Actual Fiscal 2014 Target Model
As a % of revenue
Product License 20 - 25% 20.5% 20 - 25%
Cloud Services 10 - 15% 12.7% 10 - 15%
Product Maintenance 44 - 49% 48.3% 44 - 49%
Professional Services 17 - 22% 18.5% 17 - 22%
Non-GAAP Gross Margin
Product License 92 - 94% 94.2% 93 - 95%
Cloud Services 58 - 60% 58.4% 58 - 60%
Product Maintenance 83 - 85% 83.8% 83 - 85%
Professional Services 20 - 22% 22.2% 21-23 %
Non-GAAP Gross Margin 71 - 74% 71.3% 71 - 74%
Non-GAAP Operating Expenses
Development 13 - 15% 11.9% 12 - 14%
Sales & Marketing 21 - 23% 20.6% 21 - 23%
General & Admin 8 - 9% 7.7% 7 - 8%
Depreciation 2% 1.8% 2%
Non-GAAP Ops Margin 26 - 30% 29.3% 27 - 31%

Summary
• A leader in Enterprise Information Management (EIM)
a large, growing and relevant market
• Enhanced innovation and exciting product portfolio
• Compelling operating margins, cash flow and quarterly
dividend program
• 7 years consistent growth: o 27.6% CAGR: non-GAAP EPS
o 27.8% CAGR: Cash Flow from Operations*
o 18.7% CAGR: Revenue
34 B*Before the impact of special charges
Unleashing the Power of Information

References
36
• ECM, BPM: Gartner Forecast Enterprise Software Markets, 2009-2016 1Q12
Update
• InfoExchange: Research and Markets, Computer-based Fax Markets, 2010-2015
• Gartner Enterprise Software Markets, 2009-2016
• 1Q12 Update, Davidson Consulting, Fax Server Industry Forecast, 2011-2016
• CEM: Gartner Magic Quadrant for Web Content Management, 10 Nov. 2011
• Discovery: Gartner Market Trends: Expect Disruption and Divergence in the
E-Discovery Software Market, 16 Dec. 2011
Copyright © OpenText Corporation. All rights reserved.
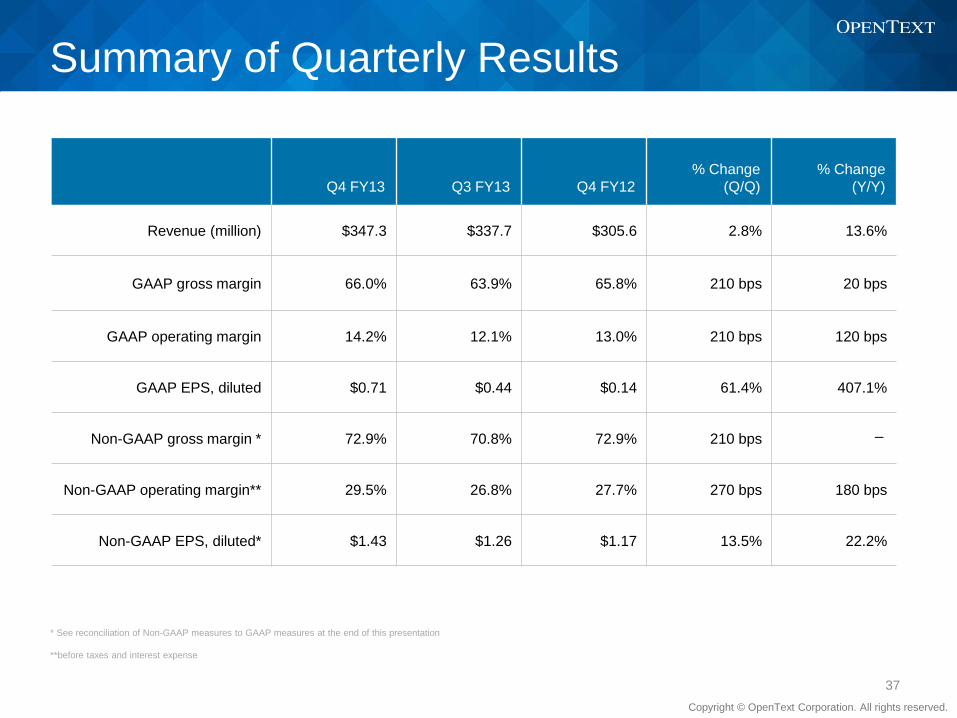
Summary of Quarterly Results
Q4 FY13 Q3 FY13 Q4 FY12
% Change
(Q/Q)
% Change
(Y/Y)
Revenue (million) $347.3 $337.7 $305.6 2.8% 13.6%
GAAP gross margin 66.0% 63.9% 65.8% 210 bps 20 bps
GAAP operating margin 14.2% 12.1% 13.0% 210 bps 120 bps
GAAP EPS, diluted $0.71 $0.44 $0.14 61.4% 407.1%
Non-GAAP gross margin * 72.9% 70.8% 72.9% 210 bps _
Non-GAAP operating margin** 29.5% 26.8% 27.7% 270 bps 180 bps
Non-GAAP EPS, diluted* $1.43 $1.26 $1.17 13.5% 22.2%
* See reconciliation of Non-GAAP measures to GAAP measures at the end of this presentation
**before taxes and interest expense
37

Copyright © OpenText Corporation. All rights reserved.
Summary of Year To Date Results
Q4 FY13 Q3 FY13 Q4 FY12
% Change
(Y/Y)
Revenue (million) $1,363.3 $1,016.1 $1,207.5 12.9%
GAAP gross margin 64.4% 63.8% 65.4% (100) bps
GAAP operating margin 14.5% 14.6% 12.4% 210 bps
GAAP EPS, diluted $2.51 $1.80 $2.13 17.8%
Non-GAAP gross margin * 71.3% 70.8% 72.5% (120) bps
Non-GAAP operating margin** 29.3% 29.2% 27.3% 200 bps
Non-GAAP EPS, diluted* $5.57 $4.14 $4.60 21.1%
* See reconciliation of Non-GAAP measures to GAAP measures at the end of this presentation
**before taxes and interest expense
38

Copyright © OpenText Corporation. All rights reserved.
Summary of Quarterly Revenue Results*
In millions Q4 FY13 Q3 FY13 Q4 FY12
% Change
(Q/Q)
% Change
(Y/Y)
License $78.8 $69.0 $78.0 14.2% 1.0%
Cloud services 41.9 43.2 N/A (3.0)% N/A
Customer support 164.9 166.6 163.1 (1.0)% 1.1%
Professional service and other 61.7 58.9 64.5 4.8% (4.3)%
Total $347.3 $337.7 $305.6 2.8% 13.6%
39
* Individual line items may be adjusted by non-material amounts to enable totals to align to published financial
statements.
Copyright © OpenText Corporation. All rights reserved.
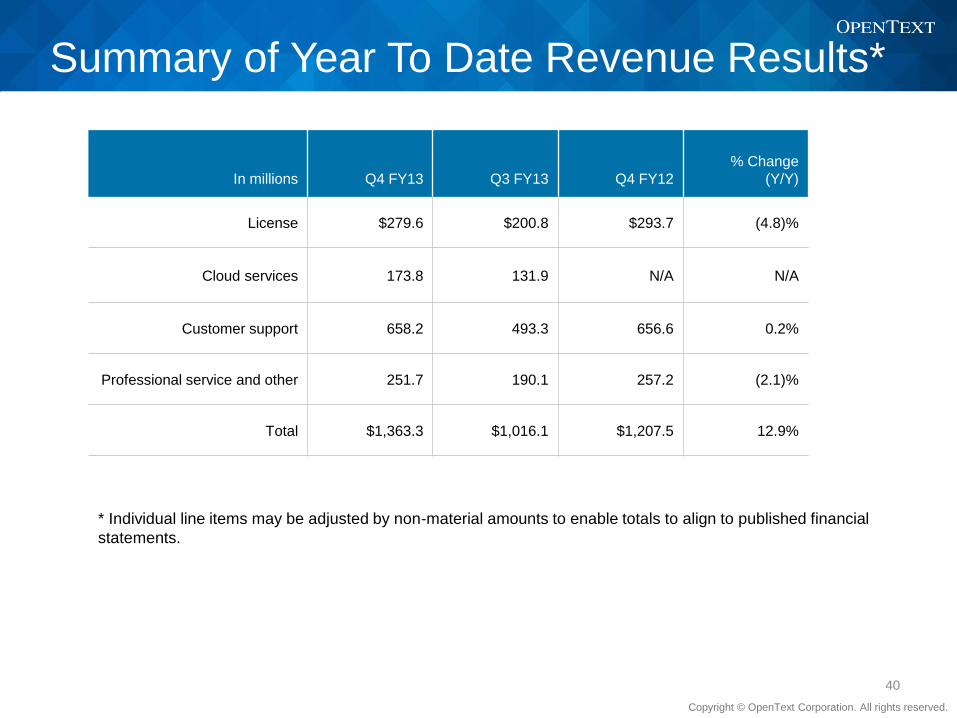
Summary of Year To Date Revenue Results*
In millions Q4 FY13 Q3 FY13 Q4 FY12
% Change
(Y/Y)
License $279.6 $200.8 $293.7 (4.8)%
Cloud services 173.8 131.9 N/A N/A
Customer support 658.2 493.3 656.6 0.2%
Professional service and other 251.7 190.1 257.2 (2.1)%
Total $1,363.3 $1,016.1 $1,207.5 12.9%
40
* Individual line items may be adjusted by non-material amounts to enable totals to align to published financial
statements.

Appendix A
41
Use of Non-GAAP Financial Measures
In addition to reporting financial results in accordance with U.S. GAAP, the Company provides certain financial measures that are not in accordance with U.S. GAAP
(non-GAAP).These non-GAAP financial measures have certain limitations in that they do not have a standardized meaning and thus the Company's definition may be
different from similar non-GAAP financial measures used by other companies and/or analysts and may differ from period to period. Thus it may be more difficult to
compare the Company's financial performance to that of other companies. However, the Company's management compensates for these limitations by providing the
relevant disclosure of the items excluded in the calculation of these non-GAAP financial measures both in its reconciliation to the U.S. GAAP financial measures and
its consolidated financial statements, all of which should be considered when evaluating the Company's results.
The Company uses these non-GAAP financial measures to supplement the information provided in its consolidated financial statements, which are presented in
accordance with U.S. GAAP. The presentation of non-GAAP financial measures are not meant to be a substitute for financial measures presented in accordance with
U.S. GAAP, but rather should be evaluated in conjunction with and as a supplement to such U.S. GAAP measures. OpenText strongly encourages investors to review
its financial information in its entirety and not to rely on a single financial measure. The Company therefore believes that despite these limitations, it is appropriate to
supplement the disclosure of the U.S. GAAP measures with certain non-GAAP measures defined below.
Non-GAAP-based net income and non-GAAP-based EPS are calculated as net income or net income per share on a diluted basis, excluding, the amortization of
acquired intangible assets, other income (expense), share-based compensation, and special charges, all net of tax. Non-GAAP-based gross profit is the arithmetical
sum of GAAP-based gross profit and the amortization of acquired technology-based intangible assets. Non-GAAP-based gross margin is calculated as non-GAAP-
based gross profit expressed as a percentage of revenue. Non-GAAP-based income from operations is calculated as income from operations, excluding, the
amortization of acquired intangible assets, special charges, and share-based compensation. Non-GAAP-based operating margin is calculated as non-GAAP-based
income from operations expressed as a percentage of revenue.
The Company's management believes that the presentation, of the above defined non-GAAP financial measures, provides useful information to investors because
they portray the financial results of the Company before the impact of certain non-operational charges. The use of the term “non-operational charge” is defined for this
purpose as an expense that does not impact the ongoing operating decisions taken by the Company's management and is based upon the way the Company's
management evaluates the performance of the Company's business for use in the Company's internal reports. In the course of such evaluation and for the purpose of
making operating decisions, the Company's management excludes certain items from its analysis, including amortization of acquired intangible assets, special
charges, share-based compensation, other income (expense), and the taxation impact of these items. These items are excluded based upon the manner in which
management evaluates the business of the Company and are not excluded in the sense that they may be used under U.S. GAAP.
The Company believes the provision of supplemental non-GAAP measures allow investors to evaluate the operational and financial performance of the Company's
core business using the same evaluation measures that management uses, and is therefore a useful indication of OpenText's performance or expected performance
of future operations and facilitates period-to-period comparison of operating performance. As a result, the Company considers it appropriate and reasonable to
provide, in addition to U.S. GAAP measures, supplementary non-GAAP financial measures that exclude certain items from the presentation of its financial results in
this presentation.
The following charts provide (unaudited) reconciliations of U.S. GAAP-based financial measures to non-U.S. GAAP-based financial measures for the following periods
presented:
Copyright © OpenText Corporation. All rights reserved.
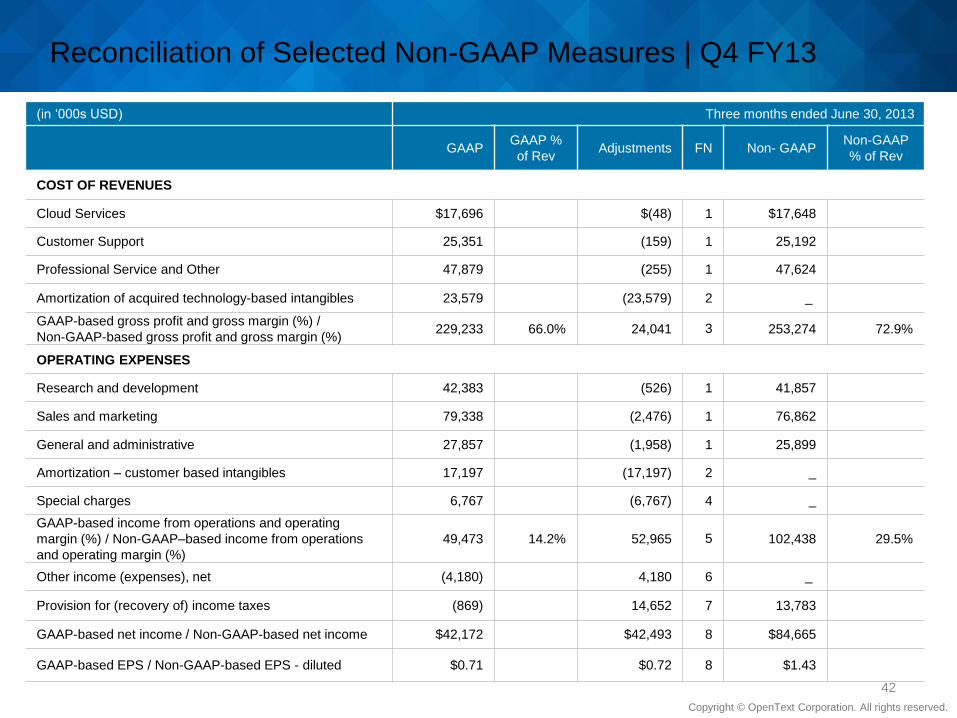
Reconciliation of Selected Non-GAAP Measures | Q4 FY13
42
(in ‘000s USD) Three months ended June 30, 2013
GAAP GAAP %
of Rev Adjustments FN Non- GAAP
Non-GAAP
% of Rev
COST OF REVENUES
Cloud Services $17,696 $(48) 1 $17,648
Customer Support 25,351 (159) 1 25,192
Professional Service and Other 47,879 (255) 1 47,624
Amortization of acquired technology-based intangibles 23,579 (23,579) 2 _
GAAP-based gross profit and gross margin (%) /
Non-GAAP-based gross profit and gross margin (%) 229,233 66.0% 24,041 3 253,274 72.9%
OPERATING EXPENSES
Research and development 42,383 (526) 1 41,857
Sales and marketing 79,338 (2,476) 1 76,862
General and administrative 27,857 (1,958) 1 25,899
Amortization – customer based intangibles 17,197 (17,197) 2 _
Special charges 6,767 (6,767) 4 _
GAAP-based income from operations and operating
margin (%) / Non-GAAP–based income from operations
and operating margin (%)
49,473 14.2% 52,965 5 102,438 29.5%
Other income (expenses), net (4,180) 4,180 6 _
Provision for (recovery of) income taxes (869) 14,652 7 13,783
GAAP-based net income / Non-GAAP-based net income $42,172 $42,493 8 $84,665
GAAP-based EPS / Non-GAAP-based EPS - diluted $0.71 $0.72 8 $1.43

Copyright © OpenText Corporation. All rights reserved.
Reconciliation of Selected Non-GAAP Measures | Q4 FY13
Three Months Ended June 30, 2013
Per Share
Non-GAAP-based net income $84,665 $1.43
Less:
Amortization 40,776 0.69
Share-based compensation 5,422 0.09
Special charges 6,767 0.11
Other (Income) expenses, net 4,180 0.07
GAAP based provision for (recovery of) income taxes (869) (0.01)
Non-GAAP-based provision for income taxes (13,783) (0.23)
GAAP-based net income $42,172 $0.71
FOOTNOTES
1 Adjustment relates to the exclusion of share based compensation expense from our non-GAAP-based operating expenses as this expense is excluded from our internal analysis of operating
results
2 Adjustment relates to the exclusion of amortization expense from our non-GAAP-based operating expenses as the timing and frequency of amortization expense is dependent on our
acquisitions and is hence excluded from our internal analysis of operating results.
3 GAAP-based and Non GAAP-based gross profit stated in dollars, and gross margin stated as a percentage of revenue.
4 Adjustment relates to the exclusion of Special charges from our non-GAAP-based operating expenses as Special charges are generally incurred in the aftermath of acquisitions and are not
indicative or related to continuing operations and are hence excluded from our internal analysis of operating results.
5 GAAP-based and Non GAAP-based income from operations stated in dollars, and operating margin stated as a percentage of revenue.
6 Adjustment relates to the exclusion of Other income (expense) from our non-GAAP-based operating expenses as Other income (expense) relates primarily to the transactional impact of foreign
exchange and are generally not indicative or related to continuing operations and are hence excluded from our internal analysis of operating results.
7 Adjustment relates to differences between the GAAP-based tax recovery of approximately 2% and a non-GAAP-based tax rate of 14%; these rate differences are due to the income tax effects
of expenses that are excluded for the purpose of calculating non-GAAP-based adjusted net income.
8 Reconciliation of non-GAAP-based adjusted net income to GAAP-based net income:
43

Copyright © OpenText Corporation. All rights reserved.
Reconciliation of Selected Non-GAAP Measures | Q4 FY13 YTD
(in ‘000s USD) Year ended June 30, 2013
GAAP GAAP %
of Rev Adjustments FN Non- GAAP
Non-GAAP
% of Rev
COST OF REVENUES
Cloud Services $72,365 $(128) 1 $72,237
Customer Support 106,948 (434) 1 106,514
Professional Service and Other 196,874 (915) 1 195,959
Amortization of acquired technology-based intangibles 93,610 (93,610) 2 _
GAAP-based gross profit and gross margin (%) /
Non-GAAP-based gross profit and gross margin (%) 877,432 64.4% 95,087 3 972,519 71.3%
OPERATING EXPENSES
Research and development 164,010 (1,693) 1 162,317
Sales and marketing 289,157 (8,429) 1 280,728
General and administrative 109,325 (3,976) 1 105,349
Amortization – customer based intangibles 68,745 (68,745) 2 _
Special charges 24,034 (24,034) 4 _
GAAP-based income from operations and operating
margin (%) / Non-GAAP–based income from operations
and operating margin (%)
197,665 14.5% 201,964 5 399,629 29.3%
Other income (expenses), net (2,473) 2,473 6 _
Provision for (recovery of) income taxes 29,690 23,881 7 53,571
GAAP-based net income / Non-GAAP-based net income $148,520 $180,556 8 $329,076
GAAP-based EPS / Non-GAAP-based EPS - diluted $2.51 $3.06 8 $5.57
44

Copyright © OpenText Corporation. All rights reserved.
Reconciliation of Selected Non-GAAP Measures | Q4 FY13 YTD
45
FOOTNOTES
1 Adjustment relates to the exclusion of share based compensation expense from our non-GAAP-based operating expenses as this expense is excluded from our internal analysis of operating
results
2 Adjustment relates to the exclusion of amortization expense from our non-GAAP-based operating expenses as the timing and frequency of amortization expense is dependent on our
acquisitions and is hence excluded from our internal analysis of operating results.
3 GAAP-based and Non GAAP-based gross profit stated in dollars, and gross margin stated as a percentage of revenue.
4 Adjustment relates to the exclusion of Special charges from our non-GAAP-based operating expenses as Special charges are generally incurred in the aftermath of acquisitions and are not
indicative or related to continuing operations and are hence excluded from our internal analysis of operating results.
5 GAAP-based and Non GAAP-based income from operations stated in dollars, and operating margin stated as a percentage of revenue.
6 Adjustment relates to the exclusion of Other income (expense) from our non-GAAP-based operating expenses as Other income (expense) relates primarily to the transactional impact of foreign
exchange and are generally not indicative or related to continuing operations and are hence excluded from our internal analysis of operating results.
7 Adjustment relates to differences between the GAAP-based tax provision of approximately 17% and a non-GAAP-based tax rate of 14%; these rate differences are due to the income tax
effects of expenses that are excluded for the purpose of calculating non-GAAP-based adjusted net income.
8 Reconciliation of non-GAAP-based adjusted net income to GAAP-based net income:
Year Ended June 30, 2013
Per Share
Non-GAAP-based net income $329,076 $5.57
Less:
Amortization 162,355 2.75
Share-based compensation 15,575 0.26
Special charges 24,034 0.41
Other (Income) expenses, net 2,473 0.04
GAAP based provision for (recovery of) income taxes 29,690 0.50
Non-GAAP-based provision for income taxes (53,571) (0.90)
GAAP-based net income $148,520 $2.51

Copyright © OpenText Corporation. All rights reserved.
Reconciliation of Selected Non-GAAP Measures | Q3 FY13
46
(in ‘000s USD) Three months ended March 31, 2013
GAAP GAAP %
of Rev Adjustments FN Non- GAAP
Non-GAAP
% of Rev
COST OF REVENUES
Cloud Services $18,741 $(50) 1 $18,691
Customer Support 27,497 (130) 1 27,367
Professional Service and Other 49,701 (295) 1 49,406
Amortization of acquired technology-based intangibles 23,058 (23,058) 2 _
GAAP-based gross profit and gross margin (%) /
Non-GAAP-based gross profit and gross margin (%) 215,619 63.9% 23,533 3 239,152 70.8%
OPERATING EXPENSES
Research and development 43,003 (498) 1 42,505
Sales and marketing 77,327 (2,634) 1 74,693
General and administrative 25,762 (270) 1 25,492
Amortization – customer based intangibles 17,149 (17,197) 2 _
Special charges 5,444 (5,444) 4 _
GAAP-based income from operations and operating
margin (%) / Non-GAAP–based income from operations
and operating margin (%)
40,870 12.1% 49,528 5 90,398 26.8%
Other income (expenses), net 237 (237) 6 _
Provision for (recovery of) income taxes 11,187 893 7 12,080
GAAP-based net income / Non-GAAP-based net income $25,811 $48,398 8 $74,209
GAAP-based EPS / Non-GAAP-based EPS - diluted $0.44 $0.82 8 $1.26

Copyright © OpenText Corporation. All rights reserved.
Reconciliation of Selected Non-GAAP Measures | Q3 FY13
Three Months Ended March 31, 2013
Per Share
Non-GAAP-based net income $74,209 $1.26
Less:
Amortization 40,207 0.68
Share-based compensation 3,877 0.07
Special charges 5,444 0.09
Other (Income) expenses, net (237) _
GAAP based provision for (recovery of) income taxes 11,187 0.19
Non-GAAP-based provision for income taxes (12,080) (0.21)
GAAP-based net income $25,811 $0.44
47
FOOTNOTES
1 Adjustment relates to the exclusion of share based compensation expense from our non-GAAP-based operating expenses as this expense is excluded from our internal analysis of operating
results
2 Adjustment relates to the exclusion of amortization expense from our non-GAAP-based operating expenses as the timing and frequency of amortization expense is dependent on our
acquisitions and is hence excluded from our internal analysis of operating results.
3 GAAP-based and Non GAAP-based gross profit stated in dollars, and gross margin stated as a percentage of revenue.
4 Adjustment relates to the exclusion of Special charges from our non-GAAP-based operating expenses as Special charges are generally incurred in the aftermath of acquisitions and are not
indicative or related to continuing operations and are hence excluded from our internal analysis of operating results.
5 GAAP-based and Non GAAP-based income from operations stated in dollars, and operating margin stated as a percentage of revenue.
6 Adjustment relates to the exclusion of Other income (expense) from our non-GAAP-based operating expenses as Other income (expense) relates primarily to the transactional impact of foreign
exchange and are generally not indicative or related to continuing operations and are hence excluded from our internal analysis of operating results.
7 Adjustment relates to differences between the GAAP-based tax provision of approximately 30% and a non-GAAP-based tax rate of 14%; these rate differences are due to the income tax
effects of expenses that are excluded for the purpose of calculating non-GAAP-based adjusted net income.
8 Reconciliation of non-GAAP-based adjusted net income to GAAP-based net income:

Copyright © OpenText Corporation. All rights reserved.
Reconciliation of Selected Non-GAAP Measures | Q3 FY13 YTD
48
(in ‘000s USD) Nine months ended March 31, 2013
GAAP GAAP %
of Rev Adjustments FN Non- GAAP
Non-GAAP
% of Rev
COST OF REVENUES
Cloud Services $54,669 $(80) 1 $54,589
Customer Support 81,597 (275) 1 81,322
Professional Service and Other 148,995 (660) 1 148,335
Amortization of acquired technology-based intangibles 70,031 (70,031) 2 _
GAAP-based gross profit and gross margin (%) /
Non-GAAP-based gross profit and gross margin (%) 648,199 63.8% 71,046 3 719,245 70.8%
OPERATING EXPENSES
Research and development 121,627 (1,167) 1 120,460
Sales and marketing 209,819 (5,953) 1 203,866
General and administrative 81,468 (2,018) 1 79,450
Amortization – customer based intangibles 51,548 (51,548) 2 _
Special charges 17,267 (17,267) 4 _
GAAP-based income from operations and operating
margin (%) / Non-GAAP–based income from operations
and operating margin (%)
148,192 14.6% 148,999 5 297,191 29.2%
Other income (expenses), net 1,707 (1,707) 6 _
Provision for (recovery of) income taxes 30,559 9,229 7 39,788
GAAP-based net income / Non-GAAP-based net income $106,348 $138,063 8 $244,411
GAAP-based EPS / Non-GAAP-based EPS - diluted $1.80 $2.34 8 $4.14
Copyright © OpenText Corporation. All rights reserved.
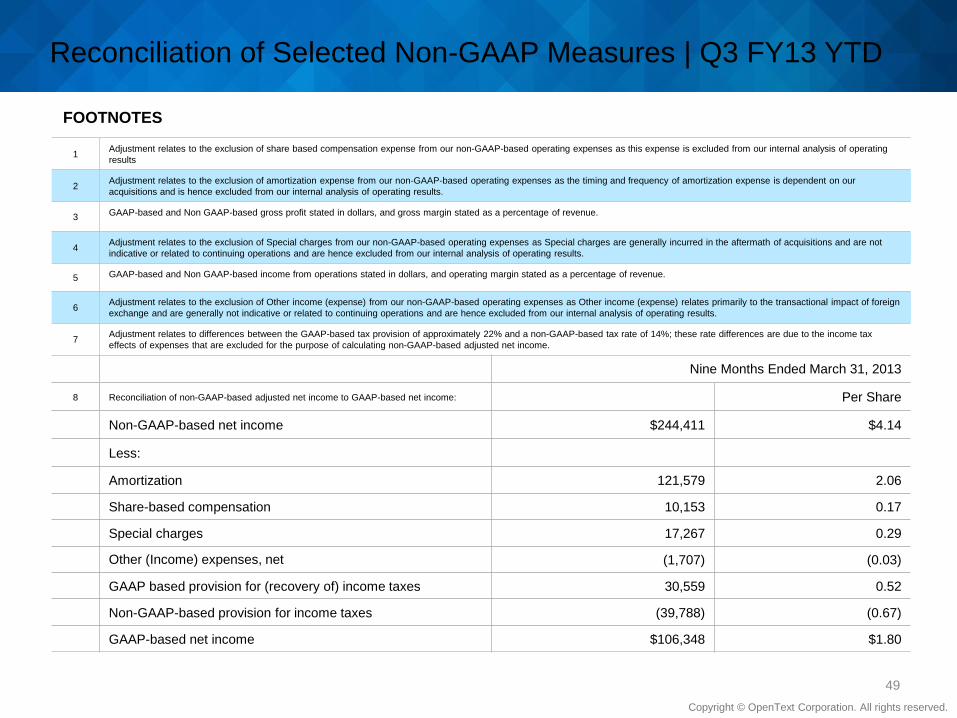
Reconciliation of Selected Non-GAAP Measures | Q3 FY13 YTD
Nine Months Ended March 31, 2013
Per Share
Non-GAAP-based net income $244,411 $4.14
Less:
Amortization 121,579 2.06
Share-based compensation 10,153 0.17
Special charges 17,267 0.29
Other (Income) expenses, net (1,707) (0.03)
GAAP based provision for (recovery of) income taxes 30,559 0.52
Non-GAAP-based provision for income taxes (39,788) (0.67)
GAAP-based net income $106,348 $1.80
49
FOOTNOTES
1 Adjustment relates to the exclusion of share based compensation expense from our non-GAAP-based operating expenses as this expense is excluded from our internal analysis of operating
results
2 Adjustment relates to the exclusion of amortization expense from our non-GAAP-based operating expenses as the timing and frequency of amortization expense is dependent on our
acquisitions and is hence excluded from our internal analysis of operating results.
3 GAAP-based and Non GAAP-based gross profit stated in dollars, and gross margin stated as a percentage of revenue.
4 Adjustment relates to the exclusion of Special charges from our non-GAAP-based operating expenses as Special charges are generally incurred in the aftermath of acquisitions and are not
indicative or related to continuing operations and are hence excluded from our internal analysis of operating results.
5 GAAP-based and Non GAAP-based income from operations stated in dollars, and operating margin stated as a percentage of revenue.
6 Adjustment relates to the exclusion of Other income (expense) from our non-GAAP-based operating expenses as Other income (expense) relates primarily to the transactional impact of foreign
exchange and are generally not indicative or related to continuing operations and are hence excluded from our internal analysis of operating results.
7 Adjustment relates to differences between the GAAP-based tax provision of approximately 22% and a non-GAAP-based tax rate of 14%; these rate differences are due to the income tax
effects of expenses that are excluded for the purpose of calculating non-GAAP-based adjusted net income.
8 Reconciliation of non-GAAP-based adjusted net income to GAAP-based net income:

Copyright © OpenText Corporation. All rights reserved.
Reconciliation of Selected Non-GAAP Measures | Q4 FY12
50
(in ‘000s USD) Three months ended June 30, 2012
GAAP GAAP %
of Rev Adjustments FN Non- GAAP
Non-GAAP
% of Rev
COST OF REVENUES
Customer Support $27,780 $(58) 1 $27,722
Professional Service and Other 51,358 (239) 1 51,119
Amortization of acquired technology-based intangibles 21,265 (21,265) 2 _
GAAP-based gross profit and gross margin (%) /
Non-GAAP-based gross profit and gross margin (%) 201,105 65.8% 21,562 3 222,667 72.9%
OPERATING EXPENSES
Research and development 41,195 (1,066) 1 40,129
Sales and marketing 71,641 (2,771) 1 68,870
General and administrative 24,186 (557) 1 23,629
Amortization – customer based intangibles 13,378 (13,378) 2 _
Special charges 5,747 (5,747) 4 _
GAAP-based income from operations and operating
margin (%) / Non-GAAP–based income from operations
and operating margin (%)
39,690 13.0% 45,081 5 84,771 27.7%
Other income (expenses), net (6,596) 6,596 6 _
Provision for income taxes 20,713 (9,462) 7 11,251
GAAP-based net income / Non-GAAP-based net income $7,971 $61,139 8 $69,110
GAAP-based EPS / Non-GAAP-based EPS - diluted $0.14 $1.03 8 $1.17

Copyright © OpenText Corporation. All rights reserved.
Reconciliation of Selected Non-GAAP Measures | Q4 FY12
Three Months Ended June 30, 2012
Per Share
Non GAAP net income $$69,110 $1.17
Less:
Amortization 34,643 0.59
Share-based compensation 4,691 0.08
Special charges 5,747 0.10
Other (income) expenses 6,596 0.11
GAAP based provision for (recovery of) income taxes 20,713 0.35
Tax on Non-GAAP based provision (11,251) (0.20)
GAAP net income $7,971 $0.14
51
FOOTNOTES
1 Adjustment relates to the exclusion of share based compensation expense from our non-GAAP-based operating expenses as this expense is excluded from our internal analysis of operating
results
2 Adjustment relates to the exclusion of amortization expense from our non-GAAP-based operating expenses as the timing and frequency of amortization expense is dependent on our
acquisitions and is hence excluded from our internal analysis of operating results.
3 GAAP-based and Non GAAP-based gross profit stated in dollars, and gross margin stated as a percentage of revenue.
4 Adjustment relates to the exclusion of Special charges from our non-GAAP-based operating expenses as Special charges are generally incurred in the aftermath of acquisitions and are not
indicative or related to continuing operations and are hence excluded from our internal analysis of operating results.
5 GAAP-based and Non GAAP-based income from operations stated in dollars, and operating margin stated as a percentage of revenue.
6 Adjustment relates to the exclusion of Other income (expense) from our non-GAAP-based operating expenses as Other income (expense) relates primarily to the transactional impact of foreign
exchange and are generally not indicative or related to continuing operations and are hence excluded from our internal analysis of operating results.
7 Adjustment relates to differences between the GAAP-based tax provision of approximately 72% and a non-GAAP-based tax rate of 14%; these rate differences are due to the income tax
effects of expenses that are excluded for the purpose of calculating non-GAAP-based adjusted net income.
8 Reconciliation of non-GAAP-based adjusted net income to GAAP-based net income:

Copyright © OpenText Corporation. All rights reserved.
Reconciliation of Selected Non-GAAP Measures | Q4 YTD FY12
52
(in ‘000s USD) Year ended June 30, 2012
GAAP GAAP %
of Rev Adjustments FN Non- GAAP
Non-GAAP
% of Rev
COST OF REVENUES
Customer Support $110,504 $(169) 1 $110,335
Professional Service and Other 204,909 (647) 1 204,262
Amortization of acquired technology-based intangibles 84,572 (84,572) 2 _
GAAP-based gross profit and gross margin (%) /
Non-GAAP-based gross profit and gross margin (%) 789,455 65.4% 85,388 3 874,843 72.5%
OPERATING EXPENSES
Research and development 169,043 (3,939) 1 165,104
Sales and marketing 274,544 (8,811) 1 265,733
General and administrative 97,072 (4,531) 1 92,541
Amortization – customer based intangibles 53,326 (53,326) 2 _
Special charges 24,523 (24,523) 4 _
GAAP-based income from operations and operating
margin (%) / Non-GAAP–based income from operations
and operating margin (%)
149,360 12.4% 180,518 5 329,878 27.3%
Other income (expenses), net 3,549 (3,549) 6 _
Provision for (recovery of) income taxes 12,171 31,833 7 44,004
GAAP-based net income / Non-GAAP-based net income $125,174 $145,136 8 $270,310
GAAP-based EPS / Non-GAAP-based EPS - diluted $2.13 $2.47 8 $4.60

Copyright © OpenText Corporation. All rights reserved.
Reconciliation of Selected Non-GAAP Measures | Q4 YTD FY12
Year Ended June 30, 2012
Per Share
Non GAAP net income $270,310 $4.60
Less:
Amortization 137,898 2.35
Share-based compensation 18,097 0.31
Special charges 24,523 0.42
Other (income) expenses (3,549) (0.06)
GAAP based provision for (recovery of) income taxes 12,171 0.21
Tax on Non-GAAP based provision (44,004) (0.76)
GAAP net income $125,174 $2.13
53
FOOTNOTES
1 Adjustment relates to the exclusion of share based compensation expense from our non-GAAP-based operating expenses as this expense is excluded from our internal analysis of operating
results
2 Adjustment relates to the exclusion of amortization expense from our non-GAAP-based operating expenses as the timing and frequency of amortization expense is dependent on our
acquisitions and is hence excluded from our internal analysis of operating results.
3 GAAP-based and Non GAAP-based gross profit stated in dollars, and gross margin stated as a percentage of revenue.
4 Adjustment relates to the exclusion of Special charges from our non-GAAP-based operating expenses as Special charges are generally incurred in the aftermath of acquisitions and are not
indicative or related to continuing operations and are hence excluded from our internal analysis of operating results.
5 GAAP-based and Non GAAP-based income from operations stated in dollars, and operating margin stated as a percentage of revenue.
6 Adjustment relates to the exclusion of Other income (expense) from our non-GAAP-based operating expenses as Other income (expense) relates primarily to the transactional impact of foreign
exchange and are generally not indicative or related to continuing operations and are hence excluded from our internal analysis of operating results.
7 Adjustment relates to differences between the GAAP-based tax provision of approximately 9% and a non-GAAP-based tax rate of 14%; these rate differences are due to the income tax effects
of expenses that are excluded for the purpose of calculating non-GAAP-based adjusted net income.
8 Reconciliation of non-GAAP-based adjusted net income to GAAP-based net income:
Related Documents