i n t e r i m r e s u l t s for the six months ended june 2005

I n t e r i m r e s u l t s for the six months ended june 2005.
Jan 02, 2016
Welcome message from author
This document is posted to help you gain knowledge. Please leave a comment to let me know what you think about it! Share it to your friends and learn new things together.
Transcript

i n t e r i m r e s u l t sfor the six months ended june 2005

D a v i n d e r C h u g h
c h i e f e x e c u t i v e o f f i c e r

m a r k e t & o p e r a t i o n
s

4
Overview
Record half year earnings of R3 221m
- Earnings per share of 723c up 108%
- Operating margin of 35% up 66%
- Return on equity of 37% up 61%
- High international steel prices
- Cost increases contained
Delivering on R9bn capital investment programme
Note: All comparisons against corresponding period in 2004
Maintaining strong performance

5
Key Result Drivers
8% Strengthening of Rand
11% Increase in HRC Rand cash cost per tonne
(7%)Slowdown in domestic sales volume
6% Export sales volume up
35% Increase in HRC US$ export price
1H’05 vs 1H’04
Good performance supported by cost containment
13% Increase in HRC Rand domestic price

6
Export PricesM
itta
l S
teel
In
voic
ed P
rice
s (c
&f)
US
$/t
HRC
Low Carbon Wire Rod
700
600
500
400
300
200
100
01994 1995 1996 1997 1998 1999 2000 2001 2002 2003 2004 2005
Historical high prices prevailed

7
Global Market Trends
Global steel demand outstripped supply in 2004/2005
Inventory adjustments prompted recent price slide
World economic growth is expected to remain positive
Consolidation amongst steel companies globally continues
Steelmakers’ input costs will remain high
Chinese economy still growing at high rate
In 2004, China accounted for
- 30% of world steel production
- 32% of world steel consumption
Global steel demand driven by China
8
Chinese Market Trends
China a 320kt net importer of finished steel products in June 2005
China a 140kt net exporter, incl billet & slab, in June 2005
Government Policy
- Foreign companies not allowed to control domestic mills
- Steel and raw material export rebates will be gradually reduced

9
Chinese Market Trends
Domestic Industry Consolidation
- 10 largest mills will account for 50% of steel output by 2010
- Aims to create two industry giants with capacity > 30m tonnes
- Government will not ‘in principle’ grant approval for new steel plants
- Existing steel makers will be gradually reduced
Technology
- Promote production of high end, low cost steel products
- By 2010 steel mills to consume < 0.73 tpts of coal & < 8 tpts of water
China imposing internal regulations
Note: tpts = tonnes per tonne of steel
10
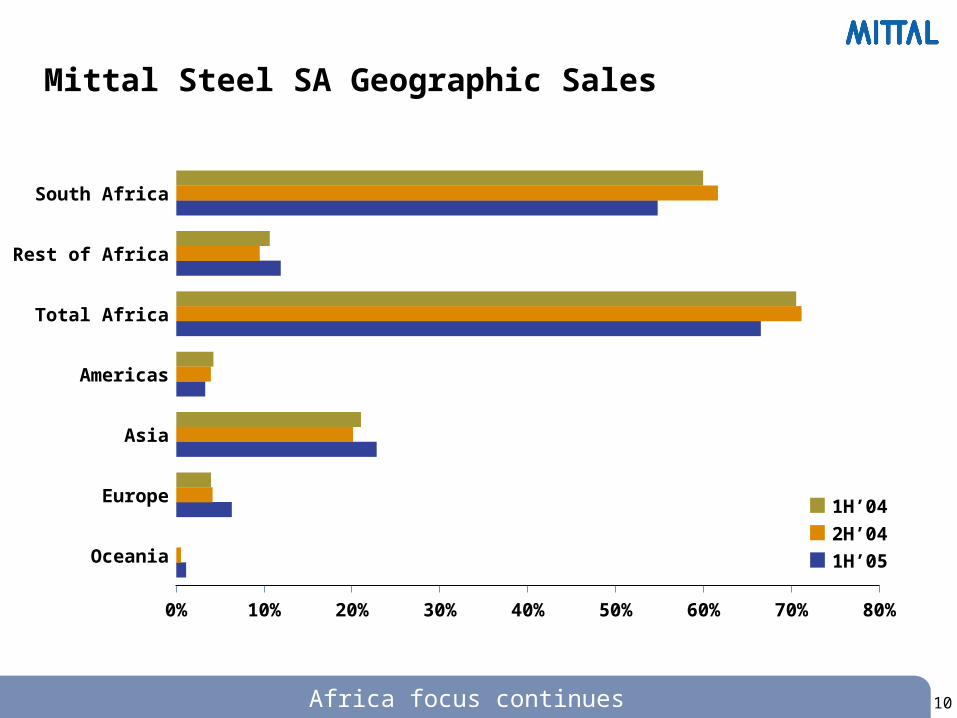
Mittal Steel SA Geographic Sales
South Africa
Rest of Africa
Total Africa
Americas
Asia
Europe
Oceania
0% 10% 20% 30% 40% 50% 60% 70% 80%
1H’05
2H’04
1H’04
Africa focus continues
11
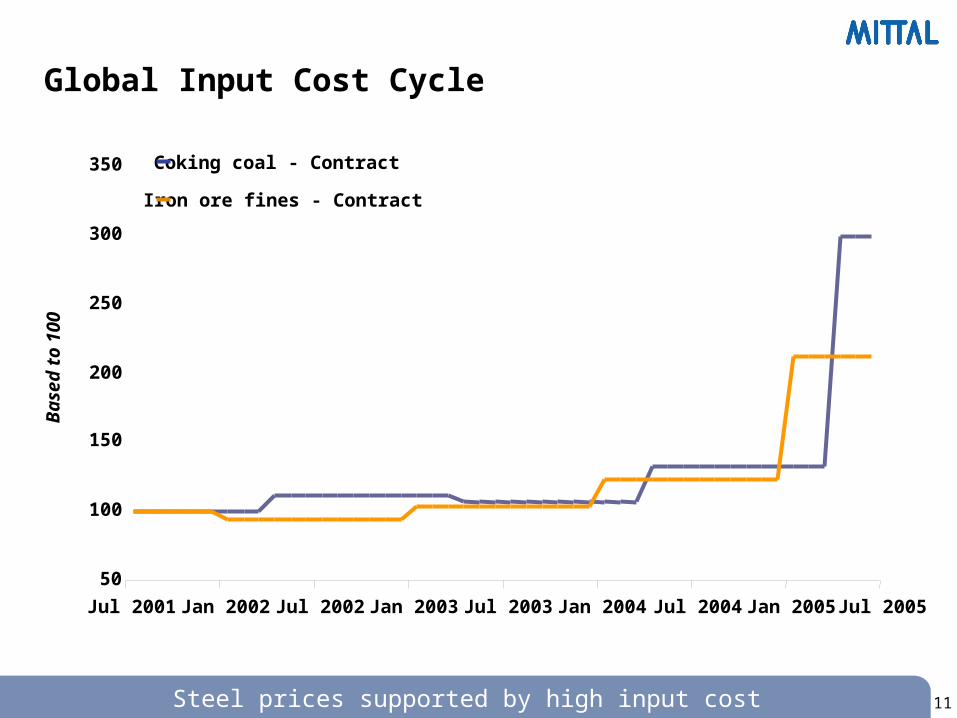
Global Input Cost CycleB
ased
to
10 0
Steel prices supported by high input cost
Coking coal - Contract
Iron ore fines - Contract
50
100
150
200
250
300
350
Jul 2001 Jan 2002 Jul 2002 Jan 2003 Jul 2003 Jan 2004 Jul 2004 Jan 2005 Jul 2005

12
Global Input Cost Cycle
600
500
400
300
200
100
0
700 Freight Rates - Spot
Coke - Spot
Scrap - Spot
New capacity taking effect
Bas
ed t
o 1
0 0
Jul 2001 Jan 2002 Jul 2002 Jan 2003 Jul 2003 Jan 2004 Jul 2004 Jan 2005 Jul 2005
13
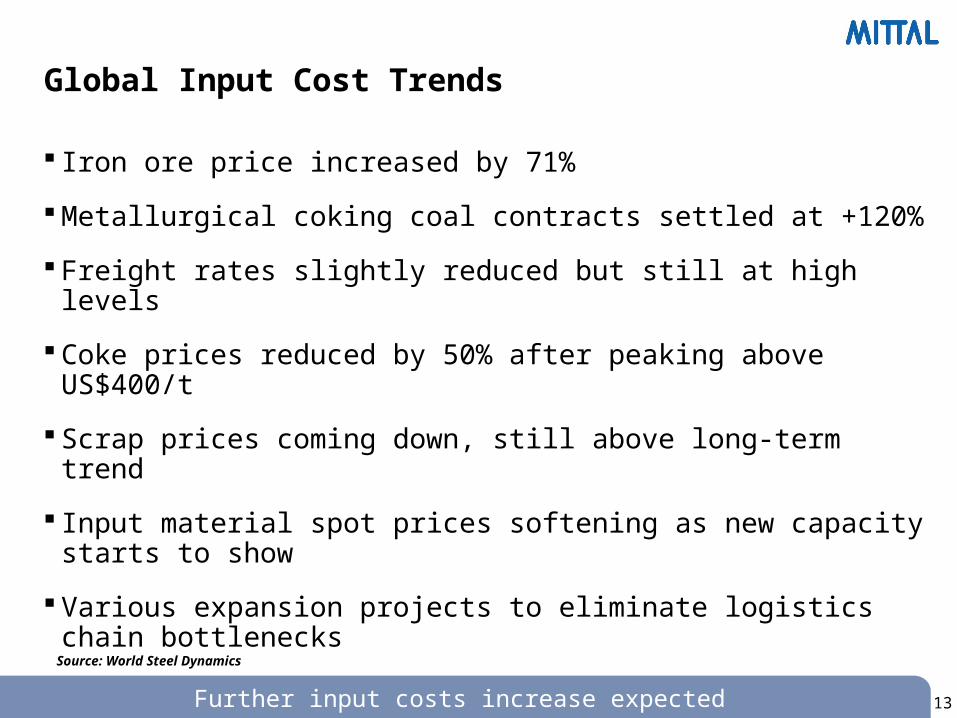
Source: World Steel Dynamics
Global Input Cost Trends
Iron ore price increased by 71%
Metallurgical coking coal contracts settled at +120%
Freight rates slightly reduced but still at high levels
Coke prices reduced by 50% after peaking above US$400/t
Scrap prices coming down, still above long-term trend
Input material spot prices softening as new capacity starts to show
Various expansion projects to eliminate logistics chain bottlenecks
Further input costs increase expected

14
Key Performance Indicators
65 7771- long
48 4849Percentage value-add exports - flat
1 876 1 7531 686HRC cash cost - R/t
1H’05 2H’041H’04
(141)396657CI savings (Rm) - incl procurement
10 755 11 41612 072Number of full-time employees
3.4 3.73.9Man hours per ton steel
1 141 1 096874Revenue per head (R’000)
86 320519- excl procurement
303 284254- US$/t
Efficiency improvements partially countered high input costs

15
Liquid Steel Production
4 000
3 000
2 500
2 000
1 500
1 000
500
0
3 500
Vanderbijlpark Saldanha Long Products Total
1H’052H’041H’04
1829 17991986
563 664 616
1085 1093 1105
3477 35563707
Half year production record
’00 0
to
nn
es

16
Sales Volumes
ExportDomestic
470
1099
Vanderbijlpark Saldanha Long Products Total1H’04 2H’04 1H’05 1H’04 2H’04 1H’05 1H’04 2H’04 1H’05 1H’04 2H’04 1H’05
3 500
3 000
2 500
2 000
1 500
1 000
500
50
1569472
1125
1597
524
996
1520
350
198
548287
306
593
333
214
547390
594
984
353
557
910426
540
966
1210
1891
3101
1112
1988
3100
1283
1750
3033
Sales impacted by inventory adjustment
’00 0
to
nn
es

17
Environmental
Environmental projects > R1bn at different stages
Vanderbijlpark- Zero effluent discharge (MTP) 222 2H’05 - Cleaning of coke ovens gas 306 1H’06- New sinter plant off-gas system 210 2H’07- Blast Furnace D Tap floor de-dusting 40 Commissioned
Newcastle- Reverse osmosis plant 50 1H’06
Projects completed- Newcastle
• Coke oven repair project 231 2H’04
Environmental projects on track
PlannedCompletion
CostRm

18
Other Major Projects
Investment plan of R8bn at different stages
Vanderbijlpark- Blast furnace C interim repair 40 2H’05- Blast furnace D reline 537 2H’06 - Blast furnace D – stoves 318 2H’06- 3rd sinter strand 288 2H’06- 2 New DRI kilns 432 2H’07
Saldanha- Corex reline 310 2H’07
Newcastle- Pulverised coal injection 211 Commissioned- Blast furnace N5 reline 590 2H’08
Mittal Coke & Chemicals- Market coke expansion 455 2H’06
Asset replacement & ongoing capex 1 280 Other downstream projects under investigation 1 300 Other reline & value adding projects 655
PlannedCompletion
CostRm
19
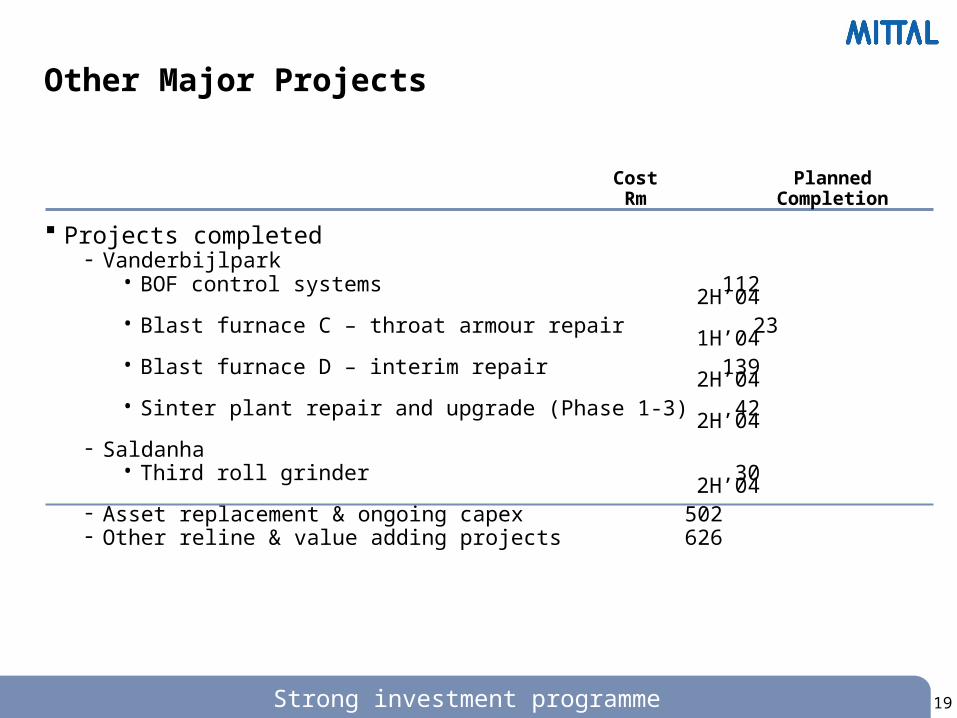
Other Major Projects
Projects completed- Vanderbijlpark
• BOF control systems 1122H’04
• Blast furnace C – throat armour repair 231H’04
• Blast furnace D – interim repair 1392H’04
• Sinter plant repair and upgrade (Phase 1-3) 422H’04
- Saldanha • Third roll grinder 30
2H’04- Asset replacement & ongoing capex 502- Other reline & value adding projects 626
Strong investment programme
PlannedCompletion
CostRm
f i n a n c e

21
Headline Earnings
Headline earnings
BAA remuneration*
- in US$m
Comparable earnings
Minority interest
Equity earnings*
Tax
- long-term provision top-up
Financing cost - net interest (expense)/income
Comparable operating profit
Revenue
3 221
521
3 221
(3)
153
(1 329)
(30)
83
4 347
12 264
1H’05
2 990
482
2 990
(2)
79
(1 551)
(37)
50
4 451
12 509
2H’04
1 551
(511)
311
2 062
(4)
179
(914)
(133)#
(14)
2 948
10 544
1H’04 Rm
* After tax# Lower discount rate accounts for R100m
Record earnings

22
Comparable Headline Earnings TrendR
m
1 750
1 500
1 250
1 000
750
500
250
0
657596
352
655 669
1393
1575
1415
15781643
1Q’03 2Q’03 3Q’03 4Q’03 1Q’04 2Q’04 3Q’04 4Q’04 1Q’05 2Q’05
Earnings level maintained

23
Operating Profit
4 347 4 451 2 217 Operating profit
(731)BAA remuneration
4 347 4 451 2 948 Comparable operating profit
(36)(91)(59)Corporate
12 24 18 Other
159 301 161 Coke and chemicals
1 195 1 129 640 Long products
685 799 348 Saldanha Steel
2 332 2 289 1 840 Vanderbijlpark
1H’05 2H’04 1H’04 Rm
Strong performance from all units
24
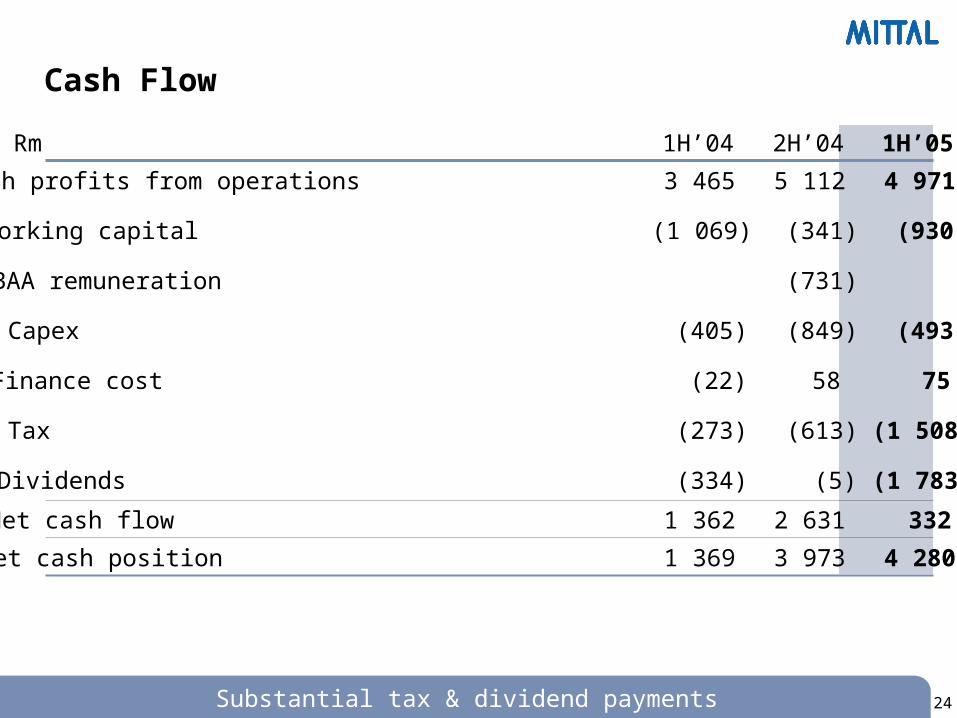
Cash Flow
4 280 3 973 1 369 Net cash position
332 2 631 1 362 Net cash flow
(1 783)(5)(334)Dividends
(1 508)(613)(273)Tax
75 58 (22)Finance cost
(493)(849)(405)Capex
(731)BAA remuneration
(930)(341)(1 069)Working capital
4 971 5 112 3 465 Cash profits from operations
1H’05 2H’04 1H’04 Rm
Substantial tax & dividend payments
25
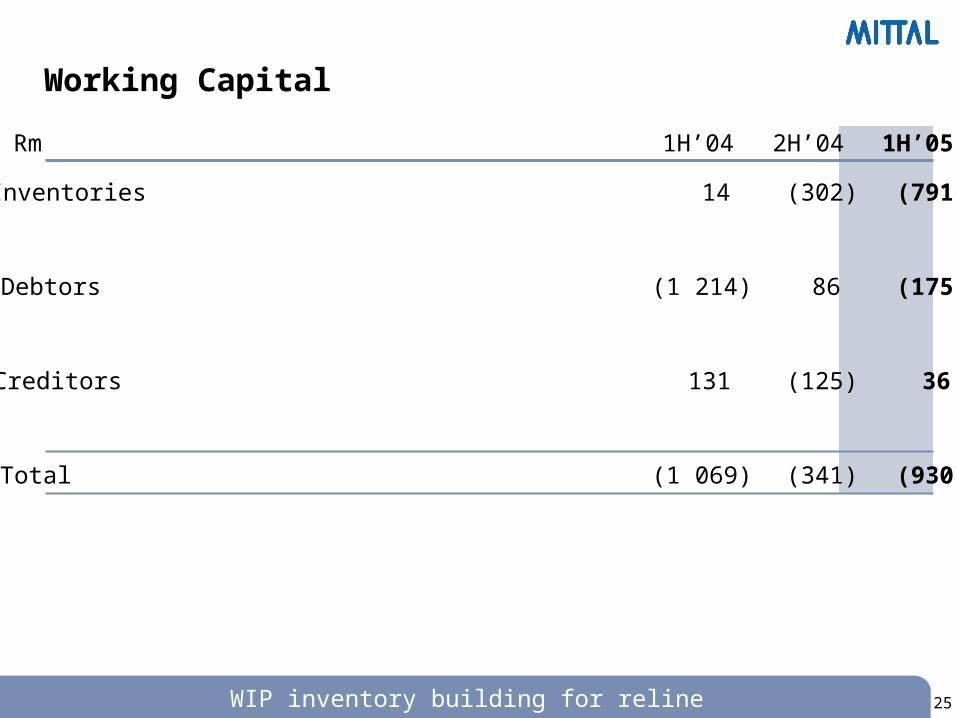
Working Capital
(930)(341)(1 069)Total
36 (125)131 Creditors
(175)86 (1 214)Debtors
(791)(302)14 Inventories
1H’05 2H’04 1H’04 Rm
WIP inventory building for reline

26
374030- on comparative basis (%)*
374023Return on equity (%)
1.51.71.4Revenue/invested capital (times)
403933- on comparative basis (%)*
403926EBITDA margin (%)
22.624.89.7Net cash/equity (%)
353628- on comparative basis (%)*
1H’052H’041H’04
353621Operating margin (%)
Financial Ratios
* Adjusted for once-off items
Sound business performance

27
Share Performance
2002 2003 2004 2005
350
300
250
200
150
100
50
0
Good investment case
Mittal Steel SA
All Share
Top 40
Bas
ed t
o 1
0 0
Source: I-Net Bridge

28
Dividend
Dividend policy
- Distributing one third of headline earnings
Dividend declared
- Interim dividend of 240 cents per share -12 September 2005
i n v e s t m e n t c a s e

30
Strategy Update
2 Mtpa throughput strategy
- Several projects at EIA stage
US$50/t Cost reduction strategy
- Newcastle PCI project exceeding expectations
Africa strategy
- 90% Africa focus inline with development plans of SA Govt & NEPAD
Strategy gaining momentum

31
Contribution to the Economy
R9bn capital investment programme
US$704m gross export revenue
Contribution to the state treasury of R1.6bn
Procurement from affirmative business enterprises of R805m
Refocused social investment on science & technology education
- Scitech exhibition (attendance 38 000 learners)
- Mittal National Science Olympiad (participation 10 000 learners)
Supporting economic growth
32
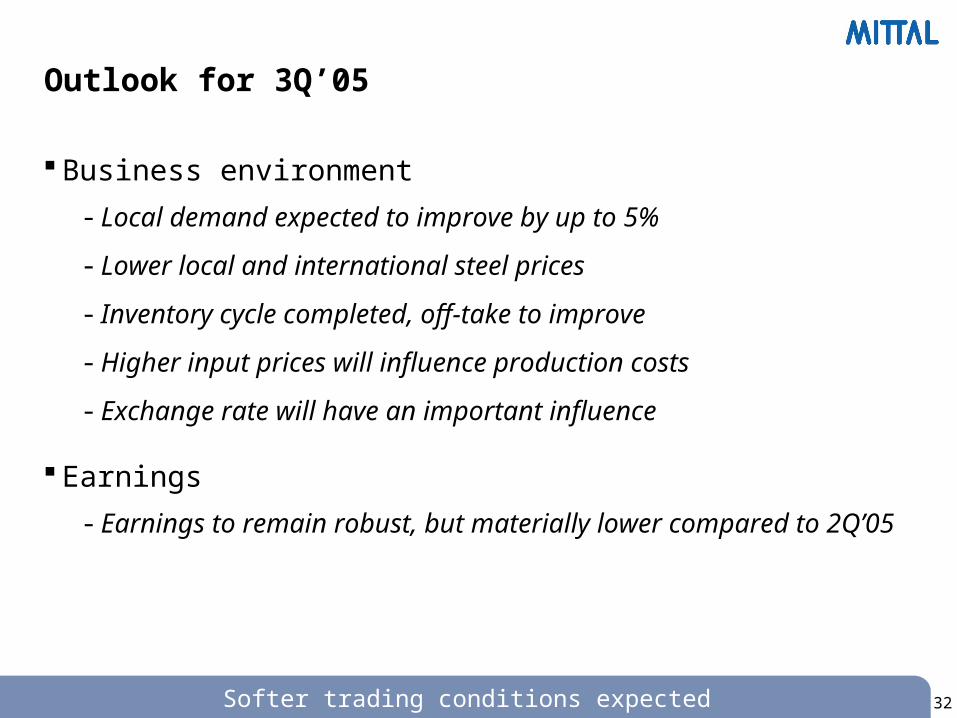
Outlook for 3Q’05
Business environment
- Local demand expected to improve by up to 5%
- Lower local and international steel prices
- Inventory cycle completed, off-take to improve
- Higher input prices will influence production costs
- Exchange rate will have an important influence
Earnings
- Earnings to remain robust, but materially lower compared to 2Q’05
Softer trading conditions expected
33
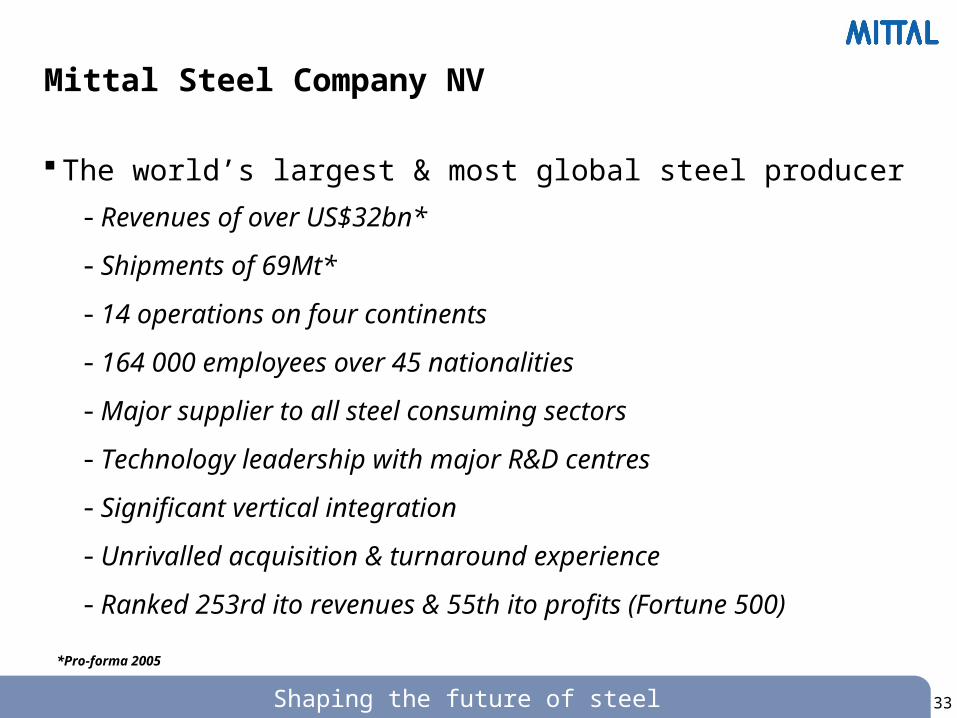
Mittal Steel Company NV
The world’s largest & most global steel producer
- Revenues of over US$32bn*
- Shipments of 69Mt*
- 14 operations on four continents
- 164 000 employees over 45 nationalities
- Major supplier to all steel consuming sectors
- Technology leadership with major R&D centres
- Significant vertical integration
- Unrivalled acquisition & turnaround experience
- Ranked 253rd ito revenues & 55th ito profits (Fortune 500)
*Pro-forma 2005
Shaping the future of steel
i n t e r i m r e s u l t sfor the six months ended june 2005
Related Documents