I N T E G R A T E D S I N K E N H A N C E M E N T A S S E S S M E N T INSEA PARTNERS Forest production and carbon storage -potentials of European forestry FORESTRY MODELLING Oskar Franklin Elena Moltchanova Michael Obersteiner Florian Kraxner Rupert Seidl (BOKU, Wien) Manfred J Lexer (BOKU, Wien) Dimitry Rokityanskiy Kentaro Aoki Ian McCallum Dagmar Schwab Glen Armstrong Forestry Program

I N T E G R A T E D S I N K E N H A N C E M E N T A S S E S S M E N T INSEA PARTNERS Forest production and carbon storage -potentials of European forestry.
Dec 22, 2015
Welcome message from author
This document is posted to help you gain knowledge. Please leave a comment to let me know what you think about it! Share it to your friends and learn new things together.
Transcript
I N T E G R A T E D S I N K E N H A N C E M E N T A S S E S S M E N T
INSEA PARTNERS
Forest production and carbon storage-potentials of European forestry
FORESTRYMODELLING
Oskar Franklin
Elena Moltchanova
Michael Obersteiner
Florian Kraxner
Rupert Seidl (BOKU, Wien)
Manfred J Lexer (BOKU, Wien)
Dimitry Rokityanskiy
Kentaro Aoki
Ian McCallum
Dagmar Schwab
Glen Armstrong
Forestry Program

Ϊ Ϊ
Ϊ Ϊ
Ϊ I
N S
E A
Overview•Aims and framework•Forest model (the OSKAR model)•Results for different scenarios•Conclusions and implications

Ϊ Ϊ
Ϊ Ϊ
Ϊ I
N S
E A
Forests and management

Ϊ Ϊ
Ϊ Ϊ
Ϊ I
N S
E A
Output data:year biomass dead wood harvests costs2000 x x x x2001
.
.
.2100
age cohort0-10 y10-20y...>150y
scenario12...
speciessprucebeech...
Region
NPPpotential (climate)
species growth response
management effects
biomass/density effects
Output data:year biomass dead wood harvests costs2000 x x x x2001
.
.
.2100
age cohort0-10 y10-20y...>150y
scenario12...
speciessprucebeech...
Region
NPPpotential (climate)
species growth response
management effects
biomass/density effects
FASOM
OSKAR forestry model
the OSKAR Forestry model and data

Ϊ Ϊ
Ϊ Ϊ
Ϊ I
N S
E A
Forestry modeling framework
Forestry output:•C storage (soil, biomass)•Wood •Energy biom.•Forested area
Potentials:•C storage •Wood •Energy biom.
•managementscenarios: (harvest, thinning, species)
•climate change effect
•Initial state forest and soil
climate
FASOM model-economic optimization of land use
OSKAR model-forestry scenarios NPP model
•management costs
•prices
•alternative land uses

Ϊ Ϊ
Ϊ Ϊ
Ϊ I
N S
E A
Forest growth modeling

Ϊ Ϊ
Ϊ Ϊ
Ϊ I
N S
E A
Tree growth
•Productivity of the site (NPP) controls growth rate and equilibrium biomass
0 50 1000
1
22
0
GN b 1 1( )
GN b 1 0.1( )
GN b 2 0.01( )
GN b 2 1( )
1000 b
biomass
biom
ass
incr
emen
t
0 50 1000
1
22
0
GN b 1 1( )
GN b 1 0.1( )
GN b 2 0.01( )
GN b 2 1( )
1000 b
biomass
biom
ass
incr
emen
t
0 100 2000
50
10099.989
0
B 0.1 1 t 0.01( )
B 0.1 2 t 0.01( )
B 0.1 1 t 1( )
B 0.1 2 t 1( )
2000 ttimest
andi
ng b
iom
ass
0 100 2000
50
10099.989
0
B 0.1 1 t 0.01( )
B 0.1 2 t 0.01( )
B 0.1 1 t 1( )
B 0.1 2 t 1( )
2000 ttimest
andi
ng b
iom
ass

Ϊ Ϊ
Ϊ Ϊ
Ϊ I
N S
E A
Self-thinning and mortality
•Growth and competition causes self-thinning •The number of trees per are is limited by the self thinning line. This number decreases with increasing tree size
N tr
ees/
area
stand biomass
self-thin
nin
g lim
it

Ϊ Ϊ
Ϊ Ϊ
Ϊ I
N S
E A
Forest management
“And see this ring right here, Jimmy? . . . That’s another time the old fellow miraculously survived some big forest fire.”

Ϊ Ϊ
Ϊ Ϊ
Ϊ I
N S
E A
Thinning management
•Thinning purposes: •get larger trees (but fewer)•harvest more•take out bad trees •facilitate regeneration
•Growth effect: reduced density but more resources available per tree
•Mortality effect: reduced self-thinning mortality
relative density
self-
thin
ning
stan
d gr
owth
relative density

Ϊ Ϊ
Ϊ Ϊ
Ϊ I
N S
E A
Thinning scenarios
•Thinning at an early stage have a small effect on final biomass
•After thinning at a late stage, the old trees does fill up the space
•Large thinnings leaves space and resources (light) for new generation
•Thinnings can result in larger total harvests (thinnings + final harvest)
ste
m b
iom
ass 20%
70%
0%
time
biom
ass
+ a
cc.
thin
nin
gs

Ϊ Ϊ
Ϊ Ϊ
Ϊ I
N S
E A
Other management options
•Rotation length•Species selection•Fertilization
Ϊ Ϊ
Ϊ Ϊ
Ϊ I
N S
E A
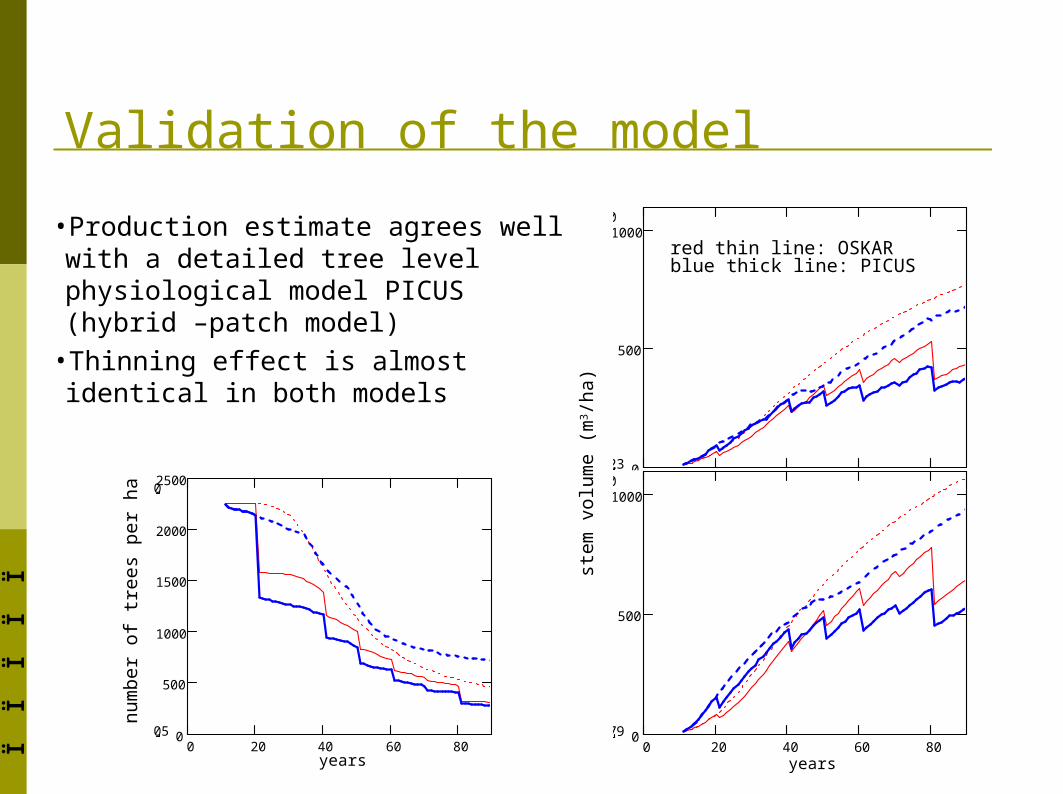
Validation of the model
•Production estimate agrees well with a detailed tree level physiological model PICUS (hybrid –patch model)
•Thinning effect is almost identical in both models
0 20 40 60 800
500
10001100
4.510323
S12 1
wd
S102 1
wd
picdata321
picdata32m1
9011 S10 S1
0 picdata32
0 picdata32m
0
0 20 40 60 800
500
10001100
6.652179
S12 1
wd
S102 1
wd
picdata301
picdata30m1
9011 S10 S1
0 picdata30
0 picdata30m
0
0 20 40 60 800
500
1000
1500
2000
25002250
3.115005
S16
S106
picdataN01
picdataN0m1
9011 S10 picdataN0
0 picdataN0m
0
ste
m v
olum
e (m
3/h
a)
red thin line: OSKARblue thick line: PICUS
num
ber
of t
rees
pe
r h
a
yearsyears

Ϊ Ϊ
Ϊ Ϊ
Ϊ I
N S
E A
Model summary
•Predicts carbon accumulation, forestry production and management costs in response to management (thinning, species selection, rotation) and climate change
•In contrast to most existing management models, it does not rely on local empirical relations and local site indexes, but is based on globally applicable biophysical principles and species characteristics.
•it can be run for any region and time period and is easily integrated with global models of climate change effects (LPJ) and land use economic optimization models (FASOM model), which is done in the European carbon sink project INSEA.

Ϊ Ϊ
Ϊ Ϊ
Ϊ I
N S
E A
Reality and results

Ϊ Ϊ
Ϊ Ϊ
Ϊ I
N S
E A
Current and future forests
modeled biomass and estimated by FAO for EU countries, for 2005 and mean of 2005-2100 for two scenarios: 1) all managed, 2) old forest protected
Biomass (MtC)
200
400
600
800
1000
1200
1400
Austria
Czech R
epublic
Denm
ark
Estonia
Finland
France
Germ
any
Hungary
Ireland
Italy
Latvia
Lithuania
Luxembourg
Netherlands
Poland
Portugal
Slovak R
epublic
Slovenia
Sw
eden
United K
ingdom
2005
FAO 2005
2005-2100
2005-2100protect oldforest
*old forests:7.1 % of total forest area on average
GH
G e
mis
sio
n E
U 2
5

Ϊ Ϊ
Ϊ Ϊ
Ϊ I
N S
E A
Current and future forestsHarvests (MtC/year)
5
10
15
20
25
30
Austria
Czech R
epublic
Denm
ark
Estonia
Finland
France
Germ
any
Hungary
Ireland
Italy
Latvia
Lithuania
Luxembourg
Netherlands
Poland
Portugal
Slovak R
epublic
Slovenia
Sw
eden
United K
ingdom
2005
FAO 2005
2005-2100
2005-2100protect oldforest
Total maximum sustainable harvests in EU ≈ 200 MtC/year (2005-2100)

Ϊ Ϊ
Ϊ Ϊ
Ϊ I
N S
E A
Forest development scenariosBiomass and dead wood for different harvesting scenarios
(MtC)
0
1000
2000
3000
4000
5000
6000
7000
8000
2000 2020 2040 2060 2080 2100 2120 2140
harvest all
harvest stem
protect old forest
Harvest all:harvest of stem + branches
protect old forest:forest older than 1.5 times normal harvesting age are protected dead wood
biomass

Ϊ Ϊ
Ϊ Ϊ
Ϊ I
N S
E A
Forest development scenarios
Harvests for different harvesting scenarios (MtC)
0
50
100
150
200
250
300
2000 2020 2040 2060 2080 2100 2120 2140
harvest all
harvest stem
protect old forest
Harvest all:harvest of stem + branches
protect old forest:forest older than 1.5 times normal harvesting age are protected

Ϊ Ϊ
Ϊ Ϊ
Ϊ I
N S
E A
Forest development scenarios
Mean age of forests (years)
0
10
20
30
40
50
60
2000 2050 2100 2150
all forest managed
protect old forest
old forests = 7.1% of total forest area

Ϊ Ϊ
Ϊ Ϊ
Ϊ I
N S
E A
Forest development scenariosBiomass and dead wood for different rotation lengths (MtC)
0
1000
2000
3000
4000
5000
6000
7000
8000
9000
2000 2020 2040 2060 2080 2100 2120 2140
short rotation
medium rotation
long rotation
dead wood
biomass

Ϊ Ϊ
Ϊ Ϊ
Ϊ I
N S
E A
Forest development scenarios
Harvests for different rotation lengths (MtC)
0
50
100
150
200
250
300
350
2000 2020 2040 2060 2080 2100 2120 2140
short rotation
medium rotation
long rotation

Ϊ Ϊ
Ϊ Ϊ
Ϊ I
N S
E A
Forest development scenariosBiomass and dead wood for different thinning scenarios (MtC)
0
1000
2000
3000
4000
5000
6000
7000
8000
2000 2050 2100 2150
no thinning
estimated thinning
>25% thinning
dead wood
biomass

Ϊ Ϊ
Ϊ Ϊ
Ϊ I
N S
E A
Forest development scenarios
Harvests for different thinning scenarios (MtC)
0
50
100
150
200
250
2000 2020 2040 2060 2080 2100 2120 2140
no thinning
estimated thinning
>25% thinning

Ϊ Ϊ
Ϊ Ϊ
Ϊ I
N S
E A
Conclusions•Future forest prediction strongly depends on estimates of current
forests.•There is a potential to increase harvests substantially in about 20
years from now•Increasing the rotation time/age at harvest is a way to increase the
carbon storage in the forest, but initially reduces harvest.•By protecting old forests, carbon storage can be increase about
20% almost without reduction in harvests
Related Documents