I I I I ·1 I I I I I I I I I I I I I ,I i (J) 0) N L!) L!) CrilTIe in Delavvare 1993 An Analysis of Delaware Crime May 1995 Prepared by the Statistical Analysis Center in Conjunction with the State Bureau of Identification STATE OF DELAWARE EXECUTIVE DEPARTMENT Statistical Analysis Center 60 The Plaza Dover, DE 19901 I If you have issues viewing or accessing this file, please contact us at NCJRS.gov.

Welcome message from author
This document is posted to help you gain knowledge. Please leave a comment to let me know what you think about it! Share it to your friends and learn new things together.
Transcript
-.-----------------------~----
I I I I
·1 I I I I I I I I I I I I I ,I i
(J) 0)
N L!) L!)
CrilTIe in Delavvare 1993
An Analysis of Delaware Crime
May 1995
Prepared by the
Statistical Analysis Center
in Conjunction with the
State Bureau of Identification
STATE OF DELAWARE
EXECUTIVE DEPARTMENT
Statistical Analysis Center
60 The Plaza
Dover, DE 19901
I
If you have issues viewing or accessing this file, please contact us at NCJRS.gov.

Crime in Delaware 1993
An Analysis of Delaware Crime
Prepared by: Eric Zoeckler, Research .Analyst
Charles Huenke, Research Analyst John P. 0' Connel1~ Director
u.s. Department of Justice National Institute of Justice
155299
This document has been reproduced exactly as received from the person or organization originating". POints of view or opinions stated In
this document are those of the authors and do not necessarily represent the official pOSition or poliCies of the Natlo~allnstltute of Justice.
PermisSion to reproduce this 1IlW£& " material has been granted by Public JJol1B.inmJS/BJA~~~ __ _ u. s. _ Deparbnent of Justice
to the NatIOnal Criminal JJsltce Reference Service (NCJRS).
Further reproductIOn outside of the NCJRS system reqUlies permission of the I!iIII!I!IIIIII owner
This report is supported in prut by SAC Clearinghouse grant # 92-BJ-CX-K021 from the Bureau of Justice Statistics, and in part by grants # 94~DB-CX-00I0 and # 92-MU-CX-0014 from the Bureau of Justice Assistance, U.S. Department of Justice.
The points of view expressed in this document do not necessarily represent the official po~ition of the US Department of Justice.
State of Delaware Document # 10-07-03-95-05-05
I I I I I I I I I I I I I I I I I I I
---_._- --------------------
I I
,.:-:: .. ' .': ..... .', .. : """,-:,.''','.'' .. , ... :, ....... :;. " .: .... , ' ... ' .... ,
,.~'.'-~-. ·~cc' :".:'" :Tnb·le·"o.f,·,(;ont·enls._.:':··' ....... ~:, '~~. "'-. , ': . ',',- '. , . '. ,",:, _ ' .. :.' . '. ',",' ',', . . '.', . ' i":··. .. .. '.'. ..:' '. " "" . :.. .: " "
I Crime in Delaware 1993: Highlights 1
I I Violent Crime
I I I I I I I I I I I I I I I
Property Crime
Regional Comparison
Delaware Statewide Maps
Juvenile Crime
Arrests & Clearances
Illicit Drug Crime
Police Activity by Jurisdiction
Computer Aided Dispatch (CAD) Crime Data
Glossary of Tenns
A ... ge, Race and Sex Tables of Arrestees
3
13
17
23
27
37
45
51
71
75
80
I I
Highlights Crime Down in I (1') 1993
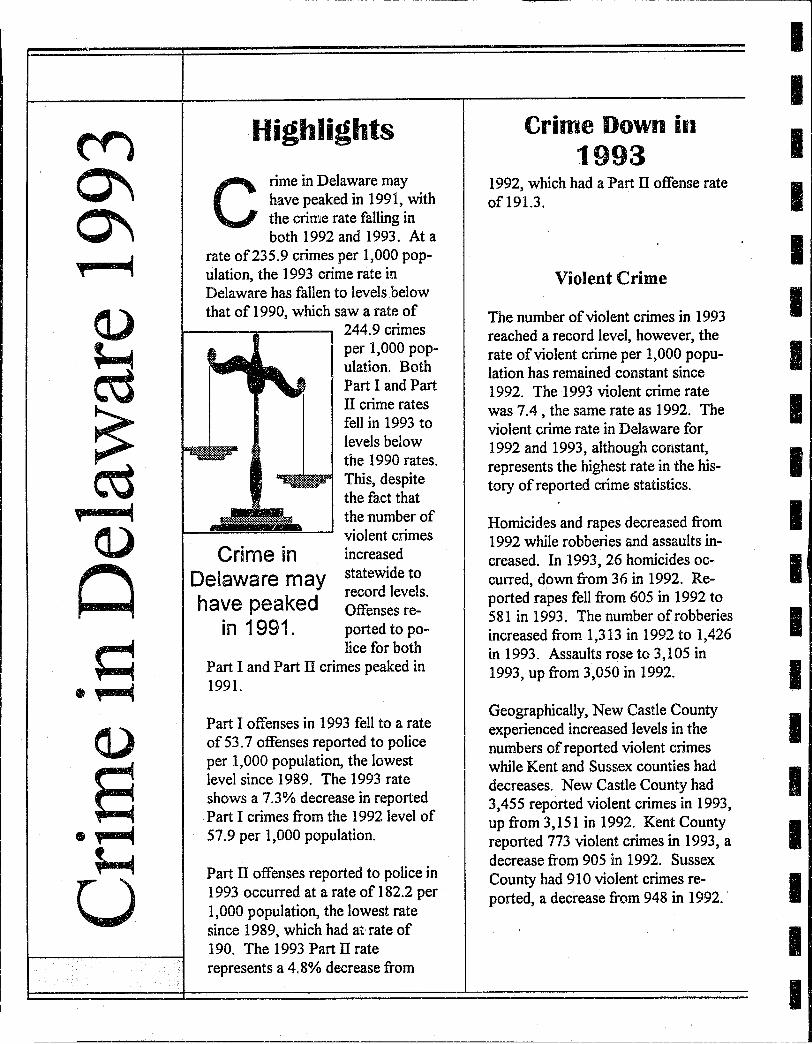
0\ C rime in Delaware may 1992 which had a Part IT offense rate I , have peaked in 1991, with of 191.3.
0\ the crime rate falling in both 1992 and 1993. At a I rate of235.9 crimes per 1,000 pop-
f ~ ulation, the 1993 crime rate in Violent Crime Delaware has fallen to levels below I (J) that of 1990, which saw a rate of The number of violent crimes in 1993
244.9 crimes reached a record level, however, the
~ per 1,000 pop- rate of violent crime per 1,000 popu- I ulation. Both lation has remained constant since Part I and Part 1992. The 1993 violent crime rate
I IT crime rates was 7.4 , the same rate as 1992. The
~ fell in 1993 to violent crime rate in Delaware for levels below 1992 and 1993, although constant,
I the 1990 rates. represents the highest rate in the his-This, despite tory of reported crime statistics. the fact that
I ,. ~ the number of Homicides and rapes decreased from
(J) violent crimes 1992 while robberies and assaults in-Crime in increased creased. In 1993, 26 homicides oc- I Q Delaware may statewide to curred, down from 36 in 1992. Re-
record levels. ported rapes fell from 605 in 1992 to have peaked Offenses re- 581 in 1993. The number of robberies I in 1991. ported to po- increased from 1,313 in 1992 to 1,426
0 lice for both in 1993. Assaults rose to 3,105 in
I Part I and Part II crimes peaked in 1993, up from 3,050 in 1992.
• ,.-..( 1991.
Part I offenses in 1993 fell to a rate Geographically, New Castle County
I (j) experienced increased levels in the of 53.7 offenses reported to police numbers of reported violent crimes per 1,000 population, the lowest while Kent and Sussex counties had
I S level since 1989. The 1993 rate decreases. New Castle County had shows a 7.3% decrease in reported 3,455 reported violent crimes in 1993,
. Part I crimes from the 1992 level of up from 3,151 in 1992. Kent County I .~ 57.9 per 1,000 population. reported 773 violent crimes in 1993, a
~ decrease from 905 in 1992. Sussex Part IT offenses reported to police in County had 910 violent crimes re- I U 1993 occurred at a rate of 182.2 per ported, a decrease from 948 in 1992. 1,000 population, the lowest rate since 1989, which had at rate of I 190. The 1993 Part IT rate represents a 4.8% decrease from
I
Drug Crime Decreases
tatewide reported drug
S offenses decreased for a second consecutive year, from 6,235 in 1992 to
5 999 in 1993. The 3.8% statewide , decrease was attributed to a 10.3% decline in New Castle County. Reported drug offenses increased by 9.8% in Kent County and 8.9% in Sussex County.
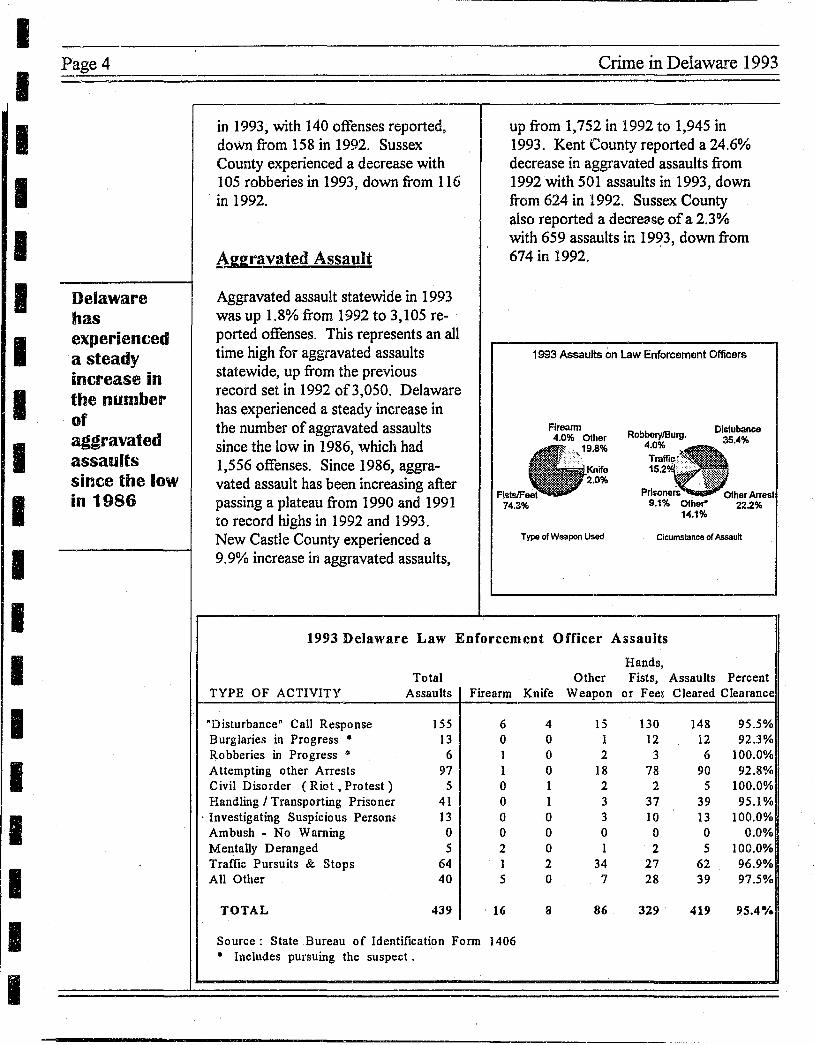
In 1993 there were 439 assaults on law enforcement officers in Delaware, down
from 567 in 1992. Tllis represents a decrease of29.2%. Of the 439 assaults on law enforcement officers, 155 occurred during the course of responding to disturbance, 97 occurred during attempted arrests, 67 occurred after traffic pursuits and stops, 41 occurred handeling or transporting prisoners. Hands, fists or feet were used as weapons in 329 of the assaults on law enforcement officers, 16 firearms, 8 knives and 86 other weapon types were used during other assaults.
Crime in Delaware 1993
Part I Crime
P art I Crime includes serious, commonly occurring crimes which are divided into the
categories of violent crime and property crime. Violent crime consists of homicide, (including non-negligent manslaughter), forcible rape, robbery and aggravated assault. The property crimes are larceny, burglary, motor vehicle theft and arson. In this section, violent crime is discussed in detail followed by a discussion of property crimes.
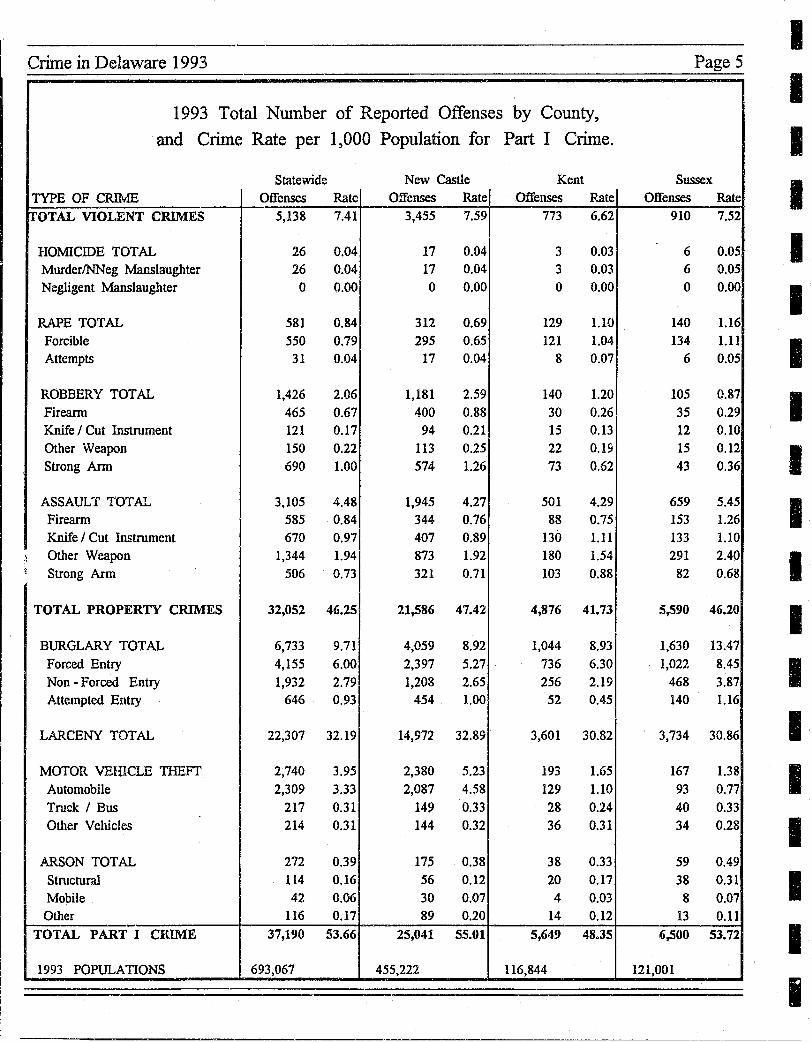
In 1993, there were 37,190 Part I category crimes reported in Delaware. This reflects a decrease from 1992, which had 39,561 Part I crimes reported. The 1993 Part I crime rate per 1000 population was 53.7 statewide, a decrease from the 1992 rate of58.2.
New Castle r.i1J Kent counties reported a decr~ase in the number of Part I crimes while Sussex County reported an increase. New Castle County reported 25,041 Part I crimes in 1993, a decrease from 26,823 in 1992. Kent County reported 5,649 Part I crimes in 1993, a decrease from 1992, which had 6,417 crimes. Sussex County reported an increase from 6,321 in 1992 to 6,500 in 1993.
Violent crime rate unchanged in 1993.
~~~-~---~-----------------
Crime in Delaware 1993
Violent Crime in 1993
v iolent crime in Delaware continues to increase statewide, rising steadily
since 1987 to a record high in 1993 of 5,138 crimes. During the mid 1980s violent crime remained relatively stable, however, in 1987 Delaware began to experience a sustained increase in the number of violent crimes each year since. Increasing from 5,004 in 1992 to 5,138 in 1993, Delaware has experienced another 2.6% increase over the 1992 level, however, the rate of increase in violent crime each year has slowed since 1991.
Among Delaware's counties, only New Castle reported an increase in the number of violent crimes in 1993. New Castle County had 3,455 violent crimes in 1993, up from 3,151 in 1992. This represents a 8.8% increase over the 1992 level. Kent and Sussex counties both had decreases in violent crime, Kent County reported 773 violent crimes in 1993, a decrease from 905 in 1992, and Sussex County reported 910 violent crimes in 1993, a decrease from 948 in 1992.
Homidd~
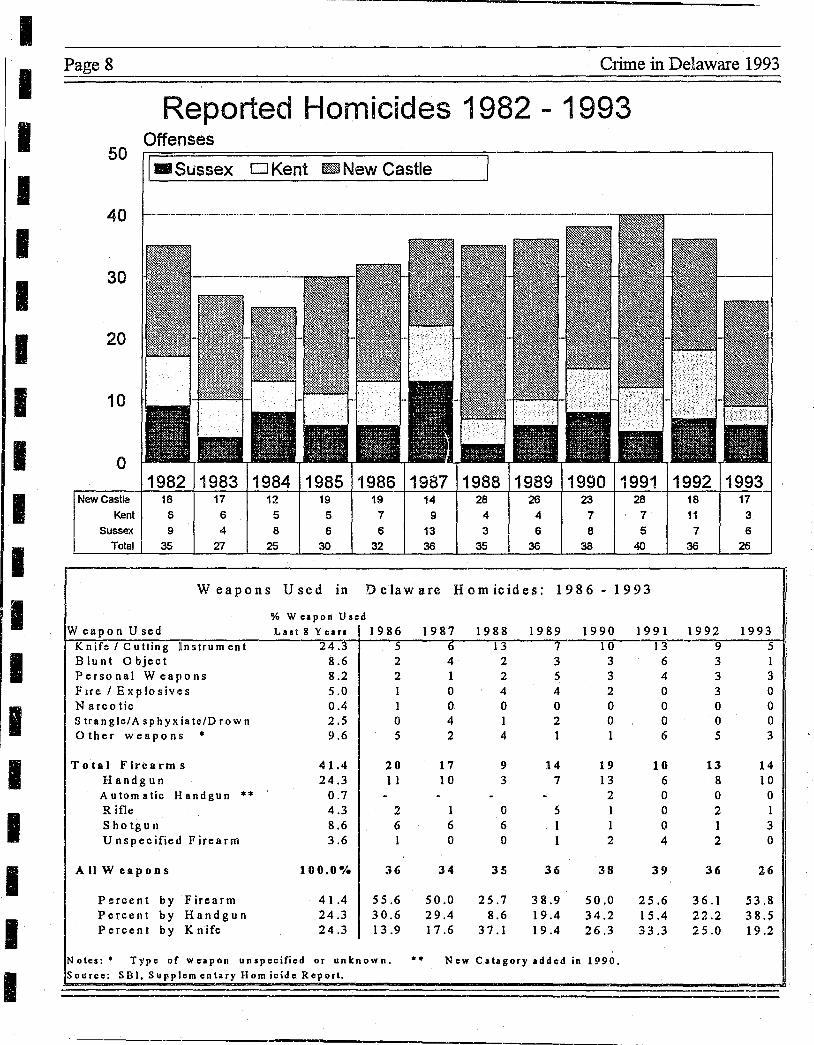
Statewide, 26 homicides occurred in Delaware in 1993. This is a 38.5% decrease from the 36 homicides which occurred in 1992. Of the 26 homicides in 1993, 15 were perpetrated by persons known by the victim, 11 were committed by unknown assailants. 6 homicides were attributed to domestic violence in 1993. 14 homicides were committed through the use of
firearms, of which 10 were handguns. Handguns therefore were involved in 38.5% of homicides in Delaware in 1993. New Castle County had 17 homicides, Kent County had 3 homicides and Sussex County reported 6 homicides.
Forcible Rape
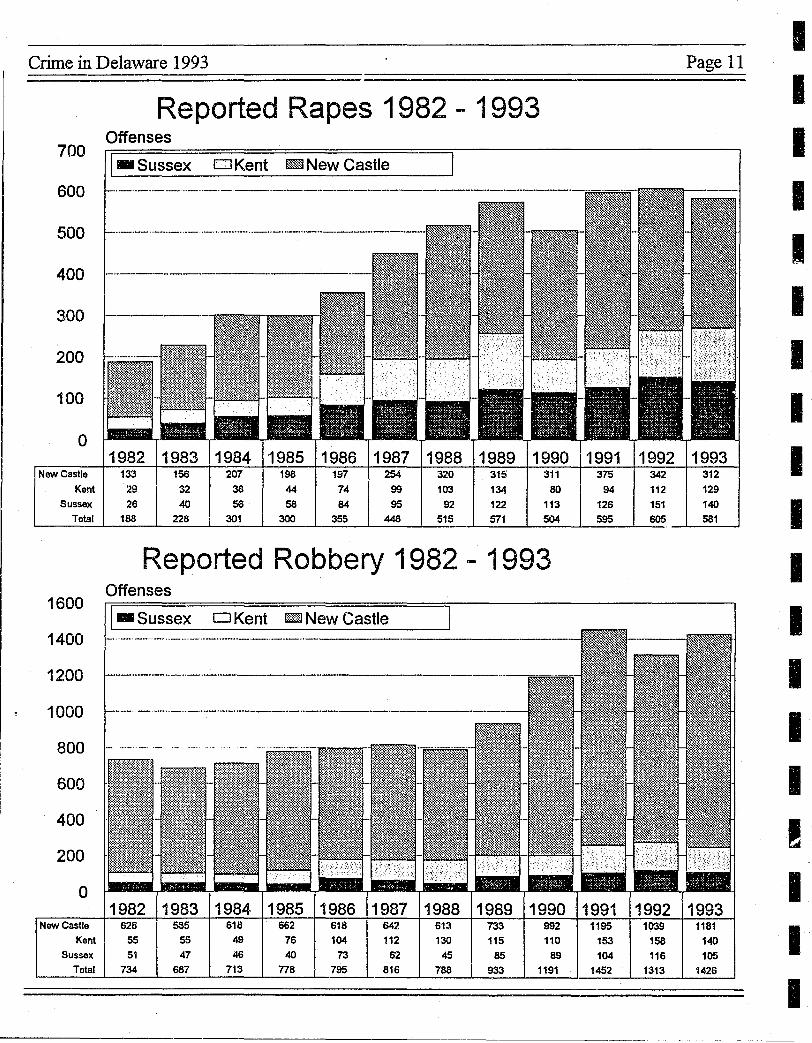
Statewide, 581 forcible rapes occurred in Delaware in 1993. This represents a decrease from 1992 in which 605 forcible rapes occurred. Among the counties, only Kent County reported an increase from 112 in 1992 to 129 in 1993. New Castle County had a decrease from 342 in 1992 to 312 in 1993. Sussex County reported 140 forcible rapes in 1993, down from 151 in 1992. Until this year Delaware had experienced a significant rise in the number of forcible rapes reported to police since 1982 (in which only 188 rapes were reported). Over the course of the 1980s, the number of rapes known to police rose steadily, reaching a high of605 in 1992.
Robbery
Robbery in Delaware increased in 1993 to 1,426 offenses, an increase of 7.9% over 1992, which had 1,313 robberies. Although robbery was up in 1993, the number of offenses is still down from the peak in 1991, which had 1,452 robberies. Robbery in New Castle County was up 12% in 1993, from 1,039 in 1992, to 1,181 in 1993. Following the state trend, although up over the 1992 number, robbery in New Castle County is still down from the record set in 1991, of 1,195. Kent county reported a decrease in robbery
Page 3
Violent crime in Delaware continues to increase statewide, rising steadily since 1987 to a record high in 1993
I I I I I I I I I I I I I I I I I I I
I I I I I I I I I I I I I I I I
Delaware has experienced a steady increase in the number of aggravated assaults since the low in 1986
in 1993, with 140 offenses reported, down from 158 in 1992. Sussex County experienced a decrease with 105 robberies in 1993, down from 116 in 1992.
~ggravated Assault
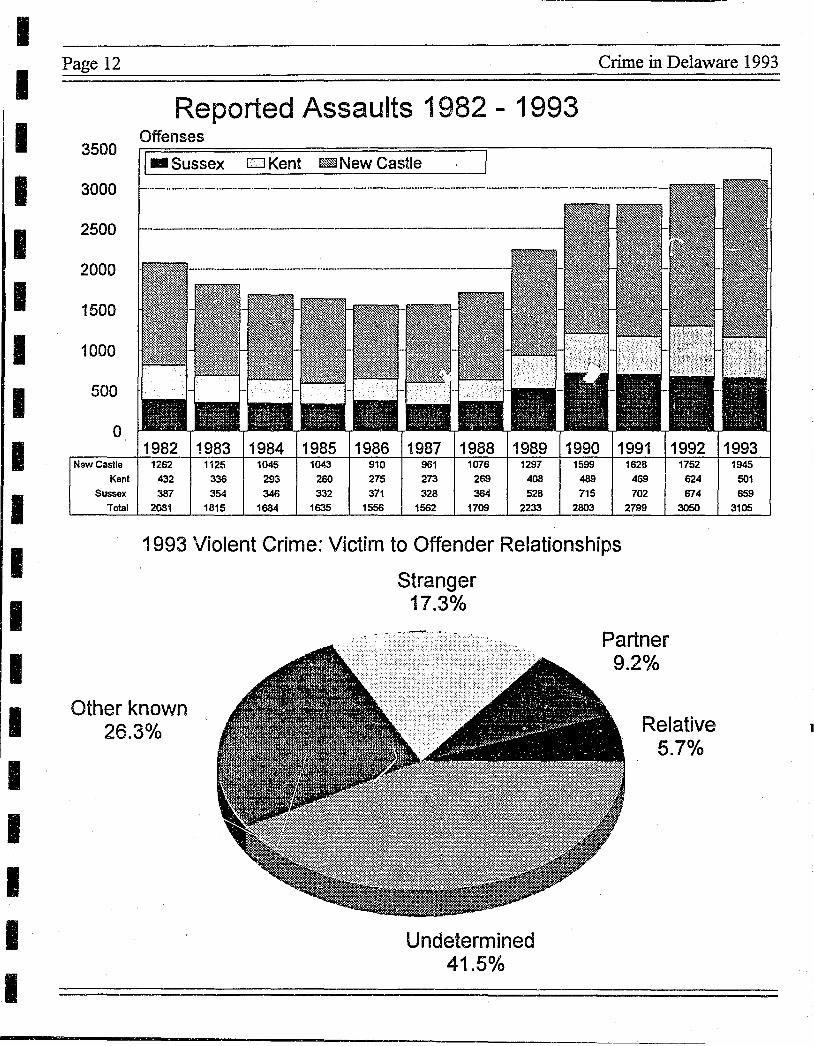
Aggravated assault statewide in 1993 was up 1.8% from 1992 to 3,105 reported offenses. This represents an all time high for aggravated assaults statewide, up from the previous record set in 1992 of3,050. Delaware has experienced a steady increase in the number of aggravated assaults since the low in 1986, which had 1,556 offenses. Since 1986, aggravated assault has been increasing after passing a plateau from 1990 and 1991 to record highs in 1992 and 1993. New Castle County experienced a 9.9% increase in aggravated assaults,
Crime in Delaware 1993
up from 1,752 in 1992 to 1,945 in 1993. Kent County reported a 24.6% decrease in aggravated assaults from 1992 with 501 assaults in 1993, down from 624 in 1992. Sussex County also reported a decrea$e of a 2.3% with 659 assaults in 1993, down from 674 in 1992.
1993 Assaults on Law Enforcemont Officers
74.3%
Type ofWsapon Used
9.1% other" 14.1%
Disiubance 35.04%
Cicumsmnce or As.'MIult
1993 Delaware Law Enforcement Officer Assaults
Hands, Total Other Fists, Assaults Percent
TYPE OF ACTIVITY Assaults Firearm Knife Weapon or Feet Cleared Clearance . "Disturbance" Call Response 155 6 4 15 130 148 95.5% Burglaries in Progress • 13 0 0 1 12 12 92.3% Robberies in Progress • 6 0 2 3 6 100.0% Attempting other Arrests 97 1 0 18 78 90 92.8% Civil Disorder ( Riot, Protest) 5 0 1 2 2 5 100.0% Handling I Transporting Prisoner 41 0 1 3 37 39 95.1%
. Investigating Suspicious Persom 13 0 0 3 10 13 100.0% Ambush - No Warning 0 0 0 0 0 0 0.0% Mentally Deranged 5 2 0 2 5 100.0% Traffic Pursuits & Stops 64 1 2 34 27 62 96.9% All Other 40 5 0 7 28 39 97.5%
TOTAL 439 16 8 86 329 419 95.4-/_
Source: State Bureau of Identification Form 1406 • Includes pursuing the suspect .
-----------._-----------------------
Crime in Delaware 1993
1993 Total Number of Reported Offenses by County,
and Crime Rate per 1,000 Population for Part I Crime.
Statewide New Castle Kent
TYPEOFCRIME Offenses Rate Offenses Rate Offenses Rate
TOTAL VIOLENT CRIMES 5,138 7.41 3,455 7.59 773 6.62
HOMICIDE TOTAL 26 0.04 17 0.04 3 0.03
MurderfNNeg Manslaughter 26 0.04 17 0.04 3 0.03
Negligent Manslaughter 0 0.00 0 0.00 0 0.00
RAPE TOTAL 581 0.84 312 0.69 129 1.10
Forcible 550 0.79 295 0.65 121 1.04
Attempts 31 0.04 17 0.04 8 0.07
ROBBERY TOTAL 1,426 2.06 1,181 2.59 140 1.20
Firearm 465 0.67 400 0.88 30 0.26
Knife / Cut Instrument 121 0.17 94 0.21 15 0.13
Other Weapon 150 0.22 113 0.25 22 0.19
Strong Ann 690 1.00 574 1.26 73 0.62
ASSAULT TOTAL 3,105 4.48 1,945 4.27 501 4.29 Firearm 585 0.84 344 0.76 88 0.75
Knife I Cut Instrument 670 0.97 407 0.89 130 1.11
.\ Other Weapon 1,344 1.94 873 1.92 180 1.54 ~ Strong Arm 506 0.73 321 0.71 103 0.88
TOTAL PROPERTY CRIMES 32,052 46.25 21,586 47.42 4,876 41.73
BURGLARY TOTAL 6,733 9.71 4,059 8.92 1,044 8.93
Forced Entry 4,155 6.00 2,397 5.27 736 6.30
Non - Forced Entry 1,932 2.79 1,208 2.65 256 2.19 Attempted Entry 646 0.93 454 1.00 52 0.45
LARCENY TOTAL 22,307 32.19 14,972 32.89 3,601 30.82
MOTOR VEHICLE THEFT 2,740 3.95 2,380 5.23 193 1.65
Automobile 2,309 3.33 2,087 4.58 129 1.10
Truck I Bus 217 0.31 149 0.33 28 0.24
Other Vehicles 214 0.31 144 0.32 36 0.31
ARSON TOTAL 272 0.39 175 0.38 38 0.33
Structural 114 0.16 56 0.12 20 0.17
Mobile 42 0.06 30 0.07 4 0.03
Other 116 0.17 89 0.20 14 0.12
TOTAL PART I CRIME 37,190 53.66 25,041 55.01 5,649 48.35
1993 POPULATIONS 693,067 455,222 116,844
Page 5
Sussex
Offenses Rate
910 7.52
6 0.05 6 0.05
0 0.00
140 1.16
134 1.11 6 0.05
105 0.87
35 0.29
12 0.10
15 0.12
43 0.36
659 5.45
153 1.26
133 1.10
291 2.40
82 0.68
5,590 46.20
1,630 13.47
1,022 8.45
468 3.87
140 1.16
3,734 30.86
167 1.38
93 0.77
40 0.33
34 0.28
59 0.49
38 0.31
8 0.07
13 0.11
6,500 53.72
121,001
I I I I I I I I I I I I I I I I I I I
I I I I I I I I I I I I I I I I I I II
Page 6 Crime in Delaware 1993
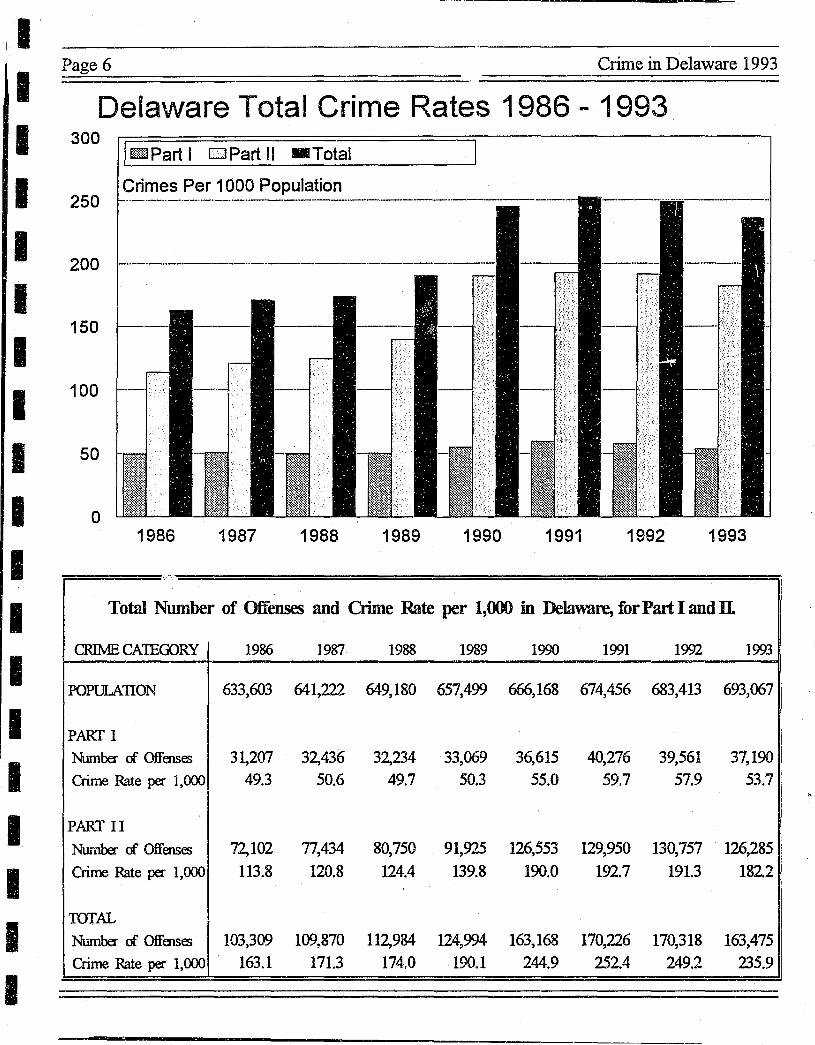
Delaware Total Crime Rates 1986 - 1993 300 IliEl Part I 0 Part II • Total I 250
Crimes Per 1000 Population
200
150
100
50
o 1986 1987 1988 1989 1990 1991 1992 1993
. . .
Total Number of Offenses and Crime Rate per 1,000 in Delaware, for Part I and n.
CRIME CA'IEGORY 1986 1987 1988 1989 1990 1991 1992 1993 '.
POPUlATION 633,603 641,222 649,180 657,499 666,168 674,456 683,413 693,067
PART 1 Number of Offenses 31,207 32,436 32,234 33,069 36,615 40,276 39,561 37,190 Crime Rate per 1,000 49.3 50.6 49.7 50.3 55.0 59.7 57.9 53.7
PART II Number of Offenses 72,102 77,434 80,750 91,925 126,553 129,950 130,757 126,285 Crime Rate per 1,000 113.8 120.8 124.4 139.8 190.0 192.7 191.3 182.2
TOTAL
Number of Offenses 103,309 109,870 112,984 124,994 163,168 170,226 170,318 163,475 Crime Rate per 1,000 163.1 171.3 174.0 190,1 244.9 252.4 249.2 235.9

Crime in Delaware 1993 Page 7
Total Reported Part I Crime 1982 - 1993 Offenses
50000 tm1 New Castle
40000
30000
20000
10000
o 1983 1984 1985 1986 1987 1988 1989 1990 1991 1992 1993
New Castle 23577 22763 22660 21612 22325 22234 22968 29143 28136 26823 25041 Kent 4760 4119 4270 4465 5095 5036 5126 5119 5969 6417 5649
Sussex 4651 4382 4444 5130 5016 4964 4975 5353 6171 6321 6500 Total 32988 31264 31374 31207 32436 32234 33069 39615 40276 39561 37190
Total Reported Violent Crime 1982 - 1993 Offenses
6000 - Sussex D Kent [ill New Castle
5000 1-····· __ • __ ··· __ ···_· ... --... - .. - .. - ... - .... --.... - .... - •. ----.. ----.--.--------.--------.-.---.-.----.. --
4000
3000
2000
1000
o New Castle 1883 1882
Kent 429 385 Sussex 445 456
1922 385 436
Total 2757 2723 2743
L _________ ~ __
1744 460
534
2738
1871 493 498
2862
2037
506
504 3047
2371 661 741
3n3
2925 686 925
4536
3226
937 4886
3151
905
948 5004
3455
773 910
5138
I I I I I I I I I I I I I I I I I I I
I I I I I I I I I I I I I I I I I
Page 8 Crime in Delaware 1993
Reported Homicides 1982 1993 Offenses
50 o Kent m1lID New Castle
40
30
20
10
0 1982 1983 1984 1985 1986 1987 1988 1989 1990 1991 1992 1993
NewCastle 18 17 12 19 19 14 28 26 23 28 18 17 Kent 8 6 5 5 7 9 4 4 7 7 11 3
Sussex 9 4 8 6 6 13 3 6 8 5 7 6 Total 35 27 25 30 32 36 35 36 38 40 36 26
Weapons Used in 1) elaw are Hom icides: 1986 - 1993
% Weapon Uled
Weapon Used Last 8 Years 1986 1987 1988 1989 1990 1991 1992 1993 Knife / C u ttin g nnstrum ent 24.3 5 6 13 7 10 13 9 5 B lu nt Object 8.6 2 4 2 3 3 6 3 1 Personal Weapons 8.2 2 1 2 5 3 4 3 3 Fire / Explosiv':s 5.0 1 0 4 4 2 0 3 0 N arco tic 0.4 1 0 0 0 0 0 0 0 S trangle/A sphyxiate/D rown 2.5 0 4 1 2 0 0 0 0 Other weapons - 9.6 5 2 4 1 1 6 5 3
To tal Firearms 41.4 20 17 9 14 19 10 13 14 Handgun 24.3 1 1 10 3 7 13 6 8 10 Automatic Handgun
--0.7 2 0 0 0
Rifle 4.3 2 1 0 5 1 0 2 1 Shotgun 8.6 6 6 6 1 0 3 Unspecified Firearm 3.6 0 0 2 4 2 0
AllWeapons 100.0·/. 36 34 35 36 38 39 36 16
Percent by Firearm 41.4 55.6 50.0 25.7 38.9 50.0 25.6 36.1 53.8 Percent by Handgun 24.3 30.6 29.4 8.6 19.4 34.2 15.4 22.2 38.5 Percent by Knife 24.3 13.9 17.6 37.1 19.4 26.3 33.3 25.0 19.2
Notes: • Type of weapon unJpecified or unknown. •• New Catagory added in 1990. Source: SBI, Supplcm entary Hom icide Report.

---_._----------
Crime in Delaware 1993 Page 9
.... Delaware Homicides: Victim and Offender Demographics, 1985 - 1993.
1988 1989 1990 1991 1992 1993 Juve Adult Juve Adult Juve Adult Juve Adult Juve Adult Juve Adult
VICTIMS MALE TOTAL 1 15 9 17 4 19 3 24 4 16 3 17 Hispanic (1) 0 0 0 0 0 0 0 0 1 1 0 0
Black 1 8 4 7 3 11 0 11 1 10 '. 2 10
White 0 7 5 9 1. 8 3 13 2 6 1 7 Other (2) 0 0 0 1 0 0 0 0 1 0 0 0
FEMALE TOTAL 2 17 2 8 2 13 4 9 3 13 0 6 Hispanic 0 0 0 0 0 0 0 0 0 1 0 0 Black 0 7 0 3 1 7 3 3 0 4 0 2 White 0 7 2 5 1 6 1 5 3 8 0 4 Other 2 3 0 0 0 0 0 1 0 1 0 0
TOTAL VICfIMS 3 32 11 25 6 32 7 33 '7 29 3 23
OFFENDERS MALE TOTAL 3 21 5 23 5 35 4 34 4 35 2 19 Hispanic 0 0 0 0 1 3 3 5 0 1 0 0 Black 3 13 1 14 5 24 2 19 3 17 2 13 White 0 7 4 9 0 11 2 12 1 17 0 4 Other 0 1 0 0 0 0 0 3 0 1 0 2
FEMALE TOTAL 1 3 1 4 0 3 0 8 1 4 0 3
Hispanic 0 0 0 0 0 0 0 0 0 0 0 0
Black 1 1 1 2 0 3 0 4 1 3 0 1
White 0 1 0 2 0 0 0 3 () 1 0 2 Other 0 1 0 0 0 0 0 1 0 0 0 0
UNKNOWN (3) 0 9 0 5 0 3 0 5 0 3 0 0
TOTAL OFFENDERS 4 33 6 32 5 41 4 47 5 42 2 22 ,
!Notes: I . The Hispanic category is an ethnic group and it is mutually exclusive of the other racial categories. 2. The nOthern category includes American Indians, Asiatic peoples, and cases where only sex is known. 3. "Unknown" applies to an unidentified offender, presumed adult, as of the end of the reporting year. 4. Offenders committing mUltiple murders are counted once. Some victims are killed by more than one offender.
i n which case the victim is counted once and each offender is counted once.
Source: SBI Supplemental Homicide Roport.
l
I I I I I I I I I I I I I I I I I I I
I I
II I I I I I I I I I I I I I I I I I
----~~-----.-------~---------------------------,
Page 10 Crime in Delaware 1993
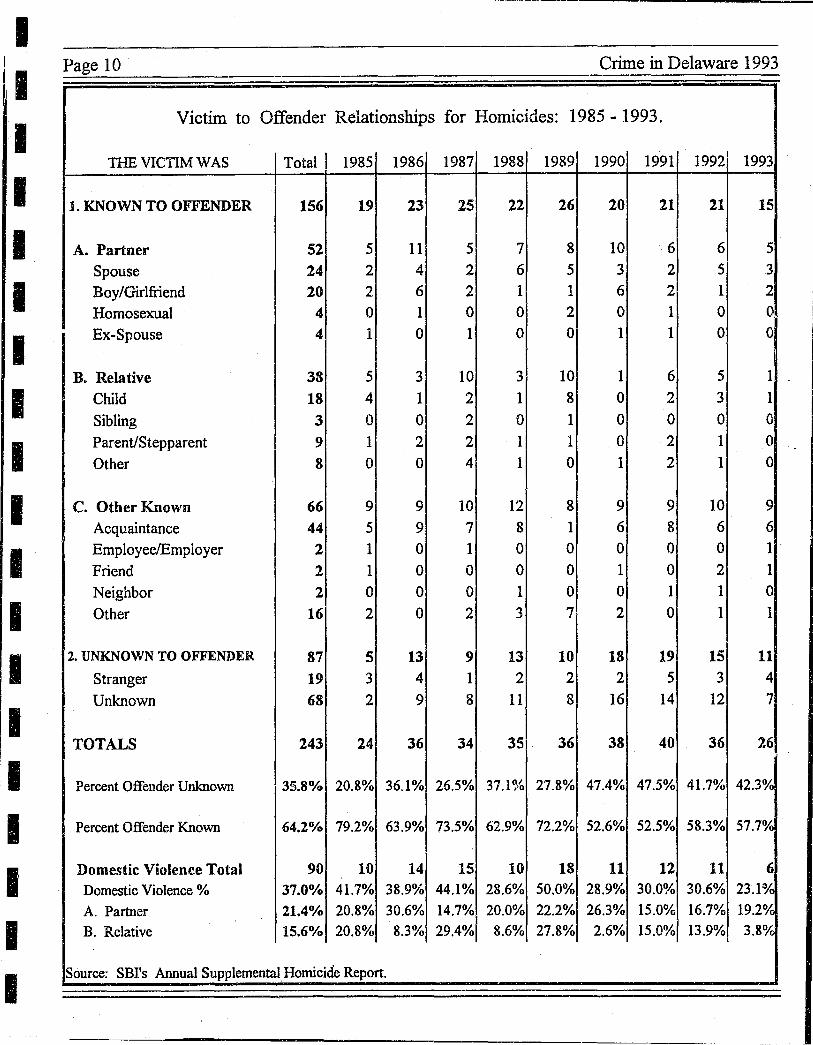
Victim to Offender Relationships for Homicides: 1985 - 1993.
THE VICTIM WAS Total I 1985 1986 1987 1988 1989 1990 1991 1992 1993
1. KNOWN TO OFFENDER 156 19 23 25 22 26 20 21 21 15
A. Partner 52 5 11 5 7 8 10 6 6 5
Spouse 24 2 4 2 6 5 3 2 5 3
Boy/Girlfriend 20 2 6 2 1 1 6 2 1 2
Homosexual 4 0 1 0 0 2 0 1 0 0
Ex-Spouse 4 1 0 1 0 0 1 1 0 0
,
B. Relative 38 5 3 10 3 10 1 6 5 1
Child 18 4 1 2 1 8 0 2 3 1
Sibling 3 0 0 2 0 1 0 0 0 01
Parent/Stepparent 9 1 2 2 1 1 0 2 1 0
Other 8 0 0 4 1 0 1 2 1 0
C. Other Known 66 9 9 10 12 8 9 9 10 9
Acquaintance 44 5 9 7 8 1 6 8 6 6
Employee!Employer 2 1 0 1 0 0 0 0 0 1
Friend 2 1 0 0 0 0 1 0 2 1
Neighbor 2 0 0 0 1 0 0 1 1 0
Other 16 2 0 2 3 7 2 0 1 1
2. UNKNOWN TO OFFENDER 87 5 13 9 13 10 18 19 15 11 Stranger 19 3 4 1 2 2 2 5 3 4
Unknown 68 2 9 8 11 8 16 14 12 7
TOTALS 243 24 36 34 35 36 38 40 36 26
Percent Offender Unknown 35.8% 20.8% 36.1% 26.5% 37.1% 27.8% 47.4% 47.5% 41.7% 42.3'X
Percent Offender Known 64.2% 79.2% 63.9% 73.5% 62.9% 72.2% 52.6% 52.5% 58.3% 57.7%
Domestic Violence Total 90 10 14 15 10 18 11 12 11 6
Domestic Violence % 37.0% 41.7% 38.9% 44.1% 28.6% 50.0% 28.9% 30.0% 30.6% 23.1 o/c A. Partner 21.4% 20.8% 30.6% 14.7% 20.0% 22.2% 26.3% 15.0% 16.7% 19.2%
B. Relative 15.6% 20.8% 8.3% 29.4% 8.6% 27.8% 2.6% 15.0% 13.9% 3.8'X·
Source: SBI's Annual Supplemental Homicide Report.
-~------------------------------.---
----------
I I I I I I I I I I I I I I I I
Page 12 Crime in Delaware 1993
,I
!I i
I
Reported Assaults 1982 - 1993 3500
Offenses
- Sussex EJ Kent ~ New Castle
3000
2500
2000
1500
1000
500
0 1982 1983 1984 1985 1986 1987 1988 1989 1990 1991 1992
NewCastle 1262 1125 1045 1043 910 961 1076 1297 1599 1628 1752 Kent 432 336 293 260 275 273 269 408 489 469 624
Sussex 387 354 346 332 371 328 364 528 715 702 674 Total 2081 1815 1684 1635 1556 1562 1709 2233 2803 2799 3050
1993 Violent Crime: Victim to Offender Relationships
Stranger
Other known 2R ""01 ~v.~ 10
17.3%
Undetermined 41.5%
Partner 9.2%
Relative 5.7%
1993 1945
501 659
3105
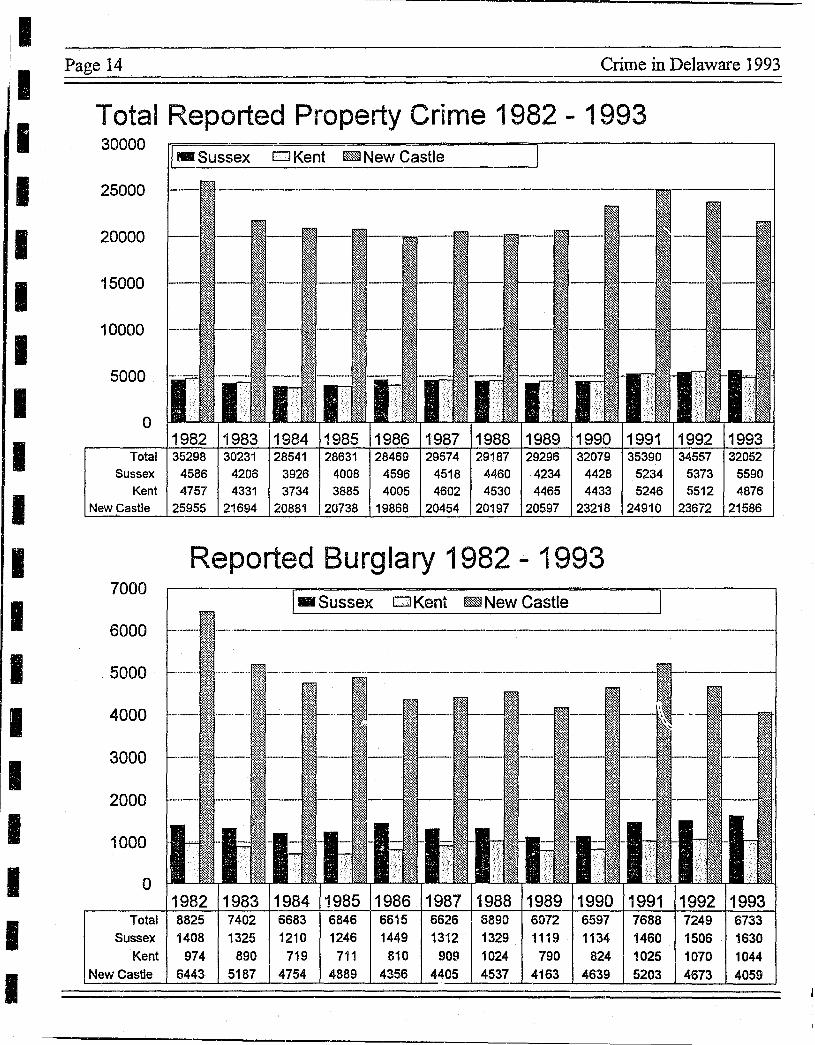
Property Crime in 1993 o roperty crime in Delaware r' decreased in 1993. In
1993, there were 32052 , total property crimes statewide, a 7.8% decrease from 1992, which had 34,557 property crimes. In historical perspective, property crimes in Delaware had been declining since 1982, reaching a low in 1986 of
The 1993 property crime rate per 1000
population was 46.2
28,469 reported offenses, followed by a gradual rise in the number of offenses, peaking in 1991. Since 1992,
property crime has declined to levels roughly equal to the level in 1990.
The 1993 property crime rate per 1,000 population was 46.2, dovm from the 1992 rate of50.6 per 1,000 population.
Among Delaware's counties, New Castle and Kent counties reported decreases in property crimes for 1993, with New Castle County re-
. porting 21,586 offenses, a 9.7% decrease, and Kent County reporting 4,876 offenses, a 13.0% decrease. Sussex County experienced an increase in property crimes, rising from 5,373 in 1992, to 5,590 in 1993. This increase indicates a 3.9% rise in the number of offenses in Sussex County.
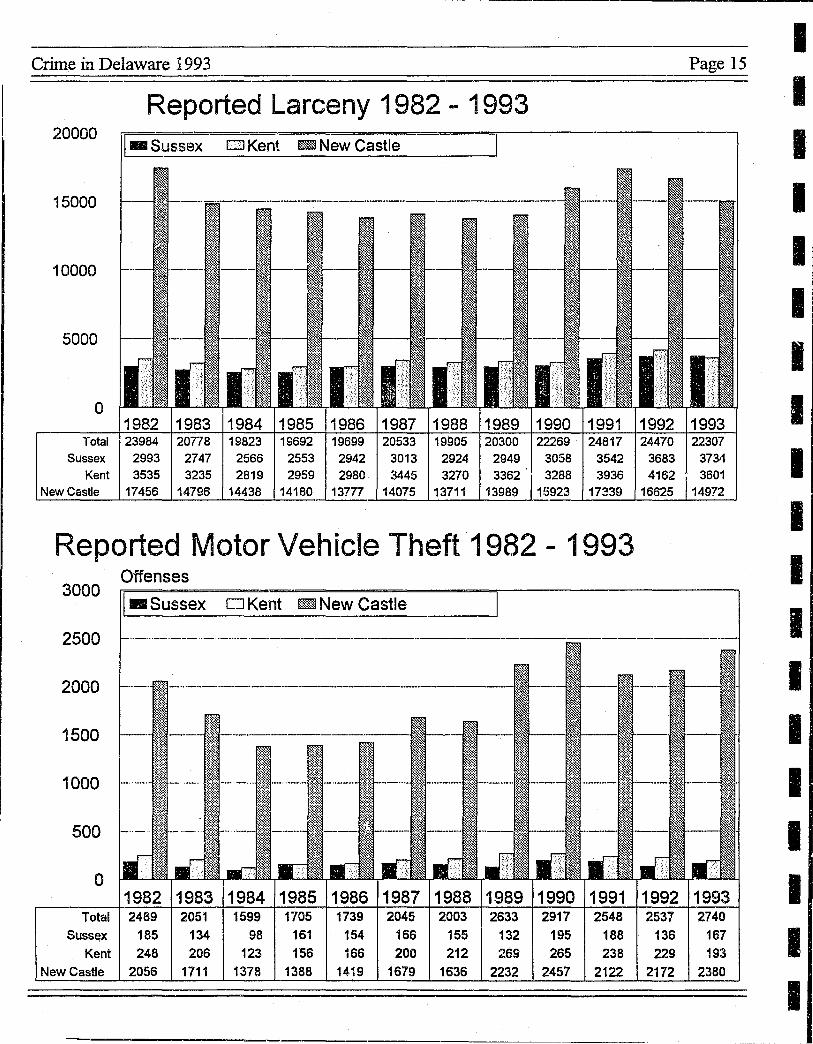
the individual crime categories within property crime all decreased with the exception of motor vehicle theft which rose from 2,537 in 1992, to 2,740 in 1993, a 7.4% increase. Burglary fell from 7,249 in 1992, to 6,733 in 1993 a 7.7% decrease. LarcenY'decreased' from 24,470 in 1992, to 22,307 in 1993, a 9.7% decrease. Reported arsons fell from 301 in 1992, to 272 in 1993, a 10.7% decrease.
In 1993, $30,252,669 worth of property was stolen, $11,444,440 worth of that stolen property was recovered. Of the total amount of stolen property, locally stolen motor vehicles accounted for $12,371,850 or 41% of the total dollar value of property stolen. Robberies accounted for $935,069, or 3% of the total dollar value of property stolen. Burglary accounted for $6,741,501, or 22% of the total dollar value of property stolen. Larceny and theft, excluding motor vehicle theft accounted for $10,201, 789, or 34% of the total dollar value of property stolen. During the commission of homicides, only $45 were stolen. During the commission of rapes, $2,415 were reported stolen.
I I I I I I I I I I I I I I I I I I I
---------------------------------------------------------------------I I I I I I I I I I I I I I I I I I I
Page 14 Crime in Delaware 1993
Total Reported Property Crime 1982 - 1993 30000
_ Sussex 0 Kent mill New Castle
25000
20000
15000
10000
5000
o 1982 1983 1984 1985 1986 1987 1988 1989 1990 1991 1992 1993
Total 35298 30231 28541 28631 28469 29574 29187 29296 32079 35390 34557 32052 Sussex 4586 4206 3926 4008 4596 4518 4460 4234 4428 5234 5373 5590
Kent 4757 4331 3734 3885 4005 4602 4530 4465 4433 5246 5512 4876 New Castle 25955 21694 20881 20738 19868 20454 20197 20597 23218 24910 23672 21586
Reported Burglary 1982 - 1993 7000
.. Sussex 0 Kent mil New Castle
6000
5000
4000
3000
2000
1000
o 1982 1983 1984 1985 1986 1987 1988 1989 1990 1991 1992 1993
Total 8825 Sussex 1408
Kent 974 New Castle 6443
7402 6683 6846 6615 6626 6890 6072 6597 7688 1325 1210 1246 1449 1312 1329 1119 1134 1460
890 719 711 810 909 1024 790 824 1025 5187 4754 4889 4356 4405 4537 4163 4639 5203
~----~----~--~----~--~----~
7249 1506 1070 4673
6733 1630 1044 4059
------------------
Crime in Delaware 1993
Reported Larceny 1982 - 1993 20000
- Sussex E:J Kent mm New Castle
15000
10000
5000
o
Total 23984 20778 19823 19692 19699 19905 20300 22269 24817 24470
Page 15 I I I I I I I I
Sussex 2993 2747 2566 2553 2942 3013 2924 2949 3058 3542 3683 373~ I Kent 3535 3235 2819 2959 2980 3445 3270 3362 3288 3936 4162 3601
New Castle 17456 14796 14438 14180 13777 14075 13711 13989 15923 17339 16625
Reported Motor Vehicle Theft 1982 - 1993 Offenses
3000 .. Sussex 0 Kent Iffi] New Castle
2500
2000
1500
1000
500
o 1982 1983 1984 1985 1986 1987 1988 1989 1990 1991 1992 1993
Total 2489 2051 1599 1705 1739 2045 2003 2633 2917 2548 2537 2740 Sussex 185 134 98 161 154 166 155 132 195 188 136 167
Kent 248 206 123 156 166 200 212 269 265 238 229 193 New Castle 2056 1711 1378 1388 1419 1679 1636 2232 2457 2122 2172 2380
I I I I I I I I I I
I I I I I I I I I I I I I I I I I I ,I
Page 16 Crime in Delaware 1993
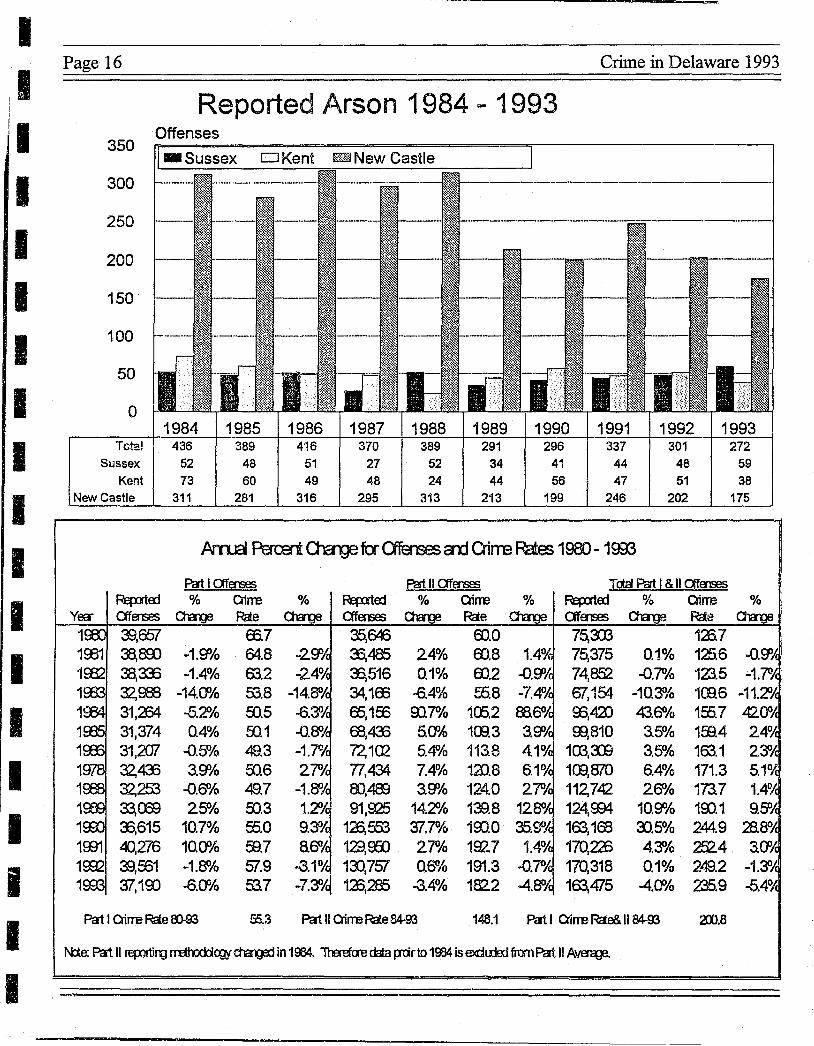
Reported Arson 1984 - 1993 Offenses
350
300
250
200
150
100
50
o 1984 1985 1986 1987 1988 1989 1990 1991 1992 1993
Tota! 436 Sussex 52
Kent 73 New Castle 311
389 48 60
281
Pat I afa-ses % Qirre
39,651 33,800 38,333 32,989 31,264 31,374 31,207 32,433 32,253 ~(E9 33,615 40,276 39,531 '$1,100
Olrrge Rae
fIi7 -1.~1o 64.8 -1.4%
-14.0'10 -5.2f!1o 0.4%
-0.5% 3.~1o
-O.SOIo 25010
10.7% 10.0010 -1.8% -6.0'10
63.2 53.8 50.5 E£l1 t19.3 EO.6 49.7 00.3 55.0 fB.7 51.9 53.7
4'16 51 49
316
%
-2goA -24,*
-14.8% -6.3'* -a.SOA -1.?oA 2~A
-1.SOA 1.2,OA 9.SOA aSOA
-3.1% -7.~A
370 27 48
295
~erl Ofenses 35,00 33,485 35,516 34,1EE 65,1EE a3,433 72,102 71,434 00,483 91,925
125,553 129,900 13),757 123,285
389 52 24
313
291 34 44
213
Pat II Ofenses % Qirre
Rae
00.0 24% 00.8
00.2
%
296 41 56
199
1.4'* -0.9% 0.1%
-6.4% oo.?01o 5.0%
EO. 8 -7.4,* 105.2 a3.e'A 100.3 3.~A
5.4% 113.8 4.1'* 7.4% 120.8 6.1'* 3.~1o 124.0 2?OA
14.2,010 139.8 12SOA =rCf% 100.0 35.9"'A
2?OIo 192.7 1.4'* 0.6% 191.3 -G.PA
-3.4% 1822 -4.8%
337 44 47
246
301 48 51
202
272 59 38
175
Tcta Pat I & II afemes
75,313 75,375 74,852 67,154 95,42) 93,810
103,3)3 100,870 112,742 124,934 163,163 170,223 170,318 163,475
% 0i1113 % Rae 123.7
0.1% 125.6 -O.9'A -0.7% 1215 -1.~k
-10.3010 100.6 -11.21A 43.6% 155.7 42.00A 3.5% 1Ee.4 24'* 3.5% 163.1 23"A 6.4% 171.3 5.10,{ 26% 173. 7 1.4'Yc
10.9% 100.1 9.5OA 3).5% 244.9 2B.SOA
4.3010 252. 4 3. fJ'A 0.1% 249.2 -1.3DA
-4.(1110 235.9 -5.4%
Pat I Qirre Rae 00-93 55.3 Pat II Qirre Rae 84-93 148.1 Pat I Qirre Rae& II 84-93 :;m.B
'f ~
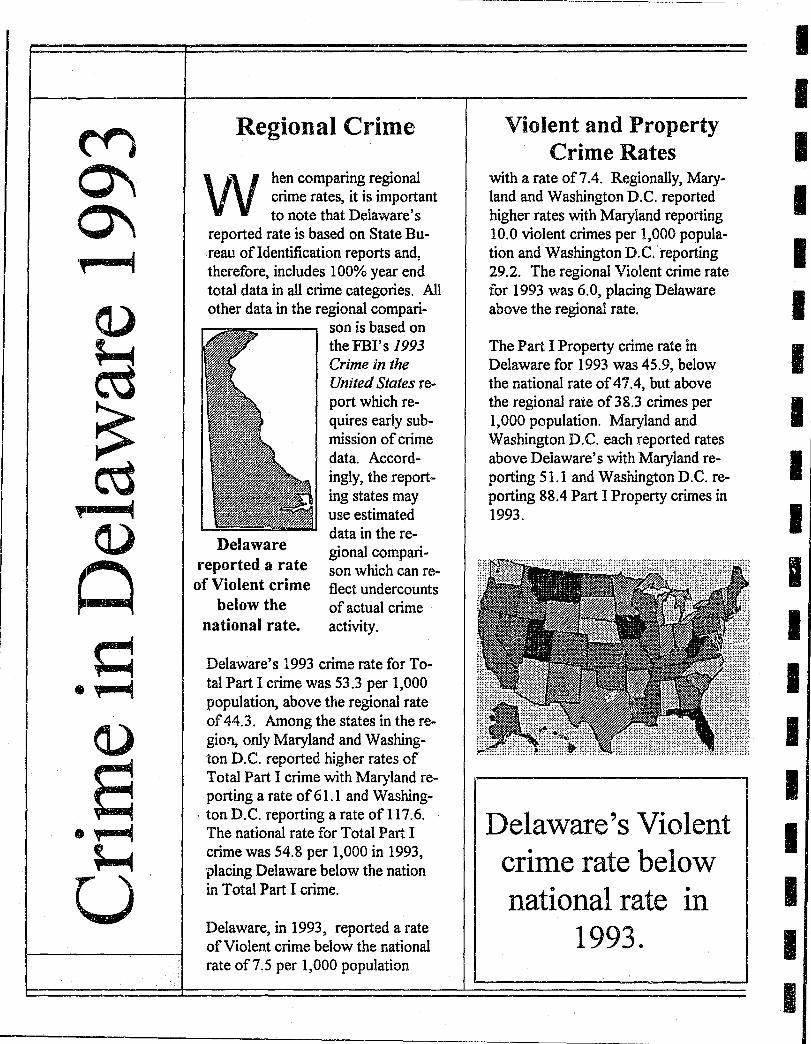
Regional Crime
VV hen comparing regional crime rates, it is important to note that Delaware's
reported rate is based on State Bu-reau ofIdentification reports and, therefore, includes 100% year end total data in all crime categories. All other data in the regional compari
Delaware reported a rate
of Violent crime below the
national rate.
son is based on the FBI's 1993 Crime in the United States report which requires early submission of crime data. Accordingly, the reporting states may use estimated data in the regional comparison which can reflect undercounts of actual crime activity.
Delaware's 1993 crime rate for Total Part I crime was 53.3 per 1,000 population, above the regional rate of 44.3. Among the states in the region, only Maryland and Washington D.C. reported higher rates of Total Part I crime with Maryland reporting a rate of61.1 and Washing-
. ton D.C. reporting a rate of 117.6. The national rate for Total Part I crime was 54.8 per 1,000 in 1993, placing Delaware below the nation in Total Part I crime.
Delaware, in 1993, reported a rate of Violent crime below the national rate of7.5 per 1,000 population
Violent and Property Crime Rates
with a rate of7.4. Regionally, Maryland and Washington D.C. reported higher rates with Maryland reporting 10.0 violent crimes per 1,000 population and Washington D.C. 'reporting 29.2. The regional Violent crime rate for 1993 was 6.0, placing Delaware above the regional rate.
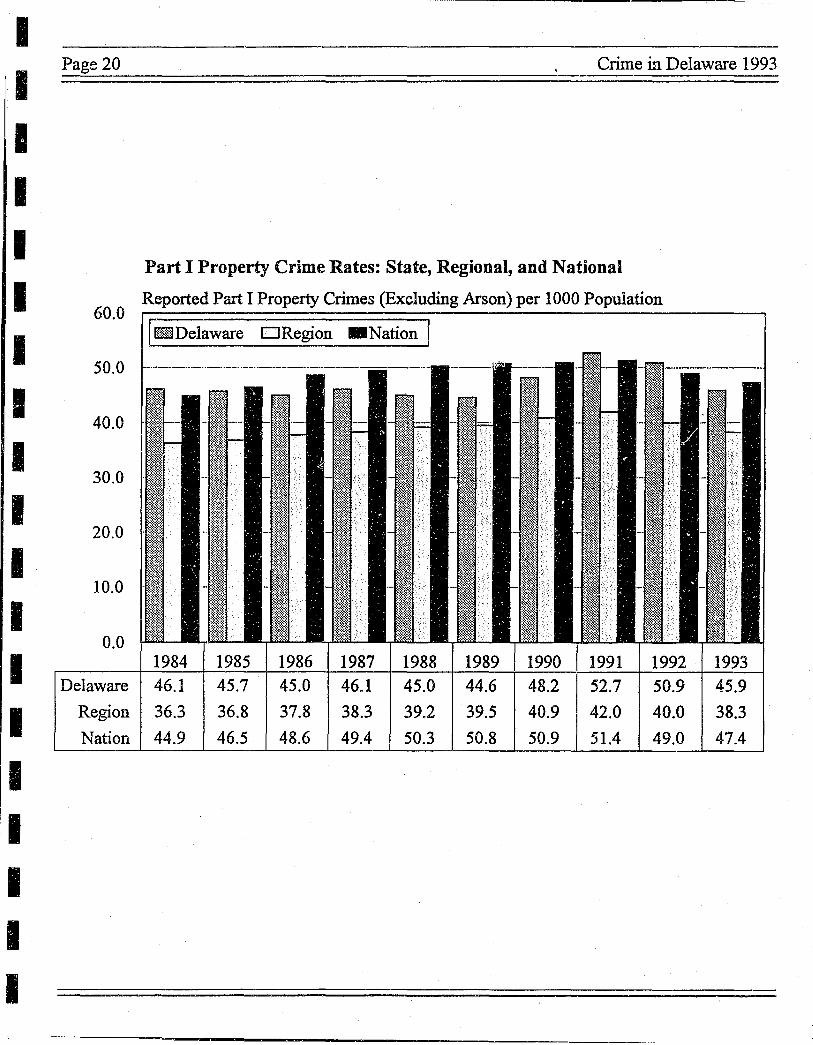
The Part I Property crime rate in Delaware for 1993 was 45.9, below the national rate of 47.4, but above the regional rate of38.3 crimes per 1,000 population. Maryland and Washington D.C. each reported rates above Delaware's with Maryland reporting 51.1 and Washington D.C. reporting 88.4 Part I Property crimes in 1993.
Delaware's Violent crime rate below national rate in
1993.
----~-
I I I I I I I I I I I I I I I I I I I
-~-----.----------------------------------------------------
I I I I I I I I
·1 ·1 I I I I I I I I ,I
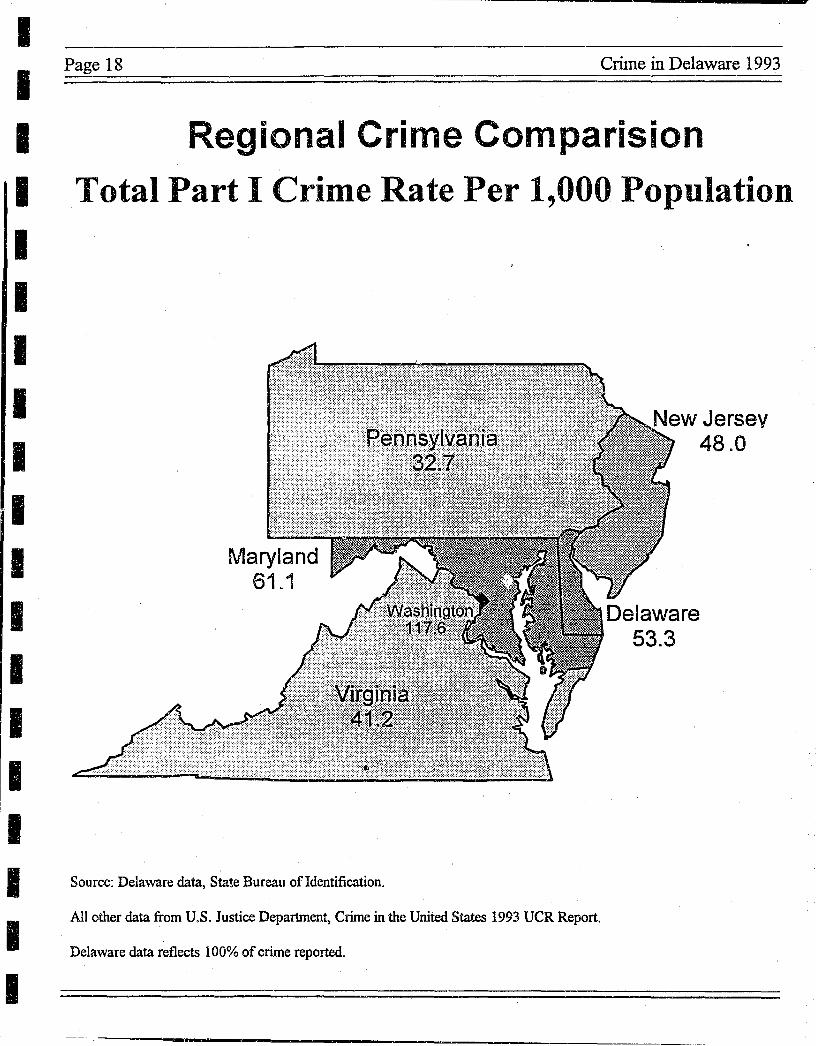
Page 18 Crime in Delaware 1993
Regional Crime Comparision Total Part I Cr·ime Rate Per 1,000 Population
Maryland 61.1
Source: Delaware data, State Bureau of Identification.
All other data from U.S. Justice Department, Crime in the United States 1993 UCR Report.
Delaware data reflects 100% of crime reported.
New Jersev 48.0
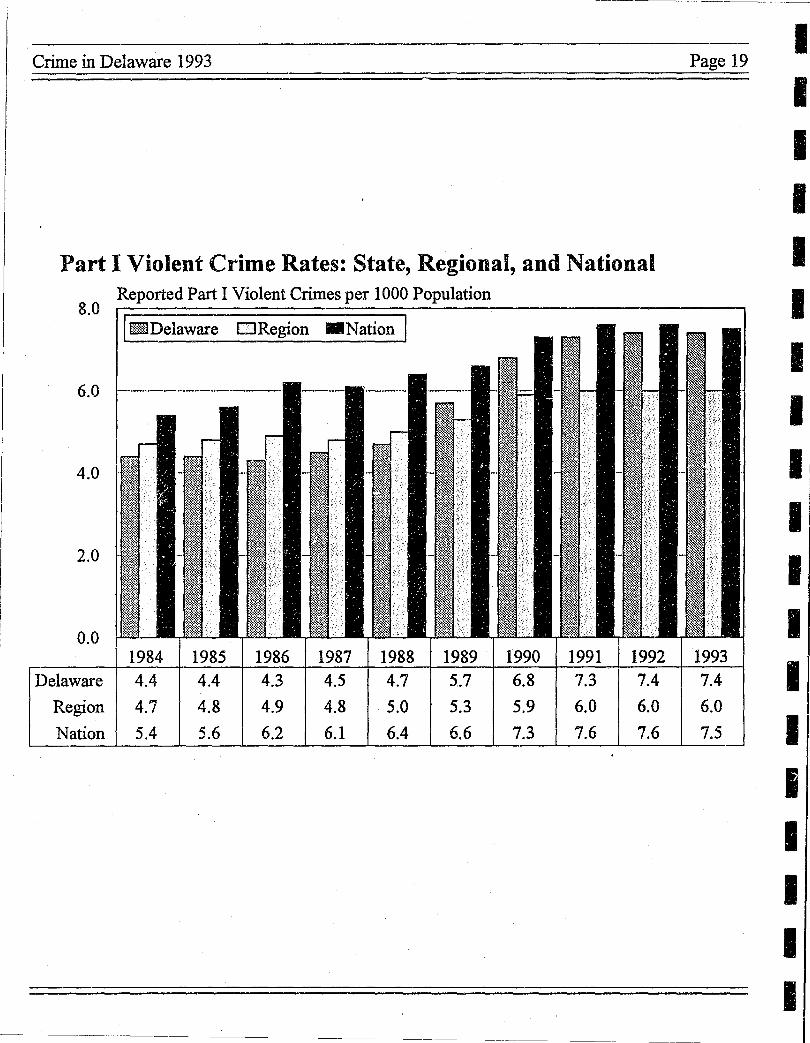
Crime in Delaware 1993
Part I Violent Crime Rates: State, Regional, and National Reported Part I Violent Crimes per 1000 Population
8.0 I mBDelaware DRegion .Nation I
6.0
4.0
2.0
0.0 1984 1985 1986 1987 1988 1989 1990 1991 1992
Delaware 4.4 4.4 4.3 4.5 4.7 5.7 6.8 7.3 7.4 Region 4.7 4.8 4.9 4.8 5.0 5.3 5.9 6.0 6.0
Nation 5.4 5.6 6.2 6.1 6.4 6.6 7.3 7.6 7.6
Page 19
1993 7.4 6.0 7.5
I I I I I I I I I I I I I I I I I I I
I I I I I I I I I I I I I I I I I I I
--~----
Page 20 Crime in Delaware 1993
Part I Property Crime Rates: State, Regional, and National
Reported Part I Property Crimes (Excluding Arson) per 1000 Population 60.0
[ITs Delaware DRegion .Nation I 50.0
40.0
30.0
20.0
10.0
0.0 1984 1985 1986 1987 1988 1989 1990 1991 1992
Delaware 46.1 45.7 45.0 46.1 45.0 44.6 48.2 52.7 50.9
Region 36.3 36.8 37.8 38.3 39.2 39.5 40.9 42.0 40.0
Nation 44.9 46.5 48.6 49.4 50.3 50.8 50.9 51.4 49.0
1993 45.9
38.3
47.4
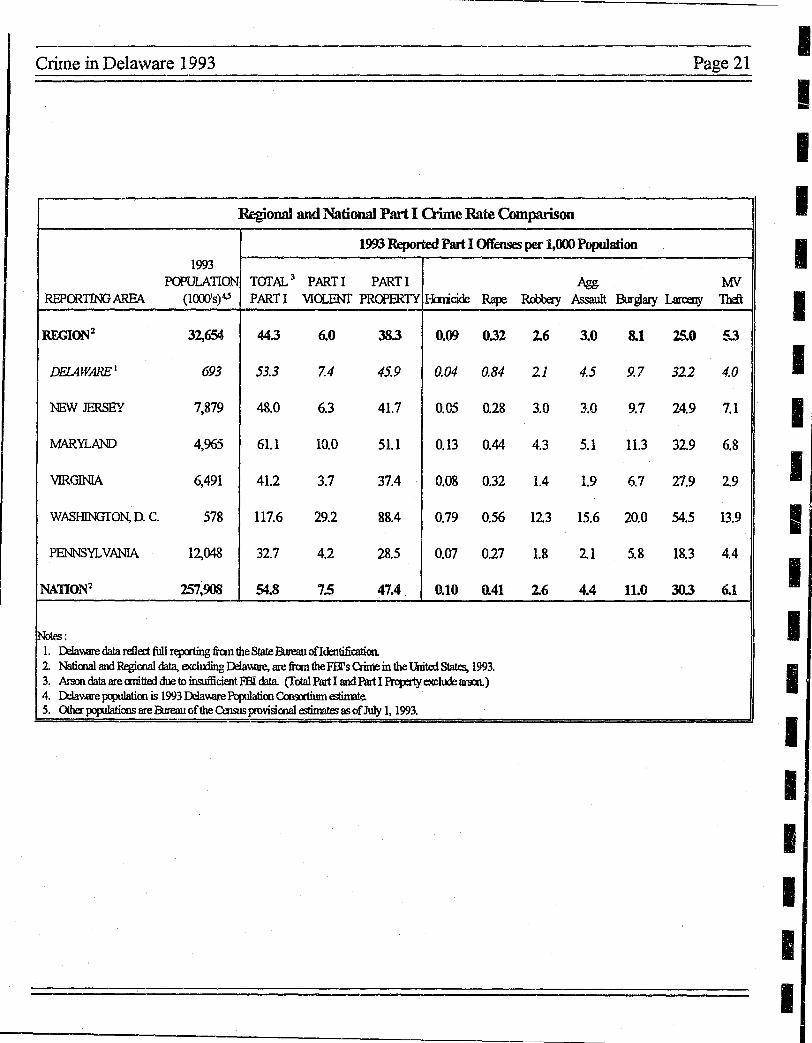
Crime in Delaware 1993 Page 21
Regional and National Part I Gime Rate Comparison
1993 Reported Part I Offen9t'S per 1,00> Population 1993
l'a'ULATIQN TOTAL 3 PART I PART I ~ MY REPCRT1NG AREA (HXX>'s)4.5 PART! VI<LENr PRa>fRTY Ibncide Rape ROOOOy Assault Burglary larcaIy 'I1rft
REGI~2 32,654 44.3 6.0 38.3 0.00 0.32 2.6 3.0 8.1 25.0 5...1
DElAWARE I 693 53.3 7.4 45.9 0.04 0.84 21 4.5 9.7 322 4.0
NEW JERSEY 7,879 48.0 6.3 41.7 0.05 0.28 3.0 10 9.7 24.9 7.1
MARYLAND 4,%5 61.1 10.0 51.1 0.13 0.44 4.3 5.1 11.3 32.9 6.8
VIRGWA 6,491 41.2 3.7 37.4 0.08 0.32 1.4 1.9 6.7 27.9 2.9
WASHINGTON, D. c. 578 117.6 29.2 88.4 0.79 0.56 123 15.6 20.0 54.5 13.9
PENNSYLVANIA 12,04& 32.7 4.2 28.5 0.07 0.27 1.8 21 5.8 18.3 4.4
NATION2 257~ 54.8 7.5 47.4 0.10 0.41 2.6 4.4 11.0 30.3 6.1
!Notes : 1. 1XIav.are data reflect full repating fran the State:B.lreau ofId::ntificatim 2 Naliooal and Regiooal data, e<cl00ing D:Jav.are, are fran the FH's Crime in the Thitfd State>, 1993. 3. Arson data are aniltfd due to insufficient J<'BI Wta. (Total Part I and Part I PrqJerty ca:lud! arscn.) 4. Wav.are pqlUlaticn is 1993 ruav.are PqxJlaticn Coo'Dtimn csfumte. 5. CXher ~cns are B:Ireau of the Cmsus rrovisiooal estiJmtes as of July 1, 1993.
I I I I I I I I I II I I I I I I I I I
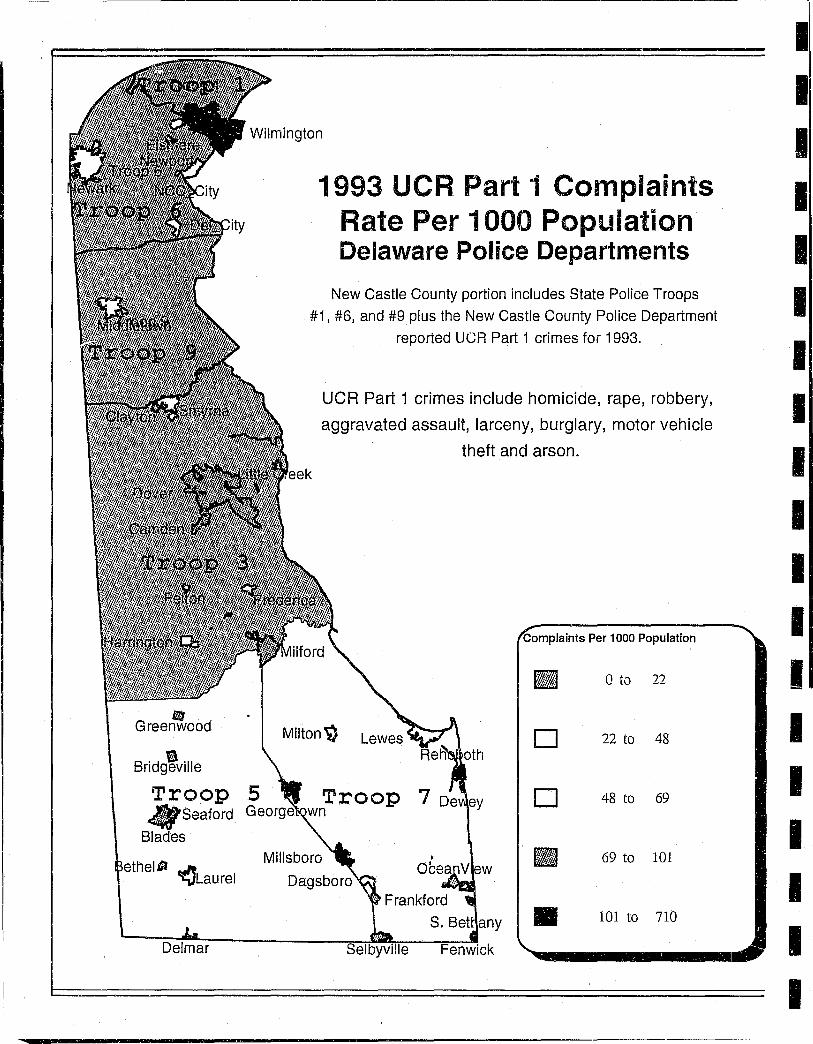
1993 UCR Part 1 Complaints Rate Per 1000 Population Delaware Police Departments
New Castle County portion includes State Police Troops
#1, #6, and #9 plus the New Castle County Police Department
reported UCR Part 1 crimes for 1993.
UCR Part 1 crimes include homicide, rape, robbery,
aggravated assault, larceny, burglary, motor vehicle
theft and arson.
I I I I I I I I I I I I I I I I I I I
I I I I I I I I I I I I I I I I I I I
Page 24
Camd
Troop 3
FeWon
arrington Cb
III Greenwood
,.
Bridg'€ville
Troop 5 _seaford G
Blades
ethelGl ..It ~Laurel
Delmar
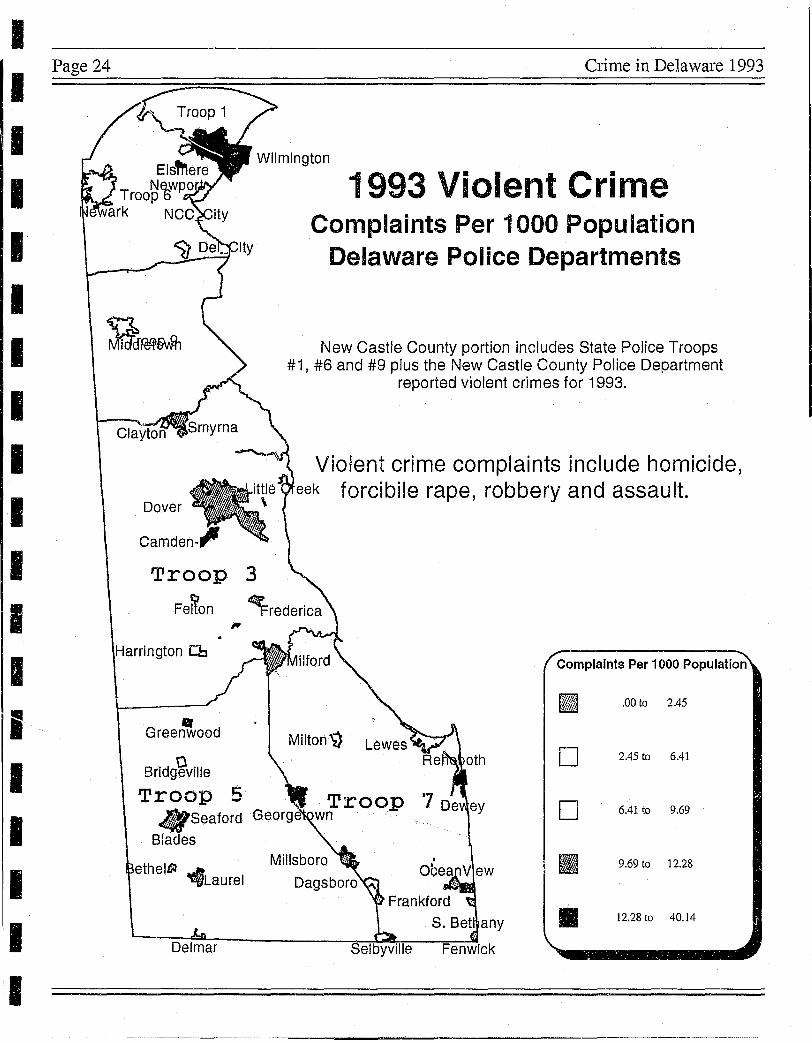
Crime in Delaware 1993
1993 Violent Crime Complaints Per 1000 Population
Delaware Police Departments
New Castle County portion includes State Police Troops #1, #6 and #9 plus the New Castle County Police Department
reported violent crimes for 1993.
Violent crime complaints include homicide, k forcibile rape, robbery and assault.
Complaints Per 1000 Population
.00 to 2.45
2.45 to 6.41 Milton~
D
D 6.41 to 9.69
Millsboro 9.69 to 12.28
• 12.28 to 40.14

I I I I I :1
I I I II I I I I I I I I I
---Page 26 Crime in Delaware 1993
Delaware's Homicide Rate, the lowest in the Region, is Among the
Lowest in the Nation for 1993.
~ ____ r_. ___ ---'
~ Juvenile Crime
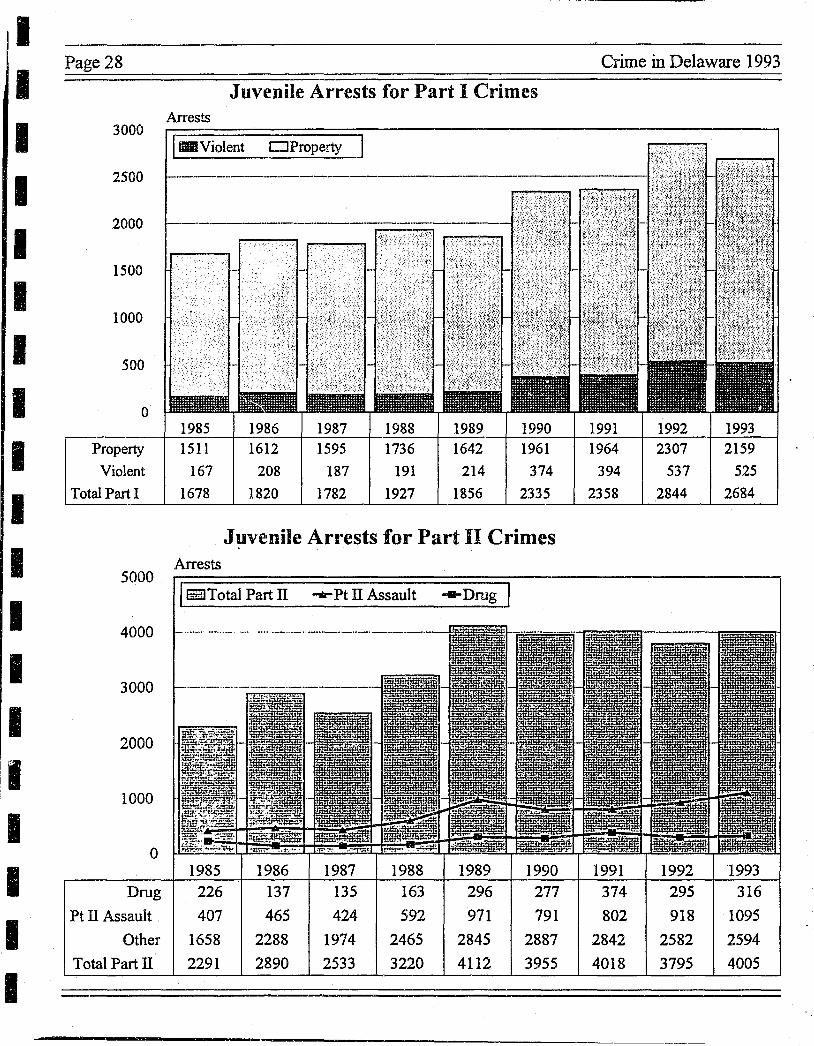
0\ Juvenile arrests for Part I crimes decreased slightly
0\ from 1992 to 1993, after increasing sharply from late 1980's
r ~ levels. There were 2,684 juvenile Part I arrests in 1993, compared to 2,844 in 1992 (down 5.6 percent).
Q.) The small decline in 1993, which followed several years of increases,
Ea leaves juvenile Part I arrests 39.3 percent higher than in 1988.
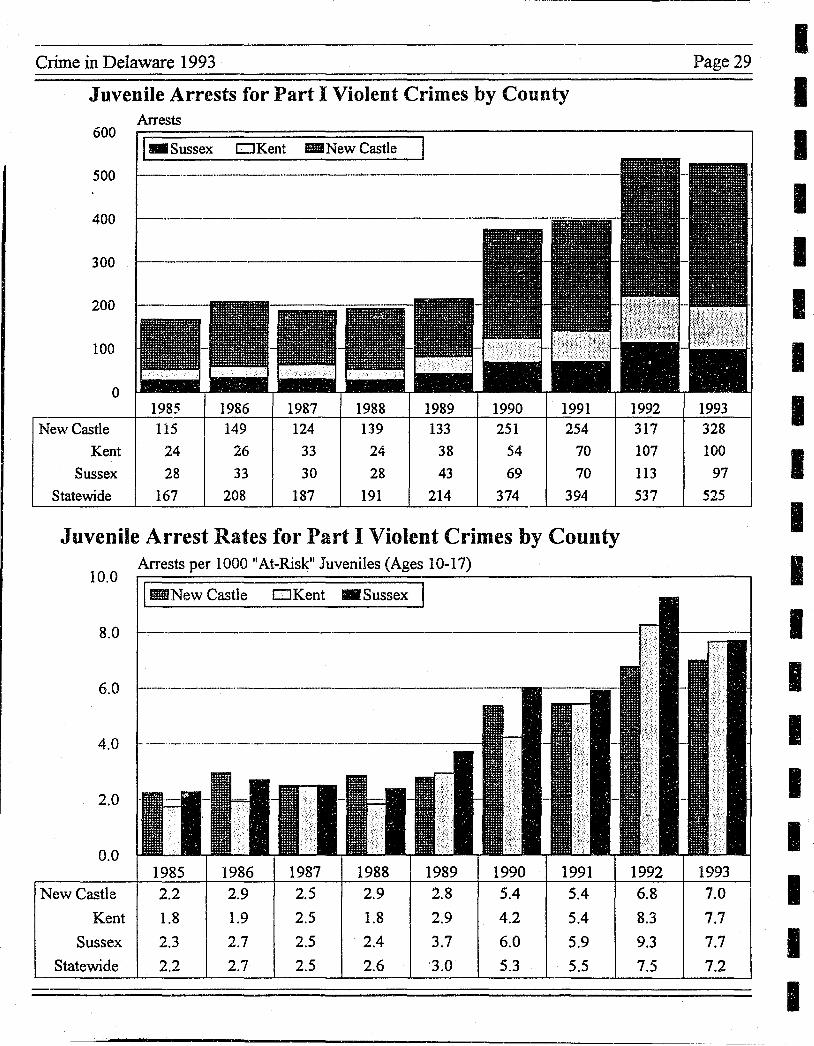
~ Juvenile arrests for There were:
Part I violent 525 juve-crimes have more niles ar-
than doubled in the rested for last fIVe years Part I vio-
f ~ lent crimes,
Q.) down 2.2 percent from 537 in 1992. Declines
Q in robbery and aggravated assault arrests were offset by a 22.8 percent increase in rape arrests. Juvenile ar-rests for Part I violent crimes have
~ more than doubled in the last five years,
.~
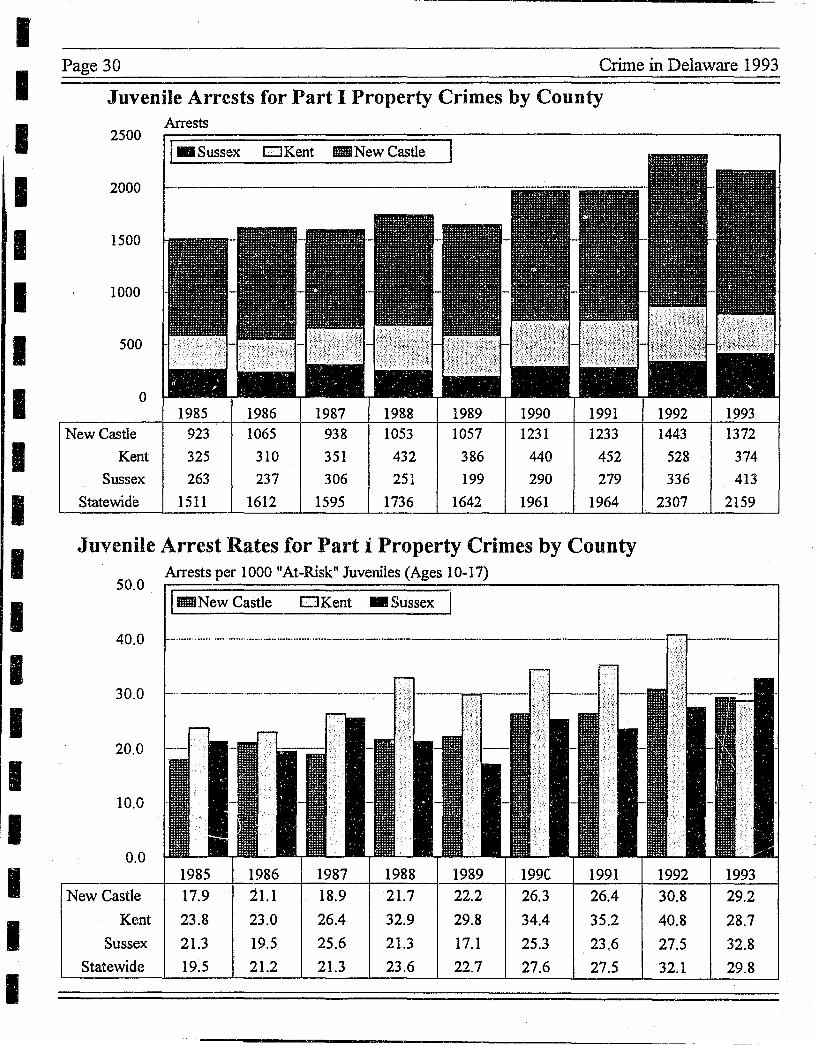
A 6.4 percent decline in 1993 arrests
(1) of juveniles for Part I property crimes also follows several years of
S increases. At 2,159, juvenile Part I property arrests in 1993 were 24.4
. percent higher than in 1988. .~
~
U
L
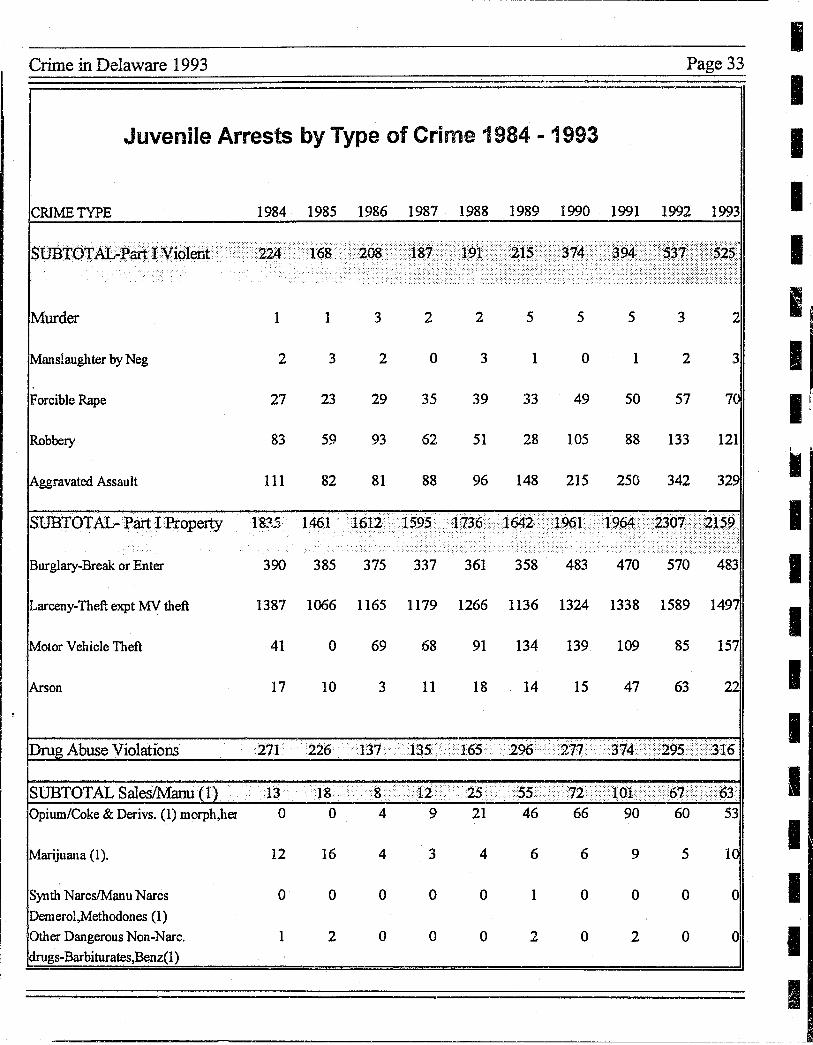
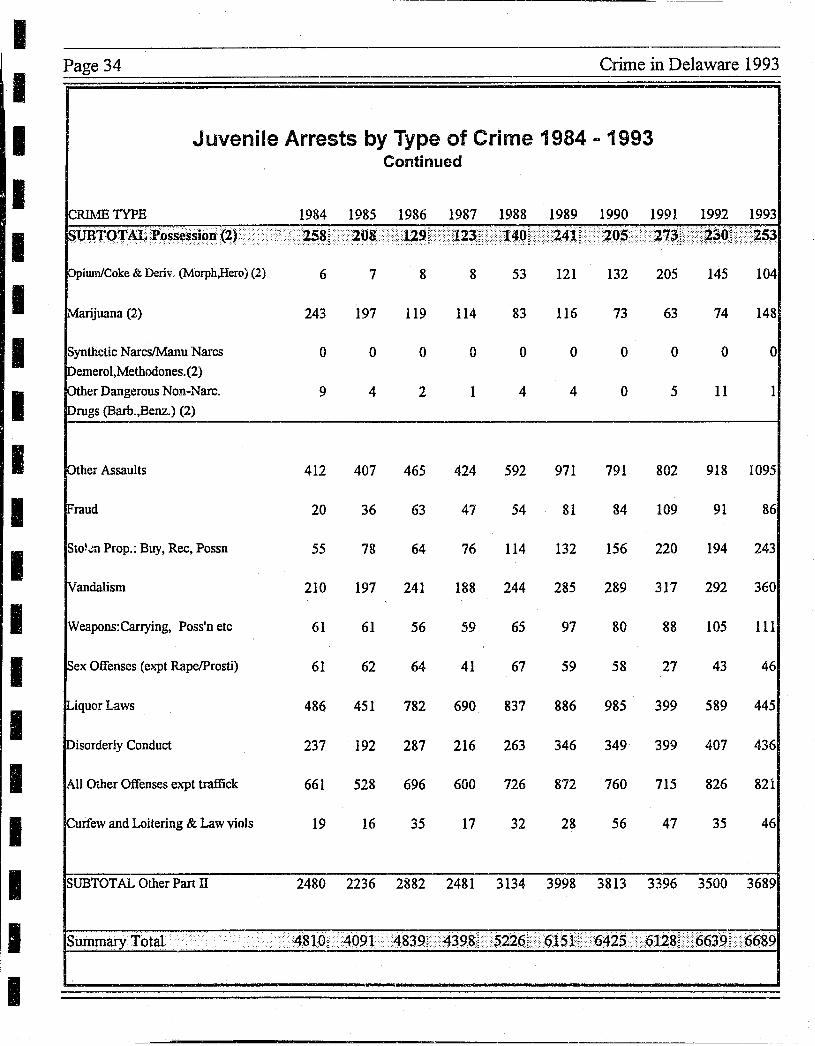
Juvenile Drug Offenses and Other Part II Crimes In 1993 there were 316 juveniles ar-rested for drug offenses, up from 295 in 1992. While lower than the 1991 peak of374 juvenile drug arrests, the 1993 figure was nearly double that of 1988. Juvenile arrests for drug sales remained down from their 1991 peak, but possession arrests rose 10 percent from 1992 to 1993. A 100 percent m-crease in marijuana possession arrests of juveniles more than offset declines in arrests for possession of other drugs.
Juvenile arrests for other Part n crimes increased 5.4 percent in 1993. Significant increases occurred in three categories: Part n assaults; buying, re-ceiving, or possessing stolen property; and vandalism. 1993 juvenile arrests in those three categories were 20.9 percent higher than in 1992 and 78.7
A 100 percent • • Increase In
•• marijUana possession arrests of juveniles more than
offset declines in arrests for
possession of other drugs. I
I I I I I I I I I I I I I I
I" I I I I
I I I I I I I I I I I I I I I I I
II I II
Page 28
3000
2500
2000
1500
1000
500
o
Property
Violent
Total Part!
5000
4000
3000
2000
1000
o
Drug
Pt II Assault
Other
Total Part II
Juvenile Arrests for Part I Crimes Arrests
I_Violent DProperty
1985 1511
167 1678
Arrests
1986 1612
208 1820
1987 1595
187 1782
1988 1736
191 1927
1989 1642
214 1856
1990 1961
374 2335
Juvenile Arrests for Part II Crimes
I E:iElTotaI Part II -r Pt n Assault ... Drug]
1985 226 407
1658
2291
1986 137
465 2288 2890
1987 135 424
1974
2533
1988 163 592
2465 3220
1989 296 971
2845 4112
1990 277 791
2887 3955
Crime in Delaware 1993
1991 1992 1993 1964 2307 2159
394 537 525 2358 2844 2684
1991 1992 1993 374 295 316 802 918 1095
2842 2582 2594 4018 3795 4005
I I I I I I I I I I I I I I I I I I II
Page 30 Crime in Delaware 1993
Juvenile Arrests for Part I Property Crimes by County Arrests
2500 1_ Sussex I2JKent _New Castle
2000
1500
1000
500
o 1985
New Castle 923
Kent 325
Sussex 263
State~de 1511
1986 1065
310
237
1612
1987 938
351
306
1595
1988 1053
432
251
1736
1989 1057
386
199
1642
1990 1231
440
290
1961
1991 1233
452
279
1964
Juvenile Arrest Rates for Part i Property Crimes by County
50.0 Arrests per 1000 "At-Risk" Juveniles (Ages 10-17)
[_New Castle o Kent _ Sussex
40.0
30.0
20.0
10.0
0.0 1985
New Castle 17.9
Kemt 23.8
Sussex 21.3
Statewide 19.5
1986 21.1
23.0
19.5
21.2
1987 18.9
26.4
25.6
21.3
1988
21.7
32.9
21.3
23.6
1989 22.2
29.8
17.1
22.7
199G 26.3
34.4
25.3
27.6
1991 26.4
35.2
23.6
27.5
1992 1443
528
336
2307
1992 30.8
40.8
27.5
32.1
1993 1372
374
413
2159
1993
29.2
28.7
32.8
29.8
Crime in Delaware 1993
5000
4000
3000
2000
1000
0
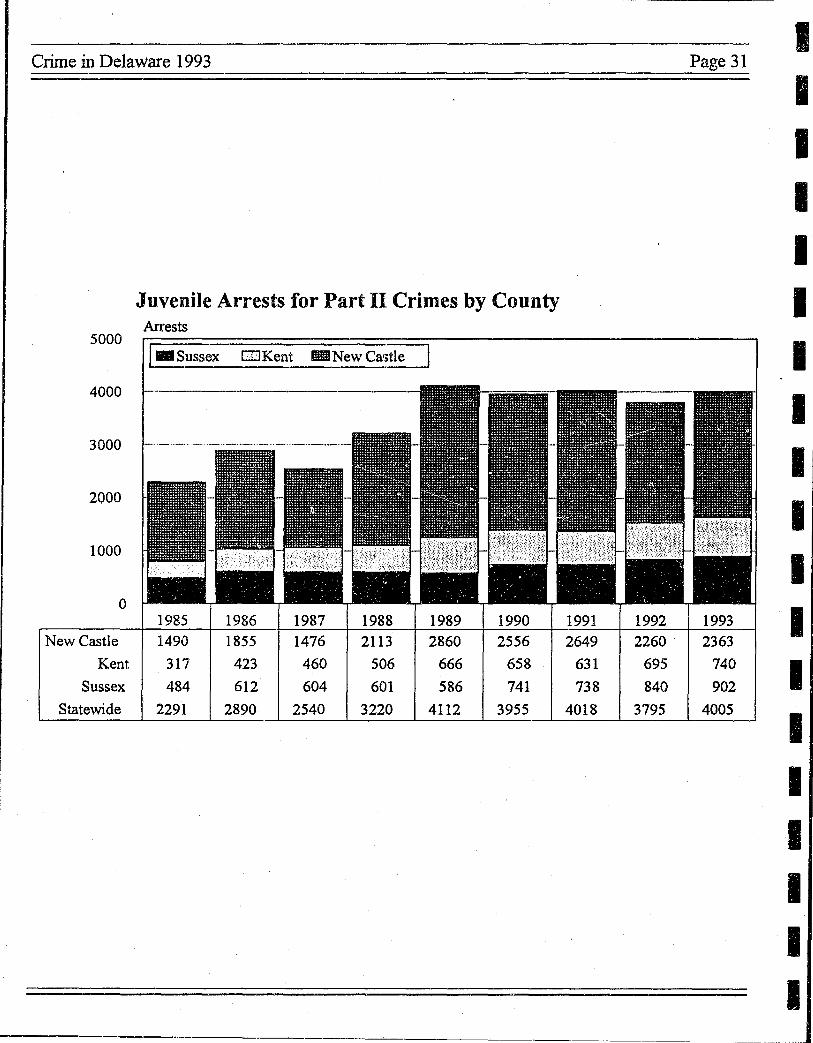
New Castle
Kent
Sussex
Statewide
Juvenile Arrests for Part II Crimes by County Arrests
[_Sussex o Kent -NewCa:~
1985 1986 1987 1988 1989 1990 1490 1855 1476 2113 2860 2556
317 423 460 506 666 658 484 612 604 601 586 741
2291 2890 2540 3220 4112 3955
1991 1992 2649 2260
631 695 738 840
4018 3795
Page 31
1993 2363
740 902
4005
I I I I I I I I I I I I I I I I I I I
I I. I I I I I I I I I I I I I I I I I
Page 32 Crime in Delaware 1993
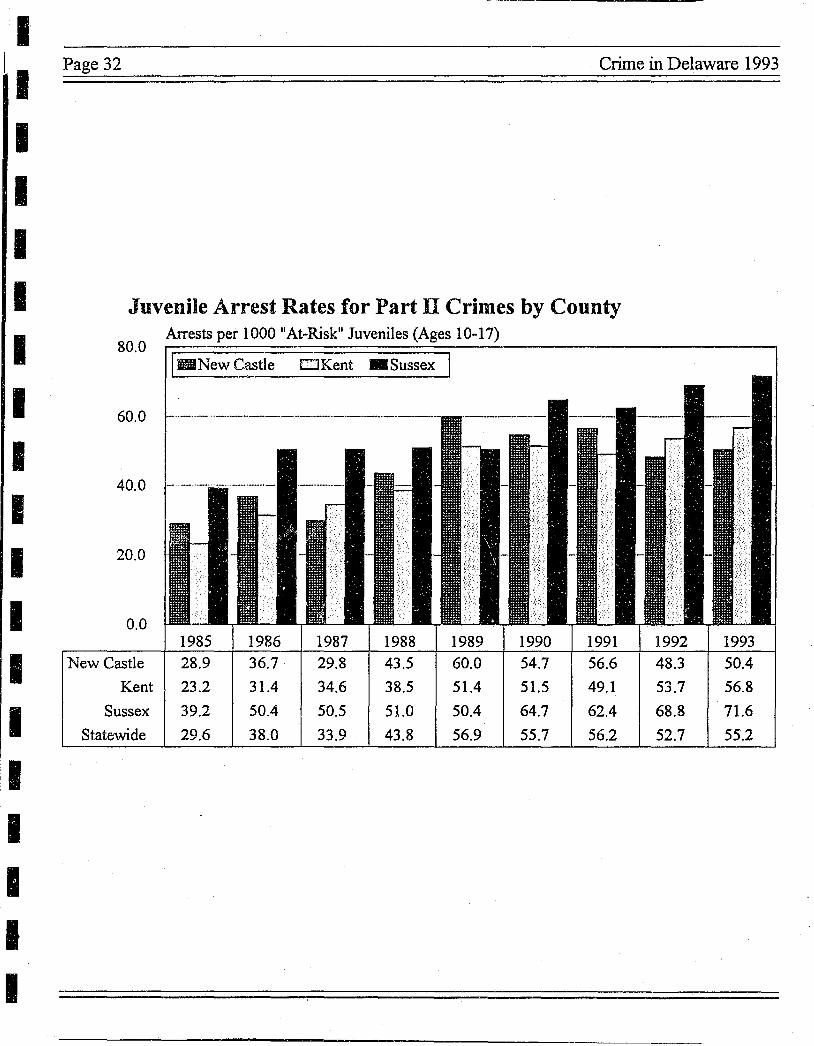
Juvenile Arrest Rates for Part n Crimes by County
80.0 Arrests per 1000 "At-Risk" Juveniles (Ages 10-17)
~New Castle DKent. Sussex
40.0
20.0
0.0 1985 1986 1987 1988 1989 1990 1991 1992 1993
New Castle 28.9 36.7 29.8 43.5 60.0 54.7 56.6 48.3 50.4
Kent 23.2 31.4 34.6 38.5 51.4 51.5 49.1 53.7 56.8
Sussex 39.2 50.4 50.5 51.0 50.4 64.7 62.4 68.8 71.6
Statewide 29.6 38.0 33.9 43.8 56.9 55.7 56.2 52.7 55.2
I I I I I I I I I I I I I I I I I I I
Page 34 Crime in Delaware 1993
Juvenile Arrests by Type of Crime 1984 .. 1993 Continued
CRIME TYPE 1984 1985 1986 1987 1988 1989 1990 1991 1992 1993 SuilT01.\W'~ssessi~)Ji(~r,> .· •.• ·i: ••. · .• ·.+S.~j:2Q&.>~9j:·;J~~j·J4Q~i( .'.·~4tL205· ••..... :71~E.·::~~qj ••. ~.~
PPilunlCoke & Deriv. (Morph,Hero) (2) 6 7 8 8 53 121 132 205 145 104
!Marijuana (2) 243 197 119 114 83 116 73 63 74 148
Synthetic NarcslManu Narcs 0 0 0 0 0 0 0 0 0 0 Demerol,Methodones.(2) Other Dangerous Non-Narc. 9 4 2 1 4 4 0 5 11 Drugs (Barb.,Benz.) (2)
Other Assaults 412 407 465 424 592 971 791 802 918 1095
Fraud 20 36 63 47 54 81 84 109 91 86
Sto!..m Prop.: Buy, Rec, Possn 55 78 64 76 114 132 156 220 194 243
Vandalism 210 197 241 188 244 285 289 317 292 360
Weapons: Canying, Poss'n etc 61 61 56 59 65 97 80 88 105 111
Sex Offenses (exl't RapelProsti) 61 62 64 41 67 59 58 27 43 46
lLiquor L.aws 486 451 782 690 837 886 985 399 589 445
Disorderly Conduct 237 192 287 216 263 346 349 399 407 436
iAIl Other Offenses expt traffick 661 528 696 600 726 872 760 715 826 821
~urfew and Loitering & Law viols 19 16 35 17 32 28 56 47 35 46
SUBTOTAL Other Part II 2480 2236 2882 2481 3134 3998 3813 3396 3500 3689
Summary Total ......
L.tUne in Delaware 1993
60000
57500
55000
52500
50000
47500
45000
42500
40000
37500
35000
32500
30000
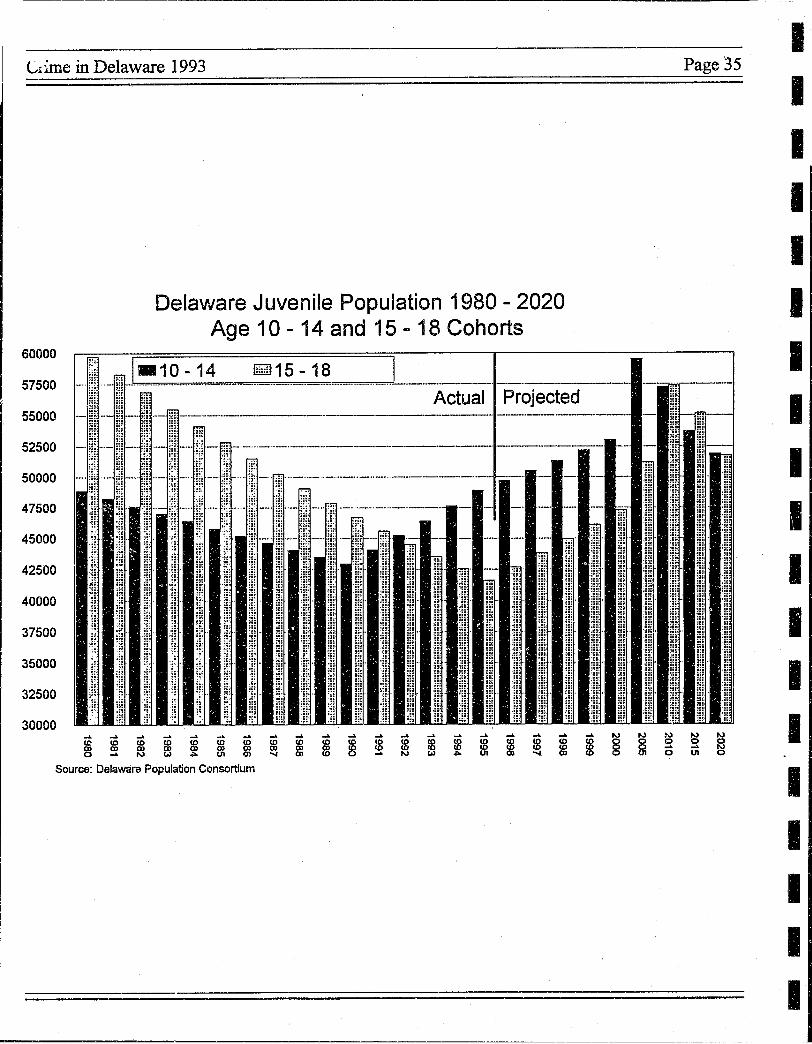
Delaware Juvenile Population 1980 - 2020 Age 10 - 14 and 15 - 18 Cohorts
91 5 - 1 8 Actual Projected
Source: Delaware Population Consortium
Page 35 I I I I I I I I I I I I I I I I I I I

I ,I
I I I I I I I I I I I I I I I II I
---._----------------------------
Page 36 Crime in Delaware 1993
Juvenile Population, Delaware Counties Juveniles
1987 - 2020 (Projected) 160000
IZII Sussex mffil Kent .. New Castle Projected
140000
120000
100000
80000
60000
40000
20000
0 1987 1988 1989 1990 1991 1992 1993 1995 2000 2010 2020
Total 187331 186936 186598 186~121 188322 190443 192679 197515 211706 215620 208973 Sussex 29982 29971 29969 295;77 30696 31435 32197 33789 36207 37176 37585
Kent 34204 34195 34190 34~192 34650 35133 35639 36726 39876 41046 41045 NewCastle 123145 122770 122439 1221152 122976 123875 124843 127000 135623 137398 130343
f ~
Arrests & Clearances
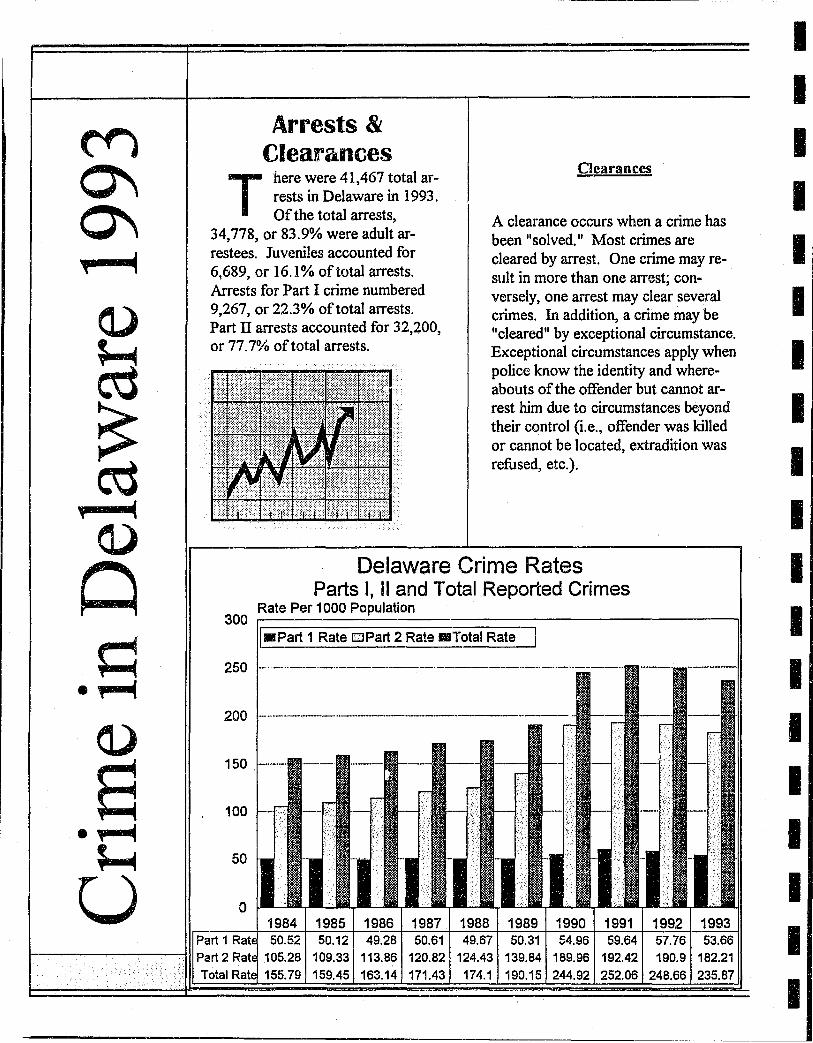
There were 41,467 total arrests in Delaware in 1993. Of the total arrests,
34778 or 83.9% were adult ar-, , restees. Juveniles accounted for 6689 or 16.1% oftotal arrests. , , Arrests for Part I crime numbered 9267 or 22.3% of total arrests. . , Part II arrests accounted for 32,200, or 77.7% of total arrests.
Clearances
A clearance occurs when a crime has been "solved. II Most crimes are cleared by arrest. One crime may result in more than one arrest; conversely, one arrest may clear several crimes. In addition, a crime may be "cleared" by exceptional circumstance. Exceptional circumstances apply when police know the identity and whereabouts of the offender but cannot arrest him due to circumstances beyond their control (i.e., offender was killed or cannot be located, extradition was refused, etc.).
Delaware Crime Rates Parts I, II and Total Reported Crimes
Rate Per 1000 Population 300 ~~~~~~~~~~------II
250
200 1 __ .. __ 0" ______ • _______________ _
150
100
50
0 1984 1985 1986 1987 1988 1989 1990 1991 1992 1993 50.52 50.12 49.28 50.61 49.67 50.31 54.96 59.64 57.76 53.66
105.28 109.33 113.86 120.82 124.43 139.84 189.96 192.42 190.9 182.21 155.79 159.45 163.14 171.43 174.1 190.15 244.92 252.06 248.66 235.87
I I I I I I I I I I I I I I I I I I I
I I I I I I I I I I I I I I I I I I I
Page 38 Crime in Delaware 1993
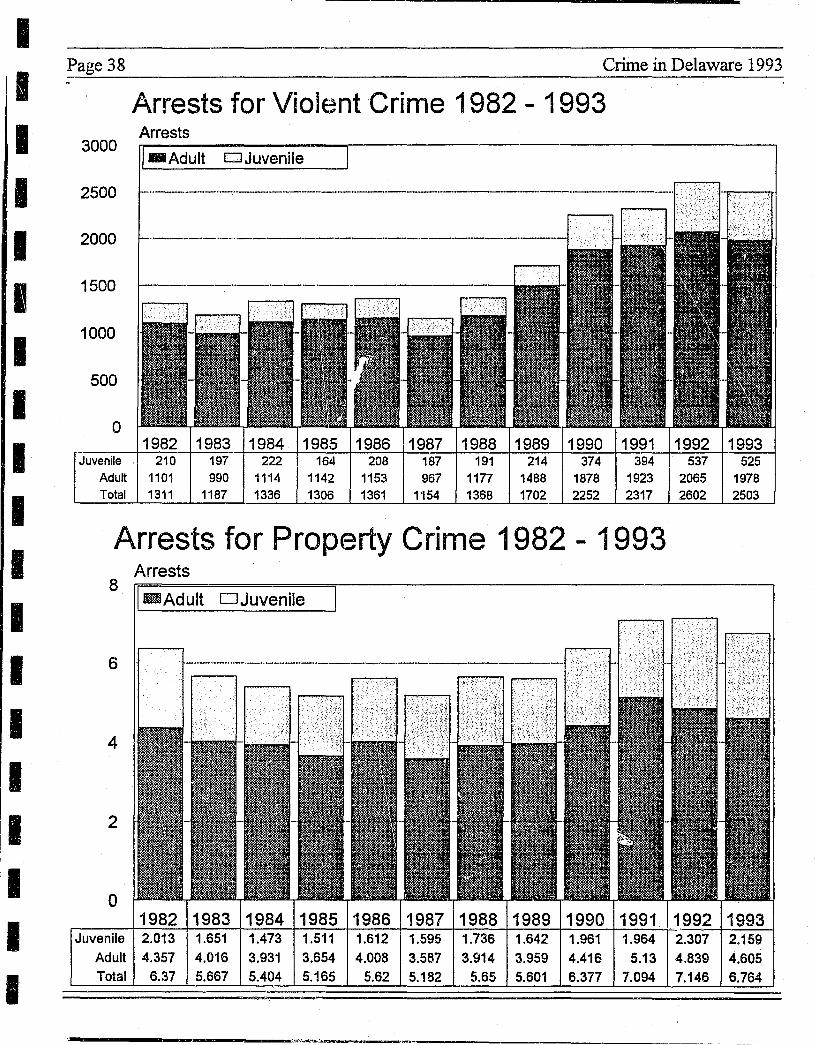
Arrests for Violent Crime 1982 - 1993 Arrests
3000 -Adult DJuvenile
2500
2000
1500
1000
500
o Juvenile 210 197 222 164 208 187 191 374 394
Adult 1101 990 1114 1142 1153 967 1177 1488 1878 1923 Total 1311 1187 1336 1306 1361 1154 1368 1702 2252 2317
Arrests for Propterty Crime 1982 - 1993 Arrests
8 -Adult DJuvenile
6
4
2
2602
525 1978 2503
Crime in Delaware 1993
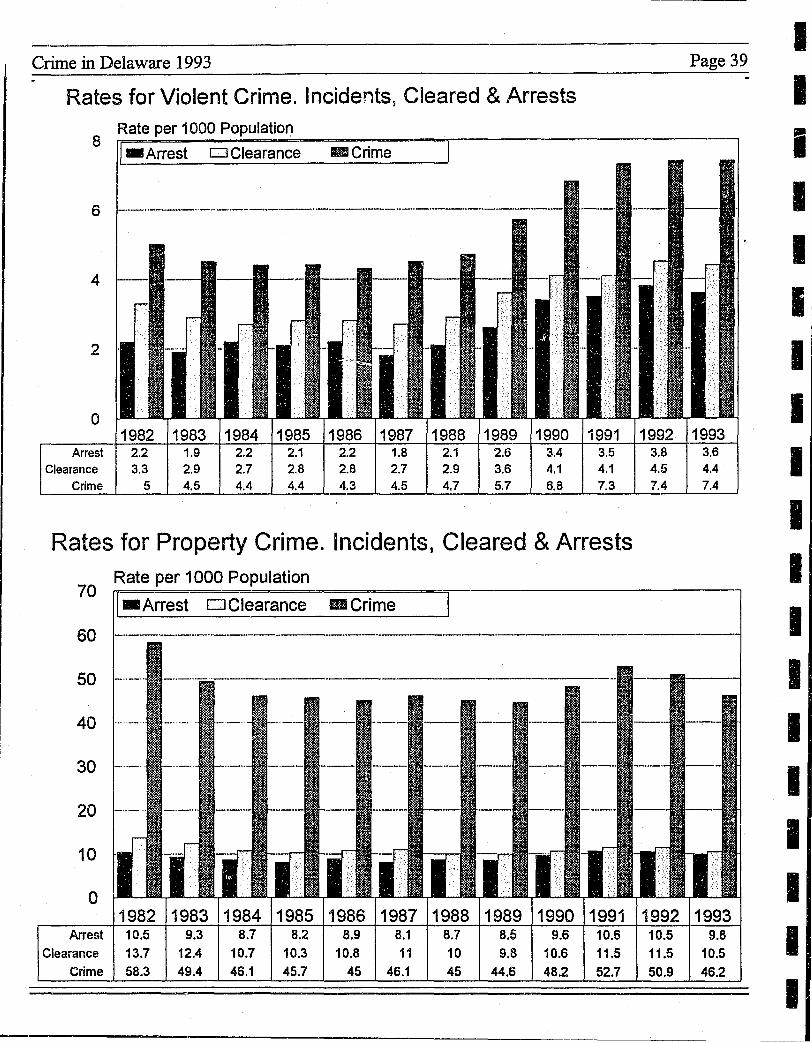
Rates for Violent Crime. Incidents, Cleared & Arrests
Rate per 1000 Population 8
_ Arrest 0 Clearance
6
4
2
a Arrest 2.2
Clearance 3.3 Crime 5
1.9 2.9 4.5
2.2 2.7 4.4
2.1 2.8 4.4
-Crime
2.2 2.8 4.3
1.8 2.7 4.5
2.1 2.9 4.7
2.6 3.6 5.7
3.4 4.1 6.8
3.5 4.1 7.3
Rates for Property Crime. incidents, Cleared & Arrests Rate per 1000 Population
70 -Arrest DClearance -Crime
60
50
40
30
20
10
a
3.8 4.5 7.4
Page 39
3.6 4.4 7.4
1982 1983 1984 1985 1986 1987 1988 1989 1990 1991 1992 1993 Arrest 10.5 9.3 8.7 8.2 8.9 8.1 8.7 8.5 9.6 10.S 10.5 9.8
Clearance 13.7 12.4 10.7 10.3 10.8 11 10 9.8 10.6 11.5 11.5 10.5 Crime 58.3 49.4 46.1 45.7 45 46.1 45 44.S 48.2 52.7 50.9 46.2
I I I I I I I I I I I I I I I I I I I
I 'I I I I I I I I I I I I I I I I I I
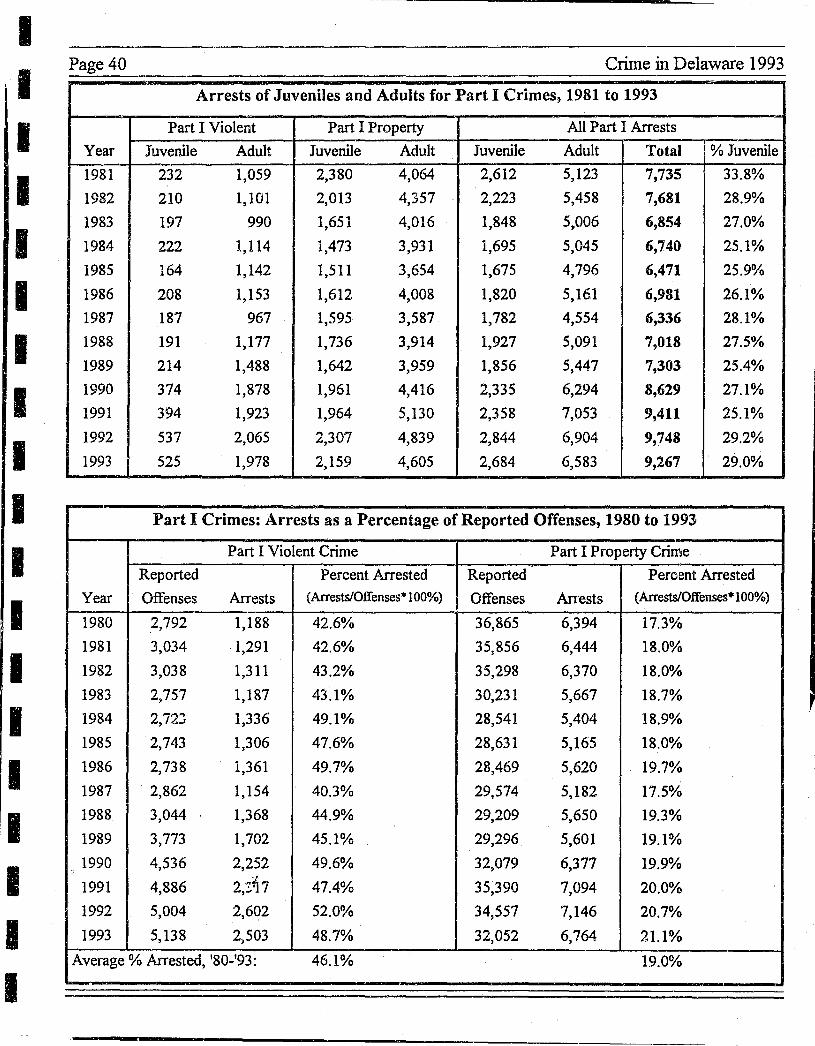
Page 40 Crime in Delaware 1993
Arrests of Juveniles and Adults for Part I Crimes, 1981 to 1993
Part I Violent Part I Property All Part I Arrests
Year Juvenile Adult Juvenile Adult Juvenile Adult Total % Juvenile
1981 232 1,059 2,380 4,064 2,612 5,123 7,735 33.8%
1982 210 1,101 2,013 4,357 2,223 5,458 7,681 28.9%
1983 197 990 1,651 4,016 1,848 5,006 6,854 27.0%
1984 222 1,114 1,473 3,931 1,695 5,045 6,740 25.1%
1985 164 1,142 1,511 3,654 1,675 4,796 6,471 25.9%
1986 208 1,153 1,612 4,008 1,820 5,161 6,981 26.1%
1987 187 967 1,595 3,587 1,782 4,554 6,336 28.1%
1988 191 1,177 1,736 3,914 1,927 5,091 7,018 27.5%
1989 214 1,488 1,642 3,959 1,856 5,447 7,303 25.4%
1990 374 1,878 1,961 4,416 2,335 6,294 8,629 27.1%
1991 394 1,923 1,964 5,130 2,358 7,053 9,411 25.1%
1992 537 2,065 2,307 4,839 2,844 6,904 9,748 29.2%
1993 525 1,978 2,159 4,605 2,684 6,583 9,267 29.0%
Part I Crimes: Arrests as a Percentage of Reported Offenses, 1980 to 1993
Part I Violent Crime Part I Property Crime
Reported Percent Arrested Reported Perclent Arrested
Year Offenses Arrests (Arrests/Offenses· 100%) Offenses Arrests (Arrests/Offenses· 100%) -1980 2,792 1,188 42.6% 36,865 6,394 17.3%
1981 3,034 1,291 42.6% 35,856 6,444 18.0%
1982 3,038 1,311 43.2% 35,298 6,370 18.0%
1983 2,757 1,187 43.1% 30,231 5,667 18.7%
1984 2,723 1,336 49.1% 28,541 5,404 18.9%
1985 2,743 1,306 47.6% 28,631 5,165 18.0%
1986 2,738 1,361 49.7% 28,469 5,620 19.7%
1987 2,862 1,154 40.3% 29,574 5,182 17.5%
1988 3,044 1,368 44.9% 29,209 5,650 19.3%
1989 3,773 1,702 45.1% 29,296 5,601 19.1%
1990 4,536 2,252 49.6% 32,079 6,377 19.9% ,
1991 4,886 2,z,ii 7 47.4% 35,390 7,094 20.0%
1992 5,004 2,602 52.0% 34,557 7,146 20.7%
1993 5,138 2)503 48.7% 32,052 6,764 21.1%
Average % Arrested, '80-'93: 46.1% 19.0% .. -.
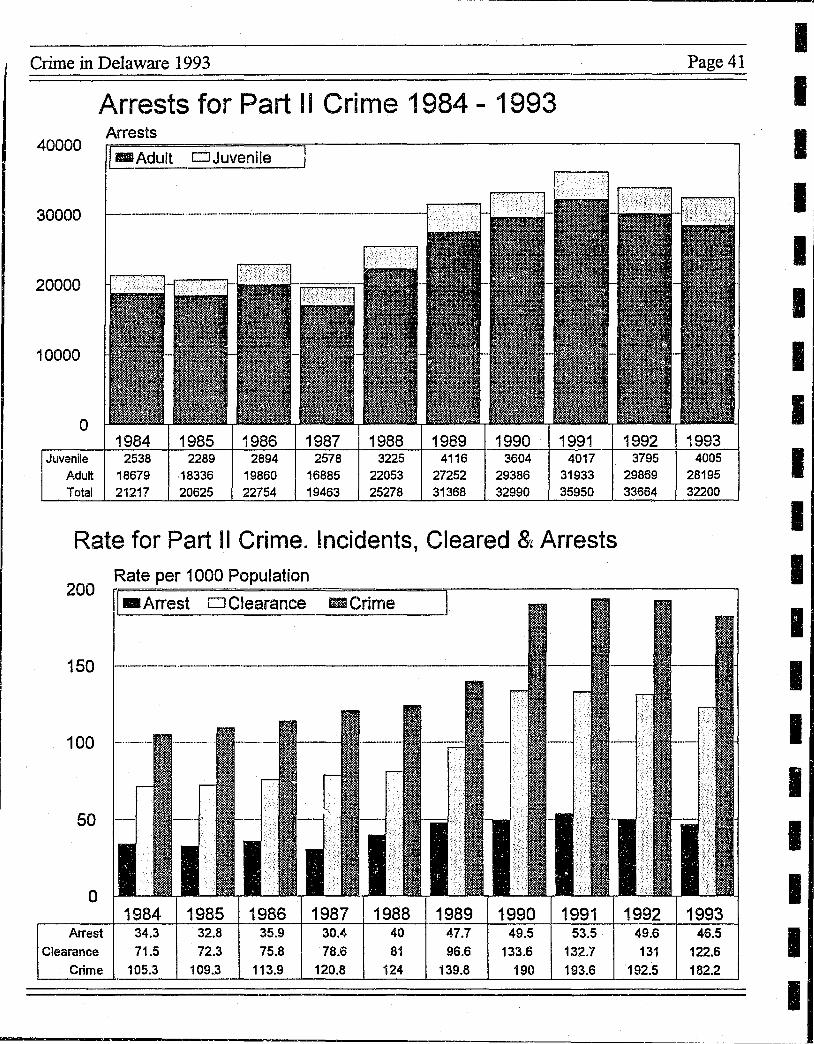
Crime in Delaware 1993
Arrests for Part II Crime 1984 - 1993 Arrests
40000 -Adult DJuvenile
30000
20000
10000
o Juvenile 2538 2289 2894 2578 3225 4116 3604 4017
Adu~ 18679 18336 19860 16885 22053 27252 29386 31933 Total 21217 20625 22754 19463 25278 31368 32990 35950
Rate for Part II Crime. Incidents, Cleared 8, Arrests Rate per 1000 Population
200 -Arrest DClearance mCrime
150
100
50
a 1984 1985 1986 1987 1988
Arrest 34.3 32.8 35.9 30.4 40
Clearance 71.5 72.3 75.8 78.6 81 Crime 105.3 109.3 113.9 120.8 124
--
1989 1990 1991 47.7 49.5 53.5 96.6 133.6 132.7
139.8 190 193.6
29869 33664
1992 49.6 131
192.5
Page 41
28195 32200
1993 46.5
122.6 182.2
--------------~-----------------------------------------------
I I I I I I I I I I I I I I I I I I I

--------------------------------------------
I I I
:1 II
I I I I I I I I I I I I I I
Page 42 Crime in Delaware 1993
Number of Police Officers '1977 - 1993
Police 1600
1400
1200
1000
800
600
400
200
0 ,.... co m 0 .... N t") 'lit it) <t: I"- co m 0 .... N ,.... ,.... ,.... co co co co co co '..0 CIO co 00 m m en m m CD m m m m m m (I) m m m m m m .... .... .... ..... ..... ~ .... .... .,.... .... .... .... .... ..- ... .,....
Police 0 1234 1225 1312 1232 1172 1118 1147 1140 1165 1161 1214 1256 1316 1337 1351 1447
Police Officers and Complaints/Arrests Per 1000 Population Violent Crime 1980 - 1993
Rate Per 1000 Population 8
[iRPolice/1000 DArrest Rate _Compo Rate I
6 ----_ .... __ ... _._ .. _' .... _._---------.---_._ .. _ ... _-- - -
4 r--- r-- f---- .- f--- .- ,.- - -- f..--- - 1--- --pc
~ :::' "~ ". i~J'
F ;::~"; -' r!:, .c > I.'; ':{
2 .. --:!' _.or- r-- '--F I_F ._.r:- 1,;;;( .::",.
r 1--;= i-::-:--.-_ .... -
.} .; ... , " r " .'
:J:
J "
I. ;.,
.f. e
I:i, I' , " ,. .,
I·'
,,> '.
a .c..:... '- ..:... ..... - -- '-- '-- ...... ..... c:.l L..;..
1980 1981 1982 1983 1984 1985 1986 1987 1988 1989 1990 1991 1992 Police/1000 2.07 1.95 1.84 1.87 1.84 1.86 1.83 1.89 1.93 2 2.01 2 2.12 Arrest Rate 2 2.15 2.16 1.94 2.16 2.09 2.15 1.8 2.11 2.59 3.38 3.44 3.81
Camp. Rate 4.7 5.06 5.01 4.5 4.4 4.38 4.32 4.46 4.69 5.74 6.81 7.24 7.32
C") m m ..-
1415
1-
-"..,.,
Ii:;~ ... '"
,i
:;;
I 1993 2.04 3.47 7.41
I I I I I I I I I I I I I I I I I I I
------ -_._------------------------
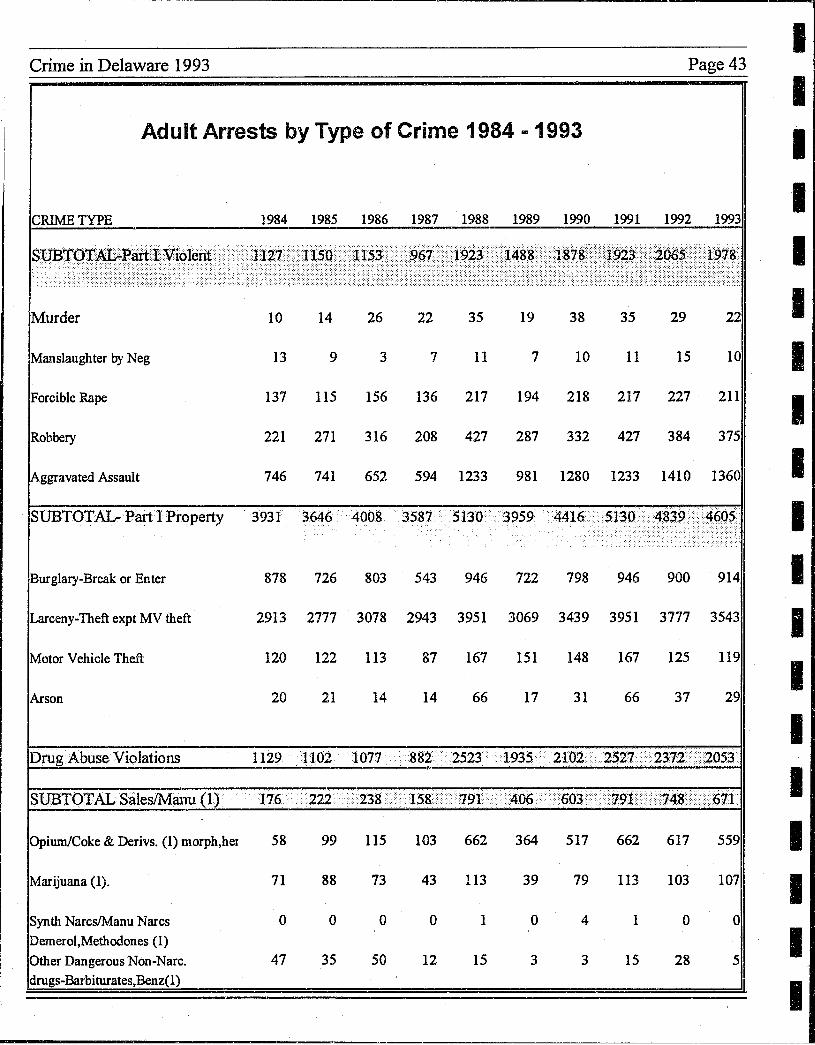
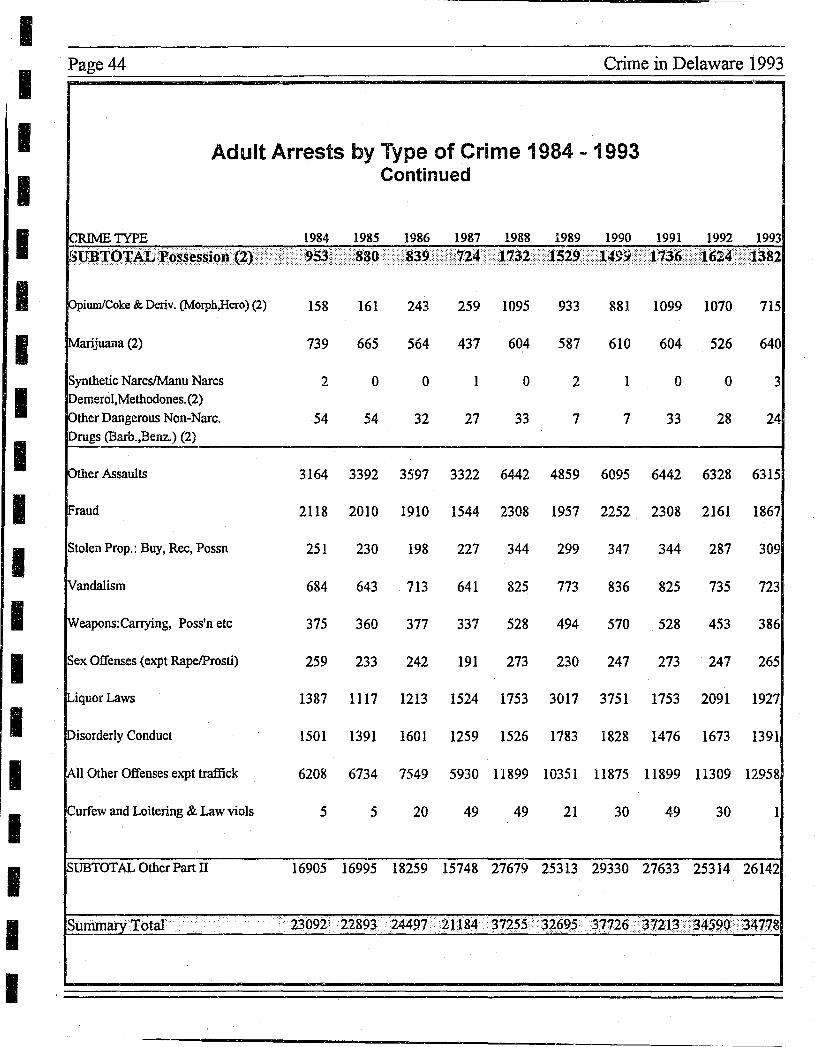
Page 44 Crime in Delaware 1993
Adult Arrests by Type of Crime 1984 ... 1993 Continued
iCRIME TYPE 1984 1985 1986 1987 1988 1989 1990 1991 1992 1993
ppiumlCoke & Denv. (Morpb,Hero) (2)
Marijuana (2)
Synthetic NarcslManu Narcs Demerol,Methodones.(2) Other Dangerous Non-Narc. Drugs (Barb.,Benz.) (2)
Pilier Assaults
IFraud
Stolen Prop.: Buy, Rec, Possn
iVandaiism
Weapons: Carrying, Poss'n etc
Sex Offenses (expt RapelProsti)
dquorLaws
Disorderly Conduct
All Other Offenses expt traffick
Curfew and Loitering & Law viols
SUBTOTAL Other Part II
Summary Total ........
158 161 243 259 1095 933 881 1099 1070 715
739 665 564 437 604 587 610 604 526 640
200 102 1 o 0 3
54 54 32 27 33 7 7 33 28 24
3164 3392 3597 3322 6442 4859 6095 6442 6328 6315
2118 2010 1910 1544 2308 1957 2252 2308 2161 1867
251 230 198 227 344 299 347 344 287 309
684 643 713 641 825 773 836 825 735 723
375 360 377 337 528 494 570 528 453 386
259 233 242 191 273 230 247 273 247 265
1387 1117 1213 1524 1753 3017 3751 1753 2091 1927
1501 1391 1601 1259 1526 1783 1828 1476 1673 1391
6208 6734 7549 5930 11899 10351 11875 11899 11309 12958'
5 5 20 49 49 21 30 49 30 1
16905 16995 18259 15748 27679 25313 29330 27633 25314 26142
. 23092~ 22891 244972J18437255. >32(i953772.637213'34SQP?'34778
.' . . "
Illicit Drug Crime
D elaware's reported illicit drug offenses decreased to 5,999 in 1993, down
3.8 percent from the 1992 level of 6,235. The statewide decline was due to a 10.3 percent decrease in New Castle County's reported of
Delaware's reported illicit drug offenses decreased to 5,999 in 1993
fenses; from 4,169 in 1992 to 3,740 in 1993. Reported drug offenses increased in the other two counties. Kent County reported a 9.8 percent increase; from 993 in 1992 to 1,090 in 1993. Sussex County re-ported an 8.9
percent increase; from 1,073 in 1992 to 1,196 in 1993.
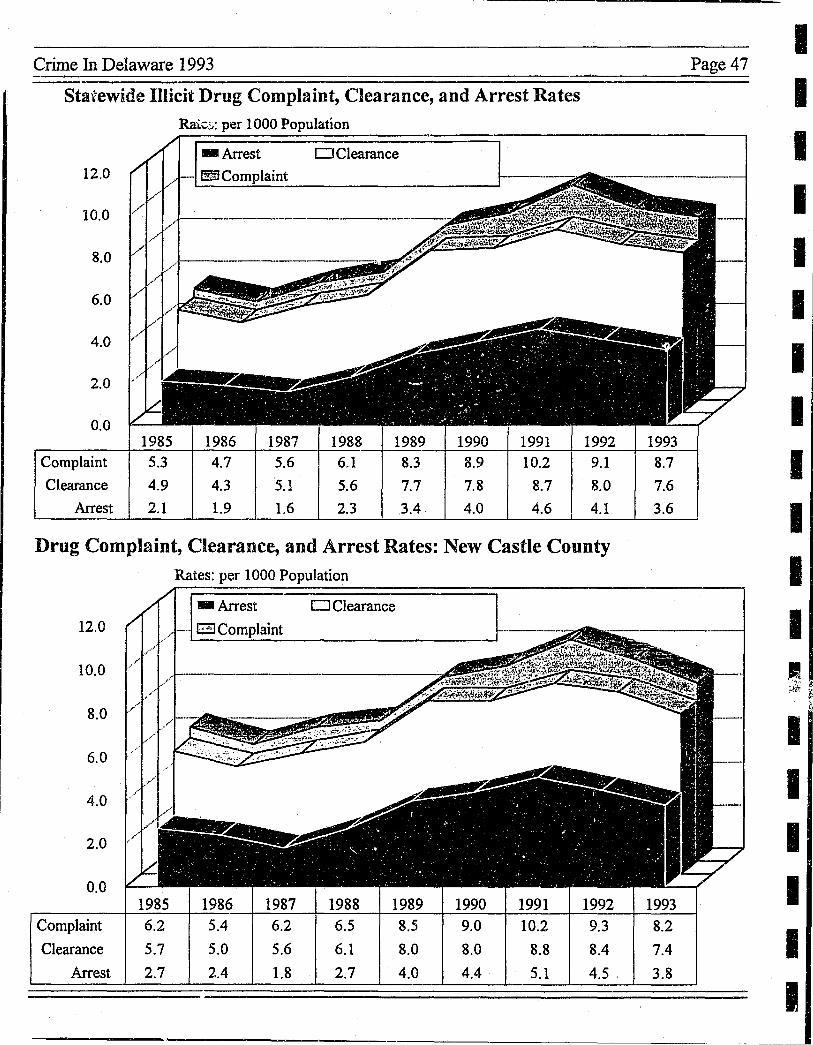
Drug Offense Rates
When comparing the drug offense rate, a statewide decrease in 1993, 8.7 versus 9.1 per 1,000 population
" in 1992 is seen. The 1993 New Castle County rate decreased from 9.3 to 8.2, while Kent and Sussex County rates increased from 8.7 to 9.3 in Kent, and 9.1 to 9.7 in Sussex.
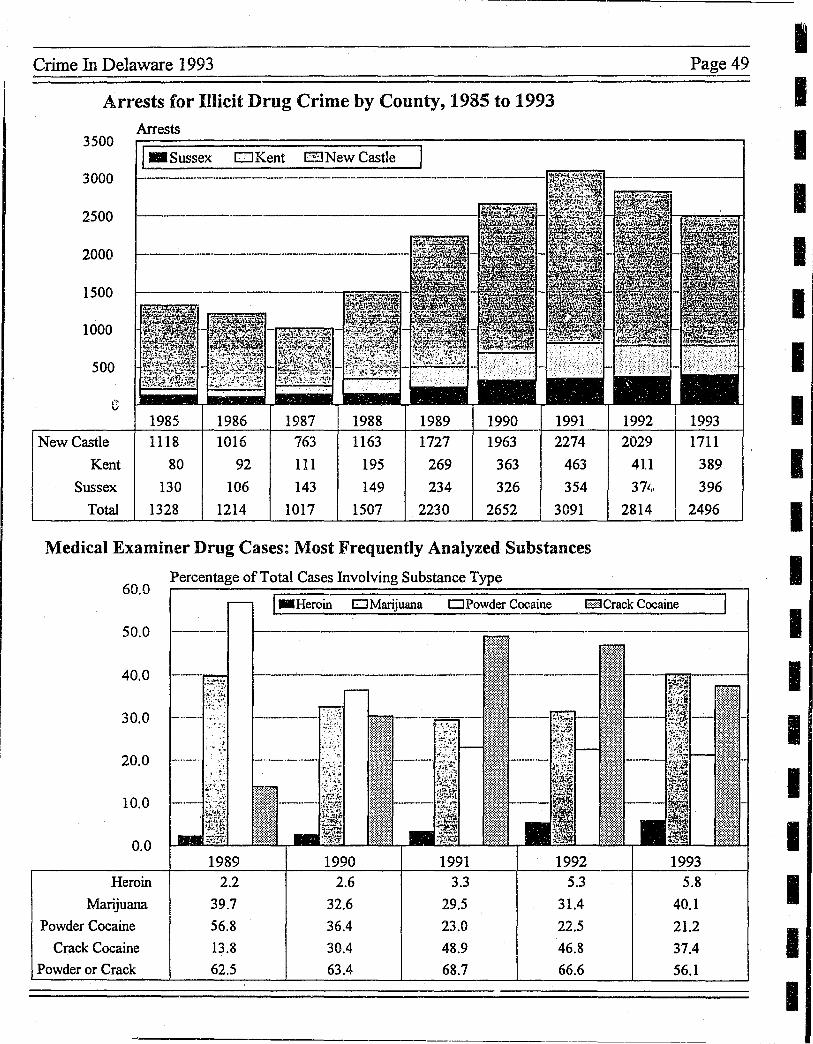
Drug Arrests
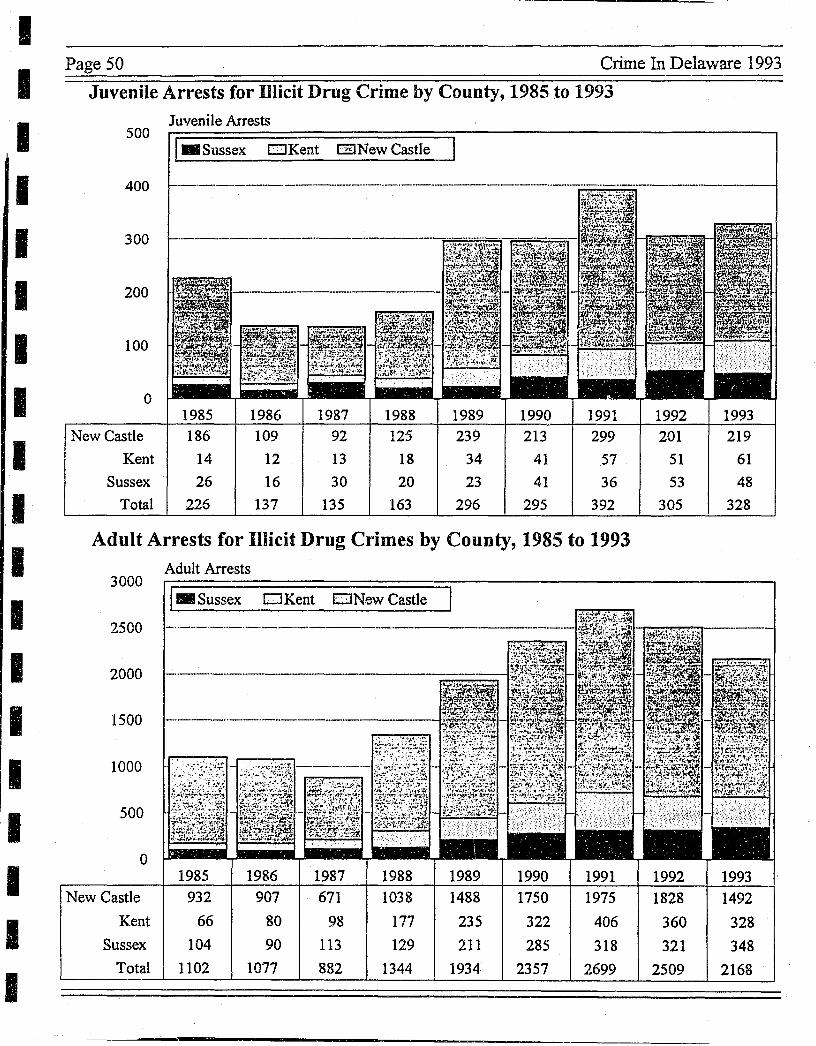
There were 2,496 statewide arrests for drug offenses in 1993, an 11.3 percent decline from 2,814 drug arrests in 1992. New Castle CountY" drug arrests fell 15.7 percent, 1,711 in 1993 versus 2,029 in 1992. Kent County had 5.4 percent fewer drug arrests, 389 in 1993 versus 411 in 1992. In Sussex County, however, drug arrests increased 5.9 percent in 1993, to 396 from 374 in 1992. Of 1993's 2,496 statewide drug arrests, 2,168 were adults and 328 were juveniles.
Admissions to the Department of Correction
Drug offender detained admissions to DOC decreased to 964 in 1993, down 22.1 percent from 1,237 in 1992. However, sentenced admissions for drug offenses continued a decade-long increase. Jail (1 year or less) admis~ sions increased 22.9 percent, from 327 in 1992 to 402 in 1993. Prison (more than 1 year) admissions increased from 318 in 1992 to 327 in 1993.
I I I I I I I I I I I I I I I I I I I
I
I I I I I I I I I I I I I I I I I
Page 46
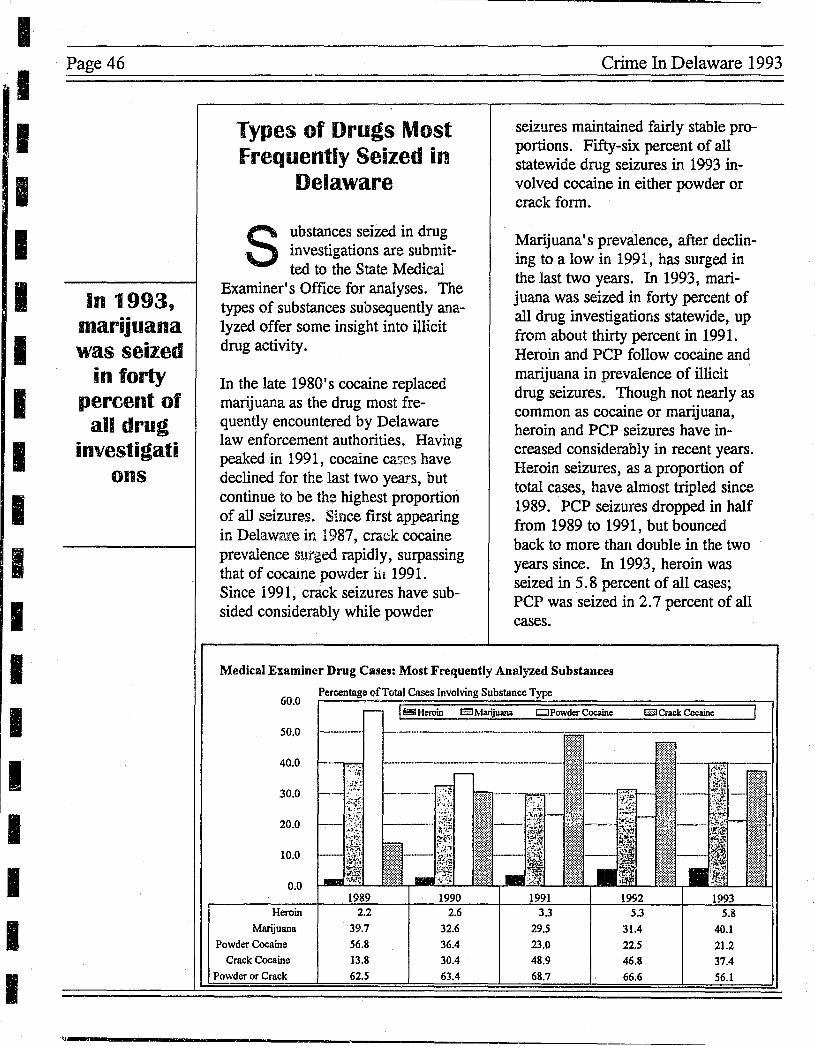
In 1993, marijuana was seized
in forty percent of all drug
investigati OUS
Types of Drugs Most frequently Seized in
Delaware
S ubstances seized in drug investigations are submitted to the State Medical
Examiner's Office for analyses. The types of substances subsequently analyzed offer some insight into illicit drug activity.
In the late 1980's cocaine replaced marijuana as the drug most frequently encountered by Delaware law enforcement authorities. Having peaked in 1991, cocaine ca<;e·s have declined for the last two years, but continue to be the highest proportion of all seizures. Since first appearing in Delaware in 1987, cmck cocaine prevalence surged rapidly, surpassing that of cocaine powder hI 1991. Since 1991, crack seizures have subsided considerably while powder
Crime In Delaware 1993
seizures maintained fairly stable proportions. Fifty-six percent of all statewide drug seizures in 1993 involved cocaine in either powder or crack form.
Marijuana's prevalence, after declining to a low in 1991, has surged in the last two years. In 1993, marijuana was seized in forty percent of all drug investigations statewide, up from about thirty percent in 1991. Heroin and PCP follow cocaine and marijuana in prevalence of illicit drug seizures. Though not nearly as common as cocaine or marijuana, heroin and PCP seizures have increased considerably in recent years. Heroin seizures, as a proportion of total cases, have almost tripled since 1989. PCP seizures dropped in half from 1989 to 1991, but bounced back to more than double in the two years since. In 1993, heroin was seized in 5.8 percent of all cases; PCP was seized in 2.7 percent of all r..ases.
Medical Examiner Drug Cases: Most Frequently Analyzed Substances
60.0
50.0
40.0
30.0
20.0
10.0
0.0
Heroin
Marijuana 39.7 32.6 29.5 31.4 40.1 Powder Cocaine 56.8 36.4 23.0 22.5 21.2
Crack Cocaine 13.8 30.4 48.9 46.8 37.4 Powder or Crack 62.5 63.4 68.7 66.6 56.1
":,--------~----------~
I Crime In Delaware 1993 Page 47
Statewide Illicit Drug Complaint, Clearance, and Arrest Rates I I
Rai~,,: per 1000 Population
o Clearance 12,0
10.0 I 8.0 I 6.0 I 4.0
I 2.0
0.0 I 1985 1986 1987 1988 1989 1990 1991 1992 1993
I 4.7 5.6 6.1 8.3 8.9 10.2 9.1 8.7 4.3 5.1 5.6 7.7 7.8 8.7 8.0 7.6
Complaint 5.3
Clearance 4.9 Arrest 2.1 1.9 1.6 2.3 3.4 4.0 4.6 4.1 3.6 I
I Drug Complaint, Clearance, and Arrest Rates: New Castle County
Rates: per 1000 Population
I -Arrest o Clearance
12.0
10.0 II i;~ ~
" I' 8.0
6.0
4.0 I 2.0 I
I 0.0 1985 1986 1987 1988 1989 1990 1991 1992 1993
I Complaint 6.2 5.4 6.2 6.5 8.5 9.0 10.2 9.3 8.2 Clearance 5.7 5.0 5.6 6.1 8.0 8.0 8.8 8.4 7.4
Arrest 2.7 2.4 1.8 2.7 4.0 4.4 5.1 4.5 3.8
I

I ,I
I I I I I I I I I I I I I I ,I
I I
-----
Page 48 Crime hI Delaware 1993
Drug Complaint, Clearance, and Arrest Rates: Kent County
12.0
10.0
8.0
6.0
4.0
2.0
0.0 1985
Complaint 3.7
Clearance 3.1
Arrest 0.8
Rates: per 1000 Population
;0 Arrest 139 laint
DClearance
1986 1987 1988 1989 3.4 4.8 5.4 8.4
3.1 4.1 4.8 7.4
0.9 1.0 1.8 2.5
1990 9.1
7.9
3.3
1991 11.1
9.2
4.1
1992 8.7
7.3
3.6
Drug Complaint, Clearance, and Arrest Rates: Sussex County Rates: per 1000 Population
-Arrest o Clearance 12.0
10.0
8.0
6.0
4.0
2.0
0.0 1985 1986 1987 1988 1989 1990 1991 1992
Complaint 3.7 3.0 4.2 5.1 7.6 7.9 9.3 9.1 Clearance 3.2 2.8 3.8 4.7 6.8 7.0 7.7 7.4
Arrest 1.2 1.0 1.3 1.4 2.1 2.9 3.1 3.2
1993 9.3
8.1
3.3
1993 9.7 8.0 3.3
-----------------------------------------------.-------------------
Crime In Delaware 1993 Page 49
Arrests for Illicit Drug Crime by County, 1985 to 1993 Arrests
3500 1_ Sussex o Kent GNew Castle
3000
2500
2000
1500
1000
500
G 1985 1986 1987 1988 1989 1990 1991 1992 1993
New Castle 1118 1016 763 1163 1727 1963 2274 2029 1711 Kent 80 92 III 195 269 363 463 411 389
Sussex 130 106 143 149 234 326 354 37'" 396 Total 1328 1214 1017 1507 2230 2652 3091 2814 2496
Medical Examiner Drug Cases: Most Frequently Analyzed Substances
60.0
50.0
40.0
30.0
20.0
10.0
0.0
Heroin
Marijuana
Powder Cocaine
Crack Cocaine
Powder or Crack
Percentage of Total Cases Involving Substance Type
I_Heroin ClMarijuana DPowder Cocaine
1989 1990 1991 2.2 2.6 3.3
39.7 32.6 29.5 56.8 36.4 23.0 13.8 30.4 48.9 62.5 63.4 68.7
E=E Crack Cocaine
1992 1993 5.3 5.8
31.4 40.1 22.5 2l.2 46.8 37.4 66.6 56.1
I I I I I I I I I I I I I I I I I I I
I I I I I I I I I I I I I I I I II
I .1
Page 50 Crime In Delaware 1993
Juvenile Arrests for Illicit Drug Crime by County, 1985 to 1993 Juvenile Arrests
500 1_ Sussex o Kent ElNew Castle
400
300
200
100
o 1985
New Castle 186 Kent 14
Sussex 26 Total 226
1986 109
12 16
137
1987 92 13 30
135
1988 125
18 20
163
1989 239
34 23
296
1990 213
41
41
295
1991 299
57 36
392
Adult Arrests for Illicit Drug Crimes by County, 1985 to 1993 Adult Arrests
3000 1-Sussex o Kent DNew Castle
2500
2000
1500
1000
500
o 1985
New Castle 932
Kent 66
Sussex 104 Total 1102
1986 907
80
90
1077
1987 671
98
113 882
1988 1038
177
129 1344
1989 1488
235 211
1934
1990 1750
322
285 2357
1991 1975
406
318 2699
1992 201
51 53
305
1992 1828
360
321 2509
1993 219
61 48
328
1993 1492
328
348
2168
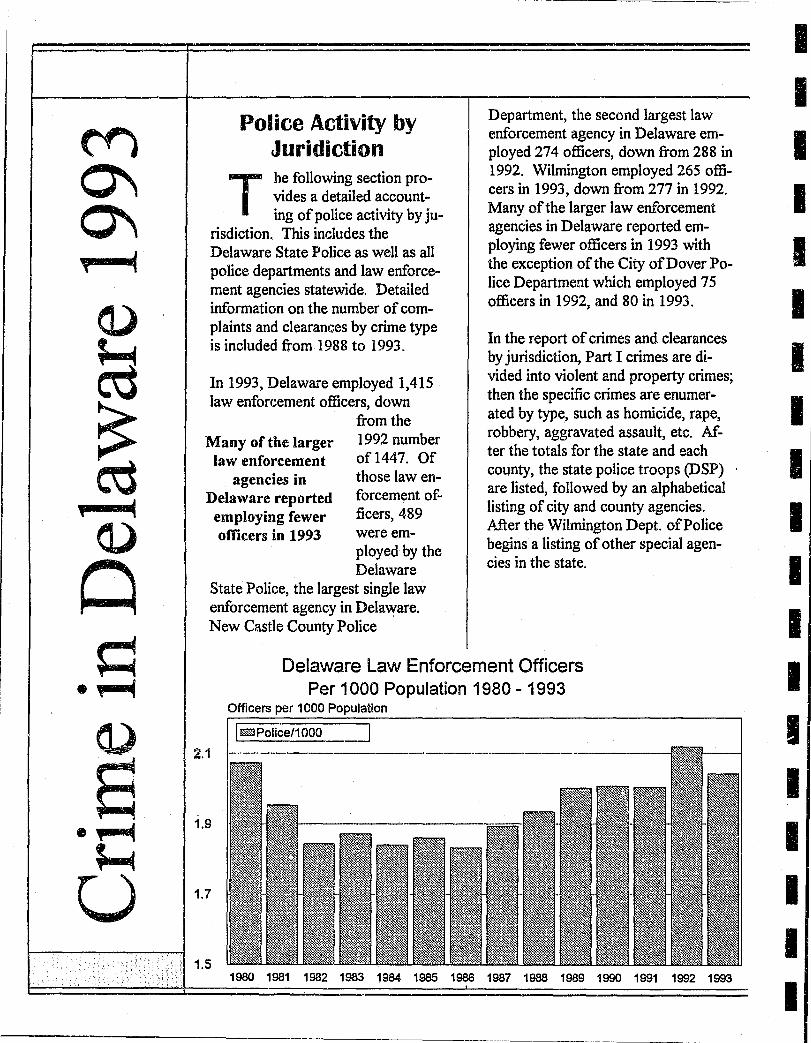
Police Activity by Juridiction
The following section pro~des a detailed accountmg of police activity by ju-
risdiction. This includes the Delaware State Police as well as all police departments and law enforcement agencies statewide. Detailed infonnation on the number of complaints and clearances by crime type is included from 1988 to 1993.
In 1993, Delaware employed 1,415 law enforr.:ement officers, down
from the Many of the larger 1992 number
law enforcement of 1447. Of agencies in
Delaware reported employing fewer officers in 1993
those law enforcement officers, 489 were employed by the Delaware
State Police, the largest single law enforcement agency in Delaware. New Castle County Police
Department, the second largest law enforcement agency in Delaware employed 274 officers, down from 288 in 1992. Wilmington employed 265 officers in 1993, down from 277 in 1992. Many of the larger law enforcement agencies in Delaware reported employing fewer officers in 1993 with the exception of the City of Dover Police Department which employed 75 officers in 1992, and 80 in 1993.
In the report of crimes and clearances by jurisdiction, Part I crimes are divided into violent and property crimes; then the specific crimes are enumerated by type, such as homicide rape , , robbery, aggravated assault, etc. After the totals for the state and each county, the state police troops (DSP) are listed, followed by an alphabetical listing of city and county agencies. A..fter the Wilmington Dept. of Police begins a listing of other special agencies in the state.
Delaware Law Enforcement Officers Per 1000 Population 1980 - 1993
Officers per 1000 Population
II1mPolice/1 000 ~ 2.1
1.9
1.7
1.5 1987 1988 1989 1990 1991 1992 1993
I I I I I I I I I I I I I I I I I I I

I I I I I I I I I I I I I I I I ,I
II I
'--,·~·'_-....(.r.~·/~".-.i~~·~,-=,,:=--___________ _
Page 52 Crime in Delaware 1993
Law Enforcement Officers by Jurisdiction, 1976-1993
Number of Police Officers
Jurisdiction '77 '78 '79 '80 '81 '82 '83 '84 '85 '86 '87 '88 '89 '90 '91 '92 93
Delaware State Police 440 433 433 430 421 425 444 442 462 466 472 511 517 517 503 501 489 Newark 43 44 64 50 55 44 50 51 51 45 42 47 46 51 51 51 51 Wilmington 259 256 319 264 269 249 235 245 255 235 252 250 250 256 283 277 265
Number of Police Employees Number of Police Officers
Jurisdiction '77 '78 '79 '80 '81 '82 '83 '84 '85 '86 '87 '88 '89 '90 - '91 '92 93
Bethany Beach 5 5 10 5 5 5 5 5 5 5 6 6 7 7 7 8 7 Bethel - 1 1 1 - 1 1 - - - - - - 7 1 1 1 Blades 3 3 2 1 - , 1 1 1 1 2 1 1 1 2 2 1 1 Bowers Beach 1 1 - - ,,' - ~ 1 - - - - - - ~ A
Bridgeville 5 3 6 6 - 2 4 2 2 2 3 2 3 4 4 4 4 Camden-Wyoming 5 7 6 3 - 3 1 2 2 2 1 3 5 3 5 6 6 Clayton 2 2 2 2 2 2 1 1 1 1 1 1 1 1 1 2 2 Dagsboro 1 1 2 3 2 1 1 1 1 1 1 1 1 1 1 1 1 Delaware City 4 4 4 - - - 3 3 3 4 3 - - - - -Delmar 6 7 7 8 6 4 5- 5 4 6 5 6 6 7 7 7 1 Dewey Beach - - - - - 4 3 3 3 3 4 4 6 8 7 8 8 Dover 68 66 68 65 69 56 56 54 53 58 59 59 69 67 72 75 80 Ellendale 1 1 1 1 - - 1 1 1 1 - - - - - -Elsmere 14 14 14 14 13 12 12 12 12 7 11 10 11 11 12 12 12 Felton - 3 1 2 - 1 - - - - 1 1 4 - - -FenwiGk Island 3 4 2 2 - ~ 3 3 3 3 3 3 2 3 6 5 5 Frankford 1 1 - - - - - - - - - c 1 1 - 1 1 Frederica 2 1 - - - - - - - - - - - - - 2 2 Georgetown 7 5 4 6 5 5 5 3 4 4 5 6 5 8 11 11 10 Greenwood 2 2 2 1 - - 1 2 2 2 2 1 1 2 3 3 4 Harrington 5 5 6 6 5 5 5 5 4 3 4 5 5 6 6 7 9 Laurel 9 10 9 10 8 7 7 7 6 7 7 4 8 9 9 8 8 Lewes 6 6 6 4 6 6 6 6 5 5 6 7 7 7 9 8 8 Little Creek 2 1 - - - - - - A - - - - - - -Middletown - - - - - - - - - 5 5 17 15 5 4 - . Milford 25 24 26 26 23 18 16 16 17 19 19 18 23 23 23 24 25 Millsboro 8 6 6 6 - 5 6 5 6 6 7 6 6 6 7 7 8 Milton 2 3 3 2 3 3 3 3 2 2 3 4 3 4 4 4 5 NewCastle 8 8 7 10 9 10 8 9 10 10 10 8 9 10 10 8 10 New Castle County 233 230 235 239 208 197 215 199 197 207 229 216 196 247 234 288 274 Newport 6 6 6 6 6 6 6 6 6 6 6 6 6 6 6 6 10 Ocean View 1 2 1 2 1 2 2 1 1 1 1 1 1 1 2 2 2 Rehoboth Beach 18 17 18 18 18 15 15 16 16 14 13 17 15 16 17 18 18 Seaford .18 21 21 22 20 16 14 16 15 16 17 17 20 11 21 21 21 Selbyville 2 2 i 3 1 1 1 1 2 2 1 2 3 2 4 4 3 Smyrna 17 18 15 12 15 10 9 10 10 8 11 11 13 14 14 16 16 South Bethany 2 2 3 2 2 2 2 3 3 3 3 5 5 4 5 5 6 University of Delaware - - - - - - - ~ - - - - 45 - - 45 42
Total 1234 1225 1312 1232 1172 1118 1147 1140 1165 1161 1214 1256 1316 1337 1351 1447 1415
'-' Indicates no data available. • Includes sworn officers and civilians. Number of sworn officers, only, is not available for these jurisdictions prior to 1982.
For Newark, Wilmington and Delaware State Police, the number of sworn officers is reported for all years shown. Data source: N:U Umform Cnme 1<eports.
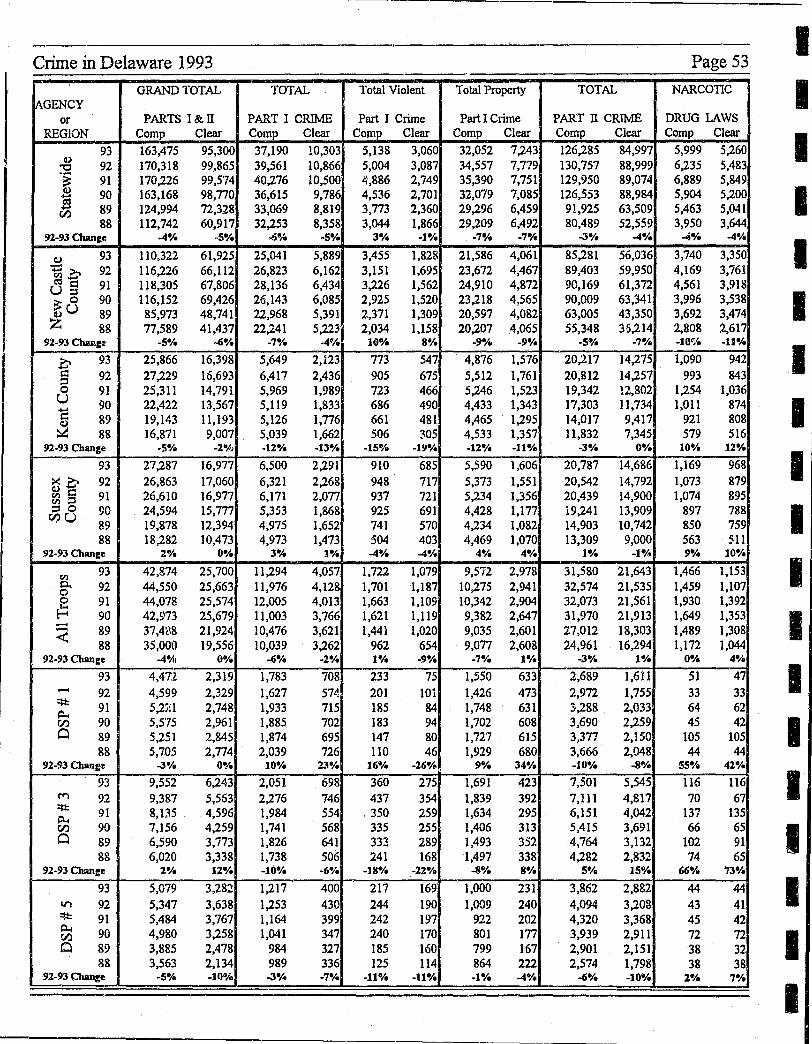
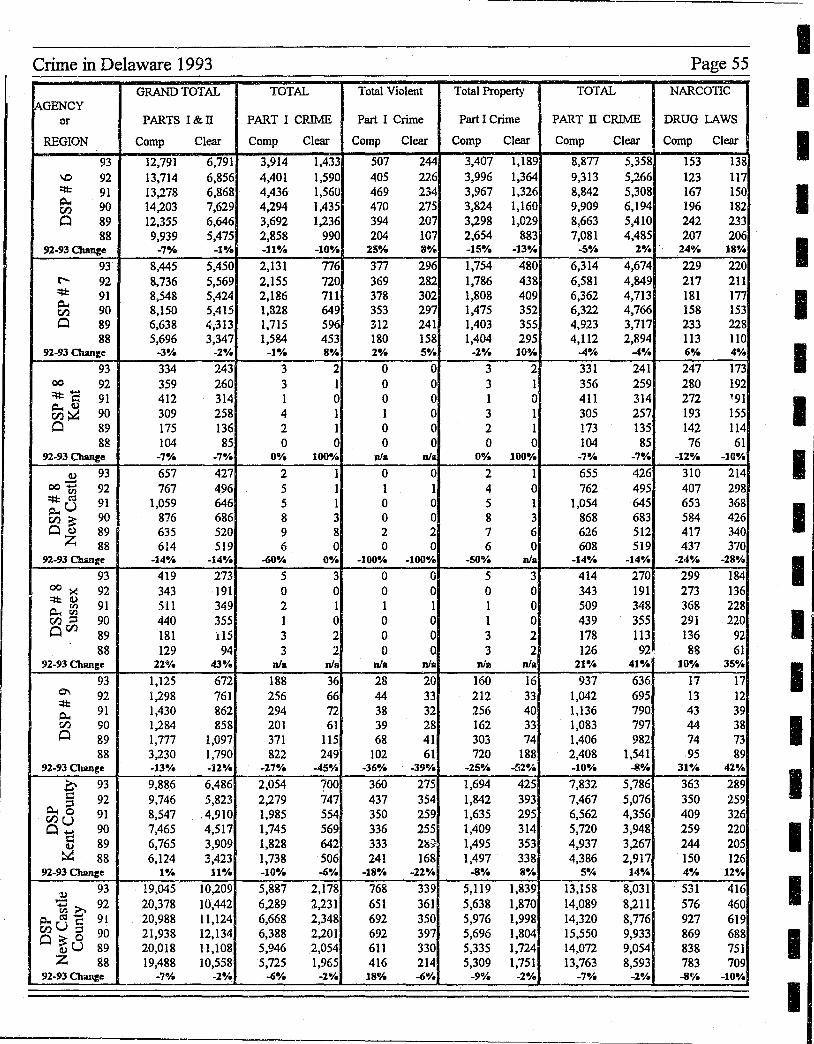
Crime in Delaware 1993
GRAND TOTAL TOTAL Total Violent AGENCY
or PARTS I&IT PART I CRIME Part I Crime REGION Comp Clear Comp Clear Comp Clear
93 163,475 95,300 37,190 10,303 5,138 3,060 tl,)
92 170,318 99,865 39,561 10,866 5,004 3,087 "0 .-~ 91 170,226 99,574 40,276 10,500 4,886 2,749
~ 90 163,168 98,770 36,615 9,786 4,536 2,701
tf.l 89 124,994 72,328 33,069 8,819 3,773 2,360 88 112,742 60,917 32,253 8,358 3,044 1,866
92-93Owt~e ...... ;. -5"/. .1.;8/. -5·/ • 3·;' -1·/.
tl,) 93 110,322 61,925 25,041 5,889 3,455 1,828 - 92 116,226 66,112 26,823 6,162 3,151 1,695 ti.o CI:ls:: 91 118,305 67,806 28,136 6,434 3,226 1,562 U::l ~ 0 90 116,152 69,426 26,143 6,085 2,925 1,520 {\)U 89 85,973 48,741 22,968 5,391 2,371 1,309 Z 88 77,589 41,437 22,241 5,2231 2,034 1,158
92-93 Cbanz~' -5% ..0./. -7e; • -4'/. 10";' 8e;.
0 93 25,866 16,398 5,649 2,123 773 547 s:: 92 27,229 16,693 6,417 2,436 905 675 ::s 0 91 25,311 14,791 5,969 1,989 723 466
U 90 22,422 13,567 5,119 1,833 686 490 1:: 89 19,143 11,193 5,126 1,776 661 481 tl,)
~ 88 16,871 9,007 5,039 1,662 506 305 92-93 Change ·5·;' -2-/" -12e;. -13·/. _lse/. -19e;.
93 27,287 16,977 6,500 2,291 910 685
><0 92 26,863 17,060 6,321 2,268 948 717 tl,) s::
91 26,610 16,977 6,171 2,077 937 721 ~::s ::so 90 24,594 15,777 5,353 1,868 925 691 tf.lU
89 19,878 12,394 4,975 1,652 741 570 88 18,282 10,473 4,973 1,473 504 403
92-93 Chanze 10/. 0·;' 3% 1·;' -4"/. ...... /. til
93 42,874 25,700 11,294 4,057 1.722 1,079 p. 92 44,550 25,663 11,976 4,128 1,701 1,187 0 0 91 44,078 25,574 12,005 4,013 1,663 1,109 ~ 90 42,~'73 25,679 11,003 3,766 1,621 1,119 - 89 37,41:18 21,924 10,476 3,621 1,44i 1,020 < 88 35,000 19,556 10,039 3,262 962 654
92-93 Change ..... ·A, 00;. -6./. -2·/. Ie;. -9-/.
93 4,472 2,319 1,783 708 233 75 - 92 4,599 2,329 1,627 574 201 101 =l:t: 91 5,2j!1 2,748 1,933 715 185 84 ~ tf.l 90 5,5'75 2,961 1,885 702 183 94 0 89 5,251 2,845 1,874 695 147 80
88 5,705 2,774 2,039 726 110 46 92-93 ChanI!<I! -3% 0·;' 10·;' 23·;' 16-;' -26·/8,
93 9,552 6,243 2,051 698 360 275 ('f") 92 9,387 5,563 2,276 746 437 354 =l:t: 91 8,135 ,4,596 1,984 554 350 259 ~ tf.l 90 7,156 4,259 1,741 568 335 255 0 89 6,590 3,773 1,826 641 333 289
88 6,020 3,338 1,738 506 241 168 92-93 Chwt:e ze;. 120/. -100/. -6,,!. _18e/. -22%
93 5,079 3,282 1,217 400 217 169 V'\ 92 5,347 3,638 1,253 430 244 190 =l:t: 91 5,484 3,767 1,164 399 242 197 Il.t 90 4,980 3,258 1,041 347 240 170 tf.l Q 89 3,885 2,478 984 327 185 160
88 3,563 2,134 989 336 125 114
I 92-93 Change I -5-;' -11)% -30;' -7e;0 _ne/. -tl·/o
Total Property TOTAL
Part I Crime PART IT CRIME Comp Clear Comp Clear
32,052 7,243 126,285 84,997 34,557 7,779 130,757 88,999 35,390 7,751 129,950 89,074 32,079 7,085 126,553 88,984 29,296 6,459 91,925 63,509 29,209 6,492 80,489 52,559
-7% -7·;" -3.;' -4e;.
21,586 4,061 85,281 56,036 23,672 4,467 89,403 59,950 24,910 4,872 90,169 61,372 23,218 4,565 90,009 63,341 20,597 4,082 63,005 43,350 20,207 4,065 55,348 36,214
-~/. -9% -58/. -7·/.
4,876 1,576 20,217 14,275 5,512 1,761 20,812 14,257 5,246 1,523 19,342 12,802 4,433 1,343 17,303 11,734 4,465 1,295 14,017 9,417 4,533 1,357 11,832 7,345 -12·/. -ue;. -3·/. oe;"
5,590 1,606 20,787 14,686 5,373 1,551 20,542 14,792 5,234 1,356 20,439 14,900 4,428 1,177 19,241 13,909 4,234 1,082 14,903 10,742 4,469 1,070 13,309 9,000
4e;. 4e; • 1·/. -1·/$
9,572 2,978 31,580 21,643 10,275 2,941 32,574 21,535 10,342 2,904 32,073 21,561
9,382 2,647 31,970 21,913 9,035 2,601 27,012 18,303 9,077 2,608 24,.961 16,294
-7% 1·/. -3"/. 1-/.
1,550 633 2,689 1,611 1,426 473 2,972 1,755 1,748 631 3,288 2,033 1,702 608 3,690 2,259 1,727 615 3,377 2,150 1,929 680 3,666 2,048
9-;' 34·/0 -10% -8~/e
1,691 423 7,501 5,545 1,839 392 7,111 4,817 1,634 295 6,151 4,042 1,406 313 5,415 3,691 1,493 352 4,764 3,132 1,497 338 4,282 2,832
-8°/. 8·/. se/o ISO;'
1,000 231 3,862 2,882 1,009 240 4,094 3,208
922 202 4,320 3,368 801 rn 3,939 2,911 799 1167 2,901 2,151 864 222 2,574 1,798 -Ie;. ..... 0/. -6./. -10·/0
Page 53
NARCOTIC
DRUG LAWS Comp Clear
5,999 5,260 6,235 5,483 6,889 5,849 5,904 5,200 5,463 5,041 3,950 3,644
...s.;. ...... /. 3,740 3,350 4,169 3,761 4,561 3,918 3,996 3,538 3,692 3,474 2,808 2,617 -IO~/. -11·;'
1,090 942 993 843
1,254 1,036 1,011 874
921 808 579 516
Ioe;. 12°/.
1,169 968 1,073 879 1,074 895
897 788 850 759 563 511 9·/. 10%
1,466 1,153 1,459 1,107 1,930 1,392 1,649 1,353 1,489 1,308 1,172 1,044
oe;. 4·/0
51 47
33 33 64 62 45 42
105 105 44 44
55% 4Z-;'
116 116 70 67
137 135 66 65
102 91 74 65
66-/. 73e;.
44 44 43 41 45 42 72 72 38 32 38 38
ze/. 7·/.
I I I I I I I I I I I I I I I I I I I
I I I I I I I I I I I I I I I I I I I
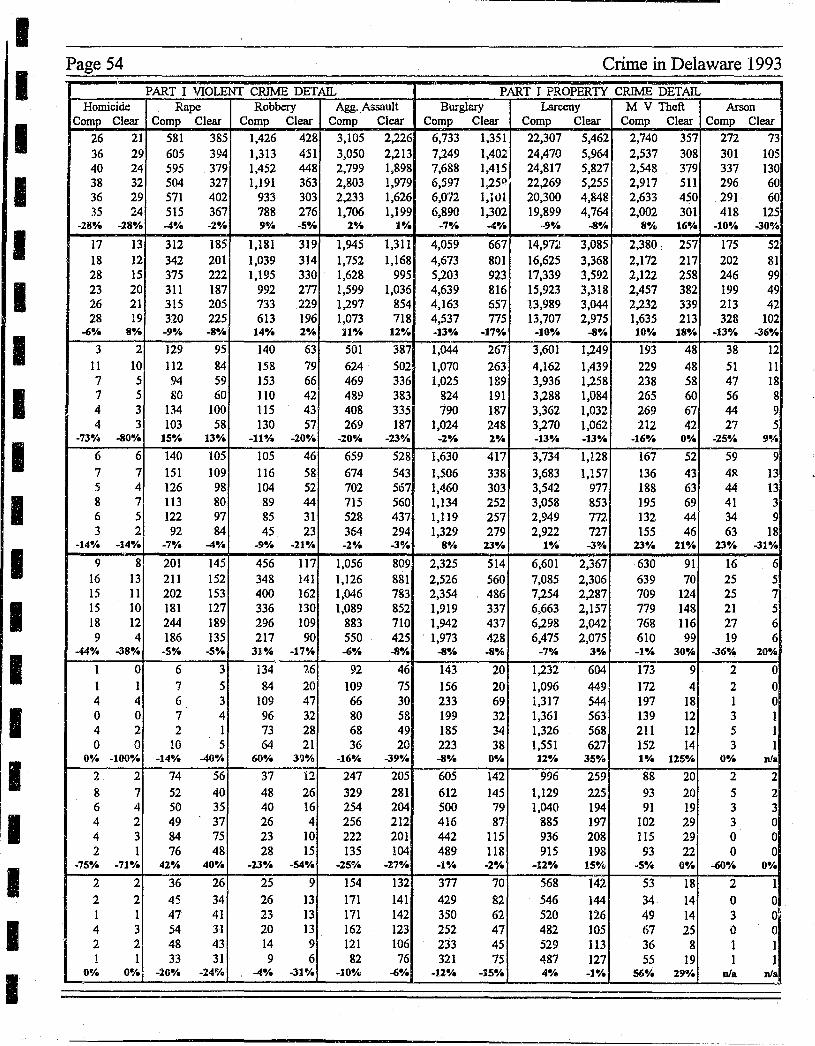
Page 54
Homicide Comp Clear
26 21 36 29 40 24 38 32 36 29 35 24
-28~_ -18~e
17 13 18 12 28 15 23 20 26 21 28 19
-60/. 8%
3 2 11 10 7 5 7 5 4 3 4 3
-73°/a -80"/.
6 6 7 7 5 4 8 7 6 5 3 2
-14·/. -14·/.
9 8 16 13 15 11 15 10 18 12 9 4
-440/" -38%
1 0 1 1 4 4 0 0 4 2 0 0
0% -1008/.
2 2 8 7 6 4 4 2 4 3 2 1
-75% -71%
2 2 2 2 1 1 4 3
L.l 2 1
0-/_
PART I VIOLENT CRIME DETAIL Rape Robbery Agg .. Assault
Comp Clear Comp Clear Comp Clear
581 385 1,426 428 3,105 2,226 605 394 1,313 451 3,050 2,213 595 379 1,452 448 2,799 1,898 504 327 1,191 363 2,803 1,979 571 402 933 303 2,233 1,626 515 367 788 276 1,706 1,199 -4% _2% ge/a -5% 26/a 10/0
312 185 1,181 319 1,945 1,311 342 201 1,039 314 1,752 1,168 375 222 1,195 330 1,628 995 311 187 992 277 1,599 1,036 315 205 733 229 1,297 854 320 225 613 196 1,073 718 -9~8 -8~. 14% 2% 11"'/0 12°/.
129 95 140 63 501 387 112 84 158 79 624 502 94 59 153 66 469 336 80 60 110 42 489 383
134 100 115 43 408 335 103 58 130 57 269 187
lS°/a 13"/0 -In'. -20*/. -20% -23 ft/a
140 105 105 46 659 528 151 109 116 58 674 543 126 98 104 52 702 567 113 80 89 44 715 560 122 97 85 31 528 437 92 84 45 23 364 294
-7% -48/. -9"/. -21-1. -2"/a -3%
201 145 456 117 1,056 809 211 152 348 141 1,126 881 202 153 400 162 1,046 783 181 127 336 130 1,089 852 244 189 296 109 883 710 186 135 217 90 550 425 -S~. -S'Yo 31°" -17% -6"/a -8e/a
6 3 134 26 92 46 7 5 84 20 109 75 6 3 109 47 66 30 7 4 96 32 80 58 2 1 73 28 68 49
10 5 64 21 36 20 -14% -40·/a 60-1. 31W$ -16-/s -39%
74 56 37 12 247 205 52 40 48 26 329 281 50 35 40 16 254 204 49 37 26 4 256 212 84 75 23 10 222 201 76 48 28 15 135 104
42% 40% -23-/a -54°/. -2S~/0 -27%
36 26 25 9 154 132 45 34 26 13 171 141 47 41 23 13 171 142 54 31 20 13 162 123 48 43 14 9 121 106 33 31 9 6 82 76
-20% -24% -4% -31% -10-/~ -68/0
Crime in Delaware 1993 ,
PART I PROPERTI CRIME DETAIL Burglary Larceny M V Theft Arson
Comp Clear Comp Clear Comp Clear Comp Clear
6,733 1,351 22,307 5,462 2,740 357 272 73 7,249 1,402 24,470 5,964 2,537 308 301 105 7,688 1,415 24,817 5,827 2,548 379 337 130 6,597 1,250 22,269 5,255 2,917 511 296 60 6,0'12 l,l<.l1 20,300 4,848 2,633 450 291 60 6,890 1,302 19,899 4,764 2,002 301 418 125
-7% 4·/0 -9% -80/a 8·A. 16°/. -10°/a -308/0
4,059 667 14,972 3,085 2,380 : 257 175 52 4,673 801 16,625 3,368 2,172 217 202 81 5,203 923 17,339 3,592 2,122 258 246 99 4,639 816 15,923 3,318 2,457 382 199 49 4,163 657 13,989 3,044 2,232 339 213 42 4,537 775 13,707 2,975 1,635 213 328 102 -13-/. -17°/. -10°/. ...sa/a 10"/a 18°/. -13-/a -36·/.
1,044 267 3,601 1,249 193 48 38 12 1,070 263 4,162 1,439 229 48 51 11 1,025 189 3,936 1,258 238 58 47 18
824 191 3,288 1,084 265 60 56 8 790 187 3,362 1,032 269 67 44 9
1,024 248 3,270 1,062 212 42 27 5 -2-1. 2% -13·/a -13·/. -16°/. 0"/. -15·/. 9·/0
1,630 417 3,734 1,128 167 52 59 9 1,506 338 3,683 1,157 136 43 4R 13 1,460 303 3,542 977 188 63 44 13 1,134 252 3,058 853 195 69 41 3 1,119 257 2,949 772 132 44 34 9 1,329 279 2,922 727 155 46 63 18
8% lJ8/. 18/. -3o/e 23°/a 21°/. 23% -31°;'
2,325 514 6,601 2,367 630 91 16 6 2,526 560 7,085 2,306 639 70 25 5 2,354 486 7,254 2,287 709 124 25 7 1,919 337 6,663 2,157 779 148 21 5 1,942 437 6,298 2,042 768 116 27 6 1,973 428 6,475 2,075 610 99 19 6
-8% -8% -7~/a 3°;' _1°/a 30·" -36% 20%
143 20 1,232 604 173 9 2 0 156 20 1,096 449 172 4 2 0 233 69 1,317 544 197 18 1 0 199 32 1,361 563 139 12 3 I 185 34 1,326 568 211 12 5 1 223 38 1,551 627 152 14 3 1 -8·/e 0% 12°/_ 35% 18/a 125-18 O~O nlil
605 142 996 259 88 20 2 2 612 145 1,129 225 93 20 5 2 500 79 1,040 194 91 19 3 3 416 87 885 197 102 29 3 0 442 115 936 208 115 29 0 0 489 118 915 198 93 22 0 0 -1 8/. -2·/a _12°/a 15-;" -5-/. 0% -60% 0%
377 70 568 142 53 18 2 1 429 82 546 144 34 14 0 0 350 62 520 126 49 14 3 Oil
252 47 482 105 67 25 \) 0 233 45 529 113 36 8 1 1 321 75 487 127 55 19 1 1
-12% -15°/. 40/. _lela 56% 29°/_ nla nla ,
Crime in Delaware 1993
GRAND TOTAL TOTAL Total Violent iAGENCY
or PARTS I&n PART I CRIME Part I Crime
REGION Comp Clear Comp Clear Comp Clear
93 12,791 6,791 3,914 1,433 507 244 \0 92 13,714 6,856 4,401 1,590 405 226
* 91 13,278 6,868 4,436 1,56U 469 234 r;:l...
90 14,203 7,629 4,294 1,435 470 275 00 0 89 12,355 6,646 3,692 1,236 394 207
88 9,939 5,475 2,858 990 204 107 92-93 Change -'"h -l"/e _u";. -lO~. 25% 8%
93 8,445 5,450 2,131 776 377 296 r--.. 92 8,736 5,569 2,155 720 369 282 ~ 91 8,548 5,424 2,186 711 378 302 r;:l...
90 8,150 5,415 1,328 649 353 297 00 0 89 6,638 4,313 1,715 596 312 241
88 5,696 3,347 1,584 453 180 158 92-93Owtge -3·/e -2~. -1~" 8"/. 2% S~.
93 334 243 3 2 0 0 00 92 359 260 3 1 0 0 ~1:: 91 412 314 1 0 0 0
~~ 90 309 258 4 1 1 0 0 89 175 136 2 1 0 0
88 104 85 0 0 0 0 92-93 Change -,./. -,% O~. 100% nI. nla
cu 93 657 427 2 1 0 0 00-;::: 92 767 496 5 1 1 1 ~~ 91 1,059 646 5 1 0 0 p.,U 1Zl~ 90 876 686 8 3 0 0 Ocu 89 635 520 9 8 2 2
Z 88 614 519 6 0 0 0 92-93 Change -14% -14"/. -60"/. 0% -100·/. -100~.
93 419 273 5 3 0 0 COx 92 343 191 0 0 0 0 ~cu
91 511 349 2 1 1 1 p...~ en=:! 90 440 355 1 0 0 0 0 00
89 181 U5 3 2 0 0 88 129 94 3 2 0 0
92-93 Change :%2"'/. 43"/. nla nla nla nla
93 1,125 672 188 36 28 20 0\ 92 1,298 761 256 66 44 33 ~
91 1,430 862 294 72 38 32 p... tI) 90 1,284 858 201 61 39 28 0 89 1,777 1,097 371 115 68 41
88 3,230 1,790 822 249 102 61 92-93 Charlge -13~e -12% -2'"/. -45·/0 -36"/. -39"/.
€ 93 9,886 6,486 2,054 700 360 275
p.,§ 92 9,746 5,823 2,279 747 437 354
IZlU 91 8,547 .4,910 1,985 554 350 259
01:: 90 7,465 4,517 1,745 569 336 255
~ 89 6,765 3,909 1,828 642 333 2l19· 88 6,124 3,423 1,738 506 241 168
92-93 Change 1·/t, 11 8/. -10·/. -6"/. -18% -22%
~ 93 19,045 10,209 5,887 2,178 768 339
';:l 92 20,378 10,442 6,289 2,231 651 361 ~~.o 91 20,988 11,124 6,668 2,348 692 350 cn U § 90 21,938 12,134 6,388 2,201 692 397 O~o
cu U 89 20,018 11,108 5,946 2,054 611 330 Z 88 19,488 10,558 5,725 1,965 416 214
92-93 Chan~e _,eAo -2~. -6-/. -2% 18"/e -6%
Total Property TOTAL
Part I Crime PART n CRIME
Comp Clear Comp Clear
3,407 1,189 8,877 5,358 3,996 1,364 9,313 5,266 3,967 1,326 8,842 5,308 3,824 1,160 9,909 6,194 3,298 1,029 8,663 5,410 2,654 883 7,081 4,485 -15"/. -13·/e -s~. 2~" .
1,754 480 6,314 4,674 1,786 438 6,581 4,849 1,808 409 6,362 4,713 1,475 352 6,322 4,766 1,403 355 4,923 3,717 1,404 295 4,112 2,894
-2% 10% -4% -4~.
3 2 331 241 3 1 356 259 1 0 411 314 3 1 305 257 2 1 173 135 0 0 104 85
oe/, 100% -,./. -,./. 2 1 655 426 4 0 762 495 5 1 1,054 645 8 3 868 683 7 6 626 512 6 0 608 519
-SOO/. nla -14~. -14%
5 3 414 270 0 0 343 191 1 0 509 348 1 0 439 355 3 2 178 113 3 2 126 92 ..
nla nfa 21·/e 41·/e
160 16 937 636 212 33 1,042 695 256 40 1,136 790 162 33 1,083 797 303 74 1,406 982 720 188 2,408 1,541
-2S·/e -!t2~. -10·/. -~!O/.
1,694 425 7,832 5,786 1,842 393 7,467 5,076 1,635 295 6,562 4,356 1,409 314 5,720 3,948 1,495 353 4,937 3,267 1,497 338 4,386 2,917
-8% SO/. S"1e 14"/.
5,119 1,839 13,158 8,031 5,638 1,870 14,089 8,211 5,976 1,998 14,320 8,776 5,696 1,804 15,550 9,933 5,335 1,724 14,072 9,054 5,309 1,751 13,763 8,593
-9°/e -2% -,~. -2%
....
Page 55
NARCOTIC
DRUG LAWS
Comp Clear
153 138 123 117 167 150 196 182 242 233 207 206
24g/" 18·/.
229 220 217 211 181 177 158 153 233 228 113 110 6"/e 4%
247 173 280 192 272 '91 193 155 142 114 76 61
-12% -10~.
310 214 407 298 653 368 584 426 417 340 437 370
-24% -28·/.
299 184 273 136 368 228 291 220 136 92 gS 61
10% 35%
17 17 13 12 43 39 44 38 74 73 95 89
31~. 42%
363 289 350 259 409 326 259 220 244 205 150 126 4% 12~.
531 416 576 460 927 619 869 688 838 751 783 709 -8~/. -10%
I I I I I I I I I I I I I I I I I I I
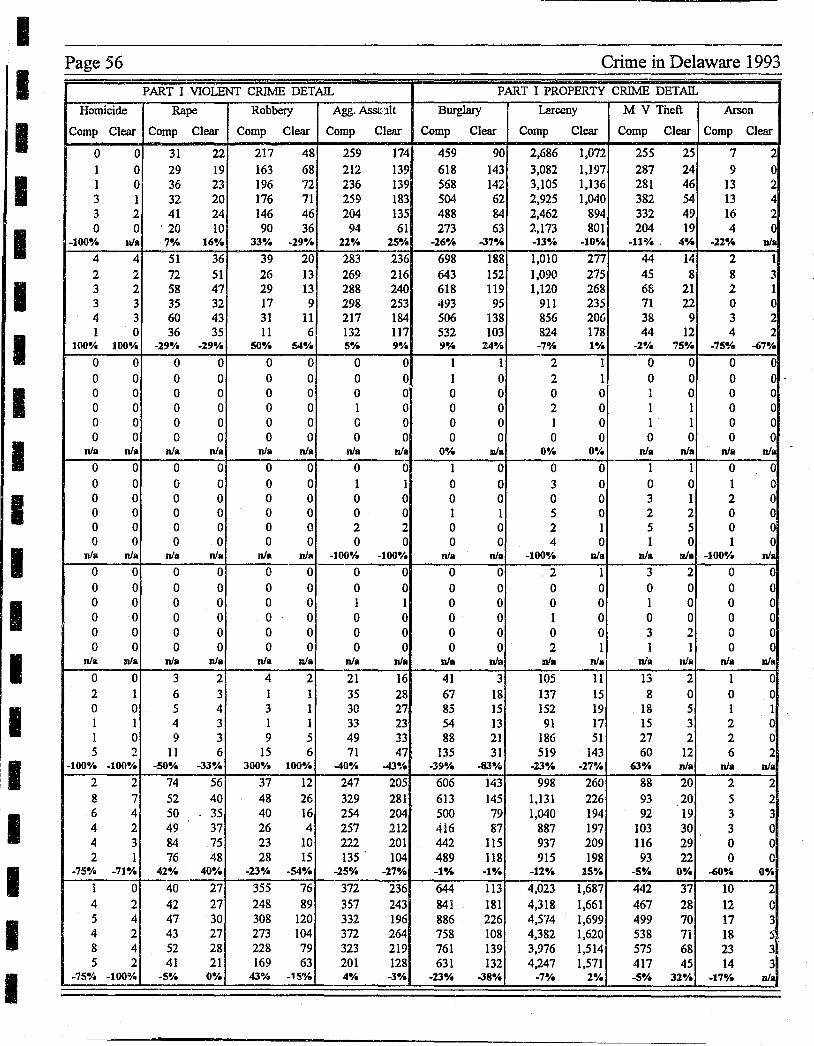
- -----------
I Page 56
I PART I VIOLENT CRIME DETAIL
I I I I I I I I I I I I I I
Homicide
Camp Clear
0 0 1 0 1 0 3 I 3 2 0 0
-100·/. RIa
4 4 2 2 3 2 3 3 4 3 1 0
100-1. 100"/0
0 0 0 0 0 0 0 0 0 0 0 0
RIll RIa 0 0 0 0 0 0 0 0 0 0 0 0
nJa nJa 0 0 0 0 0 0 0 0 0 0 0 0
nJa nJa
0 0 2 1 0 0 1 1 1 0 5 2
-1000/. -100·/.
2 2 8 7 6 4 4 2 4 3 2 1
-75·/. -71·/e
1 0 4 2 5 4 4 2 8 4 5 2
-75-1. -100%
Rape
Camp Clear
31 22 29 19 36 23 32 20 41 24 20 10
7·/" 16'1.
51 36 72 51 58 47 35 32 60 43 36 35
-29-1. -29%
0 0 0 0 0 0 0 0 0 0 0 0
nla nla
0 0 0 0 0 0 0 0 0 0 0 0
nJa nJa
0 0 0 0 0 0 0 0 0 0 0 0
nJ. nJa
3 2 6 3 5 4 4 3 9 3
11 6 -50-1. -33·/.
74 56 52 40 50 35 49 37 84 75 76 48
42% 40%
40 27 42 27 47 30 43 27 52 28 41 21
-5"/0 0%
Rabbery Agg. Asst,)it
Camp Clear Camp Clear
217 48 259 174 163 68 212 139 196 72 236 139 176 71 259 183 146 46 204 135 90 36 94 61
33-1. -29·/. 22-1. 25·/.
39 20 283 236 26 13 269 216 29 13 288 240 17 9 298 253 31 11 217 184 11 6 132 117
50% 54-1. 5% 9~/o
0 0 0 0 0 0 0 0 0 0 0 0 0 0 1 0 0 0 0 0 0 0 0 0
RIa RIa nJ" nJa 0 0 0 0 0 0 1 1 0 0 0 0 0 0 0 0 0 0 2 2 0 0 0 0
nJa nJ. -100·/. -100%
0 0 0 0 0 0 0 0 0 0 I 1 0 0 0 0 0 0 0 0 0 0 0 0
nJa nJa nJa nJa
4 2 21 16 1 1 35 28 3 1 30 27 1 1 33 23 9 5 49 33
15 6 71 47 300-1. 100·/. -40·/. -43./.
37 12 247 205 48 26 329 281 40 16 254 204 26 4 257 212 23 10 222 201 28 15 135 104
-23·/. -54·/. -25% -27·/0
355 76 372 236 248 89 357 243 308 120 332 196 273 104 372 264 228 79 323 219 169 63 201 128
43% -15"10 4-1. -3%
Crime in Delaware 1993
PART I PROPERTY CRIME DETAIL
Burglary Larceny M V Tileft Arson
Comp Clear Camp Clear Camp Clear Camp Clear
459 90 2,686 1,072 255 25 7 2 618 143 3,082 1,197 287 24 9 0 568 142 3,105 1,136 281 46 13 2 504 62 2,925 1,040 382 54 13 4 488 84 2,462 894 332 49 16 2 273 63 2,173 801 204 19 4 0
-26·/. -37-1. -13·/a -IOs/. -11% . 4% -22% Dla
698 188 1,0lD 277 44 14 2 1 643 152 1,090 275 45 8 8 3 618 119 1,120 268 68 21 2 1 493 95 911 235 71 22 0 0 506 138 856 206 38 9 3 2 532 103 824 178 44 12 4 2 9% :1:4-1. -7% 1-1. -2% 75·/0 -75-1. -67-1.
1 1 2 1 0 0 0 0 1 0 2 1 0 0 0 0 0 0 0 0 1 0 0 0 0 0 2 0 1 1 0 0 0 0 1 0 1 1 0 0 0 0 0 0 0 0 0 0
0% nJa 0-1. 0% nJa nJa nJB Dia
1 0 0 0 1 1 0 0 0 0 3 0 0 0 1 ~ 0 0 0 0 3 1 2 1 1 5 0 2 2 0 0 0 0 2 1 5 5 0 0 0 0 4 0 1 0 1 0
nJa nJa -100% nJa nJa nla -100"/0 nJa
0 0 2 1 3 2 0 0 0 0 0 0 0 0 0 0 0 0 0 0 1 0 0 0 0 0 1 0 0 0 0 0 0 0 0 0 3 2 0 0 0 0 2 1 1 1 0 0
nJ. nJa nla nJa nJa n/,. nla nJa
41 3 105 11 13 2 1 0 67 18 137 15 8 0 0 0 85 15 152 19 18 5 1 1 54 13 91 17 15 3 2 0 88 21 186 51 27 2 2 0
135 31 519 143 60 12 6 2 -39·/. -83-1~ -23·/. -27~/. 63% nJa nJa nJa
606 143 998 260 88 20 2 2 613 145 1,131 226 93 20 5 2 500 79 1,040 194 92 19 3 3 416 87 887 197 103 30 3 0 442 115 937 209 116 29 0 0 489 118 915 198 93 22 0 0 -1% -1% -12-1. 15-1. -5% 0% -60% 0-1.
644 113 4,023 1,687 442 37 10 2 841 181 4,318 1,661 467 28 12 0 886 226 4,574 1,699 499 70 17 3 758 108 4,382 1,620 538 7i 18 ;1 761 139 3,976 1,514 575 68 23 631 132 4,247 1,571 417 45 14 Dl~ -23% -38·,4 -7-1. 2·/. -5% 32·/. -17·/0
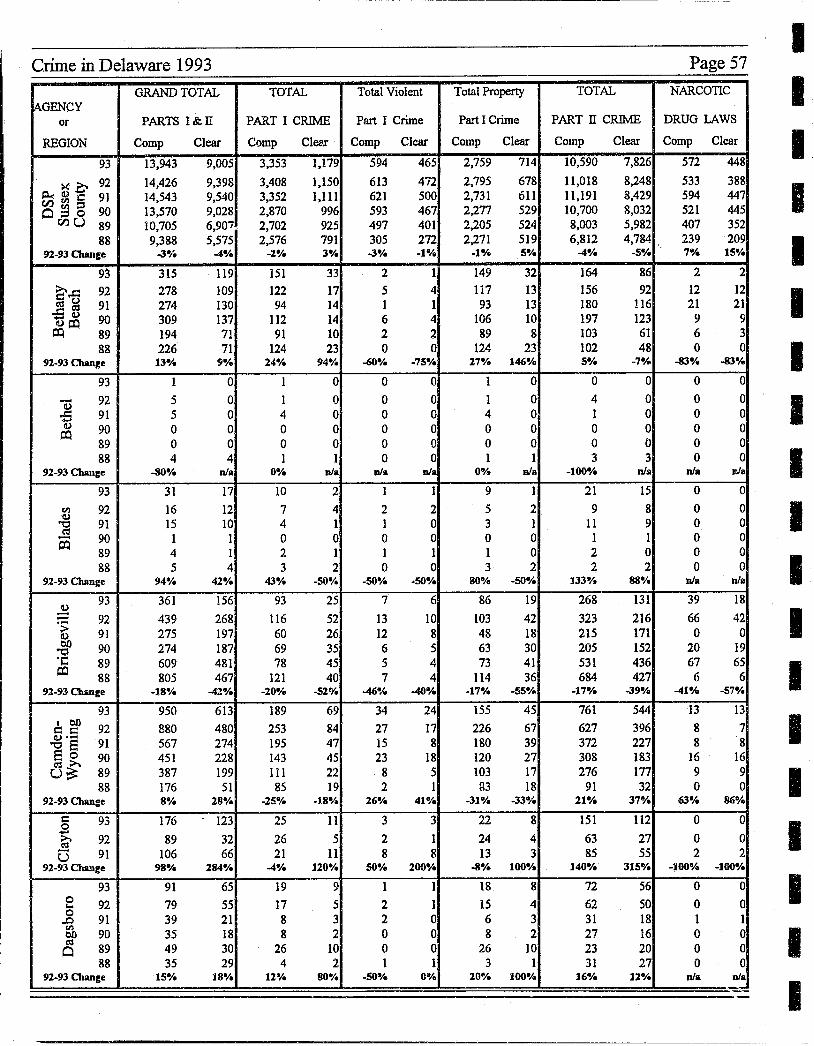
Crime in Delaware 1993
GRAND TOTAL TOTAL Total Violent IAGENCY
or PARTS I&II PART I CRIME Part I Crime
REGION Camp Clear Comp Clear Camp Clear
93 13,943 9,005 3,353 1,179 594 465
~~O 92 14,426 9,398 3,408 1,150 613 472
Cl)rJ'lC 91 14,543 9,540 3,352 1,111 621 500 O~5 90 13,570 9,028 2,870 996 593 467
Cl)U 89 10,705 6,907 .. 2,702 925 497 401 88 9,388 5,575 2,576 791 305 272
92-93 C!wJee ..J~. 4% -2~. 3~. ..J·/o -1 8/0
93 315 119 151 33 2 1
S~ 92 278 109 122 17 5 4 COO 91 274 130 94 14 1 1 .s~ 90 309 137 112 14 6 4 &;lj:p
89 194 71 91 10 2 2 88 226 71 124 23 0 0
92-93 Change 13-/. 9"/" 24~0 940/. -60-/0 -75%
93 1 0 1 0 0 0
- 92 5 0 1 0 0 0 Q) ..s 91 5 0 4 0 0 0 (I) 90 0 0 0 0 0 0 ~
89 0 0 0 0 0 0 88 4 4 1 1 0 0
92-93 Change -80% nla 0% nla nla nla
93 31 17 10 2 1 1 (/) 92 16 12 7 4 2 2 (I)
91 . 15 10 4 0 "0 1 1 CO
90 1 1 0 0 0 0 .-~ 89 4 1 2 1 1 1
88 5 4 3 2 0 0 92-93 Clumge 94·/. 42% 43% -50% -50% ·50%
~ 93 361 156 93 25 7 6 - 92 439 268 116 52 13 10 --> 91 275 197 60 26 12 8 (I)
Ol) 90 274 187 69 35 6 5 "0 or:: 89 609 481 78 45 5 4 ~ 88 805 467 121 40 7 4
92-93 Chance -18% 42% -20"/. -52~/o 46""" -408/.
93 950 613 189 69 34 24 100 92 880 480 253 84 27 17 c:: c::
(1)--91 567 274 195 47 15 8 "OS
So 90 451 228 143 45 23 18 8~ 89 387 199 III 22 8 5
88 176 51 85 19 2 I 92·93 Chance 8% 28% -25~. -18·/. 26~. 41%
c 93 176 123 25 11 3 3 0
~ 92 89 32 26 5 2 1 (] 91 106 66 21 11 8 8
92·93 Change 98~. 284~. 4% 120% S08;' 200"/.
93 91 65 19 9 1 1 0 92 79 55 17 5 2 1 .... 0
91 39 21 8 3 2 0 .D rJ'l
90 35 18 8 2 0 0 Ol) CO
89 49 30 26 10 0 0 Cl 88 35 29 4 2 1 1
92-93 Change IS~. 18% 12% 80·/. -SO'l. 6%
Total Property TOTAL
Part I Clime PART II CRIME
Camp Clear Camp Clear
2.759 714 10,590 7,826
2,795 678 11,018 8,248 2,731 611 11,191 8,429 2,277 529 10,700 8,032 2,205 524 8,003 5,982 2,271 519 6,812 4,784
-1·"" 5~. 4·"" -5""" 149 32 164 86 117 13 156 92 93 13 180 116
106 10 197 123 89 8 103 61
124 23 102 48 27% 146% 5% -7·/.
1 0 0 0 1 0 4 0 4 0 1 0 0 0 0 0 0 0 0 0 I 1 3 3
0% nla -100% nla
9 1 21 15 5 2 9 8 3 1 11 9 0 0 I 1 1 0 2 0 3 2 2 2
80% -soo/. 133'/. 88~.
86 19 268 131
103 42 323 216 48 18 215 171 63 30 205 152 73 41 531 436
114 36 684 427 -17% -55% -17% ..J9%
155 45 761 544
226 67 627 396 180 39 372 227 120 27 308 183 103 17 276 177 33 18 91 32
-31% -33~. 218/. 37'Y.
22 8 151 112 24 4 63 27 13 3 85 55
.so;. 100% 140·"" 3158/.
18 8 72 56 15 4 62 50 6 3 31 18 8 2 27 16
26 10 23 20 3 1 31 27
20'Y. l00~. 16% 12"/.
Page 57
NARCOTIC
DRUG LAWS
Camp Clear
572 448
533 388 594 447 521 445 407 352 239 209 7·"" 150/.
2 2 12 12 21 21 9 9 6 3 0 0
-83."" -83%
0 0 0 0 0 0 0 0 0 0 0 0
nI. nla
0 0 0 0 0 0 0 0 0 0 0 0
nla nle
39 18 66 42 0 0
20 19 67 65 6 6
41·"" -57·/.
13 13
8 7 8 8
16 16 9 9 0 0
63·"" 86-"" 0 0 0 0 2 2
-100% -100%
0 0 0 0 1 1 0 0 0 0 0 0
nI. nla :::.-::
I I I I I I I I I I I I I I I I I I I
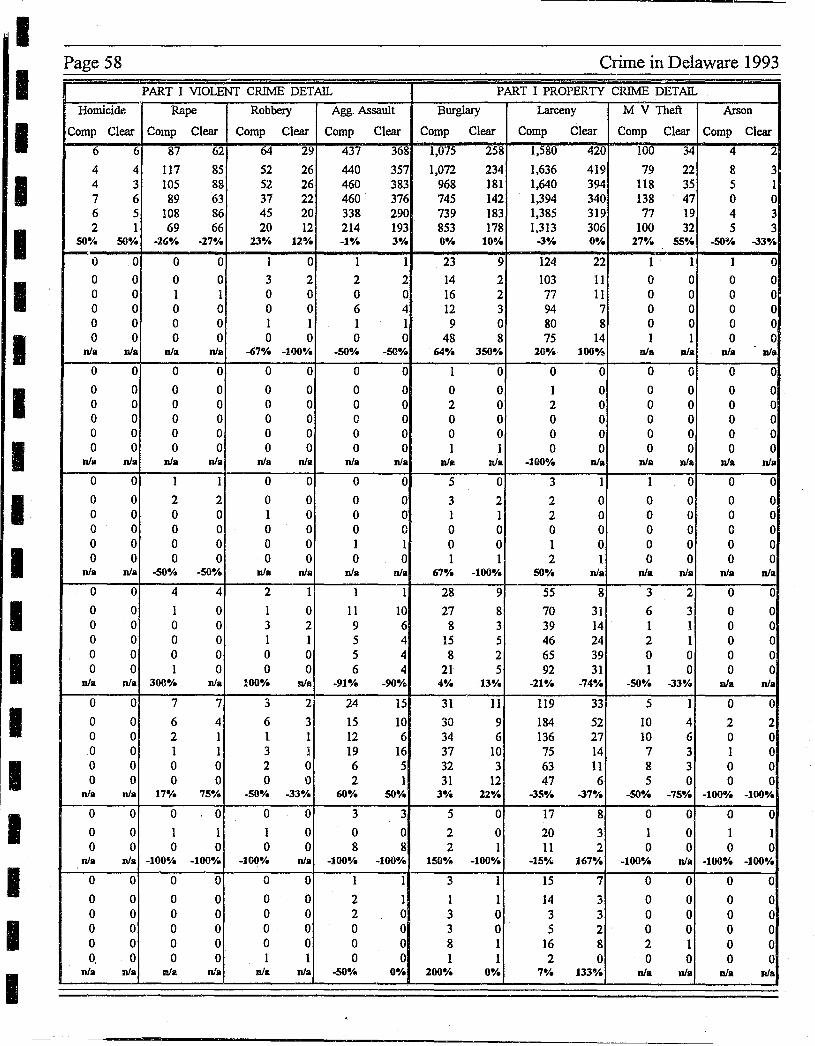
I I I I I I I I I I I I I I I I I I I
Page 58
Homicide
Comp Clear
6 6
4 4 4 3 7 6 6 5 2 1
so-;. 50%
0 0
0 0 0 0 0 0 0 0 0 0
nls nla
0 0
0 0 0 0 0 0 0 0 0 0
nla nla
0 0
0 0 0 0 0 0 0 0 0 0
nla nla
0 0
0 0 0 0 0 0 0 0 0 0
nla nla
0 0
0 0 0 0 0 0 0 0 0 0
nla nla
0 0
0 0 0 0
nla nla
0 0
0 0 0 0 0 0 0 0 0 0
nla nla
-PART I VIOLENT CRIME DETAIL
Rape Robbery Agg. Assault
Comp Clear Comp Clear Comp Clear
87 62 64 29 437 368
117 85 52 26 440 357 105 88 52 26 460 383 89 63 37 22 460 376
108 86 45 20 338 290 69 66 20 12 214 193
-26·/. -27-;. 23·/. 12% -10/. 3·;'
0 0 I 0 1 1
0 0 3 2 2 2 1 1 0 0 0 0 0 0 0 0 6 4 0 0 1 1 1 1 0 0 0 0 0 0
nla nlla -670/. -100°/. -50% -SO-;.
0 0 0 0 0 0
0 0 0 0 0 0 0 0 0 0 0 0 0 0 0 0 0 0 0 0 0 0 0 0 0 0 0 0 0 0
nla nla nls nls nla nla
1 1 0 0 0 0
2 2 0 0 0 0 0 0 1 0 0 0 0 0 0 0 0 0 0 0 0 0 1 1 0 0 0 0 0 0
-SO-;. -SO-;. nla nla nla nla
4 4 2 1 1 1
1 0 1 0 11 10 0 0 3 2 9 6 0 0 1 1 5 4 0 0 0 0 5 4 1 0 0 0 6 4
300-;0 nla 100°/. niB -91 0;' -90-;0
7 7 3 2 24 15
6 4 6 3 15 10 2 1 1 1 12 6 1 1 3 I 19 16 0 0 2 0 6 5 0 0 0 0 2 1
17·/. 75·/. -SO-;. -33% 60°/. SO·;.
0 0 0 0 3 3
1 1 I 0 0 0 0 0 0 0 8 8
-100-/. -100-;. -100·/. nla -100-;. -10{Wo
0 0 0 0 1 1
0 0 0 0 2 1 0 0 0 0 2 0 0 0 0 0 0 0 0 0 0 0 0 0 0 0 1 1 0 0
nla nls nI. nla -so·;. 0%
Crime in Delaware 1993
PART I PROPERTY CRIME DETAIL
Burglary Larceny M V Theft Arson
Comp Clear Comp Clear Comp Clear Comp Clear
1,075 258 1,580 420 100 34 4 2
1,072 234 1,636 419 79 22 8 3 968 181 1,640 394 118 35 5 1 745 142 1,394 340 138 47 0 0 739 183 1,385 319 77 19 4 3 853 178 1,313 306 100 32 5 3 0·/. 1081. -3% 0·/. 27-;~ 55% -SO~A. -33-;.
23 9 124 22 1 1 1 0
14 2 103 11 0 0 0 0 16 2 77 11 0 0 0 0 12 3 94 7 0 0 0 0 9 0 80 8 0 0 0 0
48 8 75 14 1 1 0 0 64-;e 3SO-;. 20% l00-;e DIs nla nla nls
1 0 0 0 0 0 0 0
0 0 1 0 0 0 0 0 2 0 2 0 0 0 0 0 0 0 0 0 0 0 0 0 0 0 0 0 0 0 0 0 I 1 0 0 0 0 0 0
nla nla -1000/. nla nla nla nla nla
5 0 3 1 1 0 0 0
3 2 2 0 0 0 0 0 1 1 2 0 0 0 0 0 0 0 0 0 0 0 0 0 0 0 1 0 0 0 0 0 1 1 2 1 0 0 0 0
67·;' -100-;. SO% nla nla nla nla nla
28 9 55 8 3 2 0 0
27 8 70 31 6 3 0 0 8 3 39 14 1 1 0 0
15 5 46 24 2 1 0 0 8 2 65 39 0 0 0 0
21 5 92 31 1 0 0 0 4% 13-;0 -21°/. -74% -SO% -33-;. nla nla
31 11 119 33 5 1 0 0
30 9 184 52 10 4 2 2 34 6 136 27 10 6 0 0 37 10 75 14 7 3 1 0 32 3 63 11 8 3 0 0 31 12 47 6 5 0 0 0
3-;. 22-/. -35°/. -37-;. -SOO/. -75-;. -100% -100%
5 0 17 8 0 0 0 0
2 0 20 3 1 0 1 1 2 I 11 2 0 0 0 0
ISO·;' -100-/. -IS-; .. 167"/. -100"A. nla -100·;' -100·;'
3 1 15 7 0 0 0 0
1 1 14 3 0 0 0 0 3 0 3 3 0 0 0 0 3 0 5 2 0 0 0 0 8 1 16 8 2 1 0 0 1 1 2 0 0 0 0 0
200-;. 0°/. 7"/. 133"/. nla nla nla nla

Crime in Delaware 1993
GRAND TOTAL TOTAL Total Violent IAGENCY
or PARTS I&II PART I CRIME Part I Crime
REGION Comp Clear Comp Clear Comp Clear
93 292 172 74 17 11 6 11) 92 227 139 51 22 18 15 ~c 91 254 138 65 15 5 5 co-- 90 201 121 44 12 5 3 ~U Q 89 223 104 41 12 6 6
88 259 148 48 12 6 5 92-93 Change 29w/. 24-1. 45-1. -23-10 -39·/. -60%
93 237 66 95 13 3 0 I-c 92 369 160 104 24 8 4 co
91 234 107 73 15 9 4 e - 90 337 178 76 22 10 8 <U Q 89 208 122 52 14 8 3
88 312 187 57 17 4 1 92-93 Change -36% -59$/. -9% -46-1. -'3% -100%
93 551 230 159 15 7 3 >.~ 92 511 187 156 23 9 7 <U 0
91 653 383 175 28 11 5 ::>~ <u11) 90 353 138 123 12 6 1 Q~
89 326 101 153 13 4 0 88 217 60 130 22 7 6
92-93 Change S% 23% 2G;' -35·/. -220/. -578/.
93 8,855 5,543 2,383 1,023 259 179 I-c 92 10,400 6,619 2,789 1,197 293 198 11) 91 9,939 5,558 2,777 993 209 110 >-0 90 9.027 5,265 2,338 902 186 120 Q
89 8,044 4,685 2,366 833 214 128 88 6,951 3,612 2,291 782 182 94
92-S3 Ciwtg/l -15% -160;8 -15·/. -15% -12°;' -10%
93 1,076 644 205 47 37 23 11) 92 1,270 677 252 59 33 17 I-c 11) 91 1,145 613 233 56 24 18 e 90 1,038 580 189 34 27 15 rIl
~ 89 766 414 167 37 21 14 88 985 377 182 40 21 17
91-93 Change -15·/. -5% -198/. -10·/. 12% 35%
93 93 40 22 6 5 5
c:: 92 81 35 19 7 6 5 0 91 47 16 13 0 0 0 ..... - 90 7 5 4 2 1 1 11)
~ 89 29 22 4 0 0 0 88 13 6 5 3 1 1
92-93 Change 15-1. 148/. 16°/. -14-1. -178/. 0%
-93 85 28 21 1 0 0
..:.t! 92 54 26 19 5 5 5 0"0 -- c:: 91 30 26 6 3 1 1 ~ro c::- 90 4 3 4 3 2 1 <u rIl f,J..- 89 4 4 0 0 0 0
88 3 3 1 1 0 0 92-':J3 Chan~>I! 57% so/. 11·/. -80.;' -100·/. -100·/.
93 37 19 13 4 0 0 "0 92 12 3 6 0 0 0 I-c
tS 91 9 3 2 1 0 0
~ 90 54 34 14 7 2 2
~ 89 81 55 21 8 3 2 88 2 0 0 0 0 0
92-930umge 10So/. 533-1. 117-1. nla nla nla
~
Total Property TOTAL
Part I Crime PART II CRIME
Comp Clear Comp Clear
63 11 218 155 33 7 176 117 60 10 189 123 39 9 157 109 35 6 182 92 42 7 211 136
91°/. 57''10 24% 32%
92 13 142 53 96 20 265 136 64 11 161 92 66 14 261 156 44 11 156 108 53 16 255 170
-4% -35-1. -460,4 -61·;'
152 12 392 215 147 16 355 164 164 23 478 355 117 11 230 126 149 13 173 88 123 16 87 38 3·/0 -lS~'ot 10-1. 31·/.
2,124 844 6,472 4,520 2,496 999 7,611 5,422 2,568 883 7,162 4,565 2,152 782 6,689 4,363 2,152 705 5,678 3,852 2,109 688 4,660 2,830 -15% -16% -IS'Y. -17-1.
168 24 871 597 219 42 1,018 618 209 38 912 557 162 19 849 546 146 23 599 377 161 23 803 337
-23% -43°;' -148/. -3-1.
17 1 71 34 13 2 62 28 13 0 34 16 3 1 3 3 4 0 2S 22 4 2 8 3
318/. -50%1 15°/. 21·;'
21 1 64 27 14 0 35 21 5 2 24 23 2 2 0 0 0 0 4 4 1 1 2 2
50% nla 83°;' 29°/.
13 4 24 15 6 0 6 3 2 1 7 2
12 5 40 27 18 6 60 47 0 0 2 0
1170;. nla 300% 400°;'
Page 59
NARCOTIC
DRUG LAWS
Comp CleI!r
4 4 9 fj
10 10 1 1 2 2 2 2
-56% -56%
0 0 2 1 0 0 S 5
13 13 43 43
-100·;' -lOiW.
34 34 12 10 42 33 13 13 8 8 2 2
183·/. 240%
401 372 456 425 545 451 491 414 503 434 368 331
-12°;' -11%
23 22 55 54 49 48 67 67 28 28 11 10
-58% -59·;'
0 0 1 1 0 0 2 2 6 6 0 0
-100% -100-1.
6 6 10 10 2 2 0 0 0 0 0 0
-40% -40%
0 0 0 0 0 0 0 0 0 0 0 0
nI. nla
«
I I I I I I I I I I I I I I I I I I I
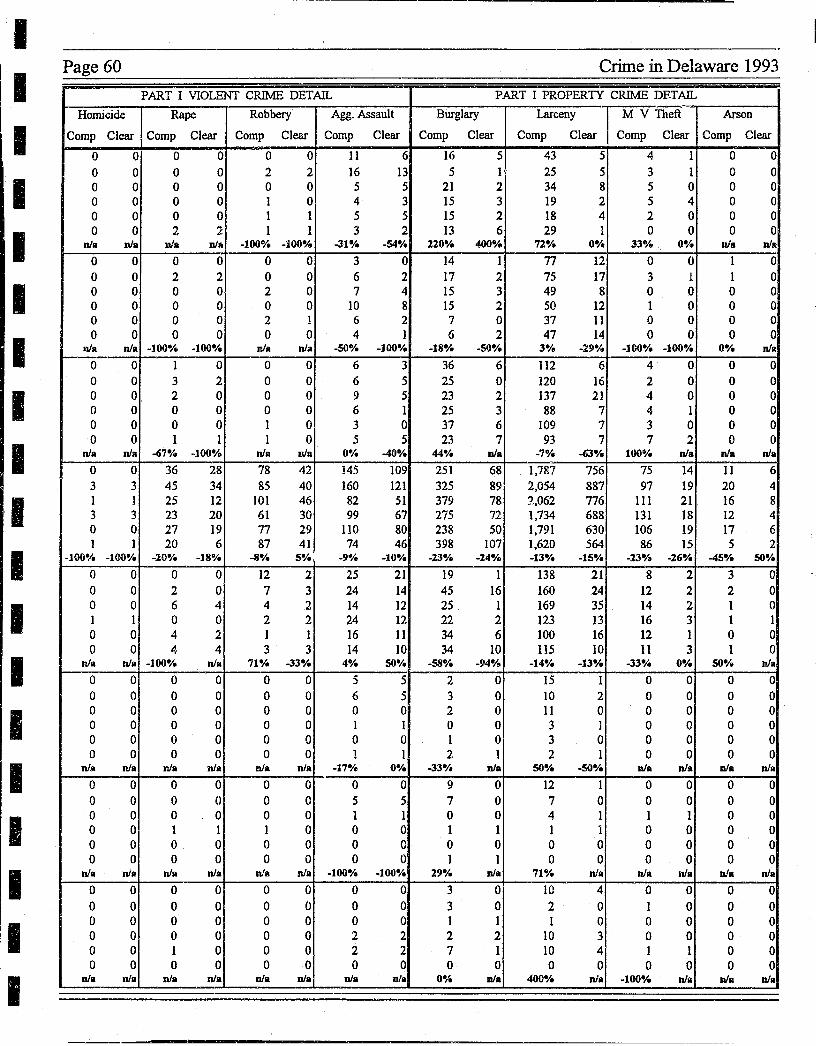
-----------------------------------------------------.----------------------------
I I I I I I I I I I I I I I I I I I I
Page 60 Crime in Delaware 1993
PART I VIOLENT CRIME DETAll.. PART I PROPERTY CRIME DETAll..
Homicide Rape Robbery Agg. Assault Burglary Larceny ~ Theft Arson
Comp Clear Comp Clear Comp Clear Comp Clear Comp Clear Comp Clear Camp Clear Comp Clear
0 0 0 0 0 0 11 6 16 5 43 5 4 I 0 0 0 0 0 0 2 2 16 13 5 1 25 5 3 1 0 0 0 0 0 0 0 0 5 5 21 2 34 8 5 0 0 0 0 0 0 0 1 0 4 3 15 3 19 2 5 4 0 0 0 0 0 0 1 1 5 5 15 2 18 4 2 0 0 0 0 0 1. 2: 1 1 3 2 13 6 29 1 0 0 0 0
nla nla Dla Dla _100°;' -100% -31";' -54-1. 220-1. 400% 72";' 0-1. 33% . 0";' ula DIs
0 0 0 0 0 0 3 0 14 1 77 12 0 0 1 0 0 0 2 2 0 0 6 2 17 2 75 17 3 I 1 0 0 0 0 0 2 0 7 4 15 3 49 8 0 0 0 0 0 0 0 0 0 0 10 8 15 2 50 12 1 0 0 0 0 0 0 0 2 1 6 2 7 0 37 11 0 0 0 0 0 0 0 0 0 0 4 1 6 2 47 14 0 0 0 0
Q/a nla -100"1. -100"1. nla nla _SO°;' -100-1. -18-1" -50% 3";' -29"/a -100% -100"1" 0% nla
0 0 1 0 0 0 6 3 36 6 112 6 4 0 0 0 0 0 3 2 0 0 6 5 25 0 120 16 2 0 0 0 0 0 2 0 0 0 9 5 23 2 137 21 4 0 0 0 0 0 0 0 0 0 6 1 25 3 88 7 4 1 0 0 0 0 0 0 1 0 3 0 37 6 109 7 3 0 0 0 0 0 1 1 1 0 5 5 23 7 93 7 7 2 0 0
nla nla -67"fa -100-10 nI'll via 00;' -40e;. 44-1. nla -7% -6)-1. 100% nla nla nla
0 0 36 28 78 42 145 109 251 68 1,7&7 756 75 14 11 6 3 3 45 34 85 40 160 121 325 89 2,054 887 97 19 20 4 1 1 25 12 101 46 82 51 379 78 1.062 776 111 21 16 8 3 3 23 20 61 30 99 67 275 72 1,734 688 131 18 12 4 0 0 27 19 77 29 110 80 238 50 1,791 630 106 19 17 6 1 1 20 6 87 41 74 46 398 107 1,620 564 86 15 5 2
-100% -100-1. -20-1. -18'11. -8-1. S·I. -9°1. -10-1. -23·1. -24·/e -13-1. -15-1. -23-1~ -26% -45% 50-1.
0 0 0 0 12 2 25 21 19 1 138 21 8 2 3 0 0 0 2 0 7 3 24 14 45 16 160 24 12 2 2 0 0 0 6 4 4 2 14 12 25 1 169 35 14 2 1 0 1 1 0 0 2 2 24 12 22 2 123 13 16 3 1 1 0 0 4 2 1 1 16 11 34 6 100 16 12 1 0 0 0 0 4 4 3 3 14 10 34 10 115 10 11 3 1 0
nla nla -100-1. nla 71·;' -33% 4-1" SO";. -58% -94% -14-1" -13"1. -33"1. 0";' SOe;a nla
0 0 0 0 0 0 5 5 2 0 15 I 0 0 0 0 0 0 0 0 0 0 6 5 3 0 10 2 0 0 0 0 0 0 0 0 0 0 0 0 2 0 11 0 0 0 0 0 0 0 0 0 0 0 ] 1 0 0 3 1 0 0 0 0 0 0 0 0 0 0 0 0 1 0 3 0 0 0 0 0 0 0 0 0 0 0 1 I 2 1 2 1 0 0 0 0
nla nla nla nI& nla nlll -17-1. 0-1. -33";' nla SO";. -SO% nla nla nla nlll
0 0 0 0 0 0 0 0 9 0 12 1 0 0 0 0 0 0 0 0 0 0 5 5 7 0 7 0 0 0 0 0 0 0 0 0 0 0 1 1 0 0 4 1 1 1 0 0 0 0 1 1 1 0 0 0 1 1 1 1 0 0 0 0 0 0 0 0 0 0 0 0 0 0 0 0 0 0 0 0 0 0 0 0 0 0 0 0 1 1 0 0 0 0 0 0
nla nla nla nla nla WIl -100-1. -100% 29% nla 71'11" nla nla nla nla nla
0 0 0 0 0 0 0 0 3 0 10 4 0 0 0 0 0 0 0 0 0 0 0 0 3 0 2 0 I 0 0 0 0 0 0 0 0 0 0 0 1 I 1 0 0 0 0 0 0 0 0 0 0 0 2 2 2 2 10 3 0 0 0 0 0 0 1 0 0 0 2 2 7 1 10 4 1 1 0 0 0 0 0 0 0 0 0 0 0 0 0 0 0 0 0 0
nla nla nfa nla nla nla nla nla O~'e nla 400"1. nla -100% nli! nla 11111.
-----------------------------------------------
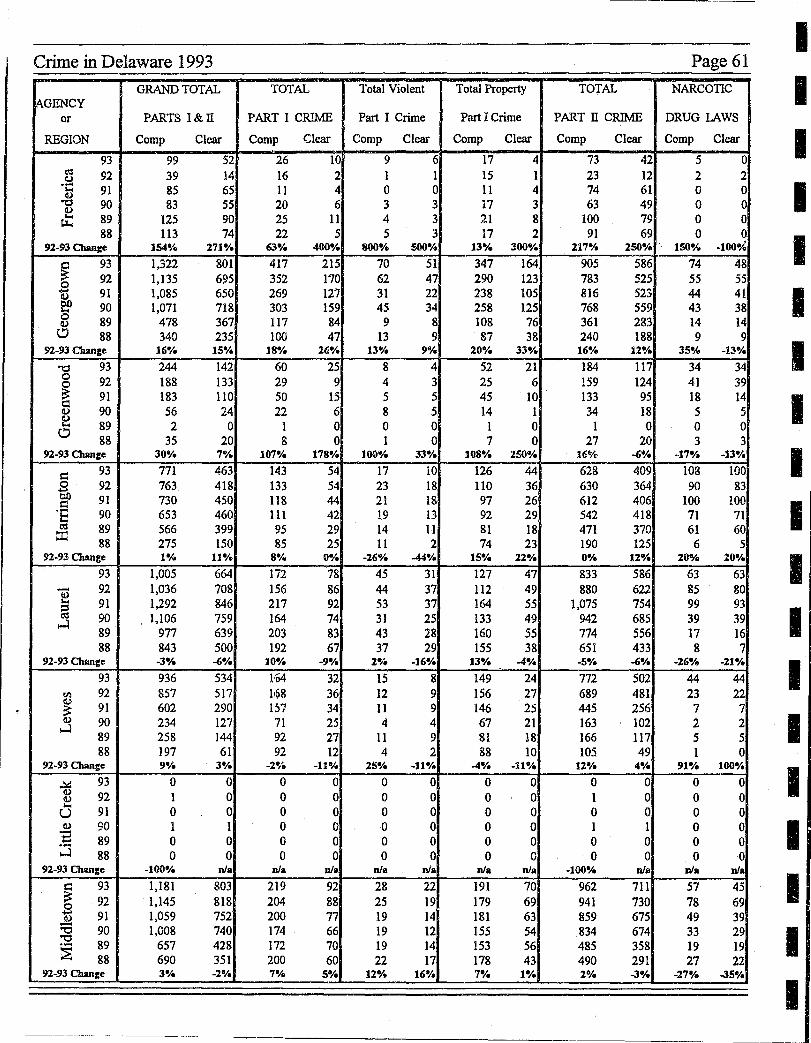
Crime in Delaware 1993
GRAND TOTAL TOTAL Total Violent [AGENCY
or PARTS I&n PART I CRIME Part I Crime
REGION Comp Clear Comp Clear Comp Clear
93 99 52 26 10 9 6 ~ 92 39 14 16 2 I I c.J ....
91 85 65 11 4 0 0 ""' GJ "t:I 90 83 55 20 6 3 3 ~ 89 125 90 25 11 4 3 t1..
88 113 74 22 5 5 3 92-93 C'banj:e 154% 271% 63·/. 400"1. BOO"I. 500%
~ 93 1,322 801 417 215 70 51 92 1,135 695 352 1"/0 62 47 .s 91 1,085 650 269 127 31 22 GJ
e!> 90 1,071 718 303 159 45 34 0 89 478 367 117 S4 9 8 GJ
<.:J 88 340 235 100 47 13 9 92-93 Ciuml!e 16"/. 15% 18"1. 26·/. 13~~ 9"/"
'"d 93 244 142 60 25 8 4 0 92 188 133 29 9 4 3 ~ 91 183 110 50 15 5 5 = GJ 90 56 24 22 6 8 5 GJ
""' 89 2 0 1 0 0 0 c.? 88 35 20 8 0 1 0 92-93 Cbanz:e 30% 7°/. 107"1. 178% 100"1. 33·/.
t:: 93 771 463 143 54 17 10 0 92 763 418 133 54 23 18 ..... 01) 91 730 450 118 44 21 18 Cl ·e 90 653 460 III 42 19 13 ~ 89 . 566 399 95 29 14 11 ~ 88 275 ISO 85 25 11 2
92-93 Change 1·/. U·/e 8·/~ 0·1. -268/. -44"1.
93 1,005 664 172 78 45 31 - 92 1,036 708 156 86 44 37 ~ 91 1,292 846 217 92 53 37 ::3 ~ 90 1,106 759 164 74 31 25 ~
89 977 639 203 83 43 28 88 843 500 192 67 37 29
92-93 Clumz:e -3"1. -6./. 10·/. -9·1. 2% -16"1.
93 936 534 11>4 32 15 8 til 92 857 517 1158 36 12 9 11}
91 602 290 IS7 34 11 9 ~ GJ 90 234 127 71 25 4 4 ....:l
89 258 J44 92 27 11 9 88 J.97 61 92 12 4 2
92-93 Chanz:e 9·/. 3"1. -2~~ -11"/. 25"/. -11·/.
~ 93 0 0 0 0 0 0 GJ 92 1 0 0 0 0 0 Q)
""' 91 0 0 0 0 0 0 U GJ 90 1 1 0 0 0 0 -t:: 89 0 0 0 0 0 0 .-....:l 88 0 0 0 0 0 0
92-93 CiwJ=e -100"/. nla nla nla nla nla
~ 93 1,181 803 219 92 28 22
.s 92 1,145 818 204 88 25 19 Q,) 91 1,059 752 200 77 19 14 - 90 1,008 740 174 12 "t:I 66 19
"t:I
:§ 89 657 428 172 70 19 14 88 690 351 200 60 22 17
92-93 Clumz:e 3·/. _2°/. 7·;" 5% 12°~ 168/.
Total Property TOTAL
Part I Crime PART II CRIME
Comp Clear Comp Clear
17 4 73 42 15 1 23 12 11 4 74 61 17 3 63 49 2.1 8 100 79 17 2 91 69
13% 300% 217·~ 250·", '.
347 164 905 586 290 123 783 525 238 105 816 523 258 125 768 559 108 76 361 283 87 38 240 188
20·/. 33·/. 16·/. 12°/.
52 21 184 117 25 6 159 124 45 10 133 95 14 1 34 18 1 0 1 0 7 0 27 20
108% 2500/. 16~1" -68/.
126 44 628 409 110 36 630 364 97 26 612 406 92 29 542 418 81 18 471 370 74 23 190 125
15"1. 22·;' 0·/. 12%
127 47 833 586 112 49 880 622 164 55 1,075 754 133 49 942 685 160 55 774 556 155 38 651 433
138/. -4"1. -5"1 .. -6./.
149 24 772 502 156 27 689 481 146 25 445 256 67 21 163 102 81 18 166 117 88 10 105 49
-4"1. -11·/~ 128/. 4·/.
0 0 0 0 0 0 1 0 0 0 0 0 0 0 1 1 0 0 0 0 0 0 0 0
nla nla -100·/. nla
191 70 962 711 179 69 941 730 181 63 859 675 155 54 834 674 153 56 485 358 178 43 490 291 7·/. 1·/. 2~/. -38
/.
Page 61
NARCOTIC
DRUG LAWS
Comp Clear
5 0 2 2 0 0 0 0 0 0 0 0
150% -100~' 74 48 55 55 44 41 43 38 14 14 9 9
35% -lJ·~
34 34 41 39 18 14 5 5 0 0 3 3
-17·~ -13·~
108 100 90 83
100 100 71 71 61 60 6 5
20% 20·~
63 63 85 80 99 93 39 39 17 16 8 7
-26·/0 -21%
44 44 23 22 7 7 2 2 5 5 1 0
91·/. l00·~
0 0 0 0 0 0 0 0 0 0 0 0
wa nla
57 45 78 69 49 39 33 29 19 19 27 22
-27·~ -358/.
I I I I I I I I I I I I I I I I I I I
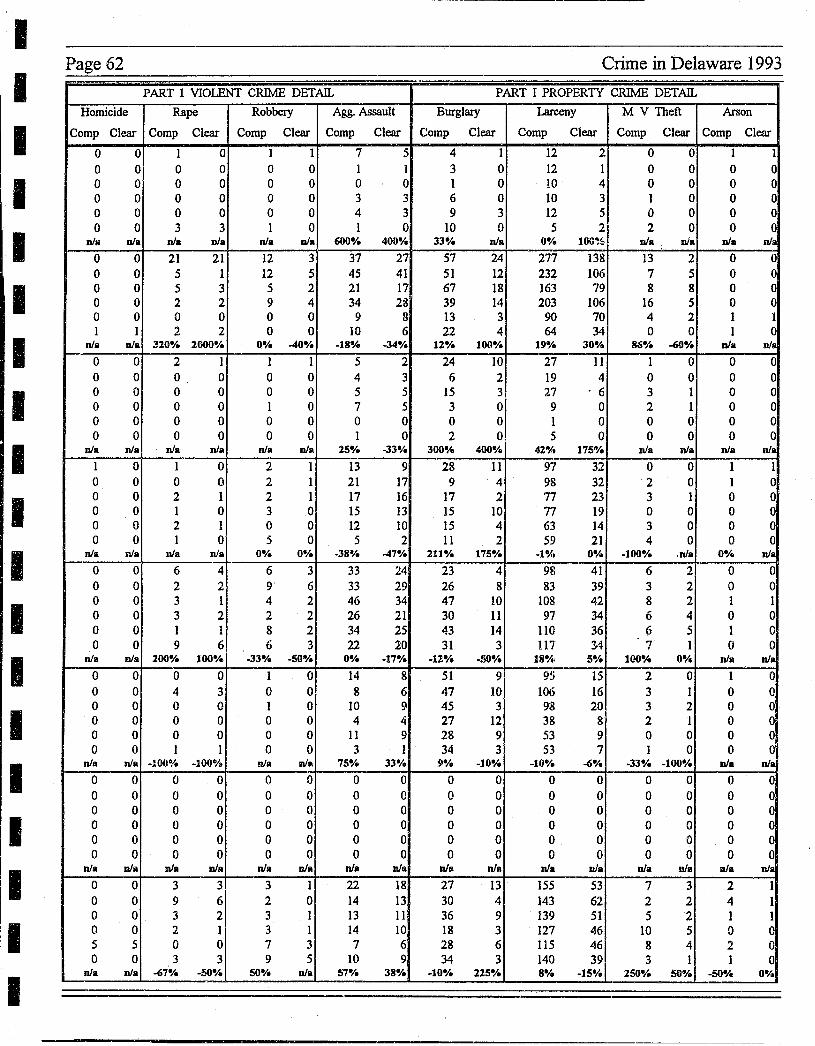
I I I I I I I I I I I I I I I I
Page 62
Homicide
Comp Clear
0 0 0 0 0 0 0 0 0 0 0 0
nix nla
0 0 0 0 0 0 0 0 0 0 1 I
nla nla i---,
0 0 0 0 0 0 0 0 0 0 0 0
nla nla
1 0 0 0 0 0 0 0 0 0 0 0
nla nla
0 0 0 0 0 0 0 0 0 0 0 0
nla FIla
0 0 0 0 0 0 0 0 0 0 0 0
nla nla
0 0 0 0 0 0 0 0 0 0 0 0
nJa nla
0 0 0 0 0 0 0 0 5 5 0 0
nla nla
PART I VIOLENT CRIME DETAIL
Rape Robbery Agg. Assault
Comp Clear Comp Clear Comp Clear
1 0 I 1 7 5 0 0 0 0 1 1 0 0 0 0 0 0 0 0 0 0 3 3 0 0 0 0 4 3 3 3 1 0 1 0
nI. nI. nla nJa 600~, 40110/.
21 21 12 3 37 27 5 1 12 5 45 41 5 3 5 2 21 17 2 2 9 4 34 23 0 0 0 0 9 8 2 2 0 0 10 6
320% 2000'/, 0"/, -40% -18% -34"/,
2 1 1 1 5 2 0 0 0 0 4 3 0 0 0 0 5 5 0 0 1 0 7 5 0 0 0 0 0 0 0 0 0 0 1 0
nla nla nla nJa 25'/, -330;'
1 0 2 1 13 9 0 0 2 1 21 17 2 1 2 1 17 16 1 0 3 0 15 13 2 1 0 0 12 10 I 0 5 0 5 2
nla nla 0';' 0% -38~, -47%
6 4 6 3 33 24 2 2 9 6 33 29 3 1 4 2 46 34 3 2 2 2 26 21 1 1 8 2 34 25 9 6 6 3 22 20
200% 1000/,. -33~. -so% O~, -17%
0 0 1 0 14 8 4 3 0 0 8 6 0 0 1 0 10 9 0 0 0 0 4 4 0 0 0 0 11 9 1 1 0 0 3 1
-1000/, -100% !IIa nI. 75'/. 33%
0 0 0 0 0 0 0 0 0 0 0 0 0 0 0 0 0 0 0 0 0 0 0 0 0 0 0 0 0 0 0 0 0 0 0 0
nI. nla nla nJa nla nla
3 3 3 1 22 18 9 6 2 0 14 13 3 2 3 1 13 11 2 1 3 1 14 10 0 0 7 3 7 6 3 3 9 5 10 9
-67~, -50% so·/, ula 57% 38~.
Crime in Delaware 1993
PART I PROPERTY CRIME DETAIL
Burglary Larceny M V Theft Arson
Comp Clear Comp Clear Comp Clear Comp Clear
4 1 12 2 0 0 I 1 3 0 12 1 0 0 0 0 1 0 10 4 0 0 0 0 6 0 10 3 I 0 0 0 9 3 12 5 0 0 0 0
10 0 5 2 2 0 0 0 33~, nla 0% l00~~ nla nla nI. nJa
57 24 277 138 13 2 0 0 51 12 232 106 7 5 0 (J
67 18 163 79 8 8 0 (J
39 14 203 106 16 5 0 0 13 3 90 70 4 2 1 1 22 4 64 34 0 0 I 0
12'/0 100';' 19% 30'/. 86~, -60~, nI. nla
24 10 27 11 1 0 0 0 6 2 19 4 0 0 0 0
15 3 27 . 6 3 I 0 0 3 0 9 0 2 1 0 0 0 0 1 0 0 0 0 0 2 0 5 0 0 0 0 0
300'/0 4000/0 42',I,i 175'% nla ula nla nla
28 11 97 32 0 0 1 1 9 4 98 32 2 0 1 0
17 2 77 23 3 1 0 0 15 10 n 19 0 0 0 0 15 4 63 14 3 0 0 0 11 2 59 21 4 0 0 0
lIl'/, 175';' -1% O~. -100% .nJa 0% nla
23 4 98 41 6 2 0 0 26 8 83 39 3 2 0 0 47 10 108 42 8 2 1 1 30 11 97 34 6 4 0 0 43 14 110 36 6 5 1 0 31 3 117 34 7 1 0 0
-12';' -SO~, 18';', 5~" 100'/, O~. nI. nJa -51 9 95 15 2 0 1 0
47 10 106 16 3 1 0 0 45 3 98 20 3 2 0 0 27 12 38 8 2 1 0 0 28 9 53 9 0 0 0 0 34 3 53 7 1 0 0 0
9'/. -10% -10~. -6~, -33% -100·/. nI. nla
0 0 0 0 0 0 0 0 0 0 0 0 0 0 0 0 0 0 0 0 0 0 0 0 0 0 0 0 0 0 0 0 0 0 0 0 0 0 0 0 0 0 0 0 0 0 0 0
nla nJD nla nJa nJa nla nI. nla
27 13 155 53 7 3 2 1 30 4 143 62 2 2 4 1 36 9 139 51 5 2 1 1 18 3 127 46 10 5 0 0 28 6 U5 46 8 4 2 0 34 3 140 39 3 1 1 0
-10% 225% S'/. -15~, 2SO% SO"fa -SO';' 0'/0
------~-----
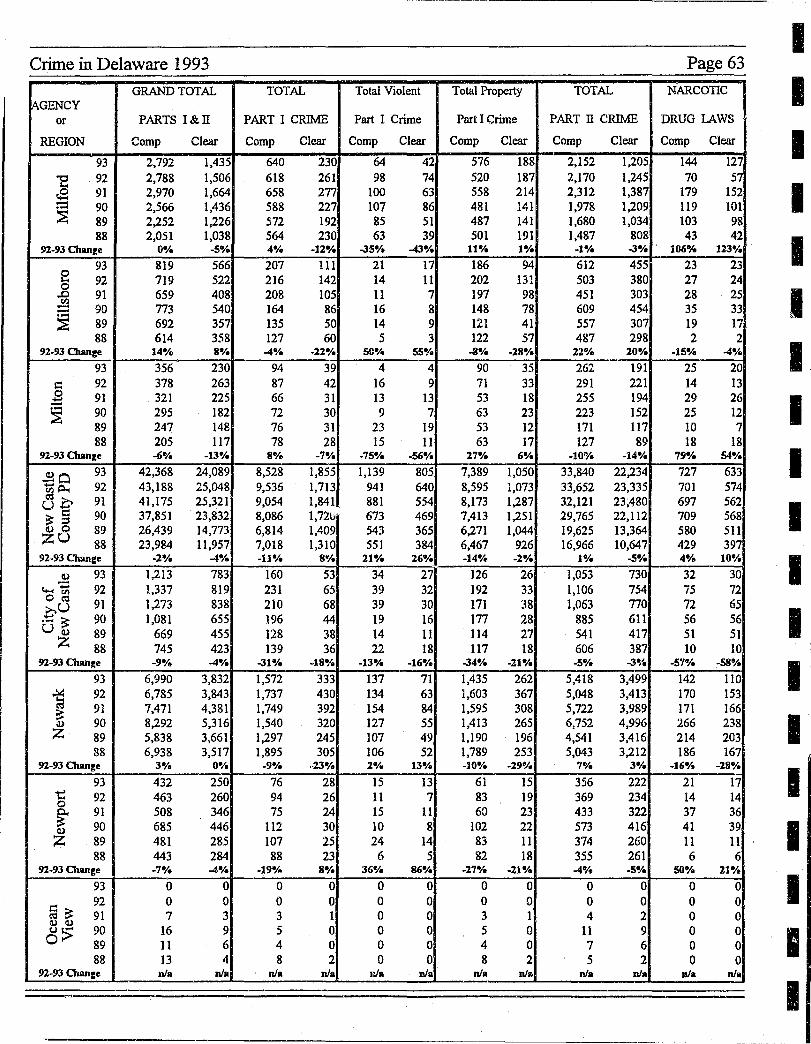
-~----~--.-.-----------------------------------------
Crime in Delaware 1993 Page 63
GRAND TOTAL TOTAL Total Violent Total Property TOTAL NARCOTIC i\GENCY
or PARTS I&IT PART I CRIME Part I Crime Part I Crime PART IT CRIME DRUG LAWS
REGION Comp Clear Comp Clear Comp Clear Comp Clear Comp Clear Comp Clear
93 2,792 1,435 640 230 64 42 576 188 2,152 1,205 144 127 "0 92 2,788 1,506 618 261 98 74 520 187 2,170 1,245 70 57
1-0
tS 91 2,970 1,664 658 277 100 63 558 214 2,312 1,387 179 152 - 90 2,566 1,436 588 227 107 86 481 141 1,978 1,209 119 101 .-~ 89 2,252 1,226 572 192 85 51 487 141 1,680 1,034 103 98
88 2,051 1,038 564 230 63 39 501 191 1,487 808 43 42 92-930umze 0-1. -5% 4-1. -12"/. o3S-l~ -43% 11"/. 1·/" -1-1. 03% . 106% 123-;.
93 819 566 207 111 21 17 186 94 612 455 23 23 8 92 719 522 216 142 14 11 202 131 503 380 27 24 0 .0 91 659 408 208 105 11 7 197 98 451 303 28 25 til - 90 773 540 164 86 16 8 148 78 609 454 35 33 -.-~ 89 692 357 135 50 14 9 121 41 557 307 19 17
88 614 358 127 60 5 3 122 57 487 298 2 2 92-930umze 14·/" SO/. -40;' -22-1. ~./. SS·/. -8-1. -2S-Io 22% 20·/. -15% -4-10
93 356 230 94 39 4 4 90 35 262 191 25 20 c:: 92 378 263 87 42 16 9 71 33 291 221 14 13 0 91 321 225 66 31 13 13 53 18 255 194 29 26 .::: .- 90 295 182 72 30 9 7 63 23 223 152 25 12 ~ 89 247 148 76 31 23 19 53 12 171 117 10 7
88 205 117 78 28 15 11 63 17 127 89 18 18 92-930umze -6e/. -13·/. S-;. -7·;' -75";' -56% 27·/. 6-1. -10~/. -14·/. 79% 54·/.
~O 93 42,368 24,089 8,528 1,855 1,139 805 7,389 1,050 33,&40 22,234 727 633
t:i~ 92 43,188 25,048 9,536 1,713 941 640 8,595 1,073 33,652 23,335 701 574 d 91 41,175 25,321 9,054 1,841 881 554 8,173 1,287 32,121 23,480 697 562 C,..) .0 ~ § 90 37,851 23,832 8,086 1,72v 673 469 7,413 1,251 29,765 22,1l2 709 568 CI) 0 89 26,439 14,773 6,814 1,409 543 365 6,271 1,044 19,625 13,364 580 511 ZU 88 23,984 11,957 7,018 1,310 551 384 6,467 926 16,966 10,647 429 397
92-93 Chllllge -2-1. -4.;' -U"/. S-;. 21·/. 26% -14-1. -1·/. I"!. -5-1. 4·/e 10·;' -.
CI) 93 1,213 783 160 53 34 27 126 26 1,053 730 32 30 f.j...<-Z:: 92 1,337 819 231 65 39 32 192 33 1,106 754 75 72 o~ aU 91 1,273 838 210 68 39 30 171 38 1,063 770 72 65 .- s:: 90 1,081 655 196 44 19 16 177 28 885 611 56 56 UCI) 89 669 455 128 38 14 11 114 27 541 417 51 51
Z 88 745 423 139 36 22 18 117 18 606 387 10 10 92-930umze -9-1. -4"/. 031% ~lS% -13"/. -16-1. 034% -21·/" -5% -3~~ -57-;' _SS°;'
93 6,990 3,832 1,572 333 137 71 1,435 262 5,418 3,499 142 110
] 92 6,785 3,843 1,737 430 134 63 1,603 367 5,048 3,413 170 153
::: 91 7,471 4,381 1,749 392 154 84 1,595 308 5,722 3,989 171 166 il) 90 8,292 5,316 1,540 320 127 55 1,413 265 6,752 4,996 266 238 Z 89 5,838 3,661 1,297 245 107 49 1,190 196 4,541 3,416 214 203
88 6,938 3,517 1,895 305 106 52 1,789 253 5,043 3,212 186 167 92-930umge 3"/. 0";' -9-1. -230;' 20/. 13% -10% -290/. 7-;. 3·/. -16% -28%
93 432 250 76 28 15 13 61 15 356 222 21 17 t! 92 463 260 94 26 11 7 83 19 369 234 14 14 0
~ 91 508 346 75 24 15 11 60 23 433 322 37 36 CI) 90 685 446 112 30 10 8 102 22 573 416 41 39 Z 89 481 285 107 25 24 14 83 11 374 260 11 11
88 443 284 88 23 6 5 82 18 355 261 6 6 92-93 C1umge _70;' -4.;' -19·/. S·;. 36-;. 86% -27% -21-10 -4% -5% SO"fa 21-1.
93 0 0 0 0 0 0 0 0 0 0 0 0
aa: 92 0 0 0 0 0 0 0 0 0 0 0 0 91 7 3 3 1 0 0 3 1 4 2 0 0
CI) CI)
0:> 90 16 9 5 0 0 0 5 0 11 9 0 0 89 11 6 4 0 0 0 4 0 7 6 0 0 88 13 4 8 2 0 0 8 2 5 2 0 0
92-93 Change nla nla nla nla r.fa nla nJa nllII nla nla nla nla
I I I I I I I I I I I I I I I I I I I
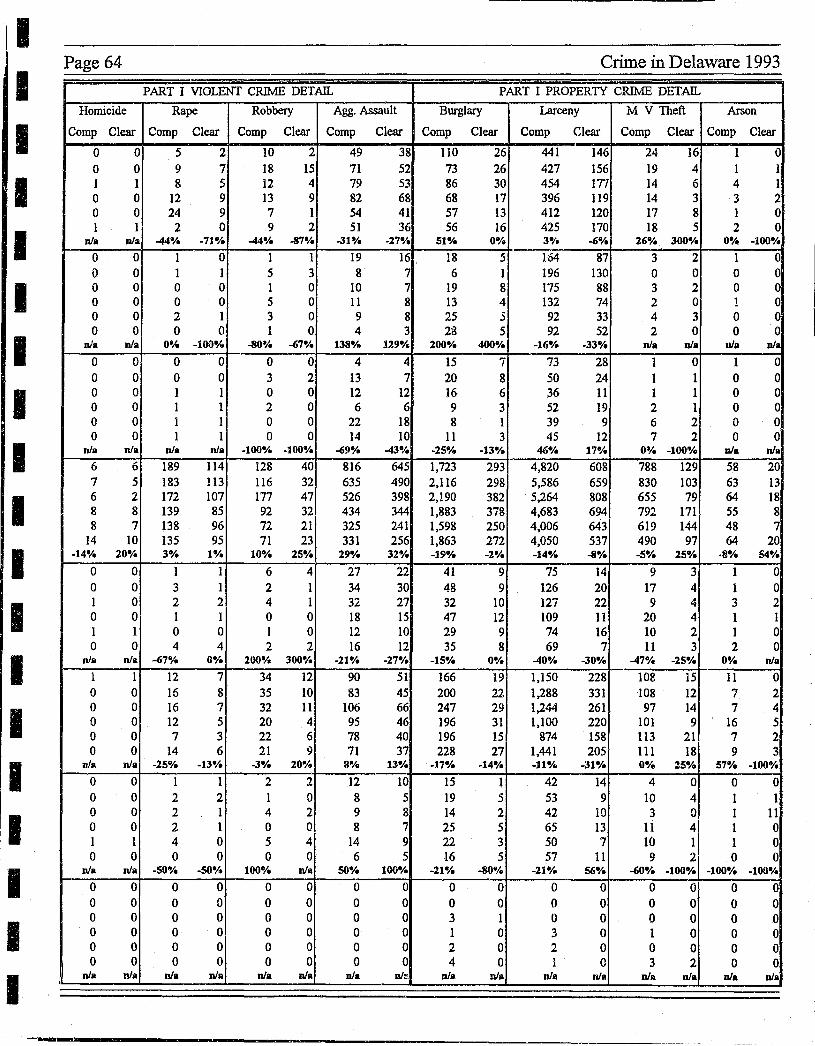
II I I I I I I I I I I I I I I I I I I
Page 64
Homicide
Comp Clear
0 0 0 0 1 1 0 0 0 0 1 1
nla nla
0 0 0 0 0 0 0 0 0 0 0 0
nla nla
0 0 0 0 0 0 0 0 0 0 0 0
nla nla
6 6 7 5 6 2 8 8 8 7
14 10 -1481. 20·;'
0 0 0 0 1 0 0 0 1 1 0 0
nla nla
I 1 0 0 0 0 0 0 10 0 0 0
nla nJa
0 0 0 0 0 0 0 0 1 1 0 0
nla nla
0 0 0 0 0 0 0 0 0 ()
0 0 nla nJa
PART I VIOLENT CRIME DETAIL
Rape Robbery Agg. Assault
Comp Clear Comp Clear Comp Clear
5 2 10 2 49 38 9 7 18 15 71 52 8 5 12 4 79 53
12 9 13 9 82 68 24 9 7 1 54 41 2 0 9 2 51 36
-440/. -71 8/. -44./. -87°;' -31 9/. -270/.
1 0 1 1 19 16 1 1 5 3 8 7 0 0 1 0 10 7 0 0 5 0 11 8 2 1 3 0 9 8 0 0 1 0 4 3
0";' -100% -80a/. -67·/. 138% 129·/.
0 0 0 0 4 4 0 0 3 2 13 7 1 I 0 0 12 12 1 1 2 0 6 6 1 I 0 0 22 18 1 1 0 0 14 10
nla nJa -10{W. -100-;. -69-;. -43-;.
189 114 128 40 816 645 183 113 116 32 635 490 172 107 177 47 526 398 139 85 92 32 434 344 138 96 72 21 325 241 135 95 71 23 331 256 3"'/0 1·;' 10% 21W. 29·/. 32°;'
1 1 6 4 27 22 3 1 2 1 34 30 2 2 4 1 32 27 I 1 0 0 18 15 0 0 1 0 12 10 4 4 2 2 16 12
-678/. Oe;. 20081. 300% -21·;' -2781.
12 7 34 12 90 51 16 8 35 10 83 45 16 7 32 11 106 66 12 5 20 4 95 46 7 3 22 6 78 40
14 6 21 9 71 37 -2S~/. -13% -381. 20°/. 11% 13%
1 1 2 2 12 10 2 2 1 0 8 5 2 1 4 2 9 8 2 1 0 0 8 7 4 0 5 4 14 9 0 0 0 0 6 5
-511% -soe;~ 100% nla soe;. 100%
0 0 0 0 0 0 0 0 0 0 0 0 0 0 0 0 0 0 0 0 0 0 0 0 0 0 0 0 0 0 0 0 0 0 0 0
nla nla nJa nla nla nJa
Crime in Delaware 1993
PART I PROPERTY CRIME DETAIL
Burglary Larceny M V Theft Arson
Comp Clear Comp Clear Comp Clear Comp Clear
110 26 441 146 24 16 1 0 73 26 427 156 19 4 1 1 86 30 454 177 14 6 4 1 68 17 396 119 14 3 3 2 57 13 412 120 17 8 1 0 56 16 425 170 18 5 2 0
51·/. oaf. 3e;. -60;' 26°/. 300·;' 0% -100"/.
18 5 '~64 87 3 2 1 0 6 1 196 130 0 0 0 0
19 8 175 88 3 2 0 0 13 4 132 74 2 0 1 0 25 5 92 33 4 3 0 0 28 5 92 52 2 0 0 0
2008/. 400-;. -16·/. -330;' nla Dla nI. nla
15 7 73 28 1 0 1 0 20 8 50 24 1 1 0 0 16 6 36 11 1 1 0 0 9 3 52 19 2 1 0 0 8 1 39 9 6 2 0 0
11 3 45 12 7 2 0 0 -258/8 -13°/. 468/. 1781. 0% -100% nla nla
1,723 293 4,820 608 788 129 58 20 2,116 29& 5,586 659 830 103 63 13 2,190 382 5,264 808 655 79 64 18 1,883 378 4,683 694 792 171 55 8 1,598 250 4,006 643 619 144 48 7 1,863 272 4,050 537 490 97 64 20 -1981. -281. -14% -8°;' -5·;' 25% -8% 548
/.
41 9 75 14 9 3 1 0 48 9 126 20 17 4 1 0 32 10 127 22 9 4 3 2 47 12 109 11 20 4 1 1 29 9 74 16 10 2 1 0 35 8 69 7 11 3 2 0
-15% 0·/. -40·/. -30·/e -47°;' -2581. 081. nla
166 19 1,150 228 108 15 11 0 200 22 1,288 331 108 12 7 2 247 29 1,244 261 97 14 7 4 196 31 1,100 220 101 9 16 5 196 15 874 158 113 21 7 2 228 27 1,441 205 III 18 9 3
-17% ·14% -11·/~ -31% oe;e 25% 57°;' -1008/.
15 1 42 14 4 0 0 0 19 5 53 9 10 4 1 1 14 2 42 10 3 0 1 11 25 5 65 13 11 4 1 0 22 3 50 7 10 1 1 0 16 5 57 11 9 2 0 0
-21% -80./. -21·/. 56·/. -6081. -100% -100·/. -10081.
0 0 0 0 0 0 0 0 0 0 0 0 0 0 0 0 3 1 0 0 0 0 0 0 1 0 3 0 1 0 0 0 2 0 2 0 0 0 0 0 4 0 I 0 3 2 0 0
nI. nla nJa nla nJa nla nI. nla
-..0__________________________________________________________________ ______________ _
I
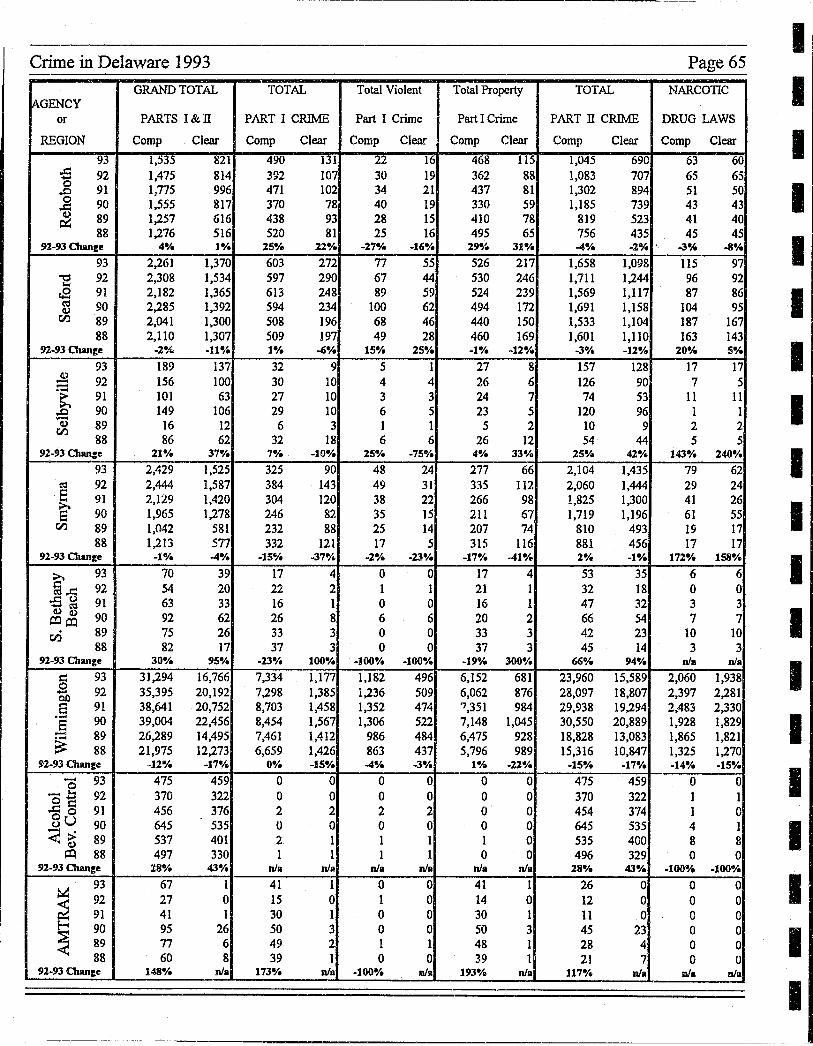
Crime in Delaware 1993
GRAND TOTAL TOTAL Total Violent ~GENCY
or PARTS I&n PART I CRIME Part I Crime
REGION Comp Clear Comp Clear Comp Clear
93 1,535 821 490 131 22 16 ;S 92 1,475 814 392 107 30 19 0 91 1,775 996 471 102 34 21 .c 0 90 1,555 817 370 78 40 19 .J::
~ 89 1,257 616 438 93 28 15 88 1,276 516 520 81 25 16
92-930umEe 4'/. 1'Y. lS';' %l'Y. -17% -16'/.
93 2,261 1,370 603 272 77 55
'" 92 2,308 1,534 597 290 67 44 .... r.S 91 2,182 1,365 613 248 89 59 cd 90 2,285 1,392 594 234 100 62 CI)
!ZJ 89 2,041 1,300 508 196 68 46 88 2,110 1,307 509 197 49 28
91-930umge -2~1. -11% 1% -6% IS';' 25%
93 189 137 32 9 5 1 u 92 156 100 30 10 4 4 --.- 91 101 63 27 10 3 3 ~ .c 90 149 106 29 10 6 5 - 16 6 3 1 CI) 89 12 1 !ZJ
88 86 62 32 18 6 6 92-930um:e 11'Y. 37'Y. 7'/. -10% 15·/. -7S%
93 2,429 1,525 325 90 48 24 cd 92 2,444 1,587 384 143 49 31 E 91 2,129 1,420 304 120 38 22 S' 90 1,965 1,278 246 82 35 15
CZl 89 1,042 581 232 88 25 14 88 1,213 577 332 121 17 5
92-930umge _:1 6/. -4% -lS% -37'/. -1% -23';'
>. 93 70 39 17 4 0 0 §..r:: 92 54 20 22 2 1 1 ..so 91 63 33 16 1 0 0 Cl)cd
tl:l&.:i 90 92 62 26 8 6 6 CZl 89 75 26 33 3 0 0
88 82 17 37 3 0 0 92-93 Cban:e 30% 9S'Y. -23';' 100% -100'/. -IOO'/~
c: 93 31,294 16,766 7,334 1,177 1,182 496 0 92 35,395 20,192 7,298 1,385 1,236 509 -0.0 8 91 38,641 20,752 8,703 1,458 1,352 474 .- 90 39,004 22,456 8,454 1,567 1,306 522 8
~ 89 26,289 14,495 7,461 1,412 986 484 88 21,975 12,273 6,659 1,426 863 437
92-930umr:e -12'/. -17'/. O'Y. -lS'/. ..... /. -3% - 93 475 459 0 0 0 0 0 _ .... 92 370 322 0 0 0 0 0= .J::o 91 456 376 2 2 2 2 8u 90 645 535 0 0 0 0
<~ 89 537 401 2 1 1 1 tl:l 88 497 330 1 1 1 1
92-93 Change 28% 43';' nla nla nla nla
~ 93 67 1 41 1 0 0
~ 92 27 0 15 0 1 0 91 41 1 30 1 0 0 90 95 26 50 3 0 0 89 77 6 49 2 1 1 88 60 8 39 1 0 0
92-93 Chance 148% nla 173% nllI -100-/. nllll
Total Property TOTAL
Part I Crime PART II CRIME
Comp Clear Comp Clear
468 115 1,045 690 362 88 1,083 707 437 81 1,302 894 330 59 1,185 739 410 78 819 523 495 65 756 435
19'1, 31'/. -4';' -2% .
526 217 1,658 1,098 530 246 1,711 1,244 524 239 1,569 1,117 494 172 1,691 1,158 440 150 1,533 1,104 460 169 1,601 1,110 -1'Y. -12'/. -3% -ll'/s
27 8 157 128 26 6 126 90 24 7 74 53 23 5 120 96 5 2 10 9
26 12 54 44 4% 33 'Yo 15'Y. 42'Y.
277 66 2,104 1,435 335 112 2,060 1,444 266 98 1,825 1,300 211 67 1,719 1,196 207 74 810 493 315 116 881 456
-17';' .... 1·/. 2% -lOY,
17 4 53 35 21 1 32 18 16 1 47 32 20 2 66 54 33 3 42 23 37 3 45 14
-19% 300% 66% 94%
6,152 681 23,960 15,589 6,062 876 28,097 18,807 '7,351 984 29,938 19,294 7,148 1,045 30,550 20,889 6,475 928 18,828 13,083 5,796 989 15,316 10,847
lOY. -22'/. -15% -17%
0 0 475 459 0 0 370 322 0 0 454 374 0 0 645 535 1 0 535 400 0 0 496 329
nla nla 28'Y. 43%
41 1 26 0 14 0 12 0 30 I 11 0 50 3 45 23 48 1 28 4 39 1 21 7
193'/8 nlil 117-/. nla
Page 65
NARCOTIC
DRUG LAWS
Comp Clear
63 60 65 65 51 50 43 43 41 40 45 45
-3';' -8';'
115 97 96 92 87 86
104 95 187 167 163 143
10';' S';'
17 17 7 5
11 11 1 1 2 2 5 5
143% 140';'
79 62 29 24 41 26 61 55 19 17 17 17
172% 158%
6 6 0 0 3 3 7 7
10 10 3 3
nI. nla
2,060 1,938 2,397 2,281 2,483 2,330 1,928 1,829 1,865 1,821 1,325 1,270 -14'/. -IS'Y,
0 0 1 1 1 0 4 1 8 8 0 0
-100% -1 60s;.
0 0 0 0 0 0 0 0 0 0 0 0
nI. nla
I I I I I I I I I I I I I I I I I I I
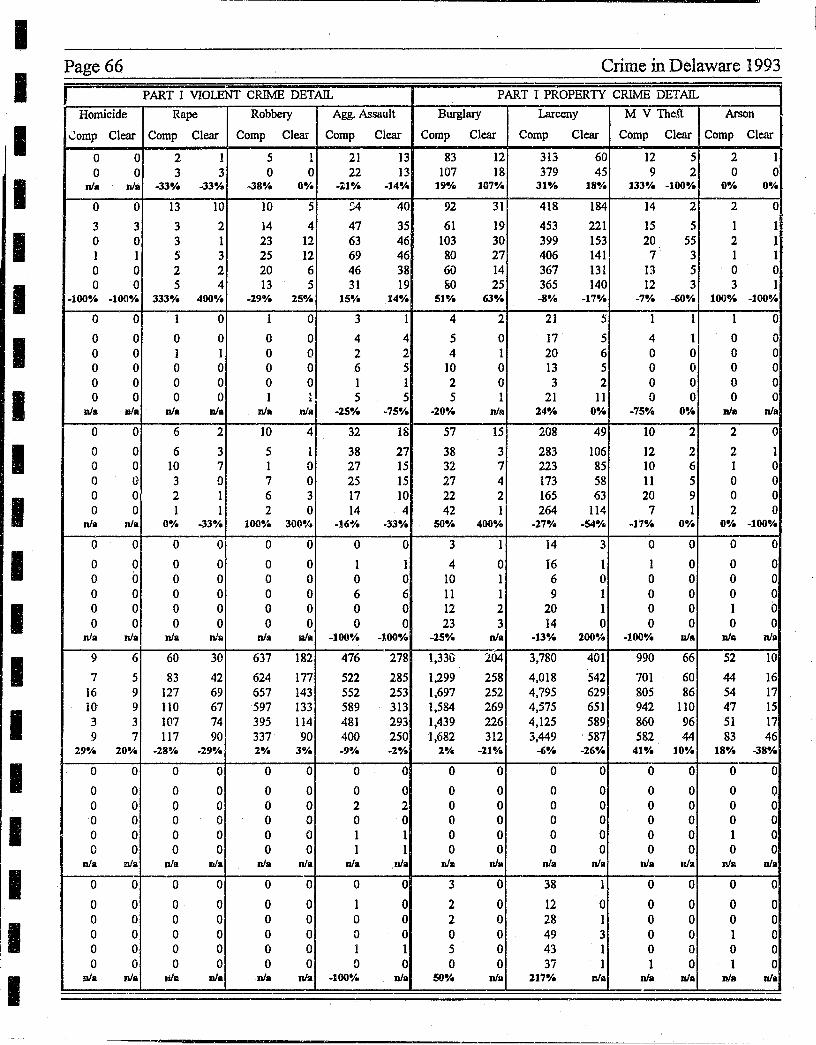
I I I I I I I I I I I I I I I I I I I
-----.-------------------------------------------
Page 66 Crime in Delaware 1993
r PART I VIOLENT CRIME DETAIL PART I PROPERTY CRIME DETAIL
Homicide Rape Robbery Agg. Assault BurgIIII)' Larceny M V Theft Arson
"":omp Clear Comp Clear Comp Clear Comp Clear Comp Clear Comp Clear Comp Clear Comp Clear
0 0 2 1 5 1 21 13 83 12 313 60 12 5 2 1 0 0 3 3 0 0 22 13 107 18 379 45 9 2 0 0
nJ. nJ. -33·/. -33% • .J8OV. 0-/. -:~11·~ -14OV. 190Vc 107% 31% 18OV. 133OV. -100~~ o·~ 0-/.
0 0 13 10 10 5 S4 40 92 31 418 184 14 2 2 0
3 3 3 2 14 4 47 35 61 19 453 221 15 5 1 1 0 0 3 1 23 12 63 46 103 30 399 153 20 55 2 1 1 1 5 3 25 12 69 46 80 27 406 141 7 3 1 1 0 0 2 2 20 6 46 38 60 14 367 131 13 5 0 0 0 0 5 4 13 5 31 19 fSO 25 365 140 12 3 3 1
-100% -l00OV. 333·~ 4000/. -29% 25°/. 15OV. 14% 51% 63·~ -8./. -17·/. -7·~ -60./. 1008/. -1000/.
0 0 1 0 1 0 3 1 4 2 21 5 1 1 1 0
0 0 0 0 0 0 4 4 5 0 17 5 4 1 0 0 0 0 I 1 0 0 2 2 4 1 20 6 0 0 0 0 0 0 0 0 0 0 6 5 10 0 13 5 0 0 0 0 0 0 0 0 0 0 1 1 2 0 3 2 0 0 0 0 0 0 0 0 1 , 5 5 5 1 21 11 0 0 0 0 •
nJ. nJa nJ. nJa nJa nla -25·~ -75OV. -20OV. nla 24OV. 0% -75% 0% nI. nJa
0 0 6 2 10 4 32 18 57 15 208 49 10 2 2 0
0 0 6 3 5 1 38 27 38 3 283 106 12 2 2 1 0 0 10 7 1 0 27 15 32 7 223 85 10 6 1 0 0 0 3 0 7 0 25 15 27 4 173 58 11 5 0 0 0 0 2 1 6 3 17 10 22 2 165 63 20 9 0 0 0 0 1 1 2 0 14 4 42 1 264 114 7 1 2 0
nJa nJa OOV. -33% lOOOV. 300·/ .. -16~/. ·330;. 500;. 400% -27·/. -S40;. -118/. 0°/. 00;. -10081.
0 0 0 0 0 0 0 0 3 1 14 3 0 0 0 0
0 0 0 0 0 0 1 1 4 0 16 1 1 0 0 0 0 0 0 0 0 0 0 0 10 1 6 0 0 0 0 0 0 0 0 0 0 0 6 6 11 1 9 1 0 0 0 0 0 0 0 0 0 0 0 0 12 2 20 1 0 0 1 0 0 0 0 0 0 0 0 0 23 3 14 0 0 0 0 0
nJa nJa nJa nJa nla nJa -100% -1,00·/ .. -25·/. nJa -13·!. 200% -loo·~ nI. nJa nla
9 6 60 30 637 182 476 278 1,33G 204 3,780 401 990 66 52 10
7 5 83 42 624 177 522 285 1,299 258 4,018 542 701 60 44 16 16 9 127 69 657 143 552 253 1,697 252 4,795 629 805 86 54 17 10 9 110 67 597 133 589 313 1,584 269 4,575 651 942 llO 47 15 3 3 107 74 395 114 481 293 1,439 226 4,125 589 860 96 51 17 9 7 117 90 337 90 400 250 1,682 312 3,449 587 582 44 83 46
290;. 20% -28% -298/. 20;. 3°/. -9"/. -2·/. 2·/. -21% -6% -260;. 41% 10% 18·/. -380;.
0 0 0 0 0 0 0 0 0 0 0 0 0 0 0 0
0 0 0 0 0 0 0 0 0 0 0 0 0 0 0 (l
0 0 0 0 0 0 2 2 0 0 0 0 0 0 0 0 0 0 0 0 0 0 0 0 0 0 0 0 0 0 0 0 0 0 0 0 0 0 1 1 0 0 0 0 0 0 1 0 0 0 0 0 0 0 1 1 0 0 0 0 0 0 0 0
nJa rua nla nJa nJa nJa nJa nJa nle nJa nJa nJa nJa nJa niP, nJa
0 0 0 0 0 0 0 0 3 0 38 1 0 0 0 0
0 0 0 0 0 0 1 0 2 0 12 0 0 0 0 0 0 0 0 0 0 0 0 0 2 0 28 1 0 0 0 0 0 0 0 0 0 0 0 0 0 0 49 3 0 0 1 0 0 0 0 0 0 0 1 1 5 0 43 1 0 0 0 0 0 0 0 0 0 0 0 0 0 0 37 1 1 0 1 0
nJa nJa W&. nJa nla nJa -100% nJa 50% nJa 217·~ nla nJa u/a nla nla
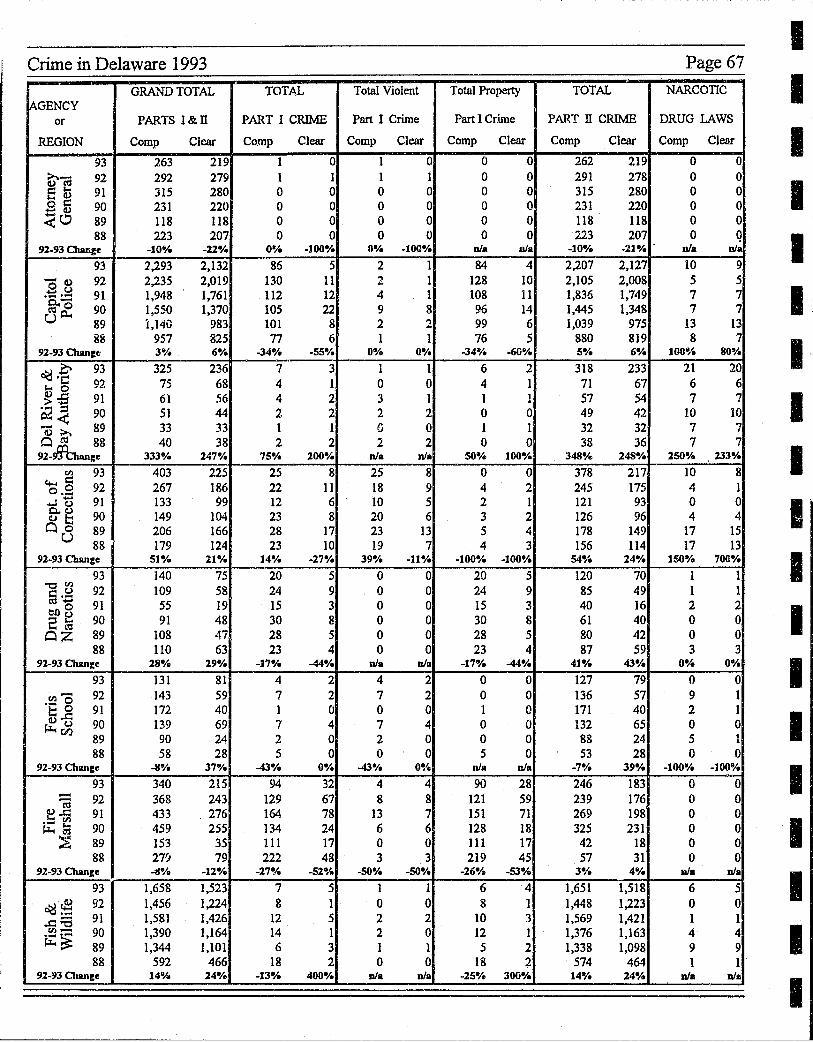
----------------------------.--------
Crime in Delaware 1993
GRAND TOTAL TOTAL IAGENCY
or PARTS I&n PART I CRIME
REGION Comp Clear Comp Clear
93 263 219 1 0
~1§ 92 292 279 1 1 E 0) 91 315 280 0 0 o ~ 90 231 220 0 0 ;:0)
<0 89 118 118 0 0 88 223 207 0 0
92-93 Owlr:e -10·/" -220/. 0% -100",4
93 2,293 2,132 86 5 -11) 92 2,235 2,019 130 11 B(.)
91 1,948 1,761 112 12 .~~ 90 1,550 1,370 lOS 22 U~ 89 , ,14i} 983 101 8
8& 957 825 77 6 92-93 Chanr:e 3"/. 6·/" -34"/. -55%
0 93 325 236 7 3 a(j .t::
92 75 68 4 1 1-<0 ~-5 91 61 56 4 2 .~) :s 90 51 44 2 2 ~< iU;;.... 89 33 33 1 1 Q ~ 88 40 38 2 2 92-Hbumr:e 333"/. 2478,4 75",4 200%
fI) 93 403 225 25 8 c.-.r:: 92 267 186 22 11 o.g "":0 91 133 99 12 6 fr~ 90 149 104 23 8 00 89 206 166 28 17
U 88 179 124 23 10 92-93 Chanr:e 51% :uo/. 14% -27%
93 140 75 20 5 "OfI) 92 109 58 24 9 §.g 0/)0 91 55 19 15 3
2 ~ 90 91 48 30 8
OZ 89 108 47 28 5 88 110 63 23 4
92-93 Chanr:e 28% 29% -17% -44%
93 131 81 4 2
.~o 92 143 59 7 2 I::: 0 91 172 40 1 0 O)..r::
90 139 69 7 4 f.l..~ 89 90 24 2 0 88 58 28 5 0
92-93 ChlllJr:e -8% 37"/" -43"/. 00/.
93 340 215 94 32 - 92 368 243 129 67 -~ ~..r:: 91 433 . 276 164 78 ._ fI)
~a 90 459 255 134 24 :E 89 153 35 111 17
88 27') 79 222 48 92-93 Change ~% -12";' -27% -520/.
93 1,658 1,523 7 5
~~ 92 1,456 1,224 8 1
..r:::a 91 1,581 1,426 12 5 fI) - 90 1,390 1,164 14 1 rz~ 89 1,344 1,101 6 3
88 592 466 18 2 92-93 Otanr:e 14°,4 24"/. -13% 400"/.
Total Violent Total Property
Part I Crime Part I Crime
Comp Clear Comp Clear
1 0 0 0 1 1 0 0 0 0 0 0 0 0 0 0 0 0 0 0 0 0 0 0
0% -100",4 DI. ilia
2 1 84 4 2. 1 128 10 4 1 108 11 9 8 96 14 2 2 99 6 1 1 76 5
0$/. 0"/" -340/. -600/.
1 1 6 2 0 0 4 1 3 1 1 1 2 2 0 0 {j 0 1 1 2 2 0 0
nla nla 50·/0 1000/.
25 8 0 0 18 9 4 2 10 5 2 1 20 6 3 2 23 13 5 4 19 7 4 3
39",4 -11% -100% -1000/"
0 0 20 5 0 0 24 9 0 0 15 3 0 0 30 8 0 0 28 5 0 0 23 4
DI. Dla -17% -44",4
4 2 0 0 7 2 0 0 0 0 1 0 7 4 0 0 2 0 0 0 0 0 5 0
-43% O~'" nI. nla
4 4 90 28 8 8 121 59
13 7 151 71 6 6 128 18 0 0 III 17 3 3 219 45
-50% -SO"l. -26-/. -53%
1 1 6 4 0 0 8 1 2 2 10 3 2 0 12 1 1 1 5 2 0 0 18 2
DI. nla -25-/. 300"/.
TOTAL
PART n CRIME
Comp Clear
262 219 291 278 315 280 231 220 118 118 223 207
-10"/. -21",4 .
2,207 2,127 2,105 2,008 1,836 1,749 1,445 1,348 1,039 915
880 819 5"/" 6%
318 233 71 67 57 54 49 42 32 32 38 36
348% 248%
378 217 245 175 121 93 126 96 178 149 156 114
54% 24%
120 70 85 49 40 16 61 40 80 42 87 59
41% 43",4
127 79 136 57 171 40 132 65 88 24 53 28
-7"/" 39",4
246 183 239 176 269 198 325 231 42 18 57 31
3"1. 4"1"
1,651 1,518 1,448 1,223 1,569 1,421 1,376 1,163 1,338 1,098
574 464 14-/" 24"/s
Page 67
NARCOTIC
DRUG LAWS
Comp Clear
0 0 0 0 0 0 0 0 0 0 0 q
Ill. nla
10 9 5 5 7 7 7 7
13 13 8 7
100"/. 80%
21 20 6 6 7 7
10 10 7 7 ..,
7 f
2500/ .. 2330/"
10 8 4 1 0 0 4 4
17 15 17 13
150% 700"/G
1 1 1 1 2 2 0 0 0 0 3 3
0% 0%
0 0 9 1 2 1 0 0 5 1 0 0
-100"/. -1008,4
0 0 0 0 0 0 0 0 0 0 0 0
nI. Dla
6 5 0 0 1 1 4 4 9 9 1 1
nla Dla
I I I I I I I· I I I I I I I I I I I I
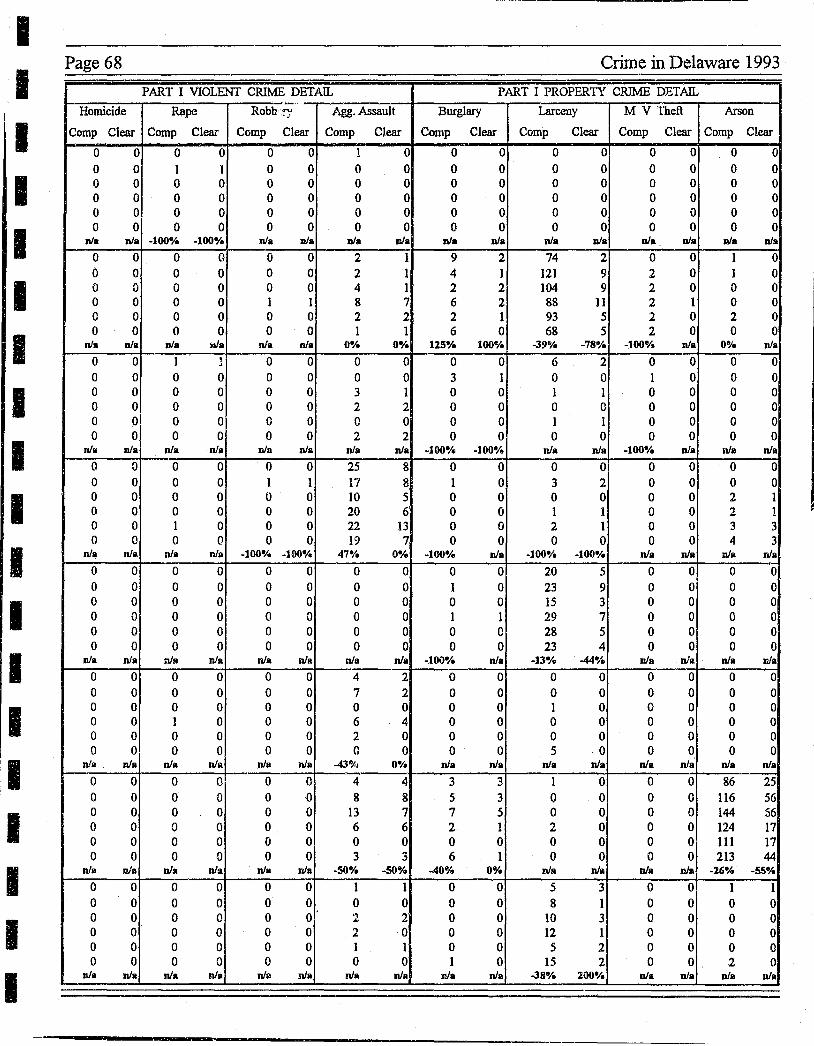
I I I I I I I I I I I I I I I I I
Page 68
Homicide
Comp Clear
0 0 0 0 0 0 0 0 0 0 0 0
nI. nla
0 0 0 0 \) 0 0 0 0 0 0 0
nI. DI. 0 0 0 0 0 0 0 0 0 0 0 0
nla nI.
0 0 0 0 0 0 0 0 0 0 0 0
nla nJa
0 0 0 0 0 0 0 0 0 0 0 0
nJa nJ.
0 0 0 0 0 0 0 0 0 0 0 0
nla nla
0 0 0 0 0 0 0 0 0 0 0 0
nla nla
0 0 0 0 0 0 0 0 0 0 0 0
nla nla
PART I VIOLENT CRIME DETAIL
Rape Robb.iY" Agg. Assault
Comp Clear Comp Clear Comp Clear
0 0 0 0 1 0
1 1 0 0 0 0 0 0 0 0 0 0 0 0 0 0 0 0 0 0 0 0 0 0 0 0 0 0 0 0
-100-" -100~. nI. Dla DIll 01.
0 (I 0 0 2 1 0 0 0 0 2 1 0 0 0 0 4 1 0 0 1 1 8 7 0 0 0 0 2 2 0 0 0 0 1 1
nls 'dI. nI. nI. 0"/. 0%
I 1 0 0 0 0 0 0 0 0 0 0 0 0 0 0 3 1 0 0 0 0 2 2 0 01 0 0 0 0 0 0 0 0 2 2
nI. nI. Dla nlA nla nla
0 0 0 0 25 8 0 0 1 1 17 8 0 0 0 0 10 5 0 0 0 0 20 6' 1 0 0 0 22 13 0 0 0 0 19 7
Ill. nJa -100% -100~. 47-/. O~.
0 0 0 0 0 0 0 0 0 0 0 0 0 0 0 0 0 0 0 0 0 0 0 0 0 0 0 0 0 0 0 0 0 0 0 0
nla nla nla nla nJa nJa
0 0 0 0 4 2 0 0 0 0 7 2 0 0 0 0 0 0 1 0 0 0 6 4 0 0 0 0 2 0 0 0 0 0 0 0
nla nla nJa nla -43'~. 0% . 0 0 0 (} 4 4 0 0 (]I 0 8 8 0 0 0 0 13 7 0 0 0 0 6 6 0 0 0 0 0 0 0 0 0 0 3 3
nla nla nla nla -SO~. -SO'Y~
0 0 0 0 1 1 0 0 0 0 0 0 0 0 0 0
, ., &0, 2
0 0 0 0 2 0 0 0 0 0 1 1 0 0 0 0 0 0
nla nla nJlt. nla nla nJa
Crime in Delaware 1993
PART I PROPERTY CRIME DETAIL
Burglary Larceny M V Theft Arson
Comp Clear Comp Clear Comp Clear Comp Clear
0 0 0 0 0 0 0 0 0 0 0 0 0 0 0 0 0 0 0 0 0 0 0 0 0 0 0 0 0 0 0 0 0 0 0 0 0 0 0 0 0 0 0 0 0 0 0 0
oIa oIa nI. oIa Dla Dill aI. Dla
9 2 74 2 0 0 1 0 4 1 121 9 2 0 1 0 2 2 104 9 2 0 0 0 6 2 88 11 2 1 0 0 2 ! 93 5 2 0 2 0 6 0 68 5 2 0 0 0
125% looe/. -39&.4 -78% -100% nI. 00/. nI.
0 0 6 2 0 0 0 0 3 1 0 0 1 0 0 0 0 0 1 1 0 0 0 0 0 0 0 0 0 0 0 0 0 0 1 1 0 0 0 0 0 0 0 0 0 0 0 0
-100·/. -100"/. nla nJa -100",'s Dla nla nJa
0 0 0 0 0 0 0 0 1 0 3 2 0 0 0 0 0 0 0 0 0 0 2 1 0 0 1 1 0 0 2 1 0 0 2 1 0 0 3 3 0 0 0 0 0 0 4 3
-100·/e nJ. -100% -100·/. nI. nla nJ. nla
0 0 20 5 0 0 0 0 1 0 23 9 0 0 0 0 0 0 15 3 0 0 0 0 1 1 29 7 0 0 0 0 0 0 28 5 0 0 0 0 0 0 23 4 0 0 0 0
-100% nJa -13",'s -44% nla nla nJa nJa
0 0 0 0 0 0 0 0 0 0 0 0 0 0 0 0 0 0 1 0 0 0 0 0 0 0 0 0 0 0 0 0 0 0 0 0 0 0 0 0 0 0 5 0 0 0 0 0
nia nla nla nla nJa nla nla nla
3 3 1 0 0 0 86 25 5 3 0 0 0 0 116 56 7 5 0 0 0 0 144 56 2 1 2 0 0 0 124 17 0 0 0 0 0 0 lli 17 6 1 0 0 0 0 213 44
..40% 0% nla nla oIa Dla -26% -sse,.
0 0 5 3 0 0 1 1 0 0 8 1 0 0 0 0 0 0 10 3 0 0 0 0 0 0 12 1 0 0 0 0 0 0 5 2 0 0 0 0 1 0 15 2 0 0 2 0
nla nJa -388/. 200~. nJ. nJa nJa nJ.
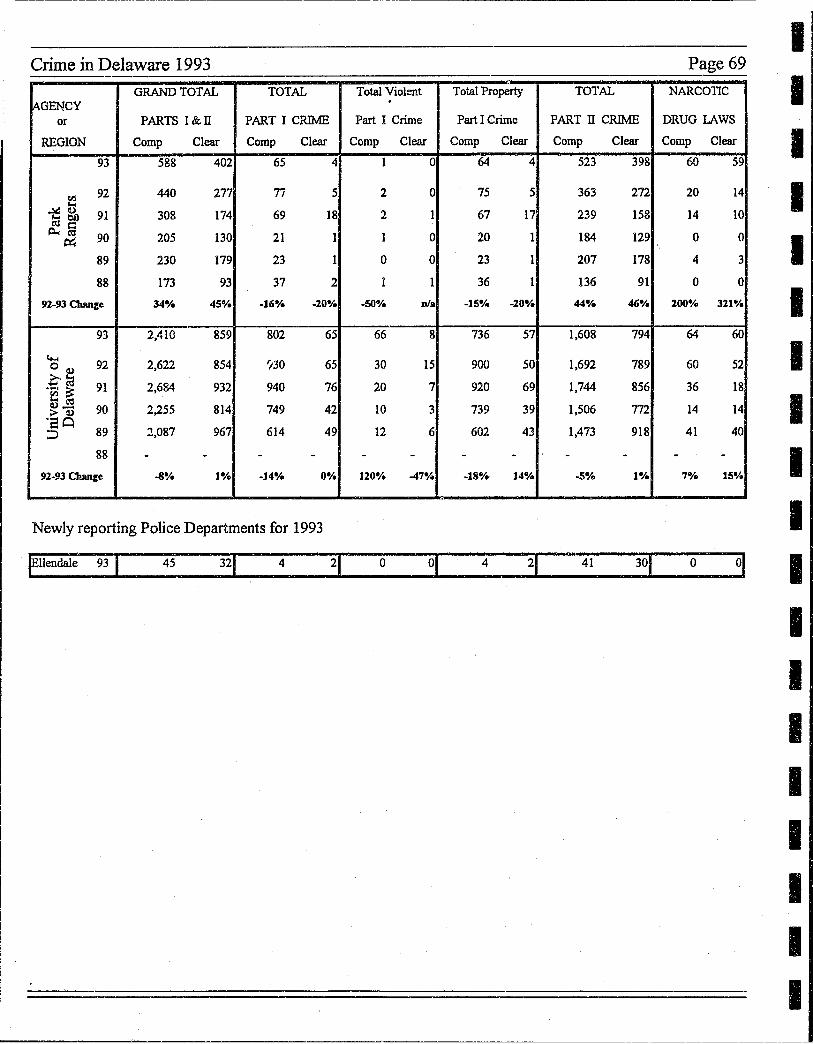
--------------------------------------------------------------------------------------
Crime in Delaware 1993 Page 69
GRAND TOTAL TOTAL Total Violent Total Property TOTAL NARCOTIC iAGENCY
. or PARTS I&n PART I CRIME Part I Crime Part I Crime PART n CRIME DRUG LAWS
REGION Comp Clear Comp Clear Comp Clear Comp Clear Comp Clear Comp Clear
93 588 402 65 4 1 0 64 4 523 398 60 59
rIl 92 440 277 77 5 2 0 75 5 363 272 20 14 "'" ~~ 91 308 174 69 18 2 1 67 17 239 158 14 10
cas::: ~ca 90 205 130 21 1 1 0 20 1 184 129 0 0 ~
89 230 179 23 1 0 0 23 1 207 178 4 3
88 173 93 37 2 1 1 36 1 136 91 0 0
92-93 Owtze 34% 450/. a16% -20·1. -50·~ Dla -IS·~ -20% 44% 46·~ 200·/~ 321~.
93 2,410 859 802 65 66 8 736 57 1,608 794 64 60
c..... 92 2,622 854 'i30 65 30 15 900 50 1,692 789 60 52 °v .ca 91 2,684 932 940 76 20 7 920 69 1,744 856 36 18 .tij ~ ""'cd (1)- 90 2,255 814 749 42 10 3 739 39 1,506 772 14 14 >(1)
'80 89 2,087 967 614 49 12 6 602 43 1,473 918 41 40 :::J
88 - - - - - - - - - - - -92-93 Owtze -8.~ 1·/~ -14·~ O~. 120% -478/a -18% 14·~ -5% 1~. 7°/. 158/.
"
Newly reporting Police Departments for 1993
Ellendale 93 I 45 4 o 4 41 o 01
I I I I I I I I I I I I I I I I I I I
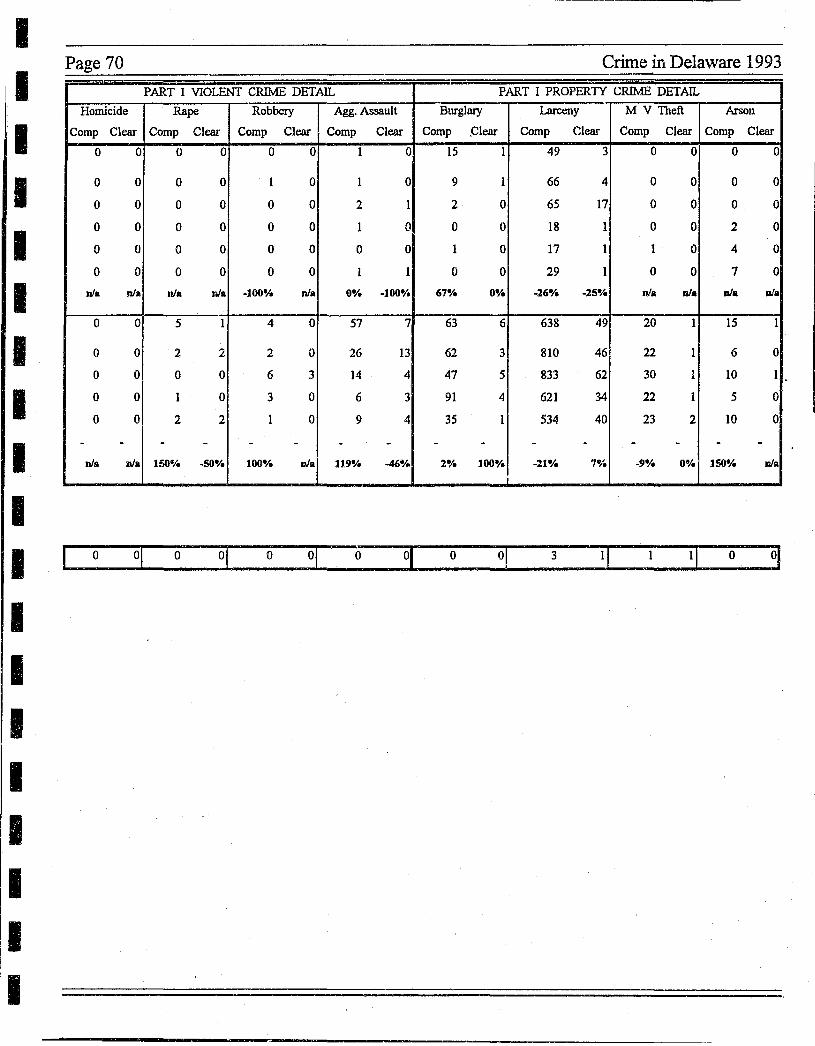
------_.-------------------------------------------------------------------------------
I I I I I I I I I I I I I I I I I I I
Page 70
Homicide
Comp Clear
0 0
0 0
0 0
0 0
0 0
0 0
nla nla
0 0
0 0
0 0
0 0
0 0
- -nla nJa
o 01
PART I VIOLENT CRIME DETAIL
Rape Robbery Agg. Assault
Comp Clear Comp Clear Comp Clear
0 0 0 0 1 0
0 0 I 0 1 0
0 0 0 0 2 1
0 0 0 0 I {)
0 0 0 0 0 0
0 0 0 0 1 1
nla nla -100% nla 0-1. -100·;'
5 1 4 0 57 7
2 2 2 0 26 13
0 0 6 3 14 4
1 0 3 0 6 3
2 2 1 0 9 4
- - - - - -150$/. -SO-l. 100-1. nJa 119·/. -46./~
o 01 01 o
Crime in Delaware 1993
PART I PROPERTY CRIME DETAIL
Burglary Larceny M V Theft Arson
Comp ,Clear Comp Clear Comp Clear Comp Clear
15 I 49 3 0 0 0 0
9 1 66 4 0 0 0 0
2 0 65 17 0 0 0 0
0 0 18 1 0 0 2 0
1 0 17 1 1 . 0 4 0
0 0 29 1 0 0 7 0
678;' 0% -26·/. -25% nI. nla nla nla
63 6 638 49 20 1 15 1
62 3 810 46 22 1 6 0
47 5 833 62 30 1 10 1
91 4 621 34 22 1 5 0
35 1 534 40 23 2 10 0
- - - - - - - -2-1. 100-;' -21·/. 7% -9-1. 08/. lSO°;' nla
i
o 3 o
.
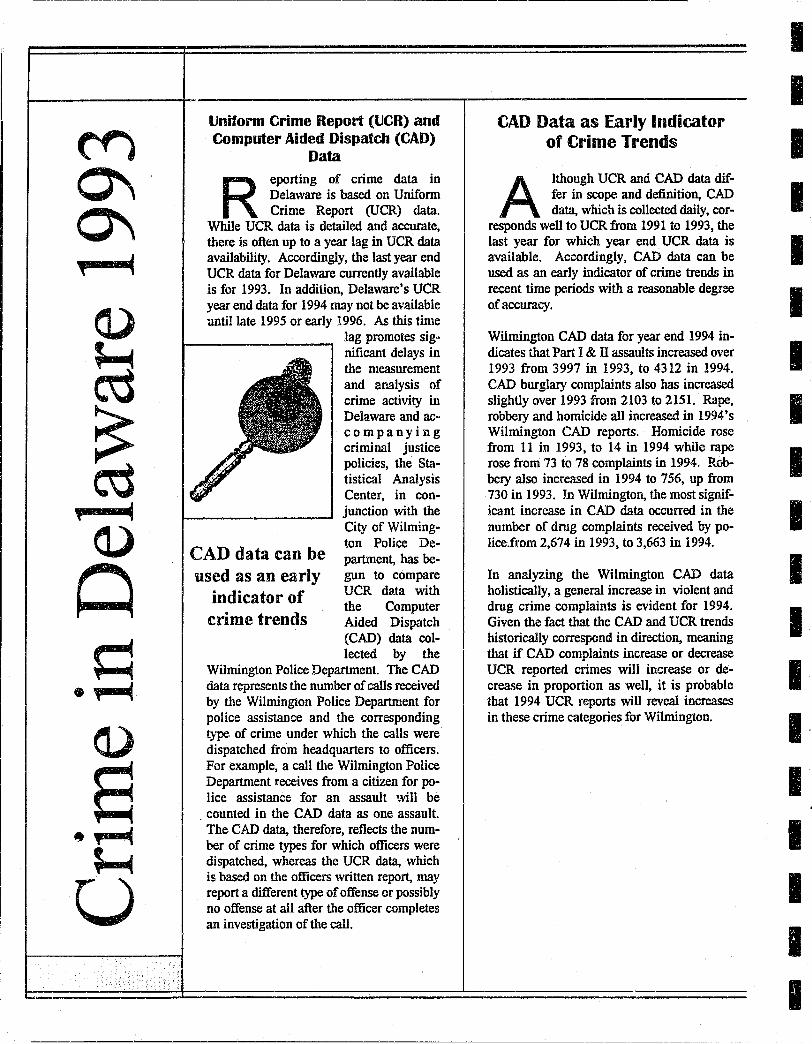
----------------------------------
Unifolml Crime Report (UCR) and Computer Aided Dispatch (CAD)
Data
Reporting of crime data in Delaware is based on Uniform Crime Report (UCR) data.
While UCR data is detailed and accurate, there is often up to a year lag in UCR data availability. Accordingly, the last year end UCR data for Delaware currently available is for 1993. In addition, Delaware's UCR year end data for 1994 may not be available until late 1995 or early 1996. As this time
lag promotes SigD nificant delays in the measurement and analysis of crime activity in Delaware and ac~ companying criminal justice policies, the Statistical Analysis Center, in conjunction with the City of Wilming~ ton Police De
CAD data can be partment, has be-
used as an early indicator of crime trends
gun to compare UCR data with the Computer Aided Dispatch (CAD) data collected by the
Wilmington Police Department. The CAD data represents the number of calls received by the Wilmington Police Department for police assistance and the corresponding type of crime under which the calls were dispatched from headquarters to officers. For example, a call tlle Wilmington Police Department receives from a citizen for p0-
lice assistance for an assault ,,¥ill be . counted in the CAD data as one assault.
The CAD data, therefore, reflects the number of crime types for which officers were dispatched, whereas the UCR data, which is based on the officers written report, may report a different type of offense or possibly no offense at all after the officer completes an investigation of the call.
CAD Data as Early Indicator of Crime Trends
Although UCR and CAD data differ in scope and definition, CAD data, which is collected daily, cor-
responds well to UCR from 1991 to 1993, the last year for which year end UCR data is available. Accordingly, CAD data can be used as an early indicator of crime trends in recent time periods wit,l} a reasonable degree of accuracy.
Wilmington CAD data for year end 1994 indicates that Part I & n assaults increased over 1993 from 3997 in 1993, to 4312 in 1994. CAD burglary complaints also has increased slightly over 1993 from 2103 to 2151. Rape, robbery and homicide all increased in 1994's Wilmington CAD reports. Homicide rose from 11 in 1993, to 14 in 1994 while rape rose from 73 to 78 complaints in 1994. Robbery also increased in 1994 to 756, up from 730 in 1993. In Wilmington, the most signif~ icant increase in CAD data occurred in the number of drug complaints received by police.from 2,674 in 1993, to 3,663 in 1994.
In analyzing the Wilmington CAD data holistically, a general increase in violent and drug crime complaints is evident for 1994. Given the fact that the CAD and UCR trends historically correspond in direction, meaning that if CAD complaints increase or decrease UCR reported crimes will increase or decrease in proportion as well, it is probable that 1994 UCR reports will reveal increases in these crime categories for Wilmington.
I I I I I I I I I I I I I I· I I I I I
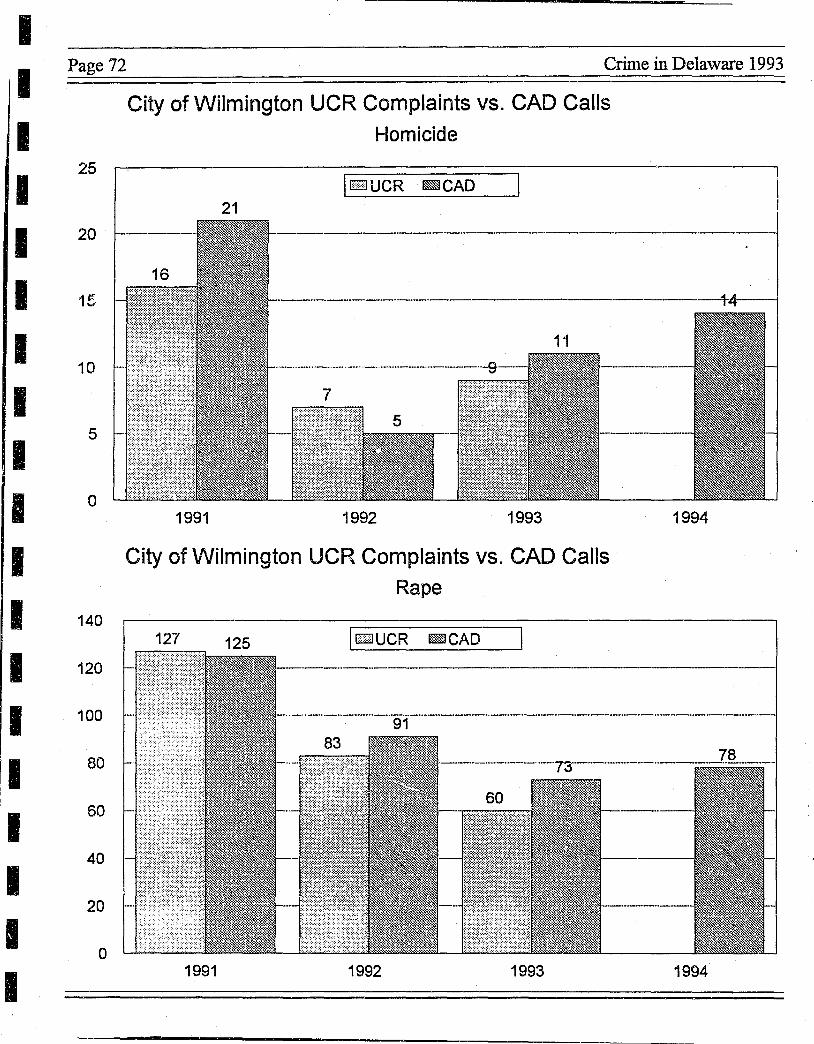
I I I I I I I I I I I I I I I I I I I
Page 72 Crime in Delaware 1993
25
20
15
10
5
o
140
120
100
80
60
40
20
0
City of Wilmington UCR Complaints vs. CAD Calls
Homicide
IEIJUCR !m]CAD 21
1991 1992 1993
City of Wilmington UCR Complaints vs. CAD Calls
Rape
127 IGElUCR lWCAD
1991 1992 1993
1994
1994

Crime in Delaware 1993
1000
800
600
400
200
o
3000
2500
2000
1500
1000
500
o
City of Wilmington UCR Complaints VS. CAD Calls Robbery
I Eilli UCR a CAD
1991 1992 1993
City of Wilmington UCR Complaints VS. CAD Calls
Burglary
267.2 I Bill UCR mil CAD
1991 1992 1993
Page 73
1994
2151
1994
I I I I I I I I I I I I I I I I I I I
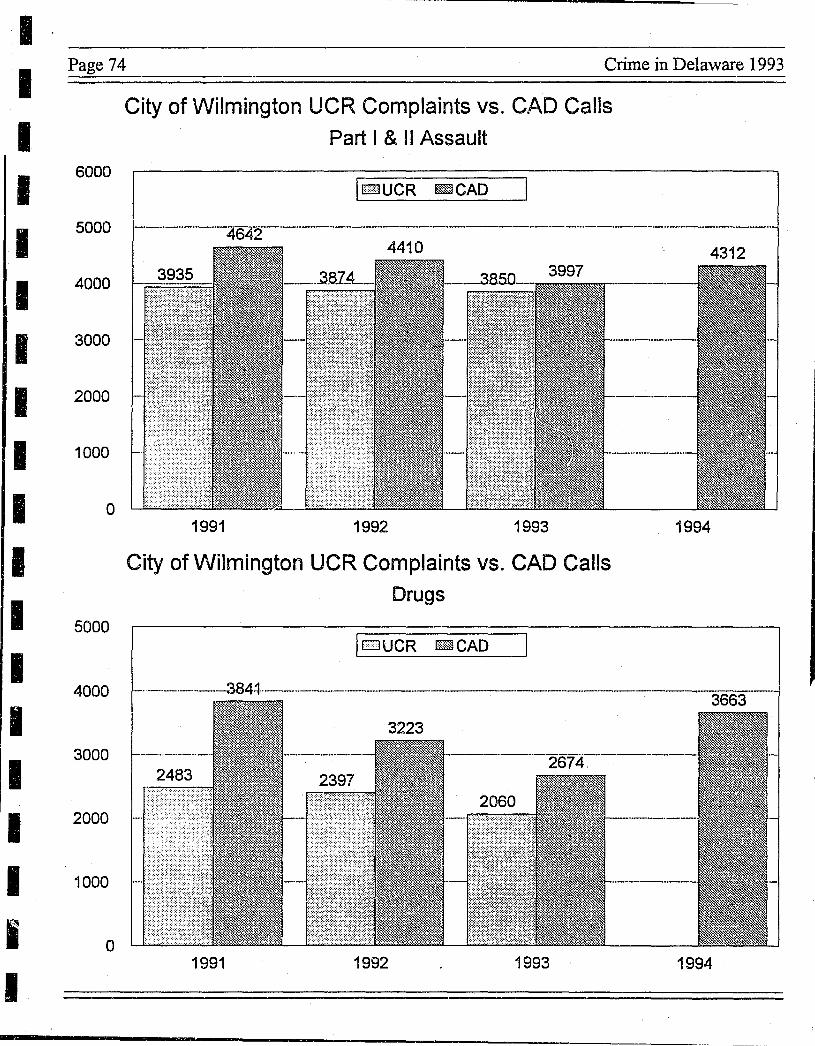
I I I I I I I I I I I I I I I I I I
:1 -
Page 74 Crime in Delaware 1993
City of Wilmington UCR Complaints VS. CAD Calls
Part I & II Assault
6000 II2JUCR ~CAD
5000
4312
4000
3000
2000
1000
o 1991 1992 1993 1994
City of Wilmington UCR Complaints VS. CAD Calls
Drugs
5000 I EJUCR lEilCAD
4000 3663
3000
2000
1000
o 1991 1992 1993 1994
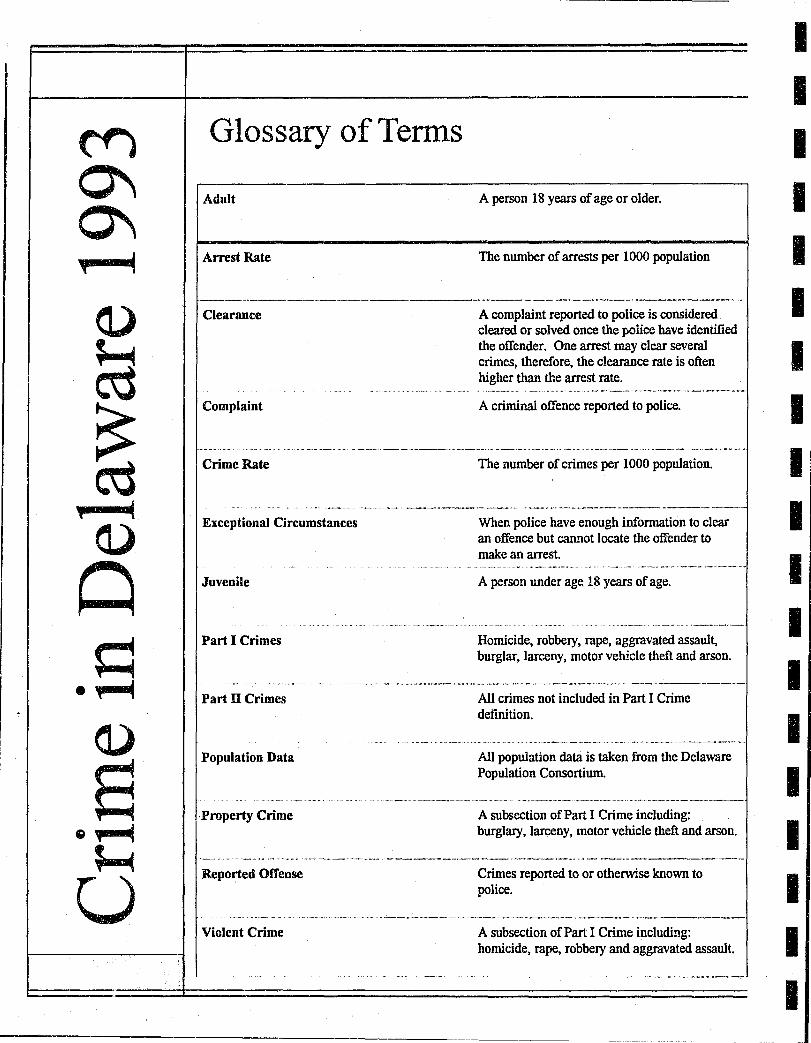
Glossary of Terms
Adult A person 18 years of age or older.
Arrest Rate The number of arrests per 1000 population
.. _------_._ .. __ ... _._ .. _-----_._--_ .•. _-------. __ .---._----, .... Clearance
Complaint
A complaint reported to police is considered cleared or solved once the police have identified the offender. One arrest may clear several crimes, therefore, the clearance rate is often higher than the arrest rate.
A criminal offence reported to police.
Crime Rate The number of crimes per 1000 population.
....... "' ........ - .... "'. "" ... _ ... _--------" ... "'._._-----------_._---•..
Exceptional Circumstances When police have enough infonnation to clear an offence but cannot locate the offender to make an arrest.
Juvenile
Part I Crimes
Part II Crimes
Population Data
·Property Crime
Reported Offense
Violent Crime
A person under age 18 years of age.
Homicide, robbery, rape, aggravated assault, burglar, larceny, motor vehicle theft and arson.
All crimes not included in Part I Crime definition.
All population data is taken from the Delaware Population Consortium.
A subsection of Part I Crime including: burglary, larceny, motor vehicle theft and arson.
Crimes reported to or otherwise known to police.
A subsection of Part I Crime including: homicide, rape, robbery and aggravated assault.
I I I I I I I I I I I I I I I I I I I
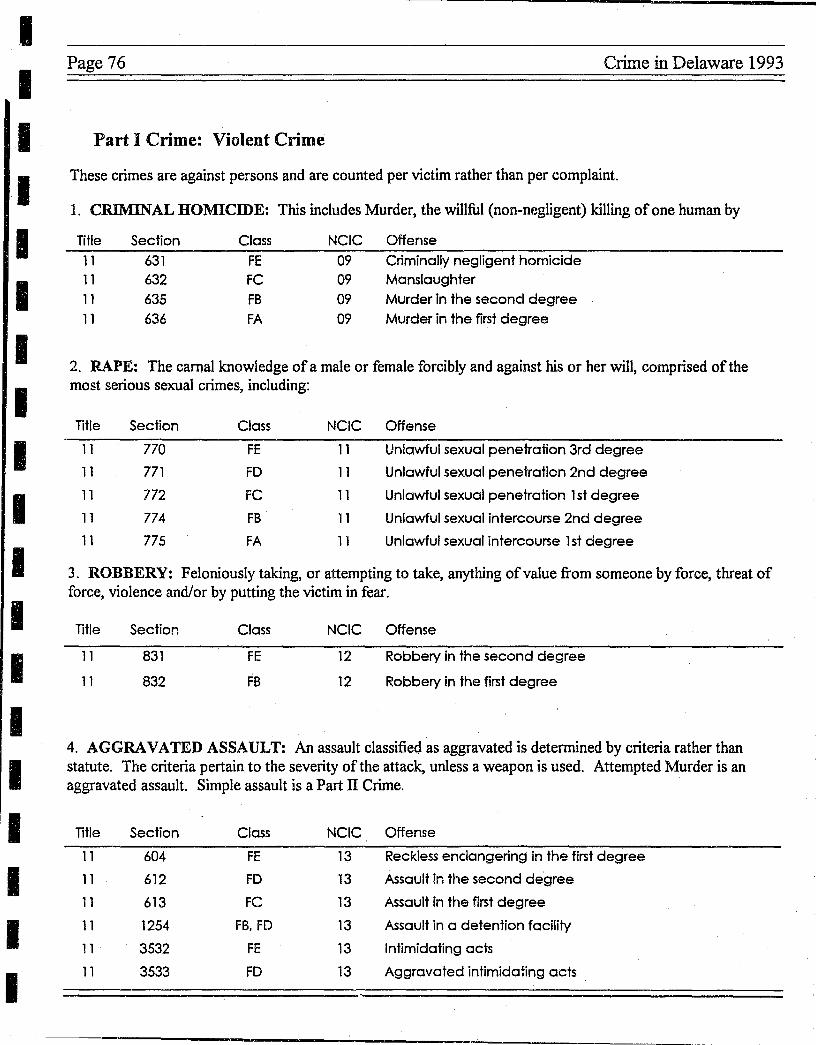
,I I I I I I I I I I I I I I I I I I
Page 76 Crime in Delaware 1993
Part I Crime: Violent Crime
These crimes are against persons and are counted per victim rather than per complaint.
1. CRIMINAL HOMICIDE: This includes Murder, the willful (non-flf~gligent) killing of one human by
TItle Section Class NCIC Offense
11 631 FE 09 Criminally negligent homicide 11 632 FC 09 Manslaughter
11 635 FB 09 Murder in the second degree
11 636 FA 09 Murder in the first degree
2. RAPE: The carnal knowledge ofa male or female forcibly and against his or her will, comprised of the most serious sexual crimes, including:
Title Section Class NCIC Offense
11 770 FE 11 Unlawful sexual penetration 3rd degree
11 771 FD 11 Unlawful sexual penetration 2nd degree
11 772 FC 11 Unlawful sexual penetration 1 st degree
11 774 FB 11 Unlawful sexual intercourse 2nd degree
11 775 FA 11 Unlawful sexual intercourse 1 st degree
3. ROBBERY: Feloniously taking, or attempting to take, anything of value from someone by force, threat of force, violence and/or by putting the victim in fear.
Title Section Class NCIC Offense
11 831 FE 12 Robbery in the second degree
11 832 FB 12 Robbery in the first degree
4. AGGRAVATED ASSAULT: An assault classified. as aggravated is determined by criteria rather than statute. The criteria pertain to the severity of the attack, unless a weapon is used. Attempted Murder is an aggravated assault. Simple assault is a Part IT Crime.
TItle Section Class NCIC Offense
11 604 FE 13 Reckless endangering in the first degree
11 612 FD 13 Assault in the second degree
11 613 FC 13 Assault in the first degree
11 1254 FB. FD 13 Assault in a detention facility
11 3532 FE 13 Intimidating acts
11 3533 FD 13 Aggravated intimidating acts
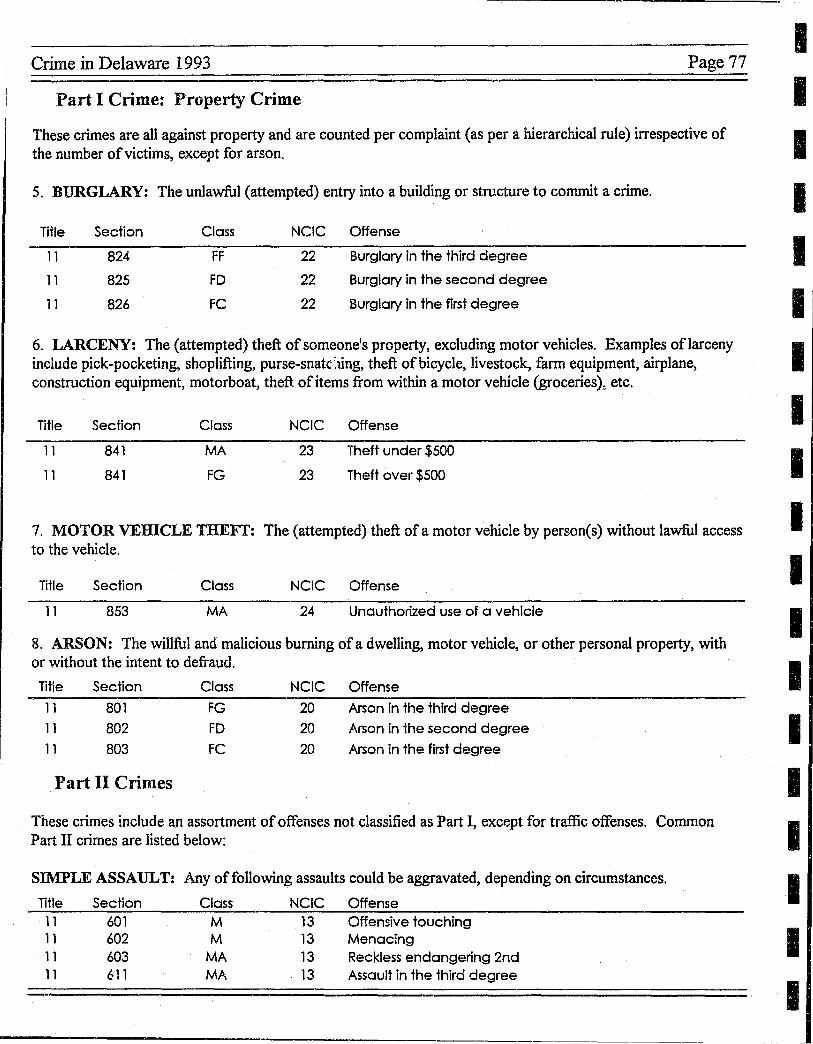
Crime in Delaware 1993 Page 77
Part I Crime: Property Crime
These crimes are all against property and are counted per complaint (as per a hierarchical rule) irrespective of the number of victims, except for arson.
5. BURGLARY: The unlawful (attempted) entry into a building or structure to commit a crime.
Title
11
11
11
Section
824
825
826
Class
FF
FD
FC
NCIC Offense
22 Burglary in the third degree
22 Burglary in the second degree
22 Burglary in the first degree
I I I I I I'
6. LARCENY: The (attempted) theft of someone IS property, excluding motor vehicles. Examples of larceny I include pick-pocketing, shoplifting, purse-snatc:ung, theft of bicycle, livestock, farm equipment, airplane, construction equipment, motorboat, theft of items from within a motor vehicle (groceries)~ etc.
Title
11
11
Section
841
841
Class
MA
FG
NCIC Offense
23 Theft under $500
23 Theft over $500
7. MOTOR VEmCLE THEFT: The (attempted) theft ofa motor vehicle by person(s) without lawful access to the vehicle.
Title Section Class NCIC Offense
11 853 MA 24 Unauthorized use of a vehicle
8. ARSON: The willful and malicious burning ofa dwelling, motor vehicle, or other personal property, with or without the intent to defraud.
Title Section Class NCIC Offense
11 801 FG 20 Arson in the third degree
11 802 FD 20 Arson in the second degree
11 803 FC 20 Arson in the first degree
Part II Crimes
These crimes include an assortment of offenses not classified as Part I, except for traffic offenses. Common Part II crimes are listed below:
SIMPLE ASSAULT: Any of following assaults could be aggravated, depending on circumstances.
Title Section Class NCIC Offense 11 601 M 13 Offensive touching 11 602 M 13 Menacing 11 603 MA 13 Reckless endangering 2nd 11 611 MA 13 Assault in the third degree
I I I I I I I I I I I I
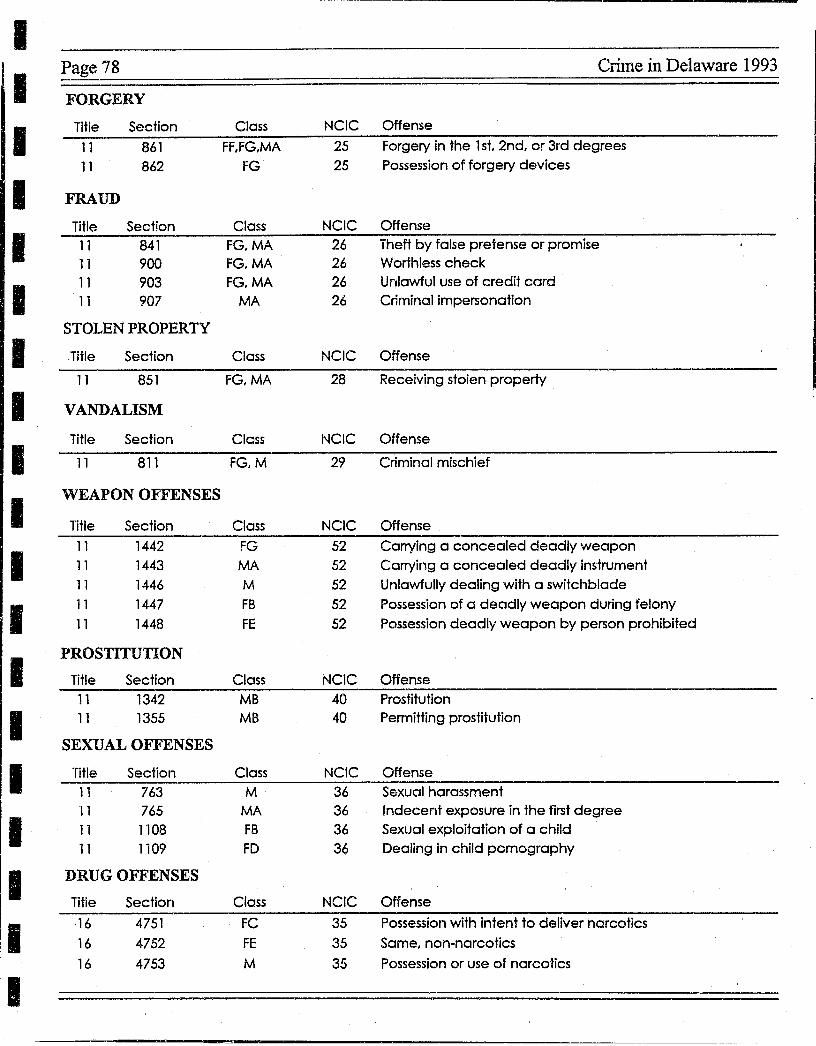
------
I Page 78 Crime in Delaware 1993
I FORGERY
I Title Section Class NCIC Offense
11 861 FF,FG,MA 25 Forgery in the 1 st, 2nd, or 3rd degrees
11 862 FG 25 Possession of forgery devices
I FRAUD
Title Section Class NCIC Offense
I 11 841 FG,MA 26 Theft by false pretense or promise
11 900 FG,MA 26 Worthless check
I 11 903 FG,MA 26 Unlawful use of credit card 11 907 MA 26 Criminal impersonation
STOLEN PROPERTY
I Title Section Class NCIC Offense
11 851 FG,MA 28 Receiving stolen property
I VANDALISM
Title Section Class NCIC Offense
I 11 811 FG,M 29 Criminal mischief
I WEAPON OFFENSES
Title Section Class NCIC Offense
11 1442 FG 52 Carrying a concealed deadly weapon
I 11 1443 MA 52 Carrying a concealed deadly instrument
11 1446 M 52 Unlawfully dealing with a switchblade
I 11 1447 FB 52 Possession of a deadly weapon during felony
11 1448 FE 52 Possession deadly weapon by person prohibited
I PROSTITUTION
Title Section Class NCiC Offense
11 1342 MB 40 Prostitution
I 11 1355 MB 40 Permitting prostitution
SEXUAL OFFENSES
I Title Section Class NCIC Offense
11 763 M 36 Sexual harassment 11 765 MA 36 Indecent exposure in the first degree
I 11 1108 FB 36 Sexual exploitation of a child
11 1109 FD 36 Dealing in child pomography
I DRUG OFFENSES
Title Section Class NCIC Offense
I 16 4751 FC 35 Possession with intent to deliver narcotics
16 4752 FE 35 Same, non-narcotics
16 4753 M 35 Possession or use of narcotics
I
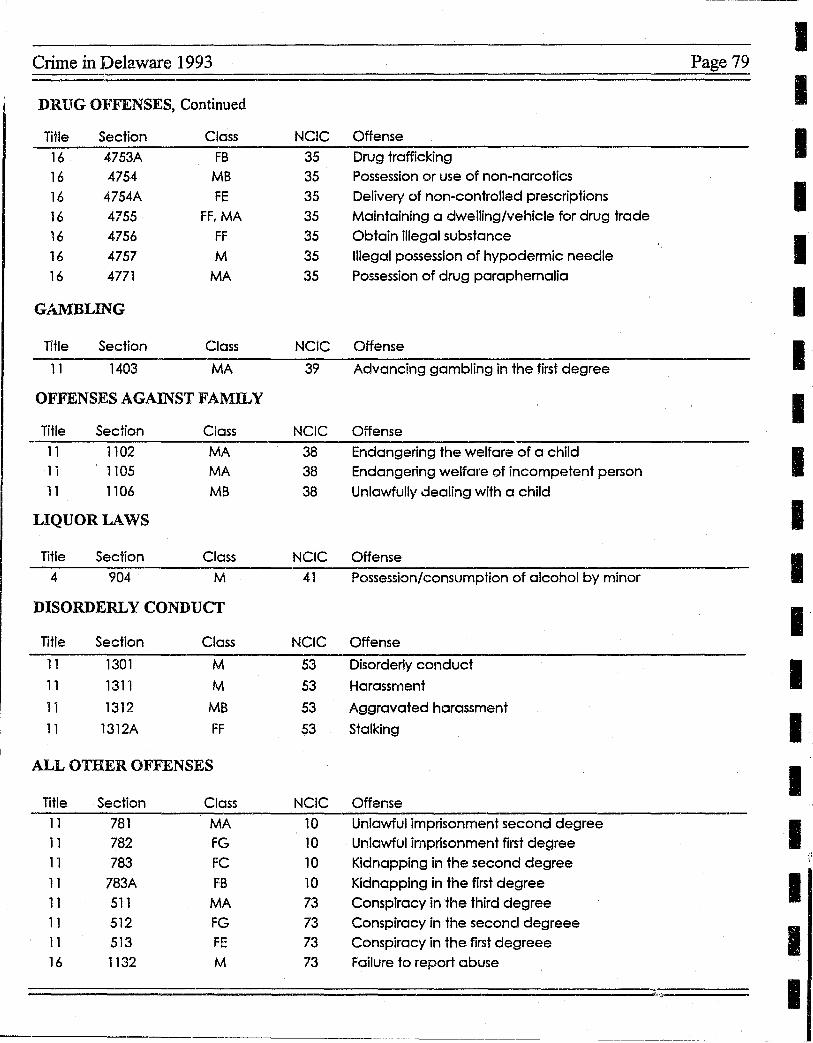
I Crime in Delaware 1993 Page 79
DRUG OFFENSES, Continued I TItle Section Class NCIC Offense I 16 4753A FB 35 Drug trafficking
16 4754 MB 35 Possession or use of non-narcotics
16 4754A FE 35 Delivery of non-controlled prescriptions I 16 4755 FF. MA 35 Maintaining a dwelling/Vehicle for drug trade
~6 4756 FF 35 Obtain illegal substance
I 16 4757 M 35 Illegal possession of hypodermic needle
16 4771 MA 35 Possession of drug paraphemalia
GAMBLING I TItle Section Class NCIC Offense I 11 1403 MA 39 Advancing gambling in the first degree
OFFENSES AGAINST FAMILY I Title Section Class NCIC Offense
11 1102 MA 38 Endangering the welfare of a child I 1i 1105 MA 38 Endangering welfare of incompetent person 11 1106 MB 38 Unlawfully dealing with a child
LIQUOR LAWS I Title Section Class NCIC Offense I 4 904 M 41 Possession/consumption of alcohol by minor
DISORDERLY CONDUCT
I TItle Section Class NCIC Offense
11 1301 M 53 Disorderly conduct I 11 1311 M 53 Harassment
11 1312 MB 53 Aggravated harassment
11 1312A FF 53 Stalking I ALL OTHER OFFENSES
I Title Section Class NCIC Offense
11 781 MA 10 Unlawful imprisonment second degree I 11 782 FG 10 Unlawful imprisonment first degree 11 783 FC 10 Kidnapping in the second degree
;'
11 783A FB 10 Kidnapping in the first degree I 11 511 MA 73 Conspiracy in the third degree 11 512 FG 73 Conspiracy in the second degreee
I 11 513 FE 73 Conspiracy in the first degreee 16 1132 M 73 Failure to report abuse
....... ,.:.~ I

II
-------- *------- -Y45f1906 01/14/95 11:47:33.7 ANNUAL 1993 AGENCY aD STATEWIDE TOTALS
STATE OF DELA~IARre PAGEt 254 COUNTY
AGE, SEX AND RACE OF PERSONS ARRESTED 17 YEARS AND UNDER --------------------- AGE --------------------- -------- _ACE --------- ---- E-D ----
9 AND U.S. NON-CLASSIFICATION
Of OFFENSES SEX UNDER 10-12 13-14 15 16 17
TOTAL UNDER
18 WHITE BLACK INO ASIAN HISP HISP
HURDER AND NOHNEGlIGEHi It HANS lAUGHTER alA F
HAHSLAUGHTER BY H NEGLIGENCE 018 F
H FORCIBLE RAPE 02 F
Ii ROBBERY 05 F
AGGRAVATED ASSAULT " CRETURN A-4A-40 14 F
~URGLARY--8REAKIHG OR ENTERING
LARCENV--THEFT (EXCEPT "HOTDR VEHICLE THEFT)
"OTOR VEHICLE THEFT
OTHER ASSAULTS (RETURN A-4E)
ARSON
" 05 F
It 06 F
" 07 F
It 08 F
H 09 F
It FORGERV I COUNTERFEITING 10 F
It FRAlJl) 11 F
It EHBEZZLEHENT 12 F
STOLEN PROPERTY; BUYING It RECEIVING, POSSESSING 13 F
It VANOALISH 14 F
WEAPONS; CARRYING. r~SSESSING, ETC.
It 15 F
o o
o o
2 o
1 o
2 C
o o
(I
o
8 o
7 1
19 2
5 45 1 13
21 103 10 57
o o
17 2
o • o o
o o
G o
o
" 3 o
o o
7 o
72 22
'" 1
o 1
o 3
o o
6 a
34 3
9 2
o o
Q
'>I
27 1
29 1
72 16
o o
2 o
12 1
34 o
56 18
123 1111 12 10
292' 182 176 100
36 o
222 90 " 5
" 2 1
5 6
o o
47 6
102 7
20 11
43 4
138 73
2 1
4 2
10 5
o o
54 5
47 7
21 fl,
1 , o o
13 o
29 a
59 14
87 3
197 66
32 2
174 51
1
• 4 2
23 8
o o
63 4
69 1
21 2
1 o
1 o
6 IJ
19 a
57 14
79 4
177 96
33
• 181
53
4 o
6 5
I')
7
o a
52 6
76 6
17 2
2 o
3 o
68 2
119 2
265 64
440 43
972 525
151 6
804 291
16 6
16 11
57 29
o o
222 21
336 24
88 23
o o
1 , 37
2
21 II
115 19
306 27
579 269
53 2
354 112
14 it
II 7
19 18
o a
46 8
215 18
50 8
2
• 2
• 31 o
98 2
150 45
134 16
390 256
98 4
448 179
2 2
5 4
38 11
o G
176 13
120 6
38 15
o o
o o
a a
o o
o o
o G
Ci o
o o
o o
II a
o a
o a
o o
o o
o a
o i
a CD
o • o o
a a
o o
o o
3 o
o o
2
• o a
o o
o o
o o
a a
1 o
o o
o , 1 a
2 o
1 o
10 3
16 1
30 12
6 o
20 11
o II
2 2
3 o
o o
5 o
8 o
3 o
2 o
2 G
66 2
118 2
255 61
424 42
942 513
145 6
784 280
16 6
14 9
54 29
o o
217 21
328 24
85 23
-
II
I-tj
~ 00 o
()
§" (1)
S" t1 g.
~ ~ I-' \0 \0 UJ
-
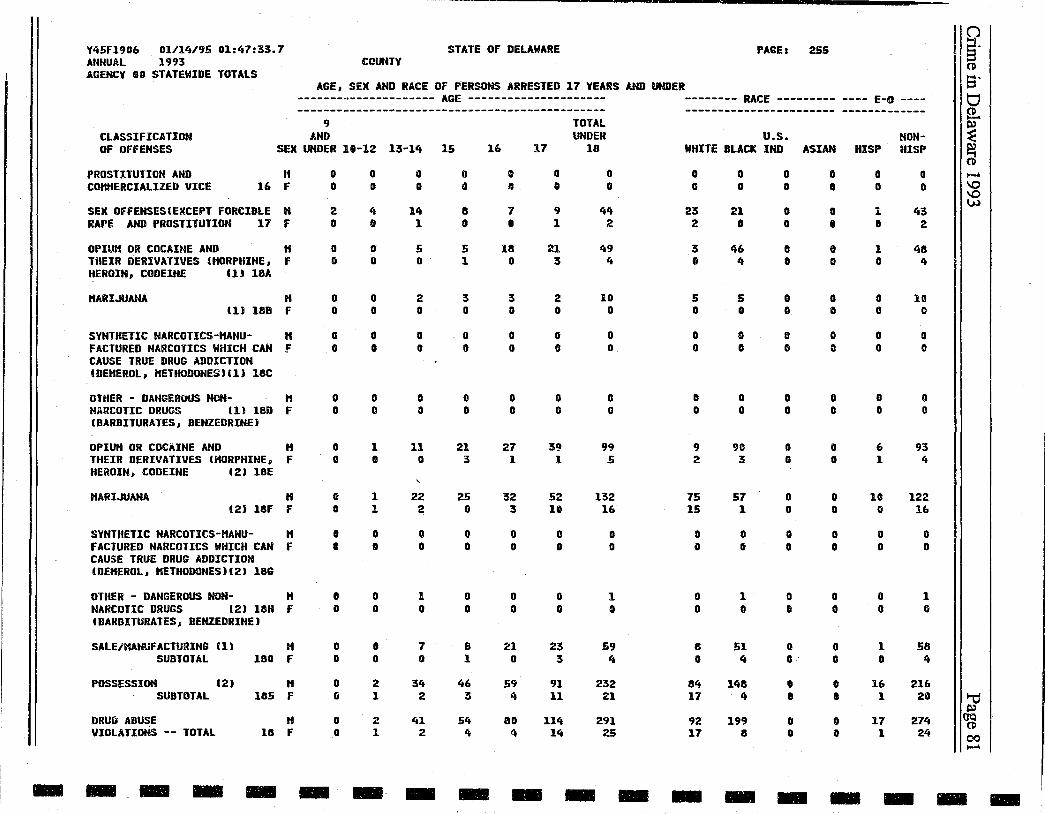
-
Y45F19D6 01/14/95 01:47:33.7 ANNUAL 1993 AGENCY GO STATEWIDE TOTALS
STATE OF DELAWARE PAGEl 255 COUNTY
AGE., SEX AND RACE OF PERSONS ARRESTED 17 YEARS AND UNDER
--------------------- AGE --------------------- -------- RACE ---------
9 AND u.S.
---- E-O ----
CLASSIFICATION OF OFFENSES SEX UNDER 10-12 13-14 15 16 17
TOTAL UNDER
18 WHITE BLACK IHD ASIAN HON
HISP HISP
PROSTXTUTION AND COHHERCIALIZED VICE " 16 F
SEX OfFENSES(EXCEPT FORCIBLE " RArE AND PROSTITUTION 17 F
OPIUM OR COCAINE AND H THEIR DERIVATIVES UIORPHINE, F HEROIN, CODEINE (1) 18A
MARIJUANA " (lJ 18B F
SYNTHETIC NARCOTICS-HANU- H FACTURED NARCOTICS WHICH CAN f CAUSE TRUE DRUG ADDICTION CDEKEROl, HETHODONES"lJ lac
OTHER - DANGEROUS NON- H NARCOTIC DRUGS (1) ISO F (BARBITURATES, BENZEDRINE)
OPIUM OR COCAINE AND H THEIR DERIVATIVES (HORPHINE, F HEROIN. CODEINE (2' 18E
MARIJUANA H (2) laF F
SYNTHETIC NARCOTICS-HANU- H FACTURED NARCOTICS WHICH CAN F CAUSE TRUE DRUG ADDICTION tDEHEROL, HETHODONES'(2' 18G
OTHER - DANGEROUS HOH- H NARCOTIC DRUGS (2) 188 F (BARBITURATES, BENZEDRINE)
SALE/MANUFACTURING (I) " SUBTOTAL 180 F
POSSESSION (2) It SUBTOTAL 185 F
DRUG ABUSE H VIOLATIoNs -- TOTAL 18 F
- - - - -
o o
2 o
o o
o o
o G
o o
o o
r; o
o •
o o
c o
o Ii
o o
o o
4 o
o o
o o
o c
o o
1 o
1 1
o I
o o
o o
2 1
2 1
-
o o
14 1
5 o
2 o
o o
o o
11 o
22 2
o o
1 o
7 o
34 2
41 2
-
o III
8 o
5 1
3 o
o o
o o
21 3
25 o
o o
o o
8 1
46 3
54 4
-
o ~
7
• 18 o
3 o
o o
o o
27 1
32 3
o (I
o o
21 o
59
" 80
4
-
o II
9 1
21 3
2 o
o o
o G
39 1
52 10
o o
o o
23 3
91 11
114 14
-
o o
44 2
49 4
10 o
o o
G o
99 5
132 16
o o
1 o
59 4
232 21
291 2.5
-
o o
23 2
3 It
5 o
o o
o o
9 2
75 15
o o
o o
8 o
84 11
92 17
-
o o
21
• 46
4
5 o
o o
o o
90 3
57 1
o o
1 o
51 ...
148 4
199 8
o o
o o
o o
o G
o II
o o
o G
o o
o o
o o
o c·
o • o D
- -
o • o • o o
o o
o o
o o
o o
o o
o o
o o
o D
o • o o
-
o o
1 II
1 o
o o
o o
o o
6 1
10 G
o o
o o
1 o
16 1
17 1
o o
43 2
48 4
10 o
o o
o o
93 4
122 16
o o
1 o
58 ...
216 212
274 24
-
II~ (1l
S· tJ (1l -~ ~
\0 \0 W
~
~ 00 ~
- -
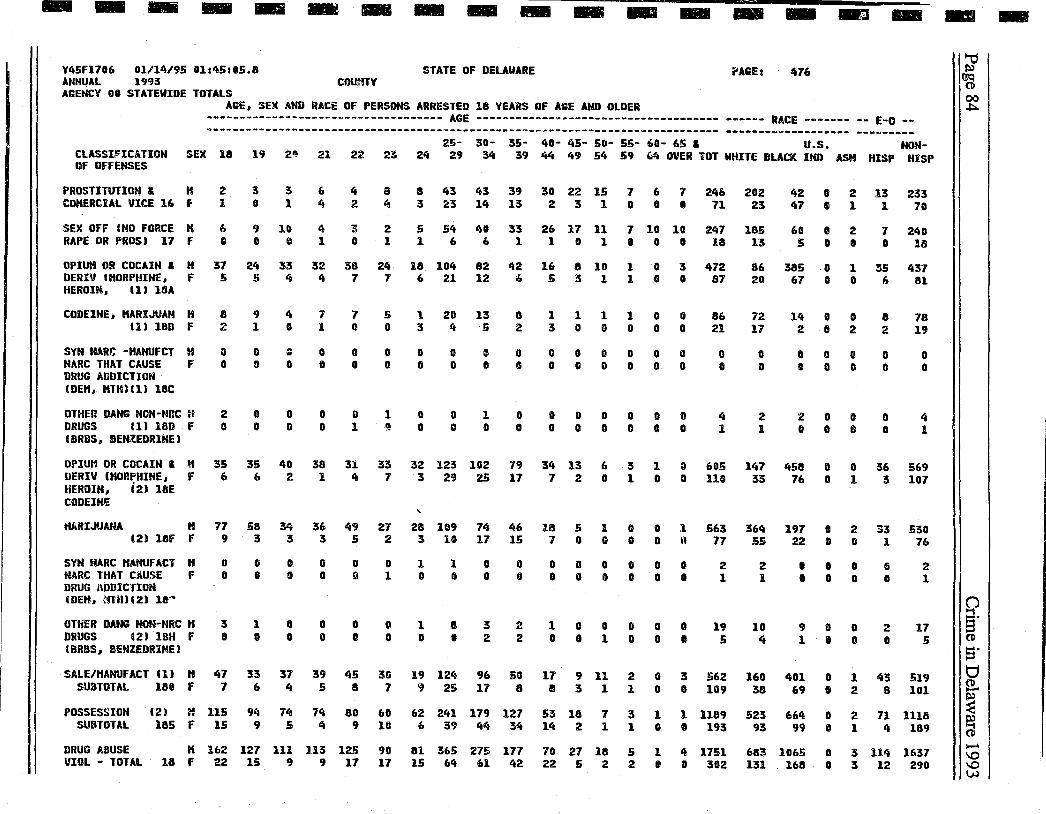
----- .. ---------~---Y45F1706 01/14/95 01145115.8 STATE OF DELAWARE i'AGEI 476 ANNUAL 1993 coomv AGENCY 00 STATEWIDE TOTALS
AGE, SEX AND RAtE OF PERSONS ARRESTED 18 YEARS OF AGE AND OLDER
------------------------------------ AGE ------------~------------------------ ------ RACE ------- -- E-O --~--------------------------------------------------~-----------------_________________ a __________________ _
25- 30- 35- 40- 45- 50- 55- ~o- 65 I U.S. NON-CLASSI~ICATIDH SEX 18 19 2~ 21 22 23 24 29 34 39 44 49 54 59 '4 OVER TOT WHITE BLACK IHD ASH HISP HISP OF OFFENSES
PROSTITUTION , H COHERCIAL VICE 16 f
SEX OFF (NO FORCE K RAPE OR PROS) 17 F
2 1
6
•
3
• 3 1
9 10 o U
6 it
4 1
4 2
3 o
8 t,
2 1
8 43 43 39 30 22 15 7 6 7 246 202 3 ~3 14 13 2 3 1 0 8 1 71 23
5 54 ~o 33 26 17 11 7 10 10 247 185 1 6 (:, 1 1 0 1 • 0 0 18 13
42 0 2 13 233 47 S 1 1 70
60 Cl 2 S D a
7 240 o IS
OPIUH OR COCAIN I H 37 24 33 32 38 24 18 104 82 42 16 a 10 1 0 3 472 DERIV IHORPHIHE, F 5 5 4 4 7 1 6 21 12 & 5 3 1 1 0 a 87 HEROIN, III 18A
86 385 0 1 35 437 20 67 0 0 b 81
CODEINE, HARIJUAN H (I) 18B F
SVN NAR~ -HANUFCT H NARC THAT CAUSE F DRUG ADDICTION (DEH, H1Ul(11 18C
OTtIER DANG HOH-NRC ~~ DRUGS (1) 180 F IBRBS, BENZEDRlNE)
e ... " o II
2 o
9 1
o I)
I)
o
4 D
:: G
o o
7 1
o a
It o
7 I)
o o
o 1
5 o
o o
1 .l!
1 20 13 3 4 5
o 0 I)
000
o 0 1 o I) 0
8 2
U II
o a
1 111 0 0 3 a 0 000
o 0 0 0 0 0 o 0 0 0 0 0
o 0 0 0 0 0 000 0 0 0
86 21
o o
4 1
72 17
o o
2 1
14 0 " 2 (! 2
D 0 0 e 0 0
:2 0 0 000
IS 2
o o
o o
78 19
o o
4 1
OPIUM OR COCAIN I M 35 3S 40 38 31 33 32 123 102 79 34 13 6 3 1 0 605 147 458 0 0 36 569 bERIV (HORPHIHE, F 6 6 2 1 4 7 3 29 2S 17 7 2 0 1 0 0 110 33 76 0 1 3 107 HEROIN, (2) 18E CIlDEINf
'-
HARlJUAHA H 77 58 34 36 49 27 28 109 74 46 18 5 1 0 0 1 563 364 197 0 2 33 530 (2) 18F f 9 3 3 3 5 2 3 10 1.7 15 7 0 GOO I' 77 55 22 G 0 1 76
SYN HARC HANUFACT HUG aGO 0 NARC THAT CAUSE F 0 • 0 a 9 1 DRUG j\DDICTION IDEM, ~iI)(2) 111-
OTHER DANG NOH-NRC H 3 1 0 0 0 0 DRUGS (2) 18H F 0 0 0 0 0 0 (BRBS, BENZEDRINE)
SALE/HANUFACT 11) H 47 33 37 39 45 30 S~BTOTAl 180 F 7 6 4 5 8 7
POSSES£ION 12) H 115 94 74 74 80 60 SUBTOTAL 185 F 15 9 S 4 9 10
1 II
1 o
1 o
8
•
a o
3 2
o a
2 2
19 124 96 SO , 2S 17 8
62 241 179 127 6 3~ 44 34
000 o a I)
100 .01
17 9 11 8 3 1
53 18 1 14 2 1
o o
o o
2 1
3 1
o o
o o
Ii o
1 a
G 2 2 •• 062 011.00 01
a 19 10 9 0 0 2 17 05" 11005
3 562 160 401 0 1 43 519 o 109 38 69 i 2 8 101
1 1189 523 664 0 2 71 1118 a 193 93 99 I 1 4 189
DRUG ABUSE H 162 127 III 113 125 90 81 365 275 177 70 27 18 5 1 4 1151 683 1065 0 3 114 1637 VIOL - TOTAL 18 F 22 15 9 9 17 17 15 64 &1 42 22 5 2 2 0 D 302 131 168 0 3 12 290
~ ~ 00 ~
(J f§. CD
S· o g,..
~ ~ ..... \0 \0 Vl
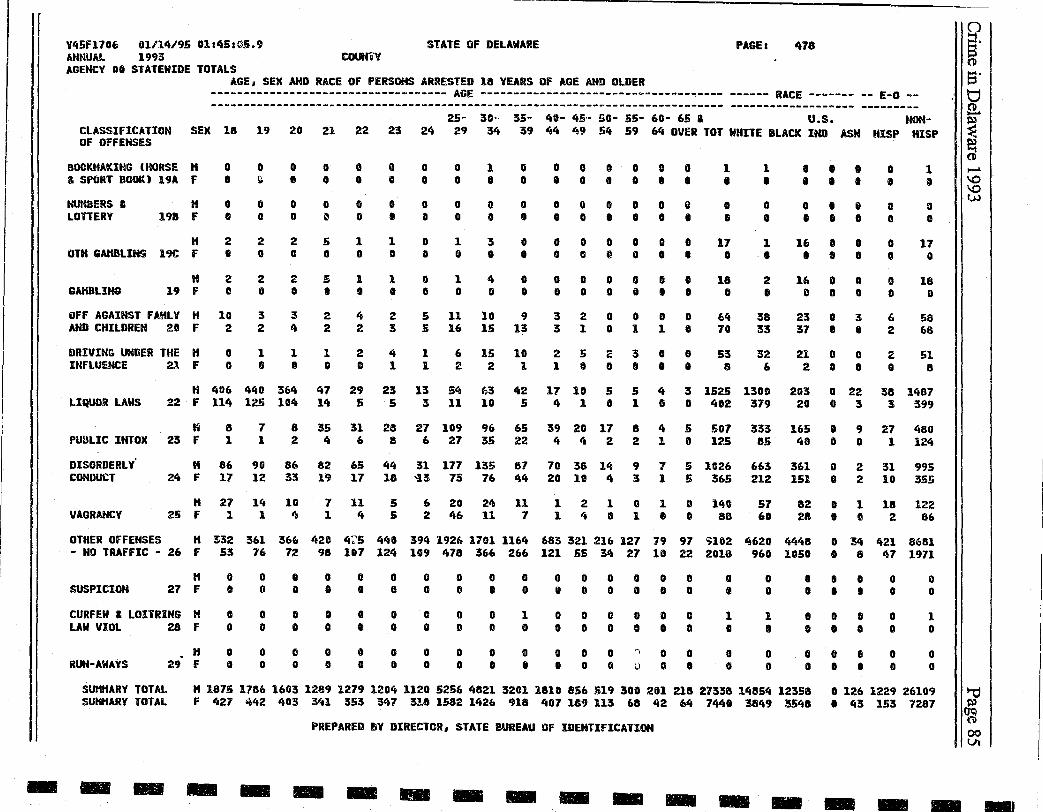
Y45F1706 01/14/95 OlI451~5.9 STATE OF DELAWARE PAGEl 478 ANNUAL 1993 COUHiY AGENCV 00 STATENIDE TOTALS
AGE, SEX AND RACE Of PERSONS ARRESTED 18 YEARS OF AGE AND OLDER -----------------------------~------ AGE ------------------------~------------ ------ RACE ------- -- E-O ----------------------------------~--------------------------------------------- ------------------- ---------
25- 30" 35- 40- loS,· SO- 55- 60- 65 I U.S. HOH-CLASSIfICATION SEK 18 19 20 21 22 23 24 29 34 39 44 ~9 54 59 64 OVER TOT WHITE BLACK INn ASH HISP HISP OF OFFENSES
900KHAKIHG (HORSE H & SPOKT BOOK) 19A F
NUHBERS • LOTTERY'
H 198 F
" OTH GAHBLIHS 19C f
GAHBL!tIG " 19 F
o • o o
2 o
2 o
OFF AGAINST FAMLV H 10 AND CHILDREN 21 F 2
DRIVING UNDER THE H 0 INFLUENCE 21 F 0
o
" o o
2 o
2 a
3 2
1 G
o t!
o a
2 o
2 o
3 4
1 I
o o
o ~
5 a
5
• 2 2
1 o
II o
o o
1
" 1 a
4 2
2 C
o
" G
• 1 o
1
• 2 3
4\ 1
o a
o • o o
D o
o o
o o
1 o
1 o
1
• o I)
3 o
4 I»
o o
D o
o • o o
5 11 10 9 5 16 15 13
1 6 15 10 1 221
a 0 0 CillO IJ 0 It 0 • •
o 0 000 i.t a a • • 0 •
000 0 0 0 o COO • •
o 0 0 I) " 0 o 0 0 it • II
320 0 0 0 3 1 011 0
2 5 (; 3 C 0 1 ., 0 8 • 0
1
• o •
17 o
18 o
64 70
53
"
1
• o o
1
• 2 o
38 33
32 6
• • 0 II • •
o • i
• • 0
16 '" • • e 8
16 0 a 13 0 D
23 0 3 37 • •
21 0 0 2 I 0
o i
II o
a a
o o
6 2
2 o
1 o
II o
17 o
18 o
58 68
51 8
lIQUOR LAWS H 406 440 364 47 29 23 13 S4 63 42 17 10 5 5 4 3 1525 1300 203 0 22 38 1487
22 F 114 125 104 14 5 5 3 11 10 5 4 1 0 1 G 0 402 379 20 0 3 3 399
H PU3LIC IHTOK 23 F
8 1
7 1
8 35 31 28 27 109 96 65 39 20 17 8 4 5 507 333 165 a 9 27 480 2 4 6 e 6 27 35 22 4 it 2 2 1 0 125 85 40 0 0 1 124
DISORDERLY' CONDUCT
VAGRANCY
" 86 90 86 82 65 44 31 177 135 87 70 36 14 9 7 5 1026 663 361 0 2 31 995 24 F 17 12 33 19 17 18 ~3 73 76 44 20 10 4 3 1 5 365 212 151 0 2 10 355
H 27 14 10 25 F 1 1 it
7 11 1 it
5 5
6 20 24 11 2 46 11 7
1 2 1 0 1 0 140 1 4 It 1 • • 88
57 60
82 0 1 18 122 28 • 0 2 86
OTHER OfFENSES H ~32 361 366 420 4~5 440 394 1926 1701 1164 683 321 216 127 79 97 ,102 4620 4448 0 34 421 8681 - HO TRAFFIC - 26 f 53 76 72 98 107 124 109 478 366 266 121 S5 34 27 10 22 2010 960 1050 0 6 47 1971
SUSPICION H
27 F
CURFEW 'LOITRIHG H LAN VIOL 28 F
RUH-ANAVS - " 29 f
o It
o o
o II
o o
o G
o o
o o
o o
o o
o o
o o
o o
a • o • o o
o o
o o
o o
o o
o o
o o
o o
o o
a o
o • o o
o II
o o
1 o
o •
000 a 0 II o 000 0 0
o 0 000 C o 0 0 0 0 a
000 " 0 0 000 tJ 0 •
a • 1
• o o
o o
1 a
o o
• II a II • •
000 o • 0
000 a 0 •
a C
o o
o o
I)
o
1 o
o o
SutlHARY TOTAL SUHHARV TOTAL
H 1875 1756 1603 1289 1279 1204 1120 5256 4821 3201 1810 656 519 300 201 218 27338 14854 12358 0 126 1229 26109 F 427 ~42 403 341 353 347 318 1582 1426 918 407 189 113 68 42 64 7440 3849 3548 • 43 153 7287
PREPARED 6Y DIRECTOR. STATE BUREAU OF IDENTIfICATION
------------------
o ~l (1)
S· t1 ~
~ a ~
\0 \0 W
~ f.\l
~ 00 lJ'I
-
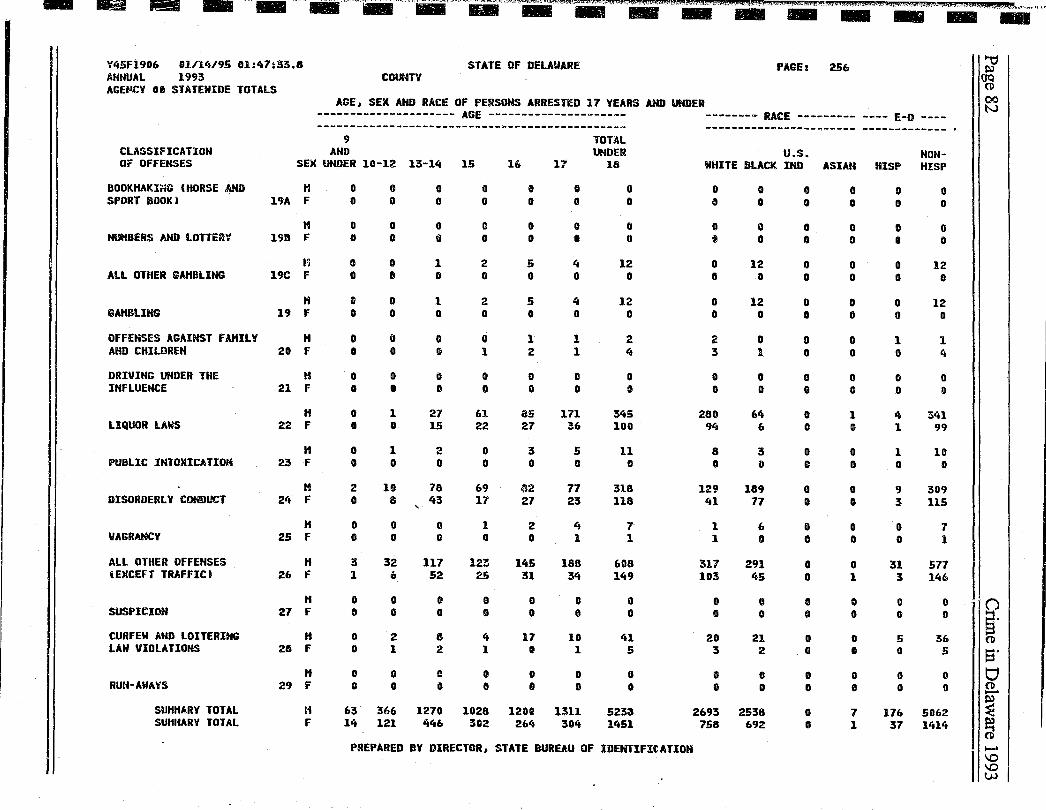
"'''''''''''' -"".~ -" ,." .. --, '." ... '.~.' • ...,...,"f .. ~~".-. •. r1...,~,l\" ...... ""'.,..,_"'~~llC'-~~ ..... dUM Sq:;:, qi!;:;i(FS9.%~"',"~I;'t'~~~5"'Np_I'!;;ZLI.,..:lfJ'!'#4'! J! <.:tlh;:iiK~t<t;ttI;;l;C;:;~S:;AkCJ"."J",}i§,$#i;; ... _Uti$_,_.,E;¥$,:;::rtJS't,j'f;&f;W(li-i4PN4;:;!f§i1i%!+Mf."1't.O",- C_, is }4JI,. ... 1!!U~W'5M6,Jiitt·W;;O".;:;'*'EJ\iL.+.Y;;;;",.gpJ¥i4!i!l4~AH:alS.,e, "./,8;(. %.Hk9.!tM ,.(JiJ!'!iR.-,Sp..:,;;"'*'+JW.\@Ji{N.,..,. ..... ", .. :A_.r q, - ama"'!fi!i!!I"'_' _,," __ .. ____ .. ____ _
Y45F1906 01/14/95 01:47~S3.a STATE OF DELAWARE PAGEl 256 ANNUAL 1993 COUNTY AGEMCY .1 STATEWIDE TOTALS
AGE, SEX AND RACE OF PERSONS ARREST~D 17 YEARS AND UNDER --------------------- AGE --------------------- -------- RACE --------- ---- E-O ----
9 AND CLASSIFICATION
Of OFFENSES SEX UNDER 10-12 13-14 15 1& 17
TOTAL UNDER
18
BOOKHAKI"G (HORSE AND H SPORT BOOK) 19A F
H NUHBERS AND LOTTE~Y 198 F
~ ALL OTHER GAMBLING 19C F
H GAHBLING 19 F
OFFENSES AGAINST FAHILY H AND CHILDREN 211 F
DRIVING UNDER THE H INFLUENCE 21 F
H LIQUOR LAWS 22 F
H PUBLIC INTOXICATION 23 F
DISORDERLY CONDUCT
VAGRANCY
ALL OTHER OFFENSES iEXCEfT TRAFFIC)
SUSPICION
CURFEW AND LOITERING LAW VIOLA TIOt~
RUN-AWAYS
SUHHARY TOTAL SUHltARY TOTAL
H 24 F
H 25 F
H 26 F
" 27 F
H 28 F
H 29 f
[1 F
o o
o o
o a
G a
o o
(I
o
(I
o
(I
o
2 o
o o
3 1
c (I
o o
o • o o
.. o
o • 1 a
1 o
o o
o Ii
1 a
1 o
o Ii
j)
" 27 15
2 (I
10 78 8 43
o o
32 ..
" o 1.'1
117 52
o o
c o
2 o
2 o
o 1
(I
o
61 22
o o
69 17
1 o
123 25
(I
o
(I
o
5 o
5 o
1 2
o o
as 27
3 o
:';2 27
2 o
145 31
(I
o
o (I
4 o
4 o
1 1
o o
171 36
5 o
77 23
4 1
188 34
o 0 (I 0 0 0 a 0 0 000
o 2 8 4 17 10 o 1 2 1 0 1
000 000 o 0 0 0 0 0
63 366 1270 1028 1200 1311 14 121 446 302 264 304
o (I
o o
12 o
12 o
2 4
o 11
345 100
11 o
318 118
7 1
608 149
o o
41 5
a o
5233 1451
PREPARED BY DIRECTOR, STATE BUREAU Of IDENTIFICATION
----------------------- ------------- . u.s. NON-
WHITE BLACK IND ASIAN HISP HISP
o (I
Q (I
o ., o (I
:(
3
o o
280 94
8 ., 129
41
1 1
311 103
o o
o o
12 o
12 (I
o 1
o o
64 6
3 (I
189 71
(,
o
291 45
o a o 0
211 21 3 2
II 0 Ii 0
2693 2538 758 692
a o
(I
o
(I
o
(I
o
o o
o o
o o
o II
o 12
o o
(I
o
I)
o
o o
o o
o G
o o
(I
II
o o
o o
o o
o o
1 o
o o
o o
fI I)
o 1
o o
o a
o 11
7 1
o o
o (I
o o
o II
1 o
o o
4 1
1 o
9 3
o o
31 3
o o
o o
12 o
12 o
1 4
o o
341 99
10 o
309 115
7 1
577 146
o 0 G 0
5 36 o S
o 0 o 1)
176 5062 37 1414
~
~ 00 tv
(J §. (tj
S· tj (tj -~ a ..... \0 \0 W
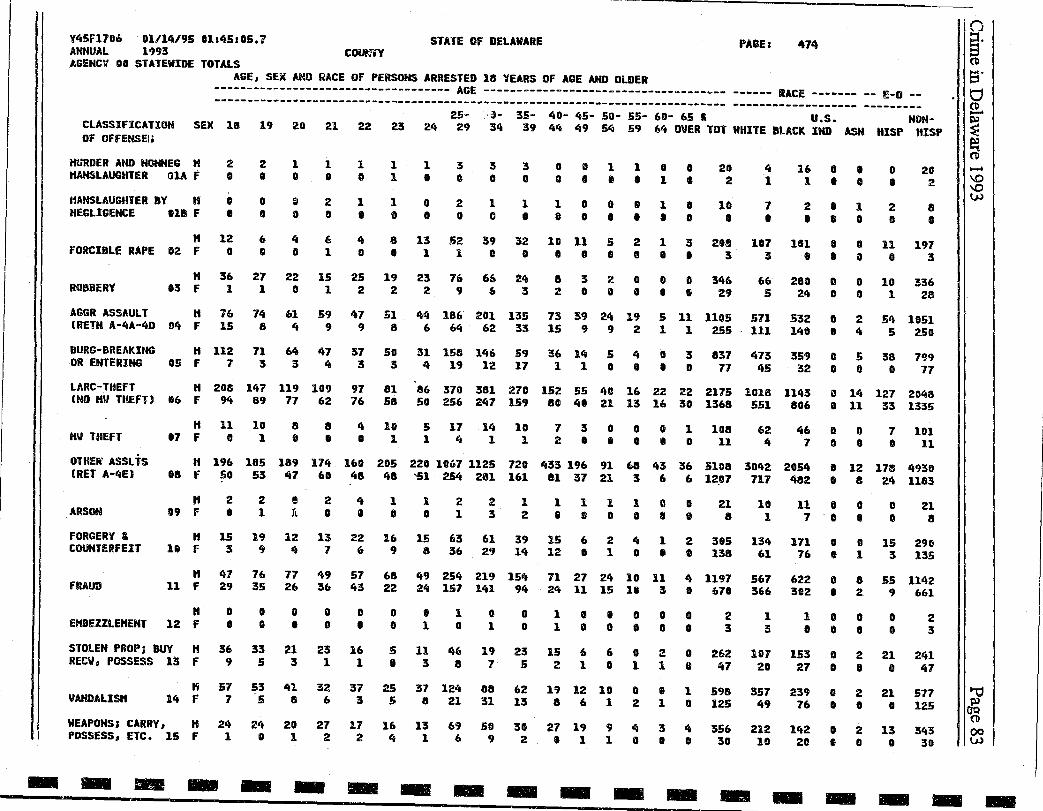
I
-
01/14/95 01145105.1 1993
Y45F170o ANNUAL AGENCV '0 STATEWIDE TOTALS
STATE Of DELAWARE COiJt..'iY
PAGEl 474
AGE, SEX AND ~ACE Of PERSONS ARRESTED 18 YEARS OF AGE AND OLDER ----------------------------------$- AGE ----------------------------------~ __ ------ RACe ------- -- ~-o -------------------------------------------------------------------------------- ------------------- ---------
25- ,'\)- 35- 40- 45- 50- 55- 60- 65 I u.S. NON-CLASSIFICATION SEX 1& 19 20 21 22 23 24 29 34 39 44 49 54 59 64 OVER TOT WHITE BLACK 1MB ASH HISP HISP OF OFfENSEi.
MURDER AND HONNEG H HANSLAUGHTER OIA F
HANSLAUGHTER BY H NEGLIGENCE 118 F
2 D
o I
H 12 fORCIBLE RAPE 02 F 0
2 I
o It
6 CI
1 o
fj
o
4 I)
1 It
2 II
6 1
1 o
1
• 4 o
1 1
1 o
1 , o o
3
" 2 o
3 o
1 o
3 o
1
•
o Gil IJ 0 o I 0 , 1 •
1 II 0 III o II • 0 I 0
211 2
10
•
4 1
7
•
16 a , 1 • 0
2 • 1 • • 0
o , 2 a
20 2
8 a
8 13 52 39 32 10 11 5 2 1 3 208 117 101 • 0 11 197 .11 0 0 0 I • 0 •• 3 3 •• 0 0 3
H 36 27 22 15 25 19 23 76 66 24 8 3 2 0 0 0 346 2 0 i 0 0 • 29
66 280 0 0 10 336 ROBBERY 13 F 1 1 0 1 2 2 2 9 6 3 5 24 0 0 1 28
AGGR ASSAULT H 76 74 61 59 47 51 44 186 201 135 73 39 24 19 5 11 1105 571 532 0 2 54 1051 IRETN A-4A-4D 04 F 15 8 4 9 9 8 6 64 62 33 15 9 9 2 1 1 255 III 140 1 4 5 250
BURG-BREAKING H 112 71 64 47 37 50 31 158 146 59 36 14 5 4 a 3 837 473 359 0 5 38 799 OR ENTERING 05 F 7 3 3 4 3 3 4 19 12 17 1 1 0 • 0 0 77 45 32 0 0 0 77
lARC-THEfT H 208 147 119 109 97 81 86 370 381 270 152 55 40 16 22 22 2175 1018 1143 ~ 14 127 2048 INO HV THEFT) 16 F 94 89 77 62 76 58 50 256 241 159 80 41 21 13 16 30 1368 551 806 0 11 33 1335
"'iI THEFT
OTHE'" ASSL TS (RET A-4E)
ARSON
FORGERY & COUNTERFEIT
" 11 10 17 F 0 1
IS 8
8
• 4 10 o 1
5 17 14 10 1 4 1 1
7 3 0 0 0 1 108 2 • • • It 0 11
62 4
46 0 0 700
7 101 o 11
" 196 185 189 174 160 205 220 lO~7 1125 720 433 196 91 68 43 36 5108 3042 2054 • 12 175 4930 88 F 50 53 47 60 48 48 ~1 254 281 161 81 37 21 3 6 6 12.7 717 482 0 e 24 1183
H 2 2 , 2 4 1 1 2 2 1 1 1 1 1 a 0 21 10 11 0 0 0 21 19 F • 1 n I • • 0 1 3 2 • GOO I 0 8 1 7 0 • a 8
H 15 19 12 13 22 16 15 63 61 39 15 6 2 4 1 2 305 134 171 I a IS 290 18 F 3 9 4 1 6 9 8 36 29 14 12 a 1 0 • 0 138 61 76 e 1 3 135
H ~7 FRAUD 11 F 29
76 35
77 49 26 36
57 68 49 254 219 154 71 27 24 10 11 4 1197 567 622 43 22 24 151 141 94 24 11 15 II 3 0 671 366 302
o Ii • 2
55 1142 9 661
H 0 £HBEZZlEHENT 12 F •
STOLEN PROP; BUY H 36 RECU, POSSESS 13 F 9
o o
33 .&
" 0 • 0
21 23 3 1
00.1001,. It 0 0211 .010101., 0 0 0.330
16 S 11 46 19 23 15 6 6 0 2 0 262 101 153 1 • 3 IS 7 !i 2 1 0 1 1 8 1f7 20 27
&I 0 o a
II) 2 o I
o 2 a 3
21 241 o 47
'0 ~. (I)
S· o g,.
~ @ ..... \0 \0 u.l
VANDALISH K 57
14 F 7 53 '5
41 32 8 6
37 25 31 124 88 62 19 12 10 0 , 1 598 357 239 3 5 8 21 31 13 a 6 1 2 1 0 125 49 76
o 2 o 0
21 577 II ~ a 125 (JQ
WEAPONS} CARRY, H 24 POSSESS, ETC. 15 F 1
- .. -24 o
-20 27
1 2
-17 16 13 69 50 30 27 19 9 ~ 3 it 356 212 142
2 it 1 6 9 2 • 1 1 it .. 0 30 10 211
---------o 2 • 0
-(I)
13 343 11 00 o 30 u.l
- --
Related Documents