HyspIRI TIR Science Measurement Baseline and Instrument Concept NASA Earth Science and Applications Decadal Survey Simon J. Hook and HyspIRI Team © 2011 California Institute of Technology. Jet Propulsion Laboratory, California Institute of Technology. Government sponsorship acknowledged.

Welcome message from author
This document is posted to help you gain knowledge. Please leave a comment to let me know what you think about it! Share it to your friends and learn new things together.
Transcript
HyspIRI
TIR Science Measurement Baseline and Instrument Concept
NASA Earth Science and Applications
Decadal Survey
Simon J. Hook and HyspIRI Team
© 2011 California Institute of Technology. Jet Propulsion Laboratory, California Institute of Technology. Government sponsorship acknowledged.
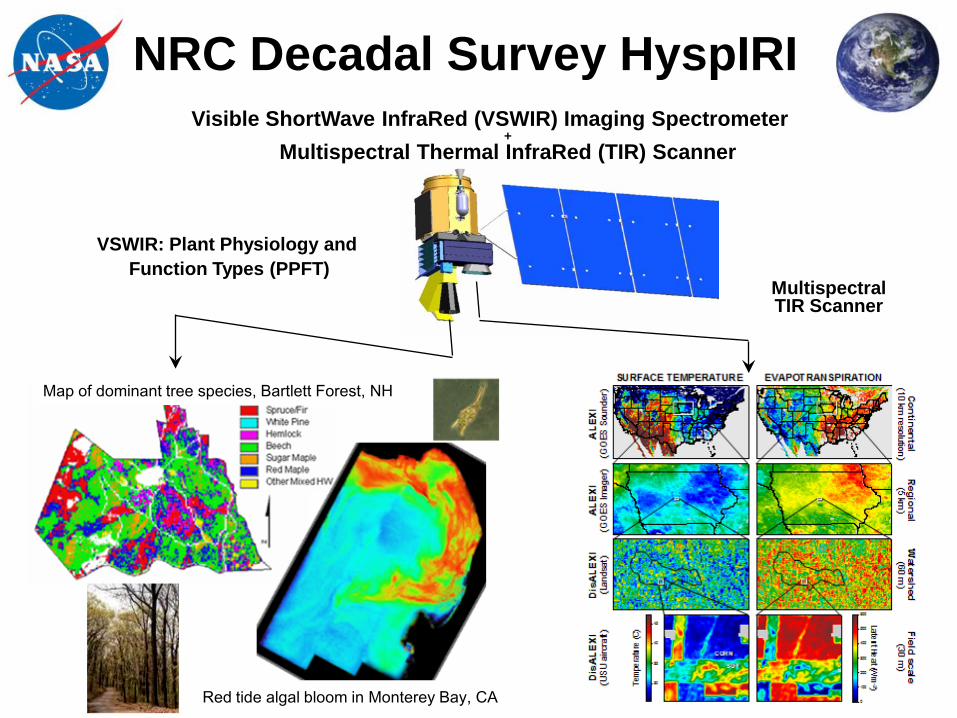
NRC Decadal Survey HyspIRI Visible ShortWave InfraRed (VSWIR) Imaging Spectrometer
+ Multispectral Thermal InfraRed (TIR) Scanner
VSWIR: Plant Physiology and Function Types (PPFT)
Multispectral TIR Scanner
Red tide algal bloom in Monterey Bay, CA
Map of dominant tree species, Bartlett Forest, NH
3
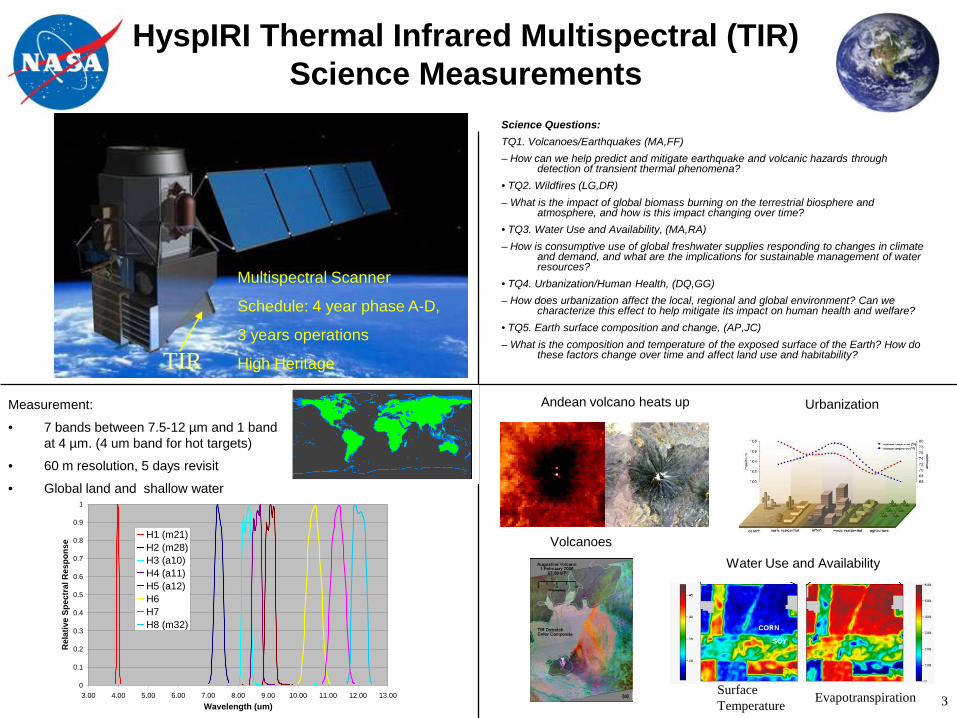
HyspIRI Thermal Infrared Multispectral (TIR) Science Measurements
Science Questions: TQ1. Volcanoes/Earthquakes (MA,FF) – How can we help predict and mitigate earthquake and volcanic hazards through
detection of transient thermal phenomena? • TQ2. Wildfires (LG,DR) – What is the impact of global biomass burning on the terrestrial biosphere and
atmosphere, and how is this impact changing over time? • TQ3. Water Use and Availability, (MA,RA) – How is consumptive use of global freshwater supplies responding to changes in climate
and demand, and what are the implications for sustainable management of water resources?
• TQ4. Urbanization/Human Health, (DQ,GG) – How does urbanization affect the local, regional and global environment? Can we
characterize this effect to help mitigate its impact on human health and welfare? • TQ5. Earth surface composition and change, (AP,JC) – What is the composition and temperature of the exposed surface of the Earth? How do
these factors change over time and affect land use and habitability?
Measurement:
• 7 bands between 7.5-12 µm and 1 band at 4 µm. (4 um band for hot targets)
• 60 m resolution, 5 days revisit
• Global land and shallow water
Volcanoes
Urbanization
Water Use and Availability
Surface Temperature Evapotranspiration
Andean volcano heats up
0
0.1
0.2
0.3
0.4
0.5
0.6
0.7
0.8
0.9
1
3.00 4.00 5.00 6.00 7.00 8.00 9.00 10.00 11.00 12.00 13.00Wavelength (um)
Rel
ativ
e Sp
ectr
al R
espo
nse
H1 (m21)H2 (m28)H3 (a10)H4 (a11)H5 (a12)H6H7H8 (m32)
Multispectral Scanner
Schedule: 4 year phase A-D,
3 years operations
High Heritage TIR

TIR Overarching Science Questions
• TQ1. Volcanoes/Earthquakes (MA,FF) – How can we help predict and mitigate earthquake and volcanic hazards through detection
of transient thermal phenomena? • TQ2. Wildfires (LG,DR)
– What is the impact of global biomass burning on the terrestrial biosphere and atmosphere, and how is this impact changing over time?
• TQ3. Water Use and Availability, (MA,RA) – How is consumptive use of global freshwater supplies responding to changes in climate
and demand, and what are the implications for sustainable management of water resources?
• TQ4. Urbanization/Human Health, (DQ,GG) – How does urbanization affect the local, regional and global environment? Can we
characterize this effect to help mitigate its impact on human health and welfare? • TQ5. Earth surface composition and change, (AP,JC)
– What is the composition and temperature of the exposed surface of the Earth? How do these factors change over time and affect land use and habitability?

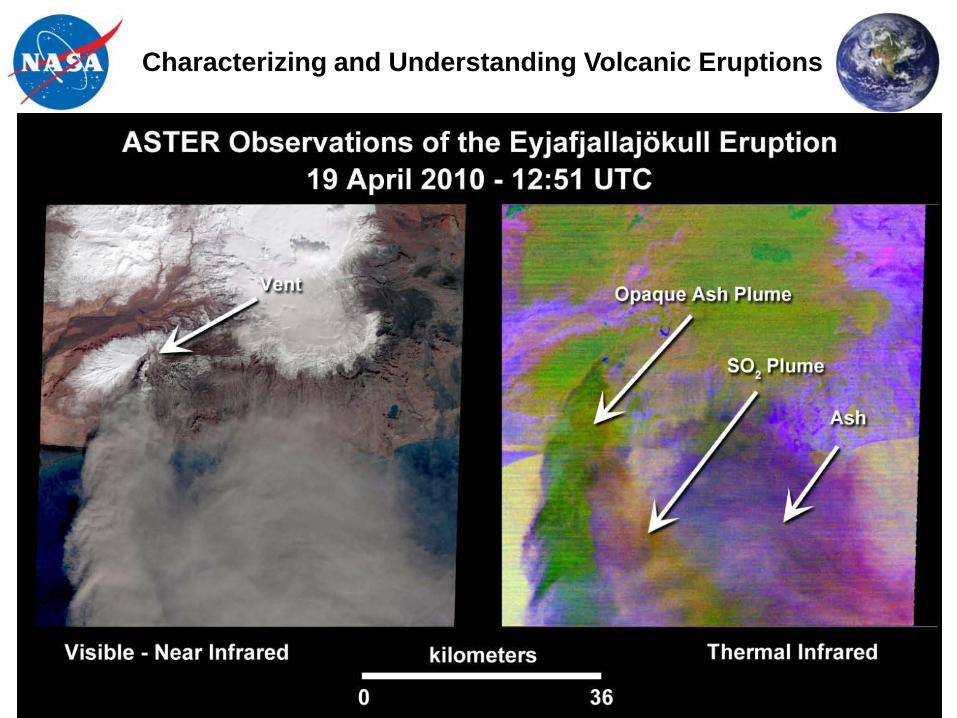
Characterizing and Understanding Volcanic Eruptions
Gas and thermal anomalies, plume composition including SO2 and ash content on weekly basis
“Likewise, the Tier 2 Hyperspectral Infrared Imager (HyspIRI) mission would include measurements over a range of optical and infrared wavelengths useful for detecting volcanic eruptions, determining the ash content of volcanic plumes, and identifying the occurrence and effects of associated landslides.” Source: Dr Jack Kaye, Presented to Subcommittee on Space and Aeronautics Committee on Science and Technology United States House of Representatives, May 5, 2010

Eyjafjallajökull Iceland Volcano
Eruption April 19 2010 MODIS image of ash plume.
Characterizing and Understanding Volcanic Eruptions
Characterizing and Understanding Volcanic Eruptions
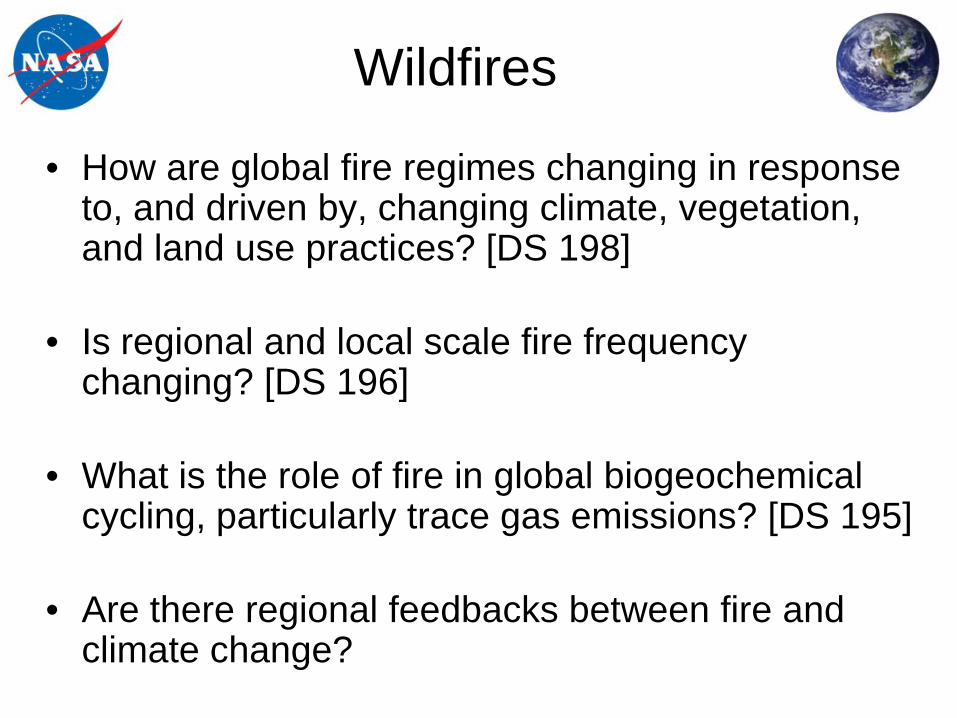
Wildfires
• How are global fire regimes changing in response to, and driven by, changing climate, vegetation, and land use practices? [DS 198]
• Is regional and local scale fire frequency changing? [DS 196]
• What is the role of fire in global biogeochemical cycling, particularly trace gas emissions? [DS 195]
• Are there regional feedbacks between fire and climate change?

Large error in carbon budget exists due to poor knowledge of Carbon release from fires
10/25/
9
MTISS Global CO2 budget for 1990-2000 (blue) and 2000-2008 (red) (GtC per year). Emissions from fossil-fuel and land-use change are based on economic and deforestation statistics. Atmospheric CO2 growth is measured directly. The land and ocean CO2 sinks are estimated using observations for 1990-2000 (Denman et al. IPCC 2007). For 2000-2008, the ocean CO2 sink is estimated using an average of several models, while the land CO2 sink is estimated from the balance of the other terms.
10
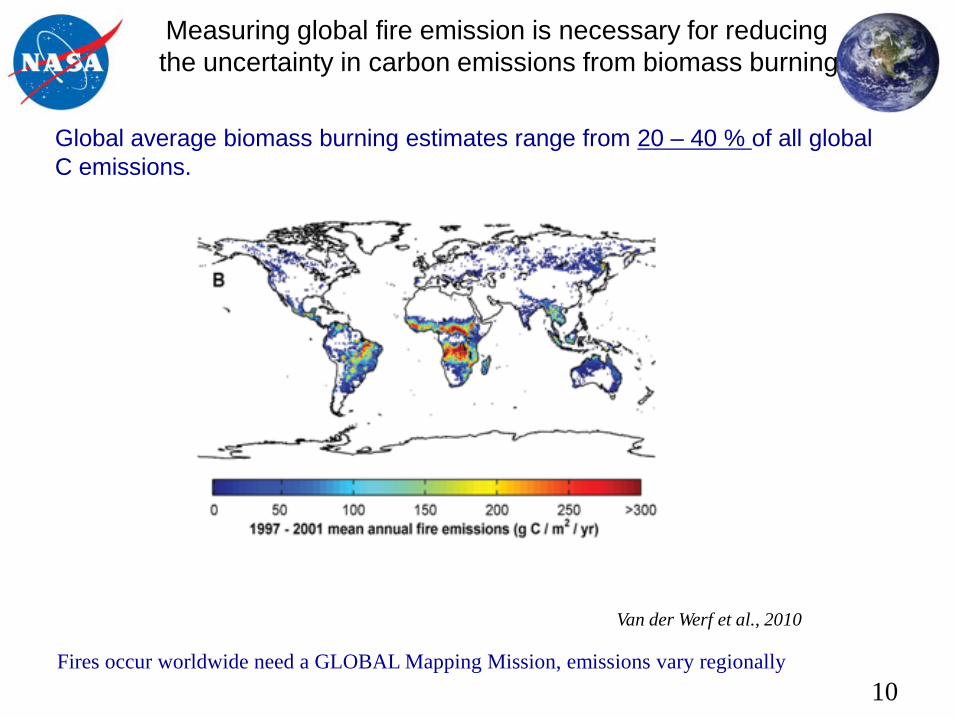
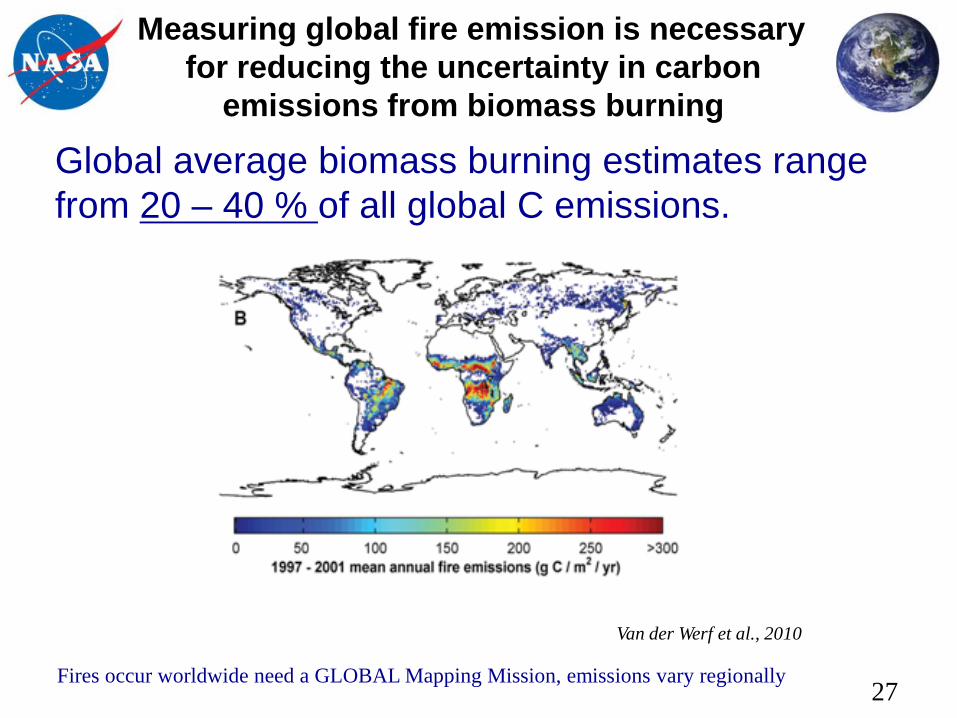
Measuring global fire emission is necessary for reducing the uncertainty in carbon emissions from biomass burning
Global average biomass burning estimates range from 20 – 40 % of all global C emissions.
Van der Werf et al., 2010
Fires occur worldwide need a GLOBAL Mapping Mission, emissions vary regionally
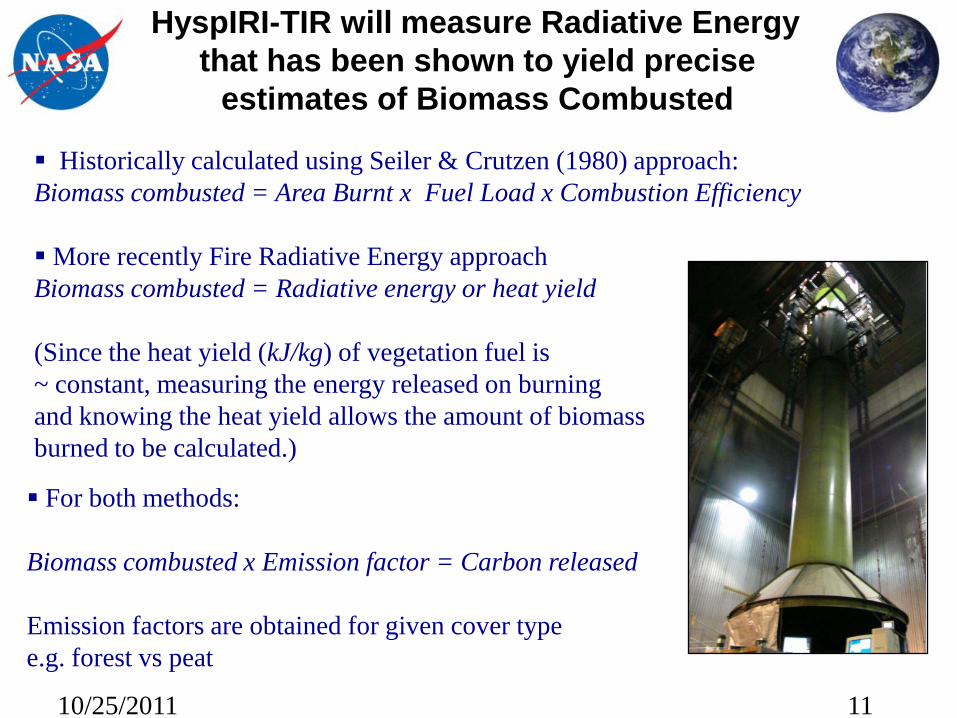
HyspIRI-TIR will measure Radiative Energy that has been shown to yield precise
estimates of Biomass Combusted
10/25/2011 11
Historically calculated using Seiler & Crutzen (1980) approach: Biomass combusted = Area Burnt x Fuel Load x Combustion Efficiency
More recently Fire Radiative Energy approach Biomass combusted = Radiative energy or heat yield (Since the heat yield (kJ/kg) of vegetation fuel is ~ constant, measuring the energy released on burning and knowing the heat yield allows the amount of biomass burned to be calculated.)
For both methods:
Biomass combusted x Emission factor = Carbon released
Emission factors are obtained for given cover type e.g. forest vs peat
12
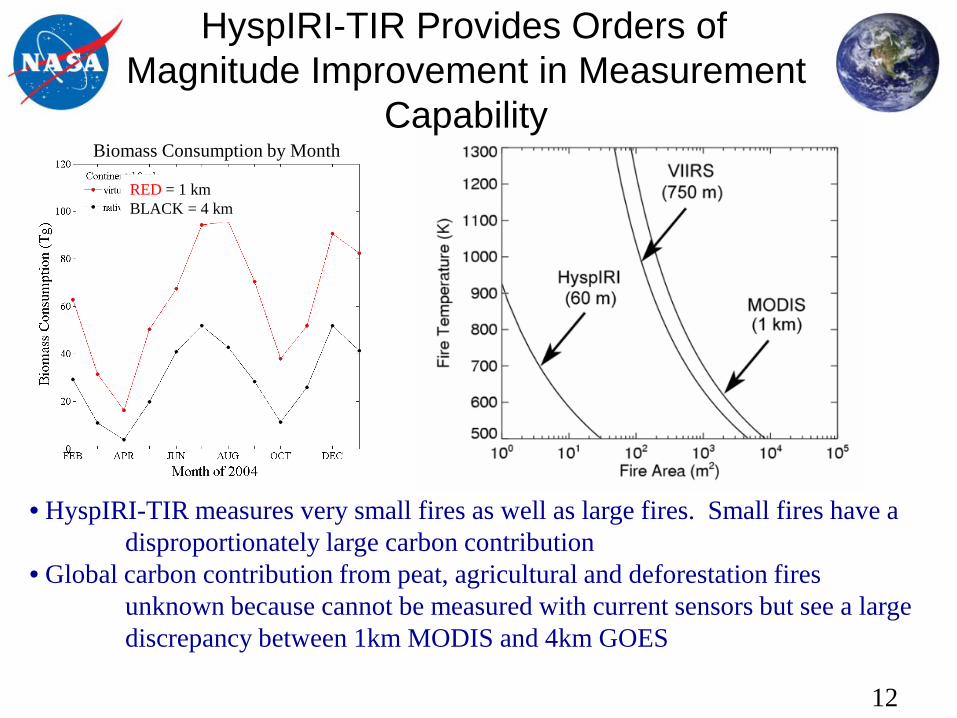
HyspIRI-TIR Provides Orders of Magnitude Improvement in Measurement
Capability
RED = 1 km BLACK = 4 km
• HyspIRI-TIR measures very small fires as well as large fires. Small fires have a disproportionately large carbon contribution • Global carbon contribution from peat, agricultural and deforestation fires unknown because cannot be measured with current sensors but see a large discrepancy between 1km MODIS and 4km GOES
Biomass Consumption by Month

Measuring carbon fire emissions requires measurements in the
Mid and Thermal Infrared
10/25/2011 13
Greater sensitivity due to shift in emission peak with temperature Measure radiance rather than temperature and avoid mixed pixel problem
Thermal emission peaks in the MIR (3-5 µm) region for fire temperatures ranging from ~ 650 K (weak smouldering) to ~ 1400 K (strong flaming). MIR is far more sensitive to hot targets than TIR.
MODIS only detects white boxes (1kmX1km) does not provide information on the fire front or smouldering part of fire
HyspIRI-TIR bands capture the Planck
curve
7 TIR Bands
Water Use and Availability
• How is climate variability (and ENSO) impacting the evaporative component of the global water cycle over natural and managed landscapes? [DS 166, 196, 203, 257, 368]
• What are relationships between spatial and temporal variation in evapotranspiration and land-use/land-cover and freshwater resource management? [DS 196, 203, 368]
• Can we improve early detection, mitigation, and impact assessment of droughts at local to regional scales anywhere on the globe? [DS 166, 196, 203, 368]; How does the partitioning of Precipitation into ET, surface runoff and ground-water recharge change during drought?
• What areas of Earth have water consumption by irrigated agriculture that is out of balance with sustainable water availability? [DS 196, 368]
• Can we increase food production in water-scarce agricultural regions while improving or sustaining quality and quantity of water for ecosystem function and other human uses? [DS 196, 368]
LAI
ETR
LAI
ETR
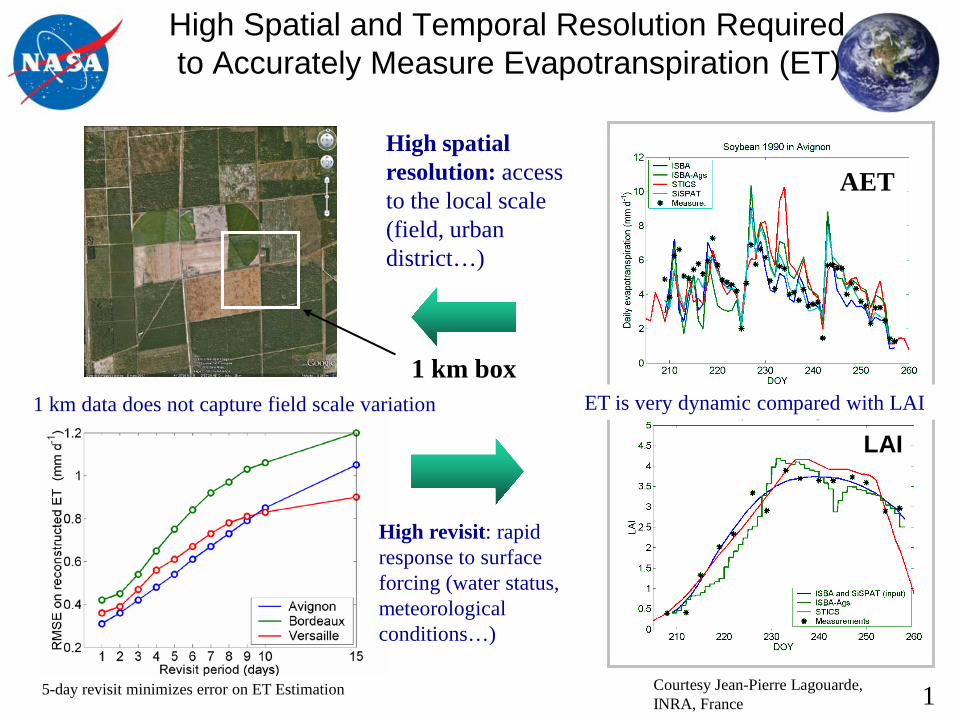
AET
High revisit: rapid response to surface forcing (water status, meteorological conditions…)
High spatial resolution: access to the local scale (field, urban district…)
1 km box
High Spatial and Temporal Resolution Required to Accurately Measure Evapotranspiration (ET)
Courtesy Jean-Pierre Lagouarde, INRA, France
1 km data does not capture field scale variation ET is very dynamic compared with LAI
5-day revisit minimizes error on ET Estimation 1
LAN
DS
AT
1
Landsat 7
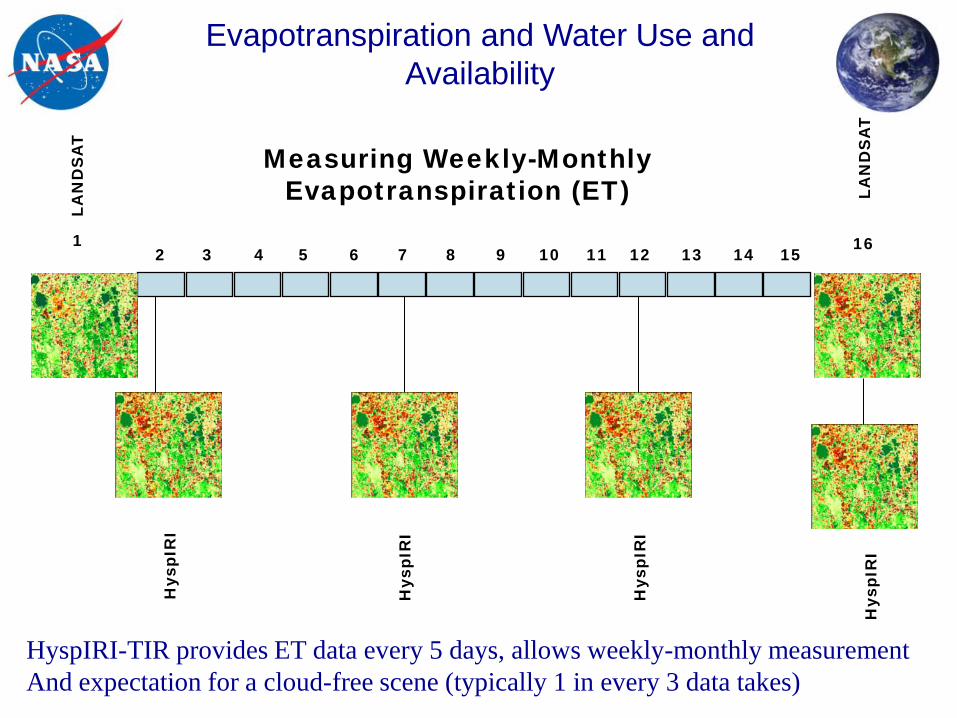
Measuring Weekly-Monthly Evapotranspiration (ET)
2 3 4 5 7 6 9 8 10 11 12 13 14 16
15
LAN
DS
AT
Hys
pIR
I
Evapotranspiration and Water Use and Availability
Hys
pIR
I
Hys
pIR
I
Hys
pIR
I
HyspIRI-TIR provides ET data every 5 days, allows weekly-monthly measurement And expectation for a cloud-free scene (typically 1 in every 3 data takes)

17
Mission Concept and Instrument Operational Scenario
• Following arrival at science orbit, the baseline data acquisition plan is established. Collect data for entire land surface excluding sea ice (Arctic and Antarctic) every 5 days at 60 m spatial resolution in 8 spectral bands
• Data are downlinked and transferred to the science data processing center where calibration and baseline processing algorithms are applied.
• Level 1, 2 products are delivered to the scientific community and general users to pursue the science questions – With appropriate cloud screening, compositing, spatial, and temporal subsetting
Land and coastal acquisition
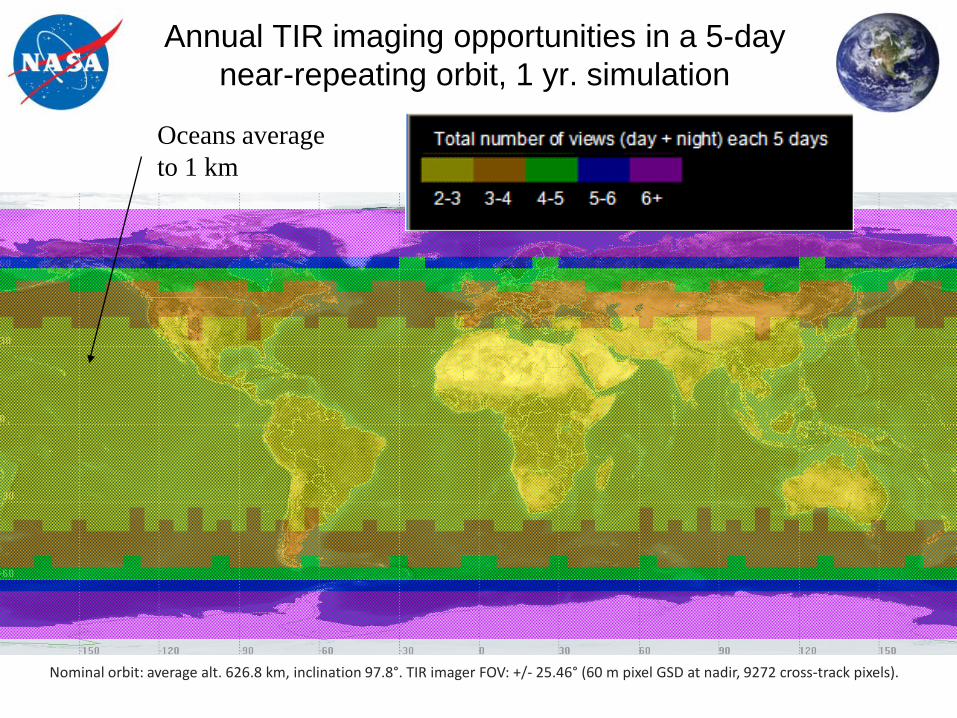
Annual TIR imaging opportunities in a 5-day near-repeating orbit, 1 yr. simulation
Nominal orbit: average alt. 626.8 km, inclination 97.8°. TIR imager FOV: +/- 25.46° (60 m pixel GSD at nadir, 9272 cross-track pixels).
Oceans average to 1 km
19
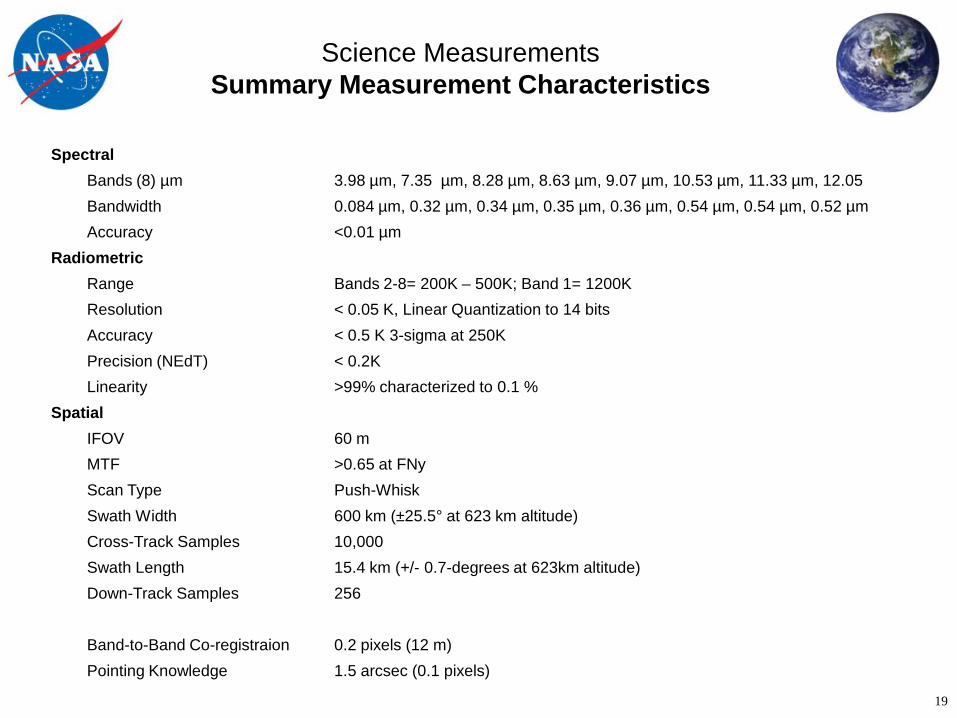
Science Measurements Summary Measurement Characteristics
Spectral Bands (8) µm 3.98 µm, 7.35 µm, 8.28 µm, 8.63 µm, 9.07 µm, 10.53 µm, 11.33 µm, 12.05 Bandwidth 0.084 µm, 0.32 µm, 0.34 µm, 0.35 µm, 0.36 µm, 0.54 µm, 0.54 µm, 0.52 µm Accuracy <0.01 µm Radiometric Range Bands 2-8= 200K – 500K; Band 1= 1200K Resolution < 0.05 K, Linear Quantization to 14 bits Accuracy < 0.5 K 3-sigma at 250K Precision (NEdT) < 0.2K Linearity >99% characterized to 0.1 % Spatial IFOV 60 m MTF >0.65 at FNy Scan Type Push-Whisk Swath Width 600 km (±25.5° at 623 km altitude) Cross-Track Samples 10,000 Swath Length 15.4 km (+/- 0.7-degrees at 623km altitude) Down-Track Samples 256 Band-to-Band Co-registraion 0.2 pixels (12 m) Pointing Knowledge 1.5 arcsec (0.1 pixels)

20
Temporal Orbit Crossing 10:30 am sun synchronous descending Global Land Repeat 5 days at equator OnOrbit Calibration Lunar View 1 per month {radiometric} Blackbody Views 1 per scan {radiometric} Deep Space Views 1 per scan {radiometric} Surface Cal Experiments 2 (d/n) every 5 days {radiometric} Spectral Surface Cal Experiments 1 per year Data Collection Time Coverage Day and Night Land Coverage Land surface above sea level Water Coverage Coastal zone -50 m and shallower Open Ocean Averaged to 1km spatial sampling Compression 2:1 lossless
Science Measurements Characteristics Continued

TIR Instrument Concept
2/10/09 21
Spectral Bands
Scanning and Data Rate
• 60 m Pixel Footprint •Time-Averaged Science Data Rate 0.024 Gbps • Assuming 14 bits, 2:1 Compression • Scan Mirror Rotation Rate 13 RPM • Pixel Dwell Time 32 microseconds
Mass and Power (JPL Team X) •Mass CBE 60 kg •Power CBE 109 W
Direction ofSpacecraft
Motion
256 Pixels15 km±0.7°
9937 Pixels, 596 km, ±25.5°
Scan Mirror
Focal Plane8 Spectral Bands
x 256 Pixels

22
Mission Concept TIR Overview
• Duration: 4 years development, 3 years science
• Coverage: Global land every 5 days
• Day and Night imaging (1 day and night image at a given location obtained every 5 days)
• Data download using dual-polarization X-band at high-latitude stations
• Spacecraft: LEO RSDO bus (SA-200HP)
• Launch: Taurus-class launch vehicle
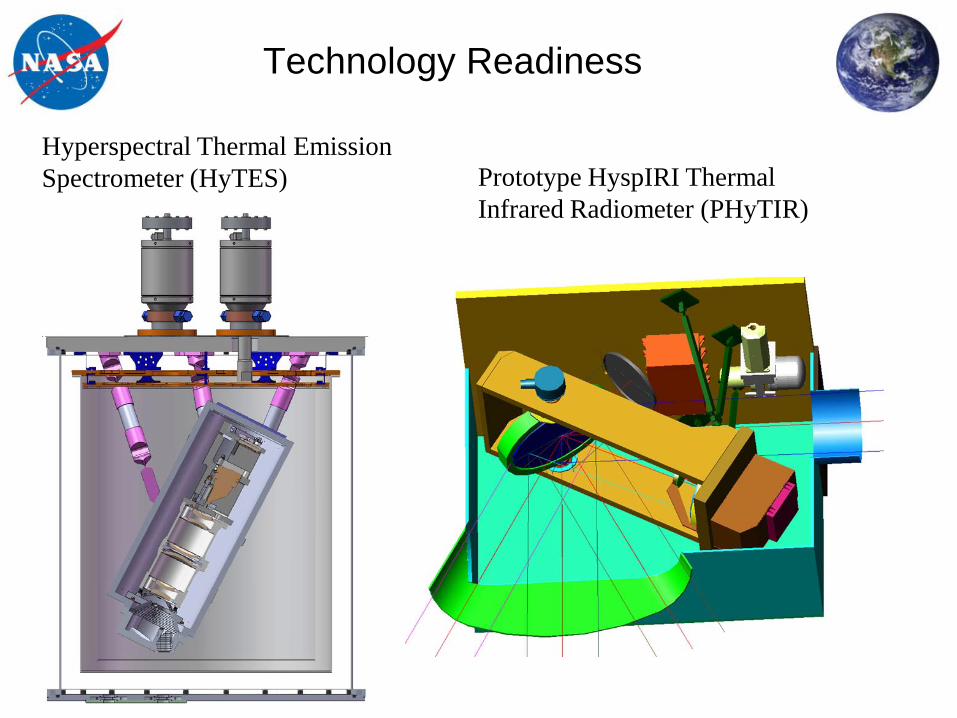
Technology Readiness
Hyperspectral Thermal Emission Spectrometer (HyTES) Prototype HyspIRI Thermal
Infrared Radiometer (PHyTIR)
Elevator Speech
• Quantify carbon and other emissions from fires to balance carbon budget
• Determine if heat, gas and lava emissions from volcanoes can be used to understand their future behavior
• Quantify evaporative loss from vegetated regions to balance water budget
10/25/
24
Summary We have developed a sets of science questions that are well aligned with the HyspIRI Mission called for in the NASA Earth Science and Applications Decadal Survey. The mission has strong relevance to both climate and society. We have reviewed and refined these questions that relate to both science and applications objectives and developed traceability to a set of science measurements. We have established a high heritage and low risk approach for acquiring the HyspIRI VSWIR and TIR science measurements

Backup
27
Measuring global fire emission is necessary for reducing the uncertainty in carbon
emissions from biomass burning
Global average biomass burning estimates range from 20 – 40 % of all global C emissions.
Van der Werf et al., 2010
Fires occur worldwide need a GLOBAL Mapping Mission, emissions vary regionally
Related Documents