License and Terms: This document is copyright 2019 the Author(s); licensee Beilstein-Institut. This is an open access publication under the terms of the Creative Commons Attribution License (http://creativecommons.org/licenses/by/4.0). Please note that the reuse, redistribution and reproduction in particular requires that the author(s) and source are credited. The license is subject to the Beilstein Archives terms and conditions: https://www.beilstein-archives.org/xiv/terms. The definitive version of this work can be found at: doi: https://doi.org/10.3762/bxiv.2019.133.v1 This open access document is published as a preprint in the Beilstein Archives with doi: 10.3762/bxiv.2019.133.v1 and is considered to be an early communication for feedback before peer review. Before citing this document, please check if a final, peer-reviewed version has been published in the Beilstein Journal of Nanotechnology. This document is not formatted, has not undergone copyediting or typesetting, and may contain errors, unsubstantiated scientific claims or preliminary data. Preprint Title Hydrogen Sulfide Removal Using Various Metal Oxide Nanocomposite from Drilling Fluid: Optimization, Kinetic and Adsorption Isotherms Authors Mohamad M. Nemati, Rahmatallah Saboori and Samad Sabbaghi Publication Date 28 Okt 2019 Article Type Full Research Paper ORCID ® iDs Samad Sabbaghi - https://orcid.org/0000-0003-4689-4081

Welcome message from author
This document is posted to help you gain knowledge. Please leave a comment to let me know what you think about it! Share it to your friends and learn new things together.
Transcript

License and Terms: This document is copyright 2019 the Author(s); licensee Beilstein-Institut.
This is an open access publication under the terms of the Creative Commons Attribution License (http://creativecommons.org/licenses/by/4.0). Please note that the reuse,redistribution and reproduction in particular requires that the author(s) and source are credited.
The license is subject to the Beilstein Archives terms and conditions: https://www.beilstein-archives.org/xiv/terms.The definitive version of this work can be found at: doi: https://doi.org/10.3762/bxiv.2019.133.v1
This open access document is published as a preprint in the Beilstein Archives with doi: 10.3762/bxiv.2019.133.v1 and isconsidered to be an early communication for feedback before peer review. Before citing this document, please check if a final,peer-reviewed version has been published in the Beilstein Journal of Nanotechnology.
This document is not formatted, has not undergone copyediting or typesetting, and may contain errors, unsubstantiated scientificclaims or preliminary data.
Preprint Title Hydrogen Sulfide Removal Using Various Metal OxideNanocomposite from Drilling Fluid: Optimization, Kinetic andAdsorption Isotherms
Authors Mohamad M. Nemati, Rahmatallah Saboori and Samad Sabbaghi
Publication Date 28 Okt 2019
Article Type Full Research Paper
ORCID® iDs Samad Sabbaghi - https://orcid.org/0000-0003-4689-4081

1
Hydrogen Sulfide Removal Using Various Metal Oxide Nanocomposite from
Drilling Fluid: Optimization, Kinetic and Adsorption Isotherms
Mohamad Mehdi Nemati1, Rahmatallah Saboori2, Samad Sabbaghi1,*
1Dep. of Nano-Chemical Eng., Faculty of advanced technologies, Shiraz University
2Drilling Nano Fluid Lab., Faculty of advanced technologies, Shiraz University
Abstract
In a drilling operation, the existing hydrogen sulfide in oil and gas reservoirs can be solved in drilling fluid and
cause some environmental problems and life-threatening situations to personnel. Therefore, hydrogen sulfide
removal of drilling fluid is so important. In this work, in order to hydrogen sulfide removal from drilling fluid, zinc
oxide nanoparticle, silica nanoparticle and silica/zinc oxide nanocomposite with different ratio were synthesized by
precipitation and sol-gel method and characterized by x-ray diffraction, fourier-transform infrared spectroscopy,
Field emission scanning electron microscopy, energy dispersive x-ray and brunauer–emmett–teller. The Design
Expert software, I-optimal, was used to design the experiments and the optimum condition for hydrogen sulfide
removal was determined. Also, the effect of nanomaterial concentration, hydrogen sulfide concentration, contact
time, pH and type of nanomaterial on removal of hydrogen sulfide was investigated. the results show, the
optimization of removal at nanoparticle concentration, 0.1 and 0.9 wt.%, hydrogen sulfide concentration, 800 ppm,
contact time, 3 min., pH, 12 and ZnO/SiO2 nanocomposite with 3:1 ratio is about 92.6 and 97.2%. investigation of
the reaction kinetic showed that hydrogen sulfide removal had a very high rate, so that time parameter has a low
impact on the removal process. Also, the kinetic adsorption was pseudo-first order. Adsorption of hydrogen sulfide
followed Freundlich isotherm model and multilayer adsorption. The reusability of nanocomposite is four cycles for
hydrogen sulfide removal more than 50%, which was significant in industrial processes.
Keywords: Hydrogen sulfide, Removal, Drilling fluid, Nanoparticle, Nanocomposite, Zinc oxide/Silica.
*Phone: +989171133471; Fax: +9871-36139669; E-mail: [email protected].
*Phone: +15195699734; E-mail: [email protected] & [email protected].
2
1. Introduction
One of the most important and the most expensive part of drilling of oil and gas well is drilling fluid. Drilling fluid
has an essential role in oil and gas wells drilling that do the task of caring cuttings to the surface, cooling and
lubricating the bit, cleaning the bottom hole and etc. These properties are emerged by adding additives into the fluid
(Saboori et al. 2018; Dargahi-Zaboli et al. 2017). Some problems may happen during the drilling operation which
the significant one is the presence of sulfur compounds like H2S, HS- and S2- that enters from well formation to
drilling fluid (Sunde and Olsen 1999). This sulfur compounds are very dangerous and deadly to personnel, corrosion
and cracking of dill pipe and causing environmental pollution (Carney and Jones 1974). The limit for this pollutant
in different parts of oil and gas industry should be less than 8ppm. There are varied methods to removal of hydrogen
sulfide, that one of the most important method is chemical and physical adsorption. Carney et al. described the
history of proceeding that used against destructive effects of dihydrogen sulfide gases in drilling fluid. In order to
reduce the effects of hydrogen sulfide, they suggested the use of materials such as copper, zinc, iron, chelates, and
hydrogen peroxide. It is noteworthy that, these compounds were suitable for use in water base drilling fluids (Carney
and Jones 1974).
But, in a recent year, nanomaterial as an additive are employed to improve of rheology and adsorb of pollutant from
drilling fluid. It is noteworthy that, the drilling fluid rheology should not get damaged by adding nanomaterial as
adsorbents. Awume et al. used zinc oxide nanoparticle for hydrogen sulfide removal from low temperature gas and
the effect of gas flow rate, H2S concentration, particle size, temperature on removal was investigated. Their results
showed the with increases in hydrogen sulfide concentration and temperature and with decreases in particle size and
gas flow rate led to increase adsorption (Awume et al. 2017). Daneshyar et al. modified carbon active by copper,
zinc and nickel cobalt and nickel nanoparticles and γ-alumina by cobalt and nickel nanoparticles as an adsorbent of
hydrogen sulfide. Also, the effect of adsorbent concentration, flow rate, temperature, pressure and amount of gas on
hydrogen sulfide removal were investigated and determined optimum condition. Their results indicated, maximum
removal of hydrogen sulfide at optimum condition were 94% and 91.6% for Cu-Zn–Ni/active carbon and Co–Ni/γ-
alumina at optimum condition (Daneshyar et al. 2017). Salehi Morgani et al. experimentally investigated the effect
of synthesized metal oxide and ZnO/TiO2 nanocomposite on hydrogen sulfide from drilling fluid. Their indicated
ZnO, TiO2 and ZnO/TiO2 nanocomposite decreased hydrogen sulfide in drilling fluid from 800 ppm to about 250,
about 150 and less than 5 ppm at 10 min. and 0.67 wt% of nanomaterial (Morgani et al. 2017). Liu et al. investigated

3
the effect of hybrid adsorbent/photocatalytic composite of coated zeolite by TiO2 (various TiO2 concentration) on
selective removal hydrogen sulfide from biogas. They demonstrated the composite with 5wt.% of TiO2 was the
highest removal of hydrogen sulfide capacity (0.13 mmol/g) compare with zeolite (0.05 mmol/g) and TiO2
nanoparticle (0.07 mmol/g) (Liu et al. 2015). Fauteux-Lefebvre et al. synthesized functionalization of carbon
nanofilament by iron nanoparticle and its impact was studied on adsorption of hydrogen sulfide that exist in depths.
They indicated that this adsorbent has ability to decrease hydrogen sulfide concentration from 500 to below 1.5 ppm
at 20 wt/wt.% metal loading. Also, temperature is an important parameter in adsorption of hydrogen sulfide gases
(Fauteux-Lefebvre et al. 2015). Blatt et al. prepared iron oxide/ polymer based nanocomposite and used for
adsorption of hydrogen sulfide. Their experiments indicated this adsorbent is higher capacity for adsorption of
hydrogen sulfide (Blatt et al. 2014). Wang et al. synthesized mesoporous silica SBA-15 supported Zinc oxide
nanoparticle (different loading) and investigated its effect on removal of hydrogen sulfide from gas. Their results
showed this nanoparticle with the highest breakthrough capacity, 436 mg S/ g adsorbent, removed hydrogen sulfide
from gas 0.1 vol.% to below 0.1 ppb at 39 min, room temperature, 3.04 wt.% Zn loading (Wang et al. 2008). Zhang
et al. reported removal of hydrogen sulfide from hot coal gas by different mesoporous silica supported by Mn2O3
(Zhang et al. 2014). Esmaeili-Faraj et al. studied adsorption of hydrogen sulfide and carbone dioxide by Graphene
Oxide and silica in water based nanofluid (Esmaeili-Faraj et al. 2016). Ma et al. used SiC nanoparticles for removal
hydrogen sulfide from natural gas by traditional desulfurizer (Ma et al. 2017). Also, Sekhavatjou et al used iron and
zinc oxide for removal sulfur component (hydrogen sulfide, carbonyl sulfide, methyl mercaptan, ethyl mercaptan,
dimethyl sulfide, and carbon disulfide) from sour gas (Sekhavatjou et al 2014).
The most nanomaterials used to remove hydrogen sulfide are nanoparticles and rarely use of nanocomposite has
been reported. It is noteworthy that, zinc oxide and silica nanoparticles are widely used in drilling fluid. In this work,
zinc oxide nanoparticle, silica nanoparticle and zinc oxide/silica nanocomposite with different ratio were
synthesized and characterized. Then, synthesized nanomaterial added to drilling fluid and amount of removal
hydrogen sulfide was studied. in order to design of experiment and determination of optimum condition for removal
of hydrogen sulfide, Design expert software was used. Finally, kinetic and isotherm study of hydrogen sulfide
adsorption, and resiubility of synthesized nanomaterial were investigated.
4
2. Materials and method
2.1. Materials
Zinc acetate dihydrate (Zn.(CH3COO)2.2H2O), tetraethyl orthosilicate (SiC8H20O4), ethanol (CH2COOH), nitric acid
(HNO3), sodium hydroxide (NaOH), sodium sulfide hydrate (Na2S), and acid chloric (HCl) were purchased from
Merck company. Deionized water was purchased from Zolal company, and sodium bentonite was provided from
Iranian National Drilling Company.
2.2. Synthesis of nanomaterial
2.2.1. Zinc oxide nanoparticle
Zinc oxide (ZnO) nanoparticles were synthesized by precipitation method(Kumar et al. 2013; Hasnidawani et al.
2016). which is one of the useful, simple, and inexpensive methods to produce nanoparticles. For this work, zinc
acetate dihydrate (2gr) was added to distilled water (15 ml) and mixed by vigorous magnetic stirrer. Then, sodium
hydroxide (2M, 10 ml) added to the solution and mixed by magnetic stirrer at room temperature for 10 min., Ethanol
(100 ml) was added gradually to final solution with magnetic stirrer. The color solution was changed to white and
precipitate obtained. This with principate was including ZnO nanoparticles and sodium acetate salt. In order to
purify and separate the ZnO nanoparticle from sodium acetate, the principate was washed for several times with
distilled water and ethanol. Finally, the sediments were dried in 80 ºC for 2 hr.
2.2.2. Silica nanoparticle
In order to produce silica (SiO2) nanoparticle with sol-gel method(Rahman and Padavettan 2012; Saboori et al.
2018), ethanol and tetraethyl orthosilicate with a volume ratio of 1:5 was mixed by magnetic stirrer (solution A).
Then ammonia solution was added to distilled water with volume ratio of 1:1 (solution B). Solution A and B were
mixed for 10 min at room temperature. After 20 min., sol (milky color) and gel were formed. The gel was dried in
room temperature. Finally, the obtained powder was calcined for 1 hr in 600 ºC.
2.2.3. Silica/zinc oxide nanocomposite
Zinc oxide/silica (ZnO/SiO2) nanocomposite was produced by sol-gel method. Two solutions were prepared to the
synthesis of silica/zinc oxide nanocomposite. The first solution contained zinc acetate dihydrate, deionized water,
and nitric acid. For preparation of this solution, zinc acetate dihydrate was added to deionized water and the pH of
solution was set on 4 with nitric acid. The second solution contained ethanol and tetraethyl orthosilicate, which was
stirred by magnetic stirrer for 10 min., at room temperature. The second solution was added dropwise to the first
5
solution. and stirred for 2 hr by magnetic stirrer. After 30 min., the sol and gel was formed. Finally, the gel was
dried in room temperature and finally, the power was calcined at 300 ºC for 1hr. Fig. 1 shows the procedure of
ZnO/SiO2 nanocomposite synthesis with a ratio of 1:1. It is noteworthy that, the nanocomposite with another ratio,
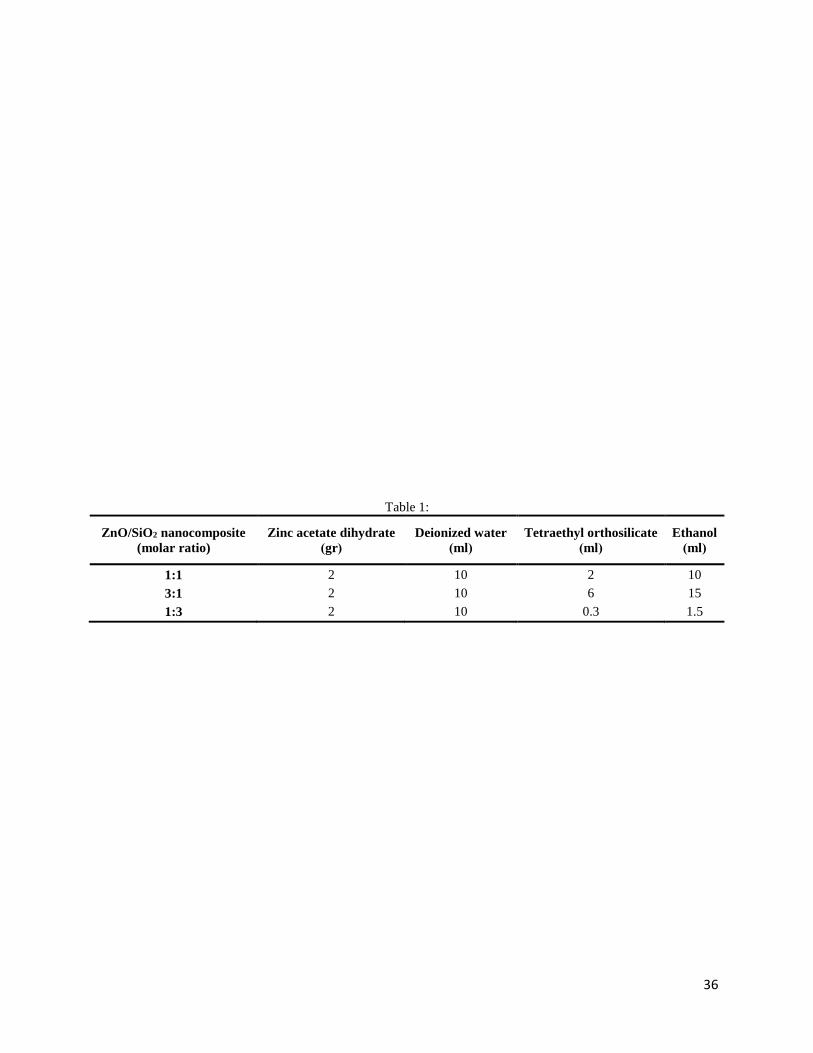
3:1 and 1:3, were synthesized by this method. Also, Table 1 shows the amount of material for synthesis of
nanocomposite with a different ratio.
Fig. 1
Table 1
2.3. Preparation of drilling fluid and hydrogen sulfide removal
In order to investigate the removal of hydrogen sulfide from water based drilling fluid with ZnO and SiO2
nanoparticles and SiO2/ZnO nanocomposite, 10 gr of bentonite and 350 ml of deionized water were mixed by
Hamilton Batch Mixer with 36000 rpm for 20 min (as a water based drilling fluid). The certain amount of sodium
sulfide hydrate was added to drilling fluid and mixed by Hamilton Batch mixer for 15 min. Then synthesized
nanoparticle and nanocomposite with certain concentration was added to the mixture for certain contact time. The
mixture was filtrate and centrifuge. Finally, removal of hydrogen sulfide in drilling fluid was measured by UV-
visible spectrophotometer. It is noteworthy that, the effect of nanomaterial concentration, hydrogen sulfide
concentration, contact time, pH and type of nanocomposite was investigated in the removal of hydrogen sulfide. In
order to investigate the effect of parameter and interaction between this parameter was used Design Expert software
(trial 10, I-optimal method). One of the benefits of using Design Expert software is determining the effective
parameters and the effect of this parameter on hydrogen sulfide removal, hence with the definition of p-value and F-
value factors, the software determines effective variables and interaction between of parameters. Table 2 illustrates
the parameter and their range on removal hydrogen sulfide from water based drilling fluid.
Table 2
2.4. Characterization
In order to characterize the synthesized nanoparticles and nanocomposite, x-ray diffraction (XRD), fourier transform
infrared spectroscopy (FTIR), field emission scanning electron microscopy (FE-SEM), energy-dispersive x-ray
spectroscopy (EDXA), and brunauer–emmett–teller (BET) were used. The XRD analysis is used to confirm the
validity of the synthesized nanomaterial, specification of the amorphous or crystalline form of the produced particles

6
and crystal size of produced nanomaterial with the Scherrer equation. The FT-IR analysis is also for validation of the
produced substance and chemical bond determination between elements in a specimen. The nanocomposite
proportion can be determined by EDAX analysis, which is an elemental analysis. Moreover, the FE-SEM image is
used to specify the synthesized nanomaterial appearance shape. The specific surface area of the synthesized
nanoparticles can be designated by BET analysis.
3.Results and discussion
3.1. Characterization of nanomaterial
- XRD
The XRD pattern of the synthesized ZnO and SiO2 nanoparticles and ZnO/SiO2 nanocomposite with the ratios of
1:1, 1:3 and 3:1 demonstrate in Fig. 2-a to b. In Fig. 2-a, It is obvious that the peaks of 2 equal to 31.75º, 34.45º,
36.25º, 47.6º, 56.6º, 62.8º, 67.95º, and 69.2 º are related to the plates of (100), (002), (101), (102), (110), (103), and
(112) in the XRD spectrum, as for ZnO nanoparticle and indicates the validity of the synthesized nanoparticles (Lim
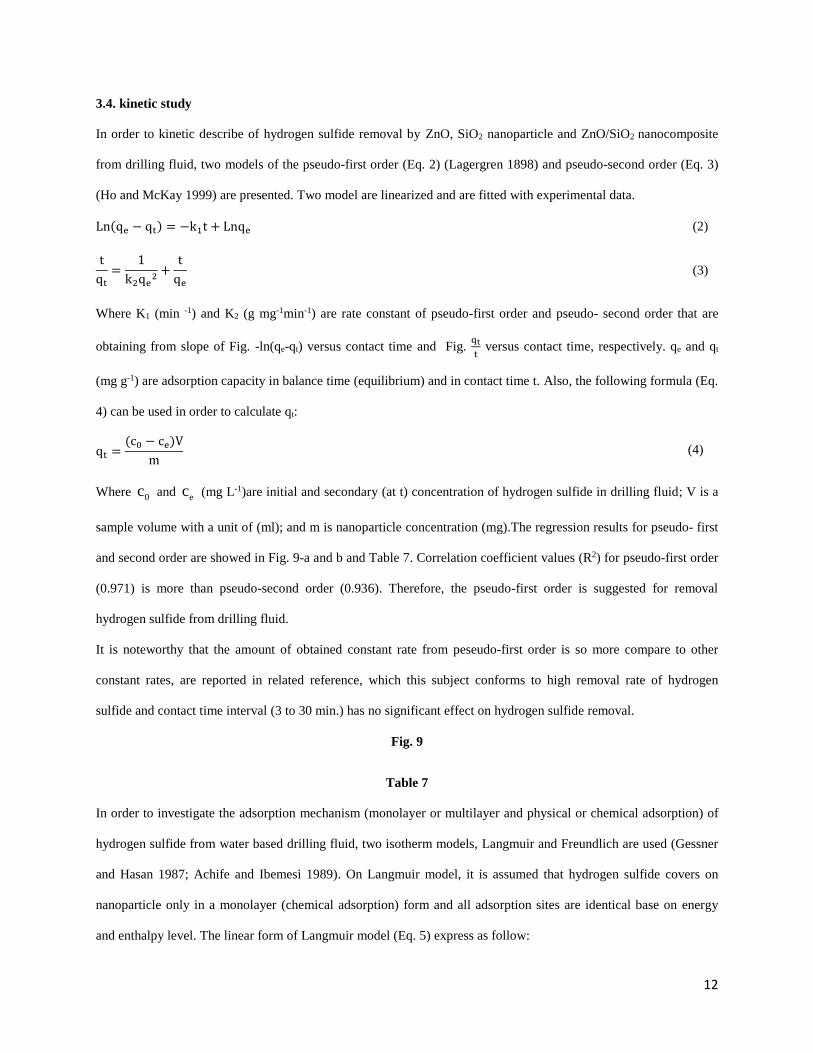
et al. 2011; Bagheri et al. 2013; Hasnidawani et al. 2016). In Fig. 2-b, the peaks of equal to 2 are related to the
plates of 11.65º, 13.16º, 19.53º, 22.25º, in the XRD spectrum, as for silica nanoparticle (Ali et al. 2016; Goldstein et
al. 2017).
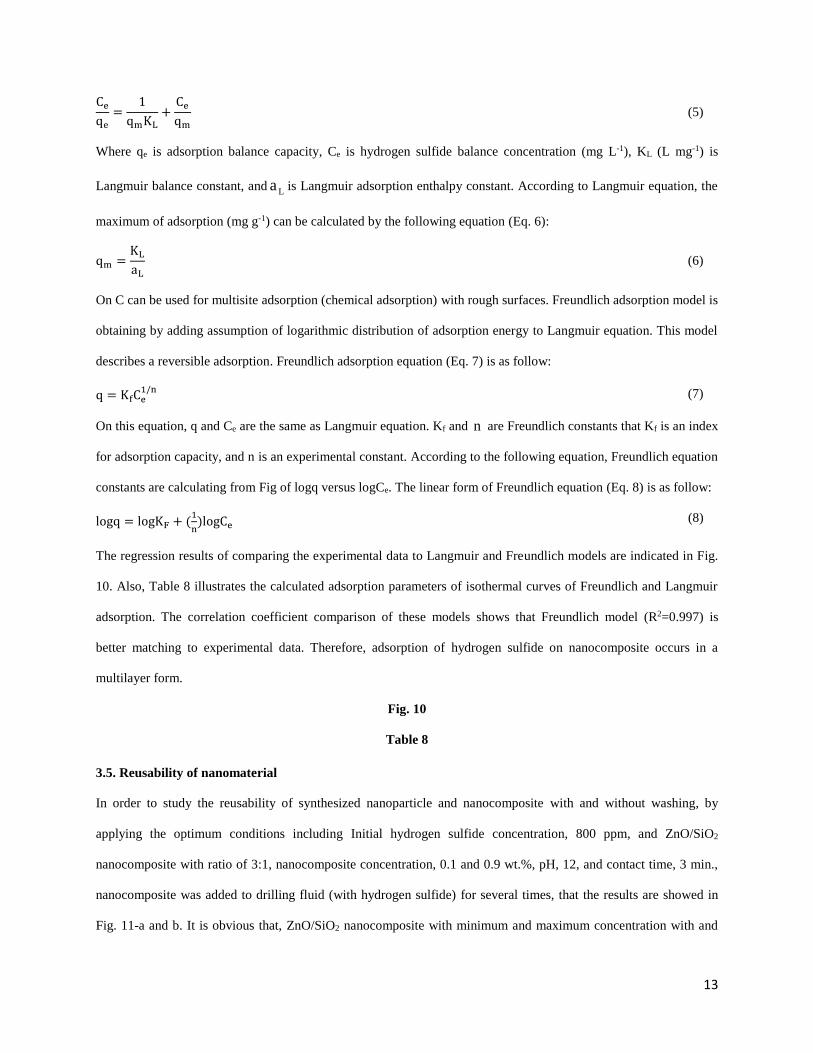
The XRD analysis of ZnO/SiO2 nanocomposite with a ratio of 1:1 is shown in Fig. 2-c. The peaks that are in 11.72º,
19.16º, 20.56º, 22.92º, 24.80º, 29.86º are related to the SiO2 nanoparticle, and the peaks in 31º, 34.21º, 36.33º,
51.99º, 53.53º, 62.91º are dedicated to ZnO nanoparticle, which shows the presence of two nanoparticles in the
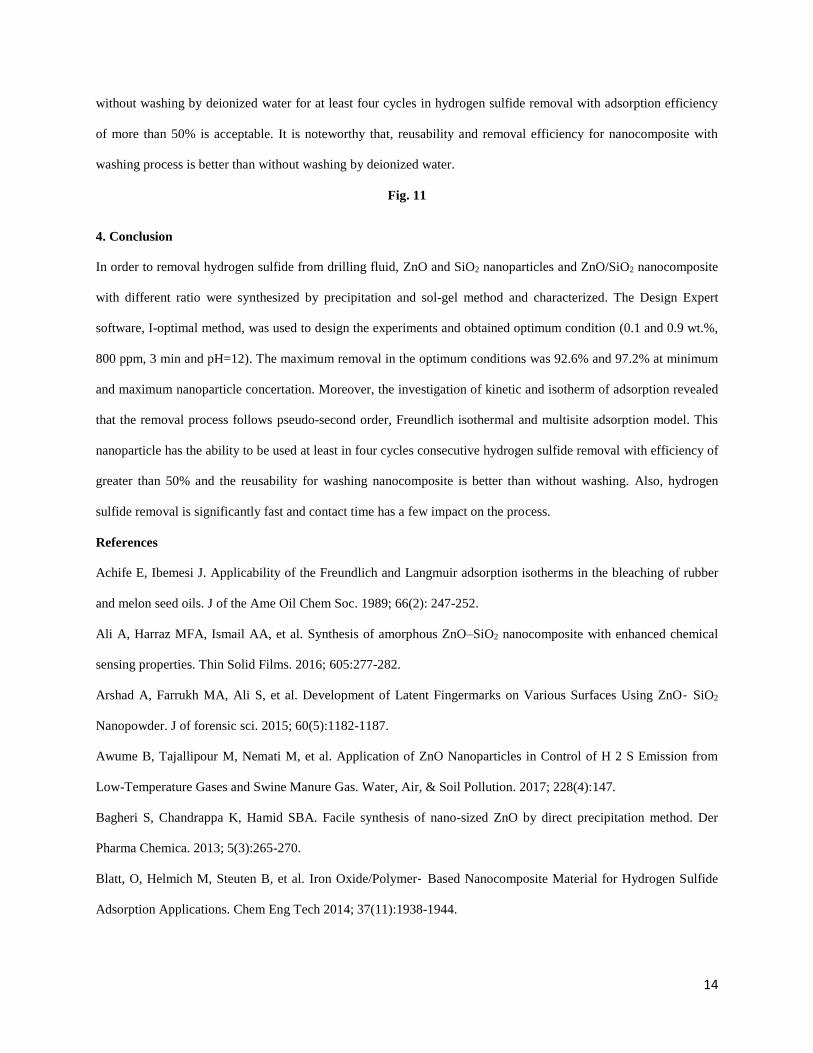
synthesized nanocomposite (Stöber et al. 1968; Arshad et al. 2015). The peaks, in Fig. 2-d for ratio of 3:1, are in 2
equal to 11.47º, 13.69º, 18.86º, 23.13º, 25.91º, 28.80º; and in Fig. 2-e for ratio of 1:3 are in 65.08º, 47.13º, 68.02º,
62º are indicating the validity of the synthesized nanocomposites, and are related to the plates of (103), (110), (020),
(021), (101), (200), (130), (201) of SiO2 nanoparticle in Fig. 2-d, and the plates of (020), (201), and (212) of silica in
Fig. 2-e, respectively. Also, the 2 equal to 31.75º, 34.42º, 36.31º, 39.86º, 47.56º, 51.01º, 56.70º, 64.10º, 100º in
Fig. 2-d; and 31.86º, 34.33º, 36.32º, 56.70º, and 62.91º in Fig. 2-e are related to the plates of (002), (101), (102),
(110), and (103) of ZnO nanoparticle in Fig. 2-e and d, respectively (Stöber et al. 1968; Han et al. 2006; Arshad et
al. 2015).
7
Fig. 2
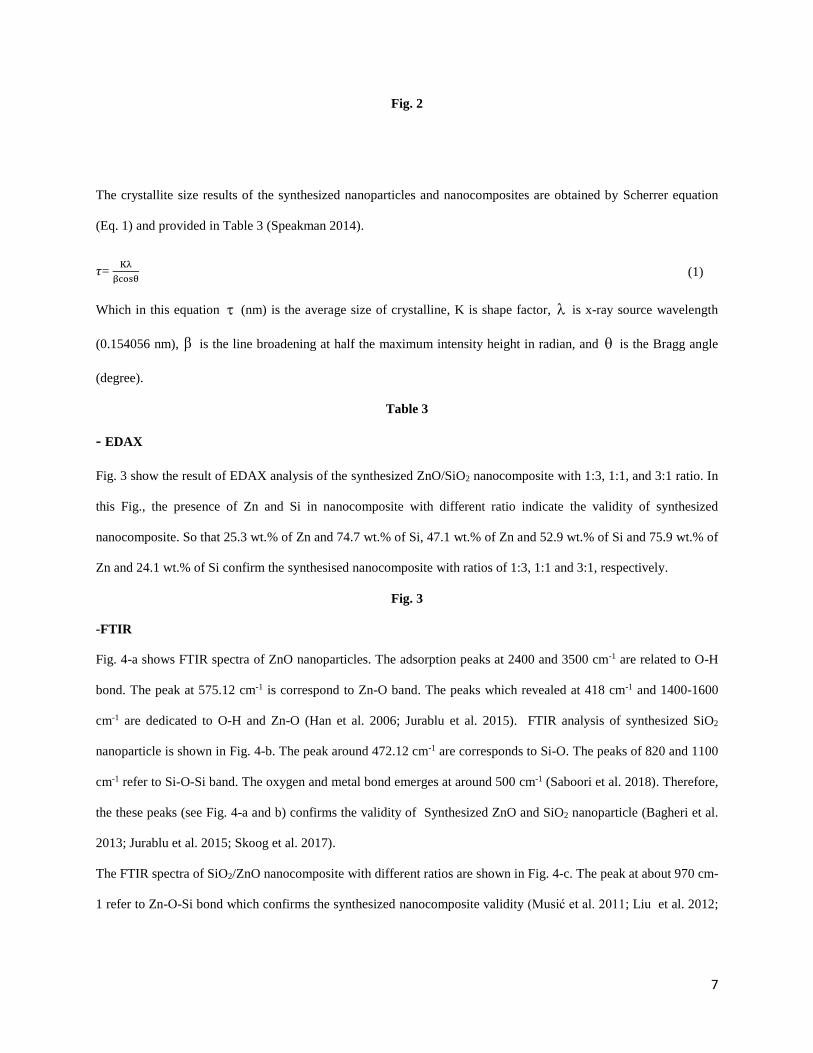
The crystallite size results of the synthesized nanoparticles and nanocomposites are obtained by Scherrer equation
(Eq. 1) and provided in Table 3 (Speakman 2014).
𝜏= Kλ
βcosθ (1)
Which in this equation (nm) is the average size of crystalline, K is shape factor, is x-ray source wavelength
(0.154056 nm), is the line broadening at half the maximum intensity height in radian, and is the Bragg angle
(degree).
Table 3
- EDAX
Fig. 3 show the result of EDAX analysis of the synthesized ZnO/SiO2 nanocomposite with 1:3, 1:1, and 3:1 ratio. In
this Fig., the presence of Zn and Si in nanocomposite with different ratio indicate the validity of synthesized
nanocomposite. So that 25.3 wt.% of Zn and 74.7 wt.% of Si, 47.1 wt.% of Zn and 52.9 wt.% of Si and 75.9 wt.% of
Zn and 24.1 wt.% of Si confirm the synthesised nanocomposite with ratios of 1:3, 1:1 and 3:1, respectively.
Fig. 3
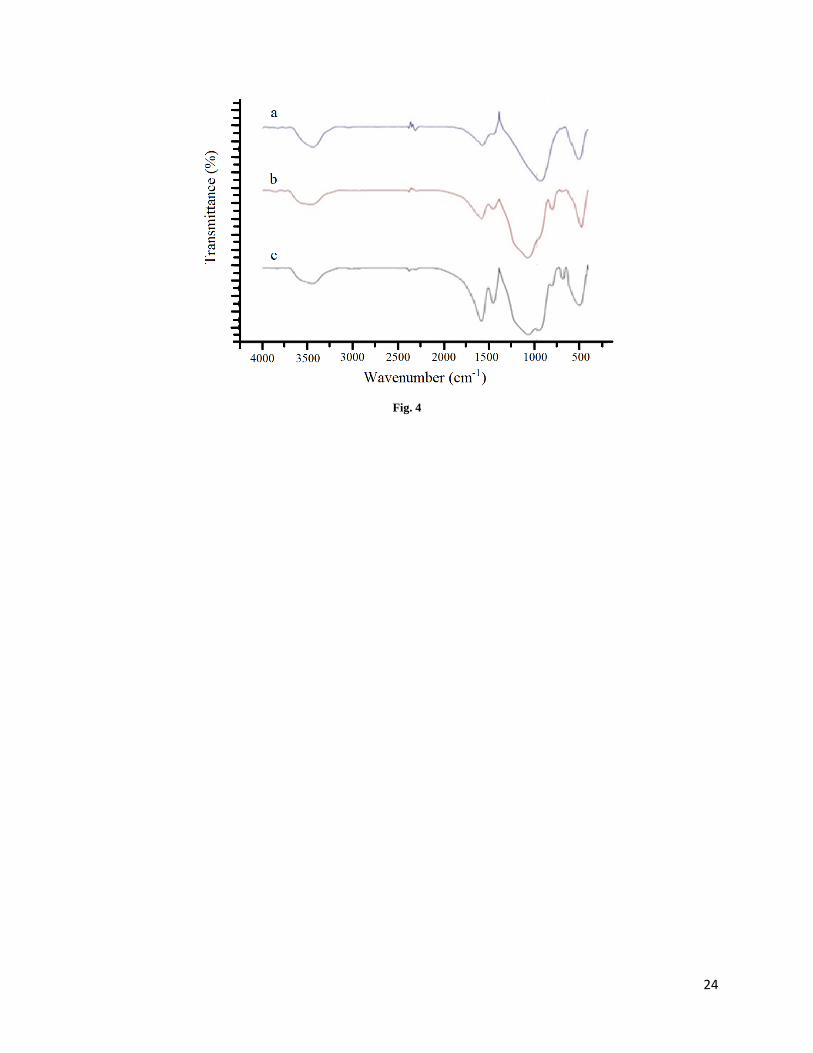
-FTIR
Fig. 4-a shows FTIR spectra of ZnO nanoparticles. The adsorption peaks at 2400 and 3500 cm-1 are related to O-H
bond. The peak at 575.12 cm-1 is correspond to Zn-O band. The peaks which revealed at 418 cm-1 and 1400-1600
cm-1 are dedicated to O-H and Zn-O (Han et al. 2006; Jurablu et al. 2015). FTIR analysis of synthesized SiO2
nanoparticle is shown in Fig. 4-b. The peak around 472.12 cm-1 are corresponds to Si-O. The peaks of 820 and 1100
cm-1 refer to Si-O-Si band. The oxygen and metal bond emerges at around 500 cm-1 (Saboori et al. 2018). Therefore,
the these peaks (see Fig. 4-a and b) confirms the validity of Synthesized ZnO and SiO2 nanoparticle (Bagheri et al.
2013; Jurablu et al. 2015; Skoog et al. 2017).
The FTIR spectra of SiO2/ZnO nanocomposite with different ratios are shown in Fig. 4-c. The peak at about 970 cm-
1 refer to Zn-O-Si bond which confirms the synthesized nanocomposite validity (Musić et al. 2011; Liu et al. 2012;

8
Shastri et al. 2013; Raevskaya et al. 2014). Also, another peak shows Si-O, Zn-O, Si-O-Si, O-H band on
nanocomposite that emerge at all ratio of nanocomposite.
Fig. 4
-FE-SEM analysis
Fig. 5-a to e illustrates FE-SEM image of synthesized ZnO, SiO2 nanoparticles and ZnO/SiO2 nanocomposite with
ratios of 1:1, 1:3, and 3:1. It is observed that ZnO nanoparticle has in plate-like shape, SiO2 nanoparticle and
nanocomposites in all ratios have in semispherical shape.
Fig. 5
- BET analysis
BET analysis is used in order to measure and compare specific surface area of nanomaterial. By increasing of the
specific surface are, the active sites of nanomaterial for hydrogen sulfide removal increases, therefore the removal
enhances. The result of BET analysis of synthesized nanoparticle and nanocomposite are shown in Table 4. It is
obvious that the specific surface area of ZnO/SiO2 nanocomposites is bigger than ZnO and SiO2 nanoparticle. Also,
the specific surface area of ZnO/SiO2 nanocomposite with ratio of 1:3 is 208.82 m2 gr-1 that has the highest specific
area among synthesized nanoparticles.
Table 4
3.2. Design of experiment and effective parameters in hydrogen sulfide removal
Generally, two types of variables are important in the software. The first types are qualitative variables that represent
a variable kind and quality such as nanocomposite type that synthesize in three different ratios (1:3, 1:1, 3:1). The
second types are quantitative variables that a range of variation defines for them. Effective quantitative variables on
the removal hydrogen sulfide from drilling fluid are showed in Table 3. Design Expert software (trial 10, I-Optimal
method), 42 experiments were designed, that list of experiments and their results show in Table 5. P-value and F-
value for all main parameter and also effective parameter (interaction between parameter) are provided in Table 6. It
is obvious that, the nanoparticle concentration, pH, and ratio of nanocomposite are the most effective on hydrogen
sulfide removal and hydrogen sulfide concentration is more effective than contact time.
Table 5
Table 6

9
- Effect of main parameter
The most important factor in hydrogen sulfide removal from drilling fluid is nanoparticle concentration (F-value<
0.005). Fig. 6-a demonstrates the effect of nanoparticle concentration on hydrogen sulfide removal from drilling
fluid at condition of hydrogen sulfide concertation=800 ppm, contact time=15 min, pH=10, and ratio of ZnO/SiO2
nanocomposite= 3:1. Hydrogen sulfide in drilling fluid adsorbed on the nanoparticles and nanocomposites surfaces.
So that, the increasing nanoparticle concentration are, the active site (surfaces area) for removal enhances, therefore
the hydrogen sulfide removal from drilling fluid increase. By increasing of the nanoparticle concentration from 0.1
to 0.9 wt.%, the removal enhances from 93 to 98%.
The second influential quantitative variable in hydrogen sulfide removal is initial hydrogen sulfide concentration in
drilling fluid. Fig. 6-b shows the effect of hydrogen sulfide concentration on removal of hydrogen sulfide from
drilling fluid fluid at condition of nanoparticle concentration=0.1 wt.%, contact time=15 min., pH=10, and ratio of
ZnO/SiO2 nanocomposite= 3:1. It is obvious that, by increasing hydrogen sulfide concentration from 100 to about
450 ppm (in constant nanoparticle concentration), the removal of hydrogen sulfide is increased. Because of the ratio
of nanoparticle active site to hydrogen sulfide concentration is high. But by increasing from 450 to 800, this ratio is
low; therefore, removal of hydrogen sulfide is decreased. It is noteworthy that, maximum hydrogen sulfide removal
at 800 ppm of hydrogen sulfide is about 91%.
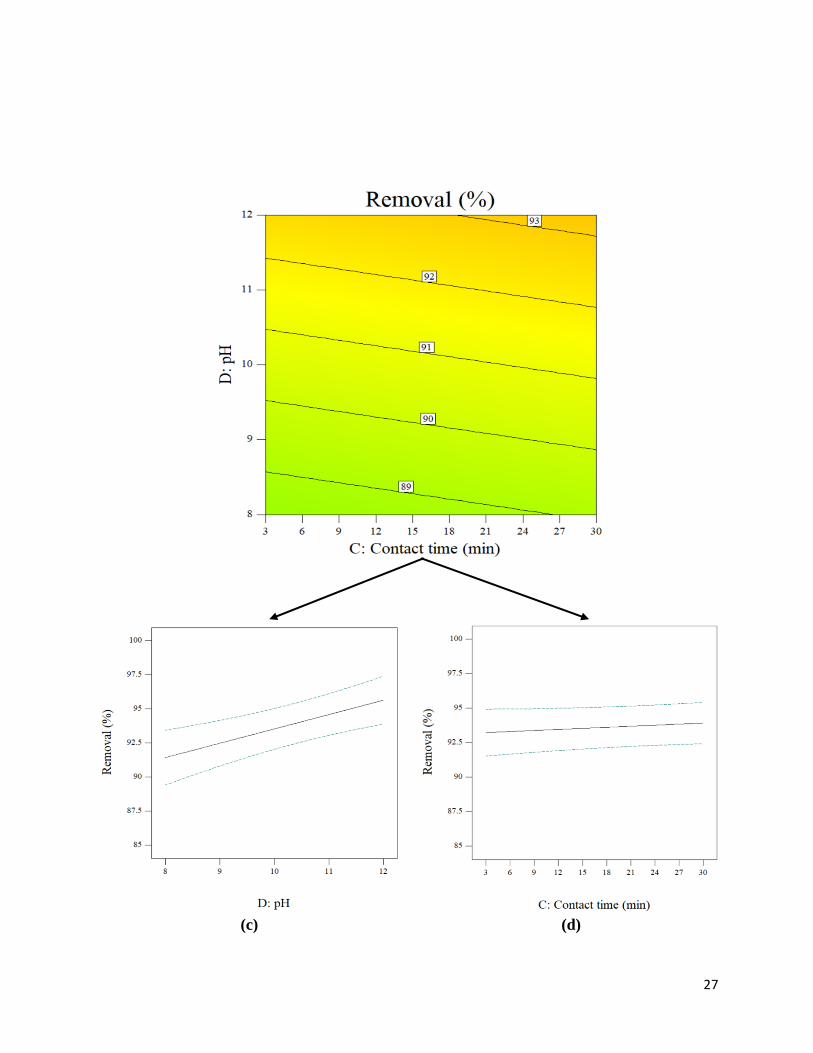
The pH with a p-value less than 0.05 is the third effective quantitative variable in hydrogen sulfide removal.
Removal have a dependence on pH of drilling fluid. Fig. 6-c shows the effect of pH on removal of hydrogen sulfide
from drilling fluid at condition of nanoparticle concentration= 0.1 wt.%, hydrogen sulfide concentration= 800 ppm,
contact time=15 min., and ratio of ZnO/SiO2 nanocomposite= 3:1. In the pH ranging from 8 to 12 and certain
amount of hydrogen sulfide, zinc(II) can be in the forms of ZnO and ZnS. As reported previously, with the increase
of pH from 8 to 12 the affinity of Zn (II) to bond with S is more favorable than the OH (Ma et al. 2013). Indeed,
formation of ZnS at this pH range can favourable the adsorption of hydrogen sulfide. However, the negative surface
charge of silica nanoparticle at pH 8-12 (pHpzc is about 2)(Puddu and Perry 2012) is not suitable for attraction of
hydrogen sulfide from drilling fluid. For ZnO/SiO2 nanocomposite with ratio of 3:1 (Fig. 6-c), the effect of zinc
oxide nanoparticle is more than silica nanoparticle. Therefore, with increase of pH, hydrogen sulfide removal from
drilling fluid increases. The last quantitative variable which considered in hydrogen sulfide removal is contact time.
Basically, in a removal process, the contact time is known as an equilibrium parameter. It means, at first, removal

10
increase by increasing contact time and then by enhancing more contact time, removal remains constant and no
change. Therefore, the optimum contact time is find in order not to waste time and energy. However, according to
the obtained results from Table 6 and Fig. 6-d (at condition of nanoparticle concentration= 0.1 wt.%, hydrogen
sulfide concentration= 800 ppm, pH=10, and ratio of ZnO/SiO2 nanocomposite= 3:1), contact time parameter has no
effect on hydrogen sulfide removal that it is obvious that this removal process is the fast rate. So that, removal of
hydrogen sulfide from drilling fluid was about 93% (93.25 to 93.9%) from 3 to 30 min.
Fig. 6-e shows the effects of ratio of ZnO/SiO2 nanocomposite on hydrogen sulfide removal at condition of
nanoparticle concentration=0.1 wt.%, hydrogen sulfide concentration= 800 ppm, pH=10, and contact time = 15 min.
It is observed, the maximum hydrogen sulfide removal has for ZnO/SiO2 nanocomposite with 3:1 ratio which is
96% at all range of nanomaterial concentration, initial hydrogen sulfide concentration, pH and contact time. The
reason can be related to specific surface are and active site, so that, this nanocomposite has a maximum surface area,
208.82 m2/gr (BET analysis, Table 5) in comparison with other synthesized nanoparticle and nanocomposite.
Fig. 6
- Interaction between parameter on hydrogen sulfide removal
The interaction between hydrogen sulfide concentration and nanocomposite ratio (1:0, 0:1, 1:3, 1:1 and 3:1) are the
first effective interaction on removal hydrogen sulfide from water based drilling fluid. Fig. 7-a shows the effect of
interaction between two mention parameter at condition of nanoparticle concentration= 0.1 wt.%, contact time= 15
min., and pH=10. By increase in hydrogen sulfide from 100 to 800 ppm, ratio of active site to hydrogen sulfide in
silica nanoparticle decrease and the form of ZnS to ZnO in zinc oxide nanoparticle increase. Therefore, removal of
hydrogen sulfide with silica nanoparticle decrease and with zinc oxide nanoparticle increase. Also, the effect of zinc
oxide nanoparticle is more prominent that the silica nanoparticle. But in nanocomposite, with increasing ratio of
nanocomposite form 1:3 to 3:1, by increase in ZnO nanoparticle and surface area, removal of hydrogen sulfide
increase.
The interaction between ratio of nanocomposite and pH is second effective interaction removal of hydrogen sulfide.
According to Fig. 7-b (at condition of nanoparticle concentration= 0.1 wt.%, hydrogen sulfide= 400 ppm, and
contact time= 15min.), that shows the effect of interaction between two mention parameter, in minimum and
maximum hydrogen sulfide concentration (100 and 800 ppm), by increase in nanoparticle concentration from 0.1 to
0.9 wt.% for all of ratio of nanocomposite, ratio of nanoparticle active site to hydrogen sulfide increases and as a

11
results removal of hydrogen sulfide enhances. It is noteworthy that enhancing removal is supposed to be all of
condition.
The third effective interaction is related to the nanocomposite ratio and nanoparticle concentration. Fig. 7-c
demonstrates the effect of interaction between two mention parameter on removal at condition of hydrogen sulfide
concentration= 400 ppm, contact time=15 min., and pH=10. It is obvious that, for all of ZnO/SiO2 nanocomposite
ratios (1:0,0:1, 1:1, 3:1 and 3:1), by increasing nanoparticle concentration, removal of hydrogen sulfide increase.
The maximum removal (at all nanoparticle concentration) is dedicated to the nanocomposite with ratio of 3:1,
because of the highest specific surface area in comparison with other synthesized nanomaterial. So that, the removal
in 0.1 wt.% of this nanocomposite is about 93%, while removal increases to about 98% when nanocomposite
concentration incremented to 0.9 wt.% in drilling fluid.
Fig. 7
3.3. Optimum condition for hydrogen sulfide removal from drilling fluid
One of the other benefits of using Design Expert software is the software ability to determine the removal optimum
condition by selecting and adjusting of the conditions. The economic considerations in nanomaterial utilization are
so important at removal of hydrogen sulfide from drilling fluid, therefore the optimum condition was investigated by
the maximum and minimum nanoparticle concentration (0.1 and 0.9 wt.%), maximum hydrogen sulfide
concentration (800 ppm), minimum contact time (5 min.) and pH in rage of 8 to 12. Fig. 8 shows the results of
removal of hydrogen sulfide from drilling fluid in optimum condition. Consider to the highest removal in the
maximum and the minimum nanoparticle concentration are 97.2% (with desirability of 0.98) and 92.6% (with
desirability of 0.941) that, the difference between these removals is 4.6%. Therefore, the best concentration (point of
economic) of nanocomposite for removal of hydrogen sulfide is 0.1 wt.% (minimum concentration) of ZnO/SiO2
nanocomposite with ratio of 3:1. This optimum condition was done in the same condition in Drilling nanofluid
laboratory and the obtained removal was 91.25 and 96 %.
Fig. 8
12
3.4. kinetic study
In order to kinetic describe of hydrogen sulfide removal by ZnO, SiO2 nanoparticle and ZnO/SiO2 nanocomposite
from drilling fluid, two models of the pseudo-first order (Eq. 2) (Lagergren 1898) and pseudo-second order (Eq. 3)
(Ho and McKay 1999) are presented. Two model are linearized and are fitted with experimental data.
Ln(qe − qt) = −k1t + Lnqe (2)
t
qt=
1
k2qe2+
t
qe (3)
Where K1 (min -1) and K2 (g mg-1min-1) are rate constant of pseudo-first order and pseudo- second order that are
obtaining from slope of Fig. -ln(qe-qt) versus contact time and Fig. qt
t versus contact time, respectively. qe and qt
(mg g-1) are adsorption capacity in balance time (equilibrium) and in contact time t. Also, the following formula (Eq.
4) can be used in order to calculate qt:
qt =(c0 − ce)V
m (4)
Where and (mg L-1)are initial and secondary (at t) concentration of hydrogen sulfide in drilling fluid; V is a
sample volume with a unit of (ml); and m is nanoparticle concentration (mg).The regression results for pseudo- first
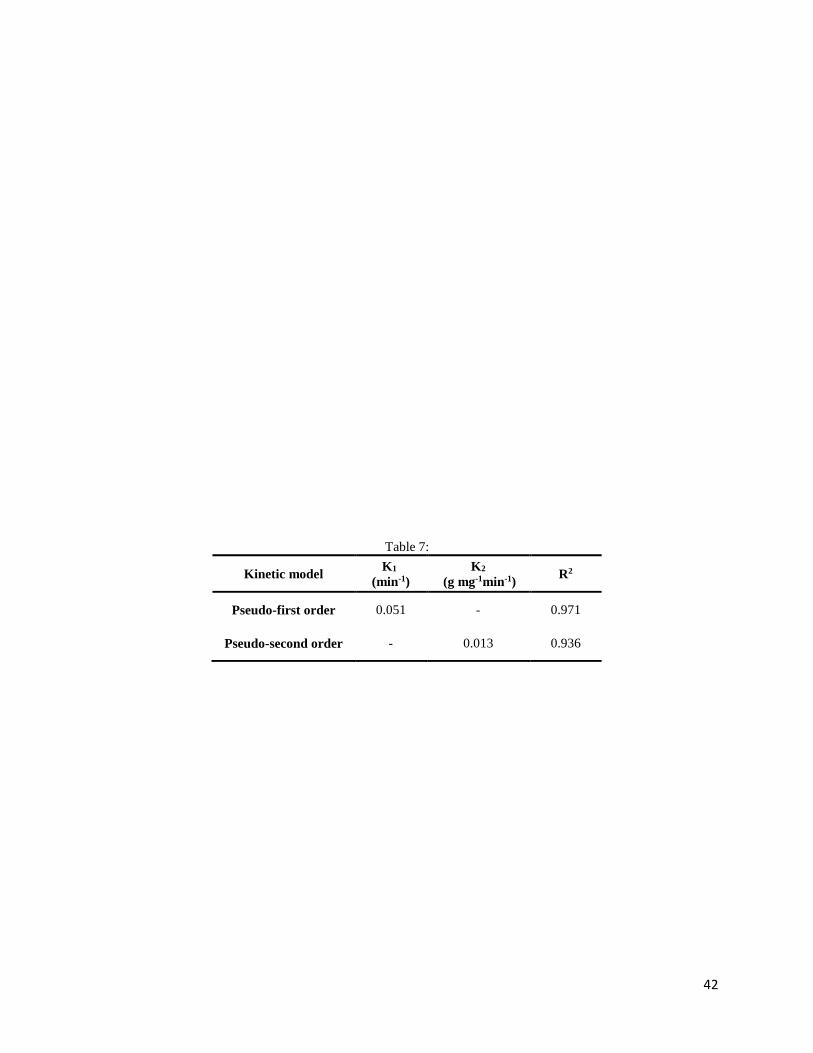
and second order are showed in Fig. 9-a and b and Table 7. Correlation coefficient values (R2) for pseudo-first order
(0.971) is more than pseudo-second order (0.936). Therefore, the pseudo-first order is suggested for removal
hydrogen sulfide from drilling fluid.
It is noteworthy that the amount of obtained constant rate from peseudo-first order is so more compare to other
constant rates, are reported in related reference, which this subject conforms to high removal rate of hydrogen
sulfide and contact time interval (3 to 30 min.) has no significant effect on hydrogen sulfide removal.
Fig. 9
Table 7
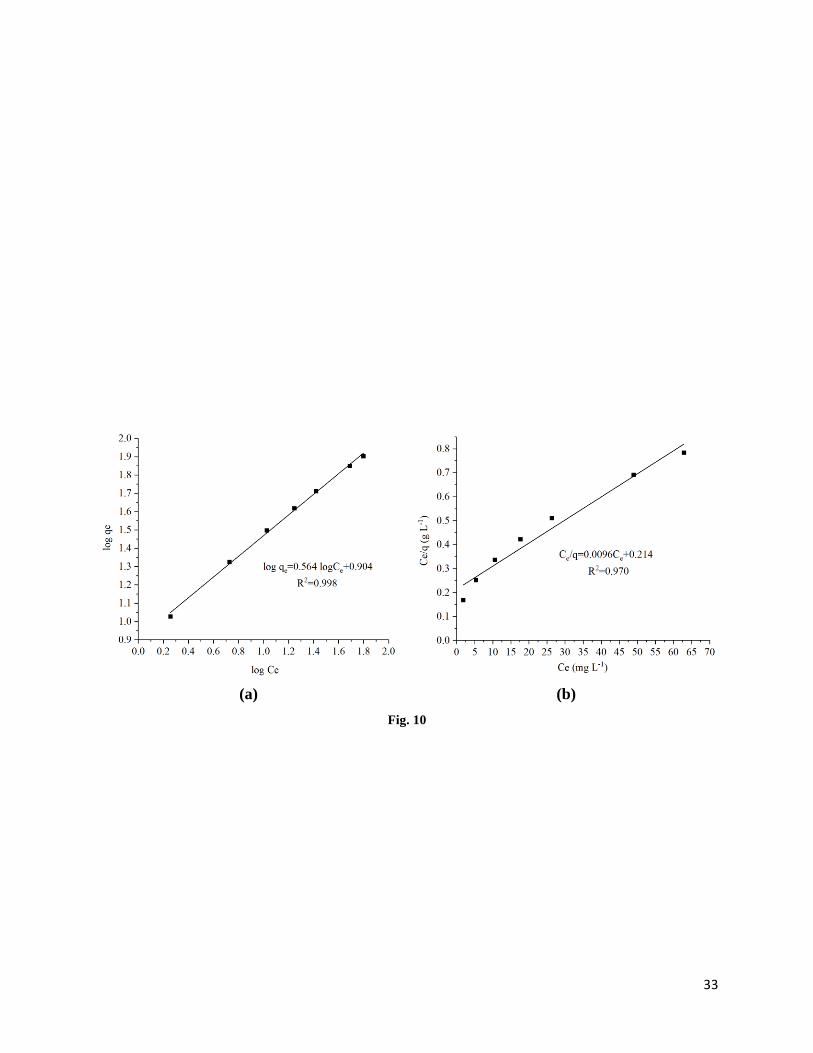
In order to investigate the adsorption mechanism (monolayer or multilayer and physical or chemical adsorption) of
hydrogen sulfide from water based drilling fluid, two isotherm models, Langmuir and Freundlich are used (Gessner
and Hasan 1987; Achife and Ibemesi 1989). On Langmuir model, it is assumed that hydrogen sulfide covers on
nanoparticle only in a monolayer (chemical adsorption) form and all adsorption sites are identical base on energy
and enthalpy level. The linear form of Langmuir model (Eq. 5) express as follow:
0c ec
13
Ceqe
=1
qmKL
+Ceqm
(5)
Where qe is adsorption balance capacity, Ce is hydrogen sulfide balance concentration (mg L-1), KL (L mg-1) is
Langmuir balance constant, and is Langmuir adsorption enthalpy constant. According to Langmuir equation, the
maximum of adsorption (mg g-1) can be calculated by the following equation (Eq. 6):
qm =KL
aL (6)
On C can be used for multisite adsorption (chemical adsorption) with rough surfaces. Freundlich adsorption model is
obtaining by adding assumption of logarithmic distribution of adsorption energy to Langmuir equation. This model
describes a reversible adsorption. Freundlich adsorption equation (Eq. 7) is as follow:
q = KfCe1/n
(7)
On this equation, q and Ce are the same as Langmuir equation. Kf and are Freundlich constants that Kf is an index
for adsorption capacity, and n is an experimental constant. According to the following equation, Freundlich equation
constants are calculating from Fig of logq versus logCe. The linear form of Freundlich equation (Eq. 8) is as follow:
logq = logKF + (1
n)logCe (8)
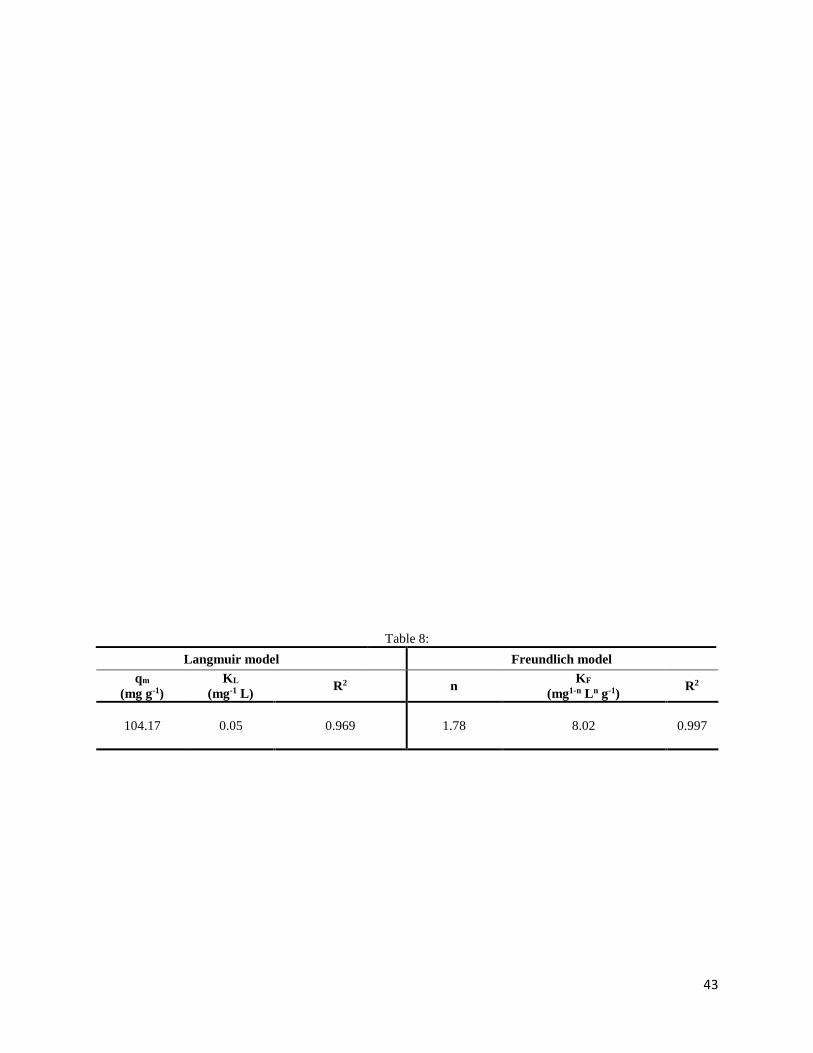
The regression results of comparing the experimental data to Langmuir and Freundlich models are indicated in Fig.
10. Also, Table 8 illustrates the calculated adsorption parameters of isothermal curves of Freundlich and Langmuir
adsorption. The correlation coefficient comparison of these models shows that Freundlich model (R2=0.997) is
better matching to experimental data. Therefore, adsorption of hydrogen sulfide on nanocomposite occurs in a
multilayer form.
Fig. 10
Table 8
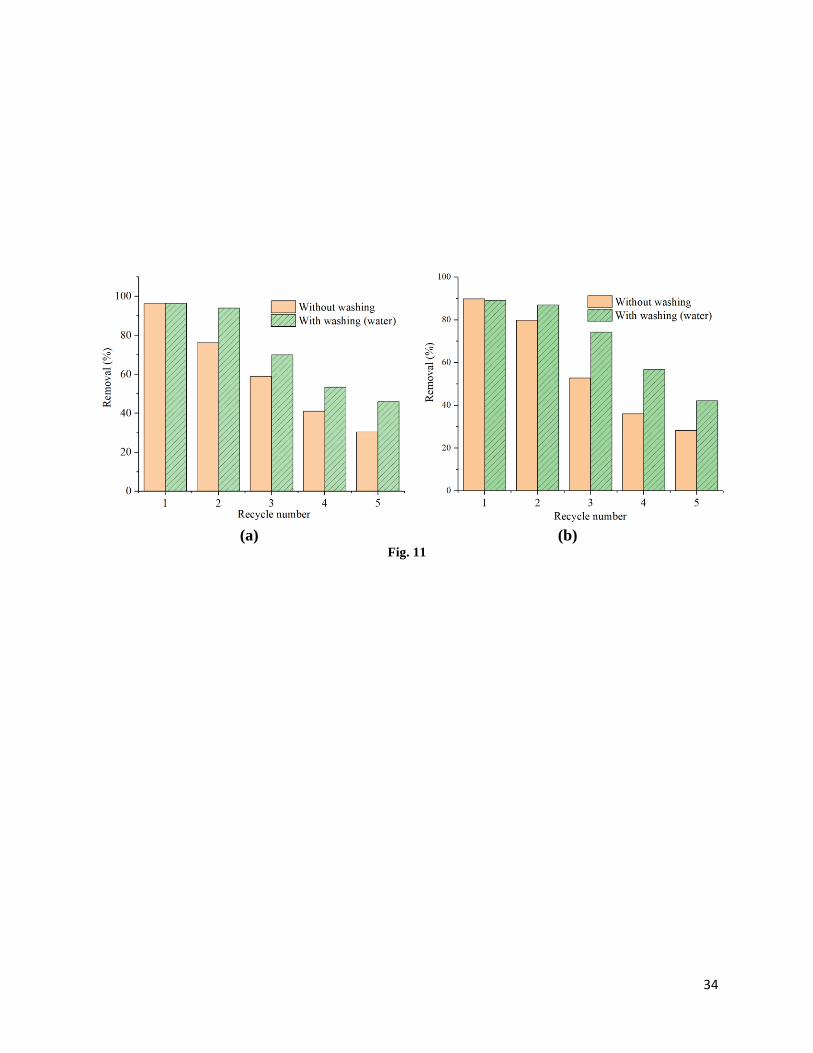
3.5. Reusability of nanomaterial
In order to study the reusability of synthesized nanoparticle and nanocomposite with and without washing, by
applying the optimum conditions including Initial hydrogen sulfide concentration, 800 ppm, and ZnO/SiO2
nanocomposite with ratio of 3:1, nanocomposite concentration, 0.1 and 0.9 wt.%, pH, 12, and contact time, 3 min.,
nanocomposite was added to drilling fluid (with hydrogen sulfide) for several times, that the results are showed in
Fig. 11-a and b. It is obvious that, ZnO/SiO2 nanocomposite with minimum and maximum concentration with and
La
n
14
without washing by deionized water for at least four cycles in hydrogen sulfide removal with adsorption efficiency
of more than 50% is acceptable. It is noteworthy that, reusability and removal efficiency for nanocomposite with
washing process is better than without washing by deionized water.
Fig. 11
4. Conclusion
In order to removal hydrogen sulfide from drilling fluid, ZnO and SiO2 nanoparticles and ZnO/SiO2 nanocomposite
with different ratio were synthesized by precipitation and sol-gel method and characterized. The Design Expert
software, I-optimal method, was used to design the experiments and obtained optimum condition (0.1 and 0.9 wt.%,
800 ppm, 3 min and pH=12). The maximum removal in the optimum conditions was 92.6% and 97.2% at minimum
and maximum nanoparticle concertation. Moreover, the investigation of kinetic and isotherm of adsorption revealed
that the removal process follows pseudo-second order, Freundlich isothermal and multisite adsorption model. This
nanoparticle has the ability to be used at least in four cycles consecutive hydrogen sulfide removal with efficiency of
greater than 50% and the reusability for washing nanocomposite is better than without washing. Also, hydrogen
sulfide removal is significantly fast and contact time has a few impact on the process.
References
Achife E, Ibemesi J. Applicability of the Freundlich and Langmuir adsorption isotherms in the bleaching of rubber
and melon seed oils. J of the Ame Oil Chem Soc. 1989; 66(2): 247-252.
Ali A, Harraz MFA, Ismail AA, et al. Synthesis of amorphous ZnO–SiO2 nanocomposite with enhanced chemical
sensing properties. Thin Solid Films. 2016; 605:277-282.
Arshad A, Farrukh MA, Ali S, et al. Development of Latent Fingermarks on Various Surfaces Using ZnO‐ SiO2
Nanopowder. J of forensic sci. 2015; 60(5):1182-1187.
Awume B, Tajallipour M, Nemati M, et al. Application of ZnO Nanoparticles in Control of H 2 S Emission from
Low-Temperature Gases and Swine Manure Gas. Water, Air, & Soil Pollution. 2017; 228(4):147.
Bagheri S, Chandrappa K, Hamid SBA. Facile synthesis of nano-sized ZnO by direct precipitation method. Der
Pharma Chemica. 2013; 5(3):265-270.
Blatt, O, Helmich M, Steuten B, et al. Iron Oxide/Polymer‐ Based Nanocomposite Material for Hydrogen Sulfide
Adsorption Applications. Chem Eng Tech 2014; 37(11):1938-1944.

15
Carney LL, Jones B. Practical Solutions to Combat the Detrimental Effects of Hydrogen Sulfide During Drilling
Operations. SPE Symposium on Sour Gas and Crude, Society of Petroleum Engineers.1974.
Daneshyar A, Ghaedi M, Sabzehmeidani M. H2S adsorption onto Cu-Zn–Ni nanoparticles loaded activated carbon
and Ni-Co nanoparticles loaded γ-Al2O3: optimization and adsorption isotherms. J of colloid and interf sci 2017;
490:553-561.
Dargahi-Zaboli M, Sahraei E, Pourabbas B. Hydrophobic silica nanoparticle-stabilized invert emulsion as drilling
fluid for deep drilling. Pet Sci. 2017; 14(1):105-115.
Esmaeili-Faraj SH, Nasr Esfahany M. Absorption of hydrogen sulfide and carbon dioxide in water based
nanofluids. Ind Eng Chem Res. 2016; 55(16):4682-4690.
Fauteux-Lefebvre C, Abatzoglou N, Braidy N, et al. Carbon nanofilaments functionalized with iron oxide
nanoparticles for in-depth hydrogen sulfide adsorption. Industrial & Eng Chem Res. 2015; 54(37):9230-9237.
Gessner, PK, Hasan MM, Freundlich and Langmuir isotherms as models for the adsorption of toxicants on activated
charcoal. J of pharm sci. 1987; 76(4):319-327.
Goldstein JI, Newbury DE, Michael JR, et al. Scanning electron microscopy and X-ray microanalysis. 4rd ed.
Springer; 2017.
Han CH, Han SD, Khatkar S. Enhancement of H2-sensing properties of F-doped SnO2 sensorby surface modification
with SiO2. Sensors. 2006; 6(5):492-502.
Hasnidawani J, Azlina H. Norita H, et al. Synthesis of ZnO nanostructures using sol-gel method. Procedia Chem.
2016; 19:211-216.
HoYS, McKay G. Pseudo-second order model for sorption processes. Process biochmem. 1999; 34(5):451-465.
Jurablu S, Farahmandjou M, Firoozabadi T. Sol-Gel Synthesis of Zinc Oxide (ZnO) Nanoparticles: Study of
Structural and Optical Properties. J of Sci, Islamic Republic of Iran. 2015; 26(3):281-285.
Kumar SS, Venkateswarlu P, Rao VR, et al. Synthesis, characterization and optical properties of zinc oxide
nanoparticles. Inter Nano Letters. 2013; 3(1):1-30.
Lagergren SK. About the theory of so-called adsorption of soluble substances. Sven. Vetenskapsakad. Handingarl.
1898; 24:1-39.
Lim SK, Hwang SH, Kim S. Preparation of ZnO nanorods by microemulsion synthesis and their application as a CO
gas sensor. Sensors and Actuators B: Chemical. 2011; 160(1):94-98.

16
Liu C, Zhang R, Wei S, et al. Selective removal of H2S from biogas using a regenerable hybrid TiO2/zeolite
composite. Fuel. 2015; 157: 183-190.
Liu G, Huang ZH, Kang F. Preparation of ZnO/SiO2 gel composites and their performance of H2S removal at room
temperature. J of hazardous materials. 2012; 215:166-172.
Ma R, Levard C, Michel FM, et al. Sulfidation Mechanism for Zinc Oxide Nanoparticles and the Effect of
Sulfidation on Their Solubility. Environ Sci Technol. 2013; 47:2527−2534.
Ma M, Zou C. Enhancement by SiC Nanoparticles of the Removal of Hydrogen Sulfide from Natural Gas by a
Traditional Desulfurizer. Energy & Fuels. 2017; 31(8):8054-8060.
Morgani MS, Saboori R, Sabbaghi S. Hydrogen sulfide removal in water-based drilling fluid by metal oxide
nanoparticle and ZnO/TiO2 nanocomposite. Mat Res Exp. 2017; 4(7):075501.
Musić S, Filipović-Vinceković N, Sekovanić L. Precipitation of amorphous SiO2 particles and their properties. Bra J
of chem Eng. 2011; 28(1):89-94.
PudduV, Perry CC. Peptide adsorption on silica nanoparticles: evidence of hydrophobic interactions. ACS nano.
2012; 6(7):6356-6363.
Raevskaya A,Panasiuk YV, Stroyuk O, et al. Spectral and luminescent properties of ZnO-SiO2 core-shell
nanoparticles with size-selected ZnO cores. RSC Adv. 2014; 4(108):63393-63401.
Rahman IA, Padavettan V. Synthesis of silica nanoparticles by sol-gel: size-dependent properties, surface
modification, and applications in silica-polymer nanocomposites-a review. J of Nanomaterials. 2012; 2012:1-8.
Saboori R, Azin R, Osfouri et al. Wettability alteration of carbonate rocks from strongly liquid-wetting to strongly
gas-wetting by fluorine-doped silica coated by fluorosilane. J of Disp Sci and Tech. 2018; 39(6):767-776.
Saboori R, Sabbaghi S, Kalantariasl A, et al. Improvement in filtration properties of water-based drilling fluid by
nanocarboxymethyl cellulose/polystyrene core-shell nanocomposite. J of Petr Exp and Prod Tech. 2018; 1-10.
Sekhavatjou MS, Moradi R, Hosseini Alhashemi A, et al. A new method for sulfur components removal from sour
gas through application of zinc and iron oxides nanoparticles. Int J of Envi Res. 2014; 8(2):273-278.
Shastri L, Qureshi M, Malik M. Photoluminescence study of ZnO–SiO2 nanostructures grown in silica matrix
obtained via sol–gel method. J of Phy and Chem of Solids. 2013; 74(4):595-598.
Skoog DA, Holler FJ, Crouch SR. Principles of instrumental analysis. Cengage learning; 2017.
Speakman SA. Estimating crystallite size using XRD. MIT Center for Mat Sci and Eng. 2014.

17
Stöber W, Fink A, Bohn E. Controlled growth of monodisperse silica spheres in the micron size range. J of colloid
and interf sci. 1968; 26(1):62-69.
Sunde E, Olsen H. Removal of H2S in drilling mud. 1999.
Wang X, Sun T, Yang J, et al. Low-temperature H2S removal from gas streams with SBA-15 supported ZnO
nanoparticles. Chem Eng J. 2008; 142(1):48-55.
Zhang Z, Liu B, Wang F, et al. Hydrogen sulfide removal from hot coal gas by various mesoporous silica supported
Mn2O3 sorbents. Appl Surf Sci. 2014; 313:961-969.
Figure Captions:
Fig. 1 Procedure of ZnO/SiO2 nanocomposite synthesis with 1:1 ratio.
Fig. 2 The XRD pattern of; (a) ZnO nanoparticle, (b) SiO2 nanoparticle, (c) ZnO/SiO2 nanocomposite with a ratio of
1:1, (d) ZnO/SiO2 nanocomposite with a ratio of 3:1, and (e) ZnO/SiO2 nanocomposite with a ratio of 1:3.
Fig. 3 EDAX analysis of ZnO/SiO2 nanocomposite with a ratio of 1:3, 1:1, and 3:1.
Fig. 4 FT-IR analysis of the, (a) ZnO nanoparticle, (b) SiO2 nanoparticle, and (c) ZnO/SiO2 nanocomposite for
different ratio: (a) 3:1, (b) 1:3, and (c) 1:1.
Fig. 5 FE-SEM image of (a) ZnO nanoparticle, (b) SiO2 nanoparticles, (c) ZnO/SiO2 nanocomposite with ratio of
1:1, (d) ZnO/SiO2 nanocomposite with ratio of 1:3, and (e) ZnO/SiO2 nanocomposite with ratio of 3:1.
Fig. 6 The Effect of (a) nanoparticle concertation, (b) hydrogen sulfide concentration, (c) pH, (d) contact time, and
(e) nanocomposite ratio on hydrogen sulfide removal from drilling fluid.
Fig. 7 The effect of interaction between (a) hydrogen sulfide concentration and ratio of nanocomposite, (b) ratio of
nanocomposite and pH, and (c) hydrogen nanoparticle concentration and ratio of nanocomposite on removal from
drilling fluid.
Fig. 8 Optimum condition for hydrogen sulfide removal from drilling fluid, a) minimum nanoparticle concentration,
and b) maximum nanoparticle concentration.
Fig. 9 The result of kinetic study of hydrogen sulfide adsorption from drilling fluid (a)The pseudo-first order and (b)
the pseudo-second order.

18
Fig. 10 The isothermal curves for hydrogen sulfide adsorption from drilling fluid with ZnO/SiO2 nanocomposite, (a)
Freundlich model and (b) Langmuir model.
Fig. 11 The reusability of nanomaterial at optimum condition: (a) Maximum nanomaterial concentration (0.1 wt.%),
and (b) minimum nanomaterial concentration (0.9 wt.%).

19
Zinc acetate dihydrate
(2 gr)
Deionized water
(10 ml)Nitric acid
Ethanol
(10 ml)
Tetra ethylorthosilicate
(2 ml)
Mixing
(2 hr)
Formation gel
(24 hr)
Solution A
PH=4Solution B
Drying Calcination
Fig. 1
(a)
20
(b)
(c)
(d)

21
(e) Fig. 2

22
Fig. 3

23
(a)
(b)
24
Fig. 4

25
(a) (b)
(c) (d)
(e)
Fig. 5

26
-
(a) (b)
27
(c) (d)

28
(e)
Fig. 6

29
(a)
(b)

30
Fig. 7

31
(a)
(b)
Fig. 8

32
(a)
(b)
Fig. 9
33
(a) (b)
Fig. 10
34
(a) (b)
Fig. 11

35
Table Captions:
Table 1: Amount of materials for nanocomposite synthesis with different ratio.
Table 2: The effective parameter and their range on hydrogen sulfide removal from water based drilling fluid.
Table 3: The crystallite size of the synthesized nanoparticles and the nanocomposites.
Table 4: Specific surface area for synthesized nanoparticle.
Table 5: The designed experiments with Design Expert software and their results.
Table 6: Variance analysis.
Table 7: Calculated parameter for two kinetic models in hydrogen sulfide removal.
Table 8: The adsorption parameters of isothermal model.
36
Table 1:
nanocomposite 2/SiOZnO
(molar ratio)
Zinc acetate dihydrate
(gr)
Deionized water
(ml)
Tetraethyl orthosilicate
(ml)
Ethanol
(ml)
1:1 2 10 2 10
1:3 2 10 6 15
3:1 2 10 0.3 1.5

37
Table 2:
Variables Unit range
Hydrogen sulfide concentration mL 100-800
Nanomaterial concentration wt.% 0.1-0.9
pH ---- 8-12
Time min. 3-30

38
Table 3:
𝜏(nm) 2𝜃 𝛽 (rad.) 𝜆(nm) 𝐾 Nanomaterial
14.20 36.27 0.01029 0.156 0.90 ZnO
13.58 22.25 0.01029 0.156 0.90 SiO2
10.66 39.33 0.01716 0.156 0.90 SiO2/ZnO (1:1)
8.52 36.32 0.01717 0.156 0.90 SiO2/ZnO (1:3)
10.55 31.71 0.01373 0.156 0.90 SiO2/ZnO (3:1)

39
Table 4:
Specific surface area (m2gr-1) Ratio of ZnO/SiO2 nanocomposite
36.18 1:0
16.39 0:1
129.72 1:1
51.62 1:3
208.82 3:1

40
Table 5:
Run A B C D E Removal
(%) Run A B C D E
Removal
(%)
1 0.9 800 5 3 3:1 88.28 2 0.7 100 5 11 1:3 80.08
3 0.5 400 5 9 3:1 80.90 4 0.7 200 30 9 0:1 76.34
5 0.1 400 10 11 1:3 56.06 6 0.9 100 30 3 1:1 82.57
7 0.3 300 20 3 1:0 68.04 8 0.5 800 20 5 1:1 65.21
9 0.3 100 30 3 1:3 62.93 10 0.9 500 20 11 1:0 83.40
11 0.5 400 5 9 3:1 85.68 12 0.5 800 5 9 1:3 60.46
13 0.5 800 20 5 1:1 68.25 14 0.5 500 30 3 3:1 77.75
15 0.9 500 3 9 1:1 82.40 16 0.1 800 20 7 3:1 65.04
17 0.1 500 10 7 1:1 60.66 18 0.5 100 20 11 1:! 76.65
19 0.7 100 3 7 1:0 80.42 20 0.9 100 20 7 3:1 96.06
21 0.7 300 20 5 0:1 75.38 22 0.3 800 20 11 1:0 60.04
23 0.1 500 30 11 1:3 56.71 24 0.3 800 3 5 0:1 56.37
25 0.1 100 3 3 3:1 67.58 26 0.1 400 30 7 1:1 62.70
27 0.9 300 3 5 3:1 91.14 28 0.9 800 20 5 0:1 78.45
29 0.7 800 30 5 1:0 70.30 30 0.1 100 30 11 1:0 68.46
31 0.9 200 20 3 1:0 80.78 32 0.1 200 10 7 0:1 61.21
33 0.1 800 30 3 0:1 49.27 34 0.1 800 3 11 1:1 60.79
35 0.9 500 20 5 1:3 75.43 36 0.1 800 5 9 1:0 58.97
37 0.9 100 3 11 0:1 88.85 38 0.7 100 5 3 0:1 73.56
39 0.9 800 30 11 3:1 92.41 40 0.1 400 3 3 1:3 51.09
41 0.1 100 30 11 3:1 73.97 42 0.3 100 5 3 1:1 67.63
A: Nanoparticle concentration (wt.%), B: Hydrogen sulfide concentration (ppm), C: Contact time (min.), D: pH, E: ratio of ZnO/SiO2 nanocomposite.

41
Table 6:
Source Sum of Squares Mean Square F-Value p-value
Model 3477.21 165.58 86.70 < 0.0001
Nanoparticle concentration (A) 384.10 384.10 201.12 < 0.0001
Hydrogen sulfide concentration(B) 2.38 2.38 1.25 0.2775
Contact time (C) 2.81 2.81 1.47 0.2391
pH (D) 308.67 308.67 161.62 < 0.0001
Ratio of ZnO/SiO2 (E) 2167.30 541.82 283.71 < 0.0001
BE 315.41 78.85 41.29 < 0.0001
DE 92.05 23.01 12.05 < 0.0001
AE 34.99 8.75 4.58 0.0087
B2 71.86 71.86 37.63 < 0.0001
R-square=0.9891 Adj R-Squared=0.9777 Pred R-Squared=0.9542
42
Table 7:
Kinetic model 1K
)1-(min 2K
(g mg-1min-1) 2R
Pseudo-first order 0.051 - 0.971
Pseudo-second order - 0.013 0.936
43
Table 8:
Freundlich model Langmuir model
R2 KF
(mg1-n Ln g-1) n R2
KL
(mg-1 L)
qm
(mg g-1)
0.997 8.02 1.78 0.969 0.05 104.17
Related Documents


