Hydrogen storage on chemically activated carbons and carbon nanomaterials at high pressures M. Jorda ´-Beneyto, F. Sua ´rez-Garcı ´a, D. Lozano-Castello ´, D. Cazorla-Amoro ´s * , A. Linares-Solano Departamento Quı ´mica Inorga ´ nica, Universidad de Alicante. Ap. 99, E-03080 Alicante, Spain Received 27 July 2006; accepted 16 September 2006 Available online 1 November 2006 Abstract Hydrogen adsorption measurements have been carried out at different temperatures (298 K and 77 K) and high pressure on a series of chemically activated carbons with a wide range of porosities and also on other types of carbon materials, such as activated carbon fibers, carbon nanotubes and carbon nanofibers. This paper provides a useful interpretation of hydrogen adsorption data according to the porosity of the materials and to the adsorption conditions, using the fundamentals of adsorption. At 298 K, the hydrogen adsorption capacity depends on both the micropore volume and the micropore size distribution. Values of hydrogen adsorption capacities at 298 K of 1.2 wt.% and 2.7 wt.% have been obtained at 20 MPa and 50 MPa, respectively, for a chemically activated carbon. At 77 K, hydrogen adsorption depends on the surface area and the total micropore volume of the activated carbon. Hydrogen adsorption capacity of 5.6 wt.% at 4 MPa and 77 K have been reached by a chemically activated carbon. The total hydrogen storage on the best activated carbon at 298 K is 16.7 g H 2 /l and 37.2 g H 2 /l at 20 MPa and 50 MPa, respectively (which correspond to 3.2 wt.% and 6.8 wt.%, exclud- ing the tank weight) and 38.8 g H 2 /l at 77 K and 4 MPa (8 wt.% excluding the tank weight). Ó 2006 Elsevier Ltd. All rights reserved. 1. Introduction Development of hydrogen fueled vehicles can bring eco- nomical and environmental benefits through a decrease in using oil, and, consequently, a decrease in air pollution and other greenhouse gases [1]. However, one of the most important drawbacks of the use of hydrogen as a fuel is that it has to be stored. There are different techniques to store hydrogen. All those techniques have to meet the pro- visional Department of Energy of the United States (DOE) criterion. The DOE has established different targets for on- board hydrogen storage systems, including the minimum ‘‘gravimetric’’ and ‘‘volumetric’’ capacity and the revers- ibility of the charging/discharging processes. For the 2010 year, the storage system should have a gravimetric capacity of 2 kWh/kg (6 wt.% of H 2 ) and a volumetric capacity of 1.5 kWh/L (0.045 kg H 2 /l). These values are referred to the whole system, including the storage medium, the vessel, the refuelling infrastructure, any regulators, electronic con- trollers, sensors, and so on (for more information see the webpage 1 ). A critical parameter in this application is vol- ume. Thus, efforts are focused in reducing the tank volume containing hydrogen. Four different methods to store hydrogen are currently available: liquid hydrogen, compressed gas, metal hydrides and sorption on different porous materials (carbon materi- als, zeolites, metal organic frameworks, etc.) [2–4]. Cryo- genic liquid hydrogen systems experience potential hydrogen losses due to evaporation; compressed hydrogen systems undergo safety problems; metal hydrides systems experience high weight and cost concerns, and moreover high temperatures are often required to release hydrogen; finally, hydrogen adsorption undergoes low hydrogen 0008-6223/$ - see front matter Ó 2006 Elsevier Ltd. All rights reserved. doi:10.1016/j.carbon.2006.09.022 * Corresponding author. Fax: +34 96 590 3454. E-mail address: [email protected] (D. Cazorla-Amoro ´ s). 1 www.eere.energy.gov/hydrogenandfuelcells www.elsevier.com/locate/carbon Carbon 45 (2007) 293–303

Welcome message from author
This document is posted to help you gain knowledge. Please leave a comment to let me know what you think about it! Share it to your friends and learn new things together.
Transcript
www.elsevier.com/locate/carbon
Carbon 45 (2007) 293–303
Hydrogen storage on chemically activated carbons and carbonnanomaterials at high pressures
M. Jorda-Beneyto, F. Suarez-Garcıa, D. Lozano-Castello,D. Cazorla-Amoros *, A. Linares-Solano
Departamento Quımica Inorganica, Universidad de Alicante. Ap. 99, E-03080 Alicante, Spain
Received 27 July 2006; accepted 16 September 2006Available online 1 November 2006
Abstract
Hydrogen adsorption measurements have been carried out at different temperatures (298 K and 77 K) and high pressure on a series ofchemically activated carbons with a wide range of porosities and also on other types of carbon materials, such as activated carbon fibers,carbon nanotubes and carbon nanofibers. This paper provides a useful interpretation of hydrogen adsorption data according to theporosity of the materials and to the adsorption conditions, using the fundamentals of adsorption. At 298 K, the hydrogen adsorptioncapacity depends on both the micropore volume and the micropore size distribution. Values of hydrogen adsorption capacities at298 K of 1.2 wt.% and 2.7 wt.% have been obtained at 20 MPa and 50 MPa, respectively, for a chemically activated carbon. At 77 K,hydrogen adsorption depends on the surface area and the total micropore volume of the activated carbon. Hydrogen adsorption capacityof 5.6 wt.% at 4 MPa and 77 K have been reached by a chemically activated carbon. The total hydrogen storage on the best activatedcarbon at 298 K is 16.7 g H2/l and 37.2 g H2/l at 20 MPa and 50 MPa, respectively (which correspond to 3.2 wt.% and 6.8 wt.%, exclud-ing the tank weight) and 38.8 g H2/l at 77 K and 4 MPa (8 wt.% excluding the tank weight).� 2006 Elsevier Ltd. All rights reserved.
1. Introduction
Development of hydrogen fueled vehicles can bring eco-nomical and environmental benefits through a decrease inusing oil, and, consequently, a decrease in air pollutionand other greenhouse gases [1]. However, one of the mostimportant drawbacks of the use of hydrogen as a fuel isthat it has to be stored. There are different techniques tostore hydrogen. All those techniques have to meet the pro-visional Department of Energy of the United States (DOE)criterion. The DOE has established different targets for on-board hydrogen storage systems, including the minimum‘‘gravimetric’’ and ‘‘volumetric’’ capacity and the revers-ibility of the charging/discharging processes. For the 2010year, the storage system should have a gravimetric capacityof 2 kWh/kg (6 wt.% of H2) and a volumetric capacity of
0008-6223/$ - see front matter � 2006 Elsevier Ltd. All rights reserved.doi:10.1016/j.carbon.2006.09.022
* Corresponding author. Fax: +34 96 590 3454.E-mail address: [email protected] (D. Cazorla-Amoros).
1.5 kWh/L (0.045 kg H2/l). These values are referred tothe whole system, including the storage medium, the vessel,the refuelling infrastructure, any regulators, electronic con-trollers, sensors, and so on (for more information see thewebpage1). A critical parameter in this application is vol-ume. Thus, efforts are focused in reducing the tank volumecontaining hydrogen.
Four different methods to store hydrogen are currentlyavailable: liquid hydrogen, compressed gas, metal hydridesand sorption on different porous materials (carbon materi-als, zeolites, metal organic frameworks, etc.) [2–4]. Cryo-genic liquid hydrogen systems experience potentialhydrogen losses due to evaporation; compressed hydrogensystems undergo safety problems; metal hydrides systemsexperience high weight and cost concerns, and moreoverhigh temperatures are often required to release hydrogen;finally, hydrogen adsorption undergoes low hydrogen
1 www.eere.energy.gov/hydrogenandfuelcells
294 M. Jorda-Beneyto et al. / Carbon 45 (2007) 293–303
uptake per unit of weight. Many advances are being carriedout in all the fields. However, further studies on high-pres-sure hydrogen adsorption are needed to understand thismethod to store hydrogen and to develop the most appro-priate adsorbent.
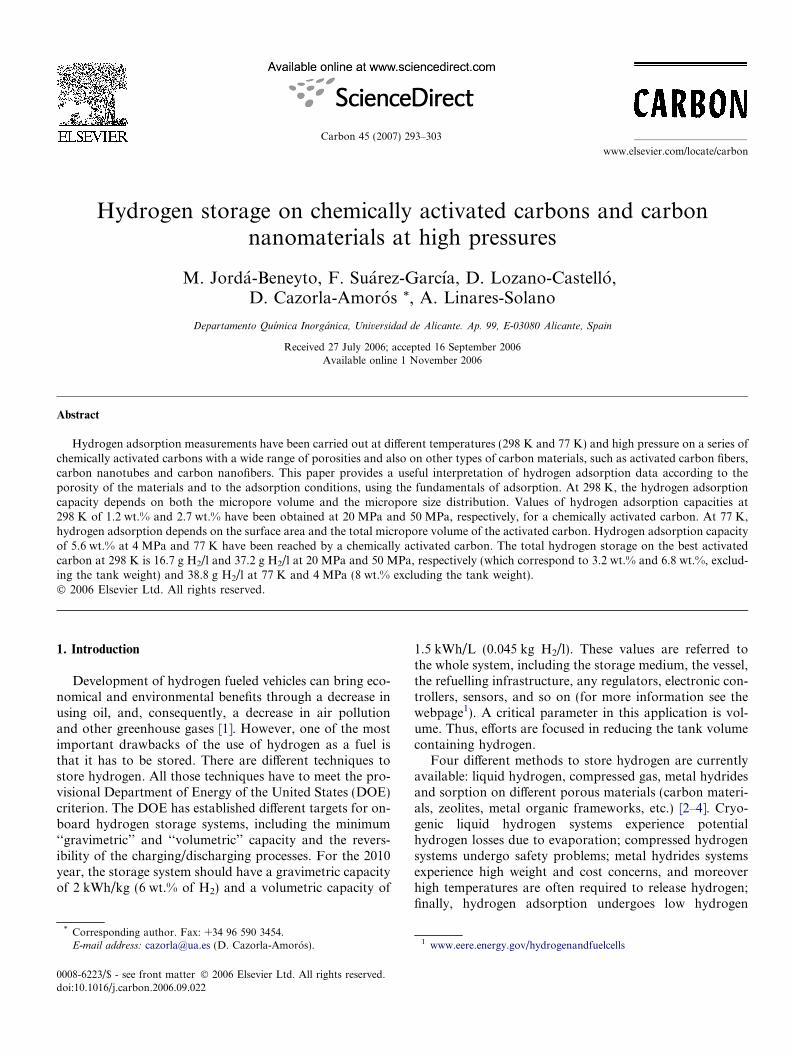
Carbon materials created great expectation in the fieldof hydrogen storage largely due to the promising resultsreported by Dillon et al. [5]. It provoked the publicationof an important number of studies using new carbon mate-rials, like single- and multi-wall carbon nanotubes andgraphite carbon nanofibers prepared by chemical vapordeposition (CVD), arc discharge, laser vaporization, etc.[6–32]. As a summary, Figs. 1(a) and (b) contains the gravi-metric hydrogen storage capacity in weight percent on car-bon nanotubes and nanofibers at different conditions ofpressure and temperature, which has been collected fromthe literature [5,7–33].
Fig. 1(a) clearly shows the two highest values reportedby Chambers et al. [33] which have not been reproducedelsewhere: a value of 67.55 wt.% H2 on herringbone graph-ite nanofibers and a value of 53.68 wt.% H2 on plateletgraphite nanofibers, at room temperature and 112 bar.Other outstanding values in Fig. 1(b) are 20 wt.% H2 fromLi doped carbon nanotubes, and 14 wt.% from K dopedcarbon nanotubes obtained by Chen et al. [9]. These largemass increased observed when carbon nanotubes filled withalkaline metals were exposed to hydrogen has been attrib-uted to hydroxide formation [34]. From Fig. 1, it can beconcluded that no general trend is observed for the exper-imental data corresponding to carbon nanotubes and car-bon nanofibers. As it has been analyzed in detail in theliterature [4], the high results dispersion and low reproduc-ibility of experimental measurements in carbon nanotubesare mostly consequence of experimental errors, such asnon-purified samples, use of low purity hydrogen, sonica-
0100
200300
400500
600700
800
10
20
30
40
50
60
70
02
46
810
1214
Pressure (MPa)
Temperature (K)
H2
(wt.
%)
a
Fig. 1. (a, b). Values found in the literature for the amount of adsorbed hydrpressure.
tion bar material and so on. In addition, each of the threeexisting methods used to estimate the hydrogen storagecapacity of adsorbents (volumetric, gravimetric and tem-perature programmed desorption (TPD) has its shortcom-ing [35].
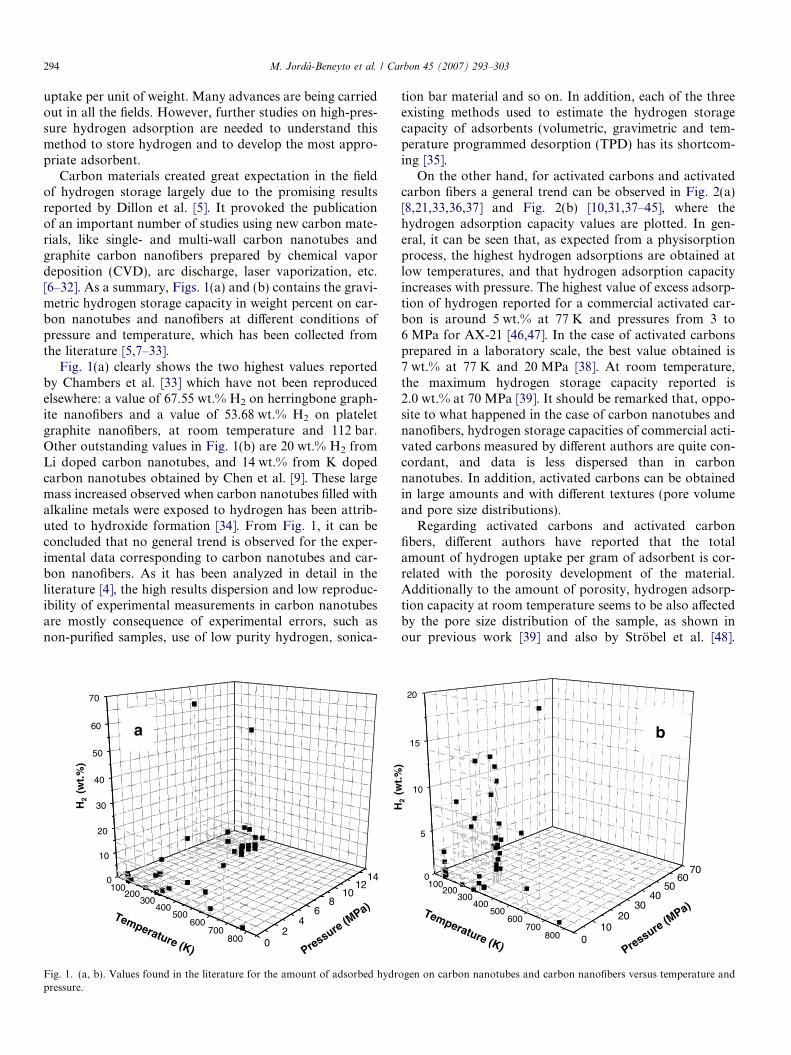
On the other hand, for activated carbons and activatedcarbon fibers a general trend can be observed in Fig. 2(a)[8,21,33,36,37] and Fig. 2(b) [10,31,37–45], where thehydrogen adsorption capacity values are plotted. In gen-eral, it can be seen that, as expected from a physisorptionprocess, the highest hydrogen adsorptions are obtained atlow temperatures, and that hydrogen adsorption capacityincreases with pressure. The highest value of excess adsorp-tion of hydrogen reported for a commercial activated car-bon is around 5 wt.% at 77 K and pressures from 3 to6 MPa for AX-21 [46,47]. In the case of activated carbonsprepared in a laboratory scale, the best value obtained is7 wt.% at 77 K and 20 MPa [38]. At room temperature,the maximum hydrogen storage capacity reported is2.0 wt.% at 70 MPa [39]. It should be remarked that, oppo-site to what happened in the case of carbon nanotubes andnanofibers, hydrogen storage capacities of commercial acti-vated carbons measured by different authors are quite con-cordant, and data is less dispersed than in carbonnanotubes. In addition, activated carbons can be obtainedin large amounts and with different textures (pore volumeand pore size distributions).
Regarding activated carbons and activated carbonfibers, different authors have reported that the totalamount of hydrogen uptake per gram of adsorbent is cor-related with the porosity development of the material.Additionally to the amount of porosity, hydrogen adsorp-tion capacity at room temperature seems to be also affectedby the pore size distribution of the sample, as shown inour previous work [39] and also by Strobel et al. [48].
H2
(wt.
%)
0100
200300
400500
600700
800
5
10
15
20
010
2030
4050
6070
Pressure (MPa)Temperature (K)
b
ogen on carbon nanotubes and carbon nanofibers versus temperature and
050
100150
200250
300
1
2
3
4
5
0
5
10
15
Pressure (MPa)
Temperature (K)
a
050
100150
200250
300
1
2
3
4
5
6
7
010
2030
4050
6070
Pressure (MPa)
Temperature (K)
b
H2
(wt.
%)
H2
(wt.
%)
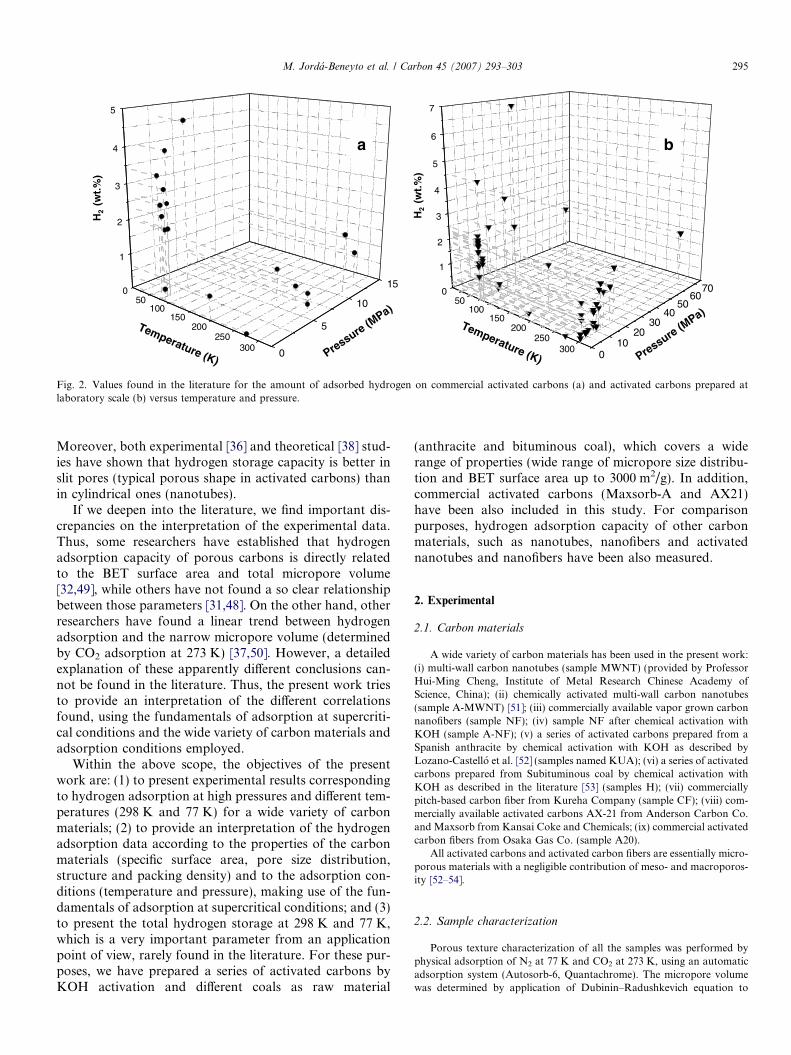
Fig. 2. Values found in the literature for the amount of adsorbed hydrogen on commercial activated carbons (a) and activated carbons prepared atlaboratory scale (b) versus temperature and pressure.
M. Jorda-Beneyto et al. / Carbon 45 (2007) 293–303 295
Moreover, both experimental [36] and theoretical [38] stud-ies have shown that hydrogen storage capacity is better inslit pores (typical porous shape in activated carbons) thanin cylindrical ones (nanotubes).
If we deepen into the literature, we find important dis-crepancies on the interpretation of the experimental data.Thus, some researchers have established that hydrogenadsorption capacity of porous carbons is directly relatedto the BET surface area and total micropore volume[32,49], while others have not found a so clear relationshipbetween those parameters [31,48]. On the other hand, otherresearchers have found a linear trend between hydrogenadsorption and the narrow micropore volume (determinedby CO2 adsorption at 273 K) [37,50]. However, a detailedexplanation of these apparently different conclusions can-not be found in the literature. Thus, the present work triesto provide an interpretation of the different correlationsfound, using the fundamentals of adsorption at supercriti-cal conditions and the wide variety of carbon materials andadsorption conditions employed.
Within the above scope, the objectives of the presentwork are: (1) to present experimental results correspondingto hydrogen adsorption at high pressures and different tem-peratures (298 K and 77 K) for a wide variety of carbonmaterials; (2) to provide an interpretation of the hydrogenadsorption data according to the properties of the carbonmaterials (specific surface area, pore size distribution,structure and packing density) and to the adsorption con-ditions (temperature and pressure), making use of the fun-damentals of adsorption at supercritical conditions; and (3)to present the total hydrogen storage at 298 K and 77 K,which is a very important parameter from an applicationpoint of view, rarely found in the literature. For these pur-poses, we have prepared a series of activated carbons byKOH activation and different coals as raw material
(anthracite and bituminous coal), which covers a widerange of properties (wide range of micropore size distribu-tion and BET surface area up to 3000 m2/g). In addition,commercial activated carbons (Maxsorb-A and AX21)have been also included in this study. For comparisonpurposes, hydrogen adsorption capacity of other carbonmaterials, such as nanotubes, nanofibers and activatednanotubes and nanofibers have been also measured.
2. Experimental
2.1. Carbon materials
A wide variety of carbon materials has been used in the present work:(i) multi-wall carbon nanotubes (sample MWNT) (provided by ProfessorHui-Ming Cheng, Institute of Metal Research Chinese Academy ofScience, China); (ii) chemically activated multi-wall carbon nanotubes(sample A-MWNT) [51]; (iii) commercially available vapor grown carbonnanofibers (sample NF); (iv) sample NF after chemical activation withKOH (sample A-NF); (v) a series of activated carbons prepared from aSpanish anthracite by chemical activation with KOH as described byLozano-Castello et al. [52] (samples named KUA); (vi) a series of activatedcarbons prepared from Subituminous coal by chemical activation withKOH as described in the literature [53] (samples H); (vii) commerciallypitch-based carbon fiber from Kureha Company (sample CF); (viii) com-mercially available activated carbons AX-21 from Anderson Carbon Co.and Maxsorb from Kansai Coke and Chemicals; (ix) commercial activatedcarbon fibers from Osaka Gas Co. (sample A20).
All activated carbons and activated carbon fibers are essentially micro-porous materials with a negligible contribution of meso- and macroporos-ity [52–54].
2.2. Sample characterization
Porous texture characterization of all the samples was performed byphysical adsorption of N2 at 77 K and CO2 at 273 K, using an automaticadsorption system (Autosorb-6, Quantachrome). The micropore volumewas determined by application of Dubinin–Radushkevich equation to
296 M. Jorda-Beneyto et al. / Carbon 45 (2007) 293–303
the N2 adsorption isotherm at 77 K up to P/P0 6 0.1. The volume of nar-row micropores (mean pore size lower than 0.7 nm) was calculated fromCO2 adsorption at 273 K.
The packing density of the materials was determined by pressing agiven amount of activated carbon (0.5 g approximately) in a mould at apressure of 550 kg/cm2 [55]. The measurements were repeated severaltimes. The densities obtained have an error smaller than 3%.
2.3. Hydrogen adsorption measurements
Hydrogen adsorption measurements were carried out at 298 K and at77 K both at high pressures. Hydrogen isotherms at 298 K were carriedout in an automatic volumetric apparatus design and built up in our lab-oratory to perform hydrogen isotherms up to 20 MPa. The manifold ofthe apparatus was kept at 308 ± 0.1 K. Also, the sample cell was refriger-ated at 298 ± 0.1 K, by means of a liquid bath. Manifold volume was cal-ibrated with a standard volume, carrying out helium isotherms. In order toassure that the apparatus was leak-free, hydrogen leak test was executed at9 and 15 MPa during 28 h, the leak rate resulted below 10�6 s�1. The bulkgas amounts have been calculated by the equation of state of Modified-Benedic–Webb–Rubin [56], and the cell volume has been calculated takeninto account the correction described in the literature [57]. Previous to theadsorption isotherm, the sample was degassed at 523 K during 4 h undervacuum. After that, the sample was located in the sample holder, and thenevacuated at 403 K during 4 h in vacuum. Sample weight was about700 mg. Hydrogen and helium used in the experiments were 99.9995%pure.
Hydrogen isotherms at 77 K and up to 4 MPa were carried out in aDMT high-pressure microbalance. The sample was degassed at 423 K dur-ing 4 h under vacuum. Sample weight was between 250 and 750 mg. Theexperimental results were corrected for buoyancy effects related to the dis-placement of gas by the sample, sample holder and pan [58].
3. Results and discussion
3.1. Porous texture characterization
Table 1 contains the porous texture characterizationresults corresponding to a selection of the samples studiedin the present paper. The total micropore volume [Vlp(N2)]
Table 1Porous texture parameters deduced from the N2 and CO2 adsorptionisotherms at 77 K and 298 K, respectively, for the carbon materials used inthe present work
Sample BET area(m2 g�1)
Vlp(DR,N2)(cm3 g�1)
Vlp(DR,CO2)(cm3 g�1)
CF 0 0 0.18KUA1 1058 0.51 0.50KUA2 1330 0.58 0.54A20 1666 0.79 0.43KUA3 1694 0.71 0.68KUA4 1953 0.87 0.70H1 2122 0.92 0.89AX21 2513 0.93 0.68KUA5 3183 1.10 0.72Maxsorb 3178 1.20 0.69KUA6 3808 1.27 0.68
MWNT 74 0.04 0.03NF 150 0.07 0.03A-NF 265 0.11 0.10A-MWNT 1220 0.46 0.29
(pore size lower than 2 nm) and the narrow micropore vol-ume [Vlp(CO2)] (pore size smaller than 0.7 nm, approxi-mately) were obtained by applying the DubininRadushkevich equation [59] to the N2 (77 K) and CO2
(273 K) adsorption isotherms, respectively [60–62]. Forcomparison purposes, Table 1 also includes the specificBET surface area [63].
As it is observed, the selection of samples includes mate-rials with very different porosity: a sample with very lowdevelopment of the porosity (sample (CF)) and sampleswith surface areas higher than 3000 m2/g (superactivatedcarbons; samples of the series KUA). Moreover, thesematerials present different micropore size distribution(MPSD). For example, sample CF presents CO2 adsorp-tion at 273 K but does not adsorb N2 at 77 K. This isdue to the existence of very narrow microporosity (meanpore size around 0.3-0.5 nm, approximately), where N2
adsorption at 77 K has diffusional limitations [60–62].For this sample, the micropore volume calculated fromCO2 adsorption (Vlp(CO2)) is considered as the totalmicropore volume. On the other hand, there are othermaterials that present a similar micropore volume calcu-lated from CO2 and N2 isotherms (see samples KUA1 toKUA3), indicating a narrow MPSD with a mean pore sizearound 0.6–0.7 nm [60,61]. Finally, there are other sampleswith Vlp(N2) > Vlp(CO2), indicating a wider MPSD withlarger mean pore size [60–62]. From these results, the widerMPSD corresponds to the sample KUA6.
Regarding carbon nanotubes (MWNT) and nanofibers(NF), they have a much lower development of the porositycompared with activated carbons (see Table 1). For bothkind of materials, chemical activation with KOH leadsto an increase in the material porosity, especially in thecase of carbon nanotubes, where the activated sample(A-MWNT) shows textural parameters similar to thoseof an AC.
3.2. Hydrogen adsorption at 298 K
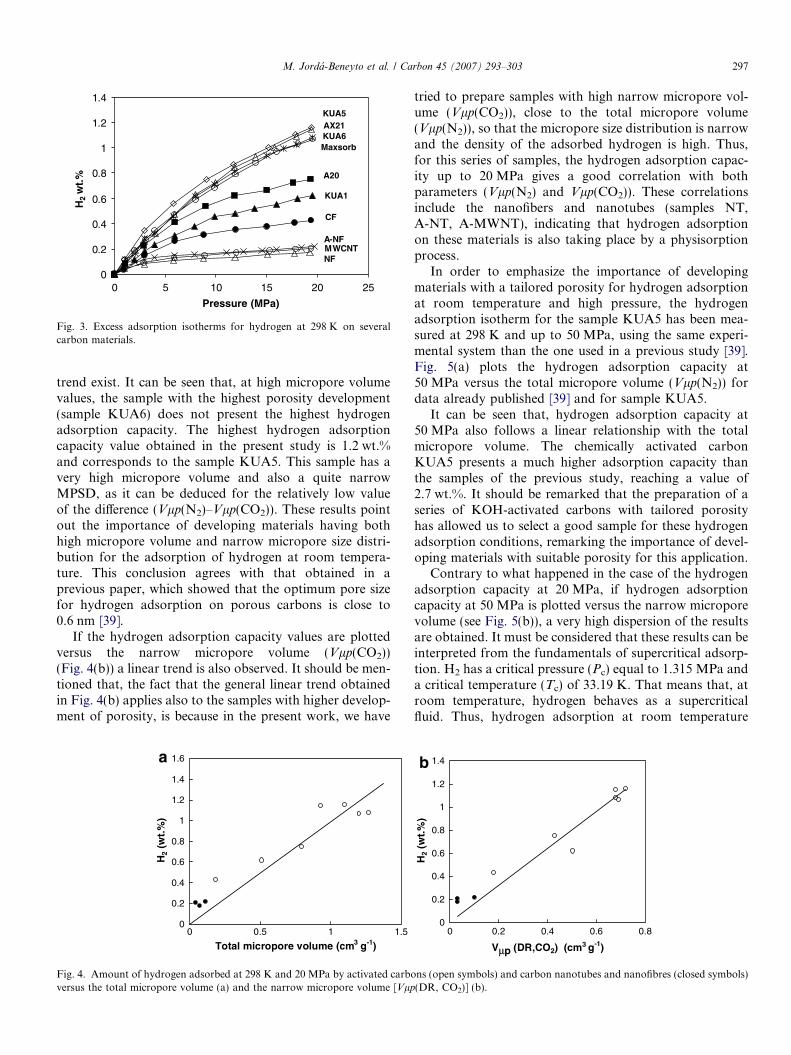
Fig. 3 contains the excess adsorption isotherms forhydrogen at 298 K and up to 20 MPa corresponding tosome of the samples measured for the present study. Itcan be seen that, nanotubes and nanofibers present the low-est hydrogen adsorption capacities at room temperature,according to their low porosity development. The hydro-gen adsorption isotherms obtained for the rest of thematerials seem to indicate that the higher the porositydevelopment of the sample, the higher the hydrogenadsorption capacity.
To see better the variation of hydrogen adsorption withthe development of porosity, Fig. 4(a) includes the amountof hydrogen adsorbed (weight percent) at 20 MPa, versusthe total micropore volume (Vlp(N2) for all the samplesand Vlp(CO2) for the sample CF).
As just predicted, a general trend where hydrogenadsorption capacity increases with total micropore volume,can be observed. However, some deviations to this general
0
0.2
0.4
0.6
0.8
1
1.2
1.4
0 5 10 15 20 25
Pressure (MPa)
H2
wt.
%
KUA5
CF
A20
Maxsorb
AX21
NFMWCNTA-NF
KUA1
KUA6
Fig. 3. Excess adsorption isotherms for hydrogen at 298 K on severalcarbon materials.
M. Jorda-Beneyto et al. / Carbon 45 (2007) 293–303 297
trend exist. It can be seen that, at high micropore volumevalues, the sample with the highest porosity development(sample KUA6) does not present the highest hydrogenadsorption capacity. The highest hydrogen adsorptioncapacity value obtained in the present study is 1.2 wt.%and corresponds to the sample KUA5. This sample has avery high micropore volume and also a quite narrowMPSD, as it can be deduced for the relatively low valueof the difference (Vlp(N2)–Vlp(CO2)). These results pointout the importance of developing materials having bothhigh micropore volume and narrow micropore size distri-bution for the adsorption of hydrogen at room tempera-ture. This conclusion agrees with that obtained in aprevious paper, which showed that the optimum pore sizefor hydrogen adsorption on porous carbons is close to0.6 nm [39].
If the hydrogen adsorption capacity values are plottedversus the narrow micropore volume (Vlp(CO2))(Fig. 4(b)) a linear trend is also observed. It should be men-tioned that, the fact that the general linear trend obtainedin Fig. 4(b) applies also to the samples with higher develop-ment of porosity, is because in the present work, we have
0
0.2
0.4
0.6
0.8
1
1.2
1.4
1.6
0 0.5 1 1.5
Total micropore volume (cm3 g-1)
H2
(wt.
%)
Fig. 4. Amount of hydrogen adsorbed at 298 K and 20 MPa by activated carboversus the total micropore volume (a) and the narrow micropore volume [Vlp
tried to prepare samples with high narrow micropore vol-ume (Vlp(CO2)), close to the total micropore volume(Vlp(N2)), so that the micropore size distribution is narrowand the density of the adsorbed hydrogen is high. Thus,for this series of samples, the hydrogen adsorption capac-ity up to 20 MPa gives a good correlation with bothparameters (Vlp(N2) and Vlp(CO2)). These correlationsinclude the nanofibers and nanotubes (samples NT,A-NT, A-MWNT), indicating that hydrogen adsorptionon these materials is also taking place by a physisorptionprocess.
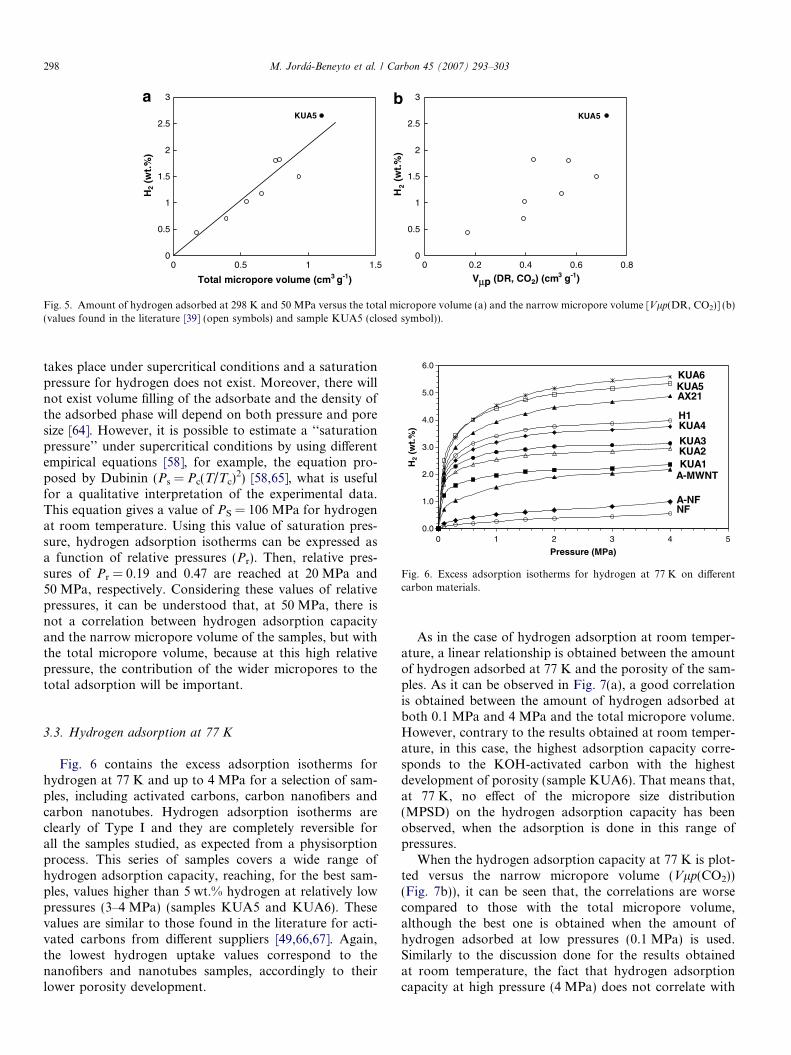
In order to emphasize the importance of developingmaterials with a tailored porosity for hydrogen adsorptionat room temperature and high pressure, the hydrogenadsorption isotherm for the sample KUA5 has been mea-sured at 298 K and up to 50 MPa, using the same experi-mental system than the one used in a previous study [39].Fig. 5(a) plots the hydrogen adsorption capacity at50 MPa versus the total micropore volume (Vlp(N2)) fordata already published [39] and for sample KUA5.
It can be seen that, hydrogen adsorption capacity at50 MPa also follows a linear relationship with the totalmicropore volume. The chemically activated carbonKUA5 presents a much higher adsorption capacity thanthe samples of the previous study, reaching a value of2.7 wt.%. It should be remarked that the preparation of aseries of KOH-activated carbons with tailored porosityhas allowed us to select a good sample for these hydrogenadsorption conditions, remarking the importance of devel-oping materials with suitable porosity for this application.
Contrary to what happened in the case of the hydrogenadsorption capacity at 20 MPa, if hydrogen adsorptioncapacity at 50 MPa is plotted versus the narrow microporevolume (see Fig. 5(b)), a very high dispersion of the resultsare obtained. It must be considered that these results can beinterpreted from the fundamentals of supercritical adsorp-tion. H2 has a critical pressure (Pc) equal to 1.315 MPa anda critical temperature (Tc) of 33.19 K. That means that, atroom temperature, hydrogen behaves as a supercriticalfluid. Thus, hydrogen adsorption at room temperature
0
0.2
0.4
0.6
0.8
1
1.2
1.4
0 0.2 0.4 0.6 0.8
Vμp (DR,CO2) (cm3 g-1)
H2
(wt.
%)
ns (open symbols) and carbon nanotubes and nanofibres (closed symbols)(DR, CO2)] (b).
0
0.5
1
1.5
2
2.5
3
0 0.2 0.4 0.6 0.8
Vμp (DR, CO2) (cm3 g-1)
H2
(wt.
%)
KUA5
0
0.5
1
1.5
2
2.5
3
0 0.5 1 1.5
Total micropore volume (cm3 g-1)
H2
(wt.
%)
KUA5
Fig. 5. Amount of hydrogen adsorbed at 298 K and 50 MPa versus the total micropore volume (a) and the narrow micropore volume [Vlp(DR, CO2)] (b)(values found in the literature [39] (open symbols) and sample KUA5 (closed symbol)).
0.0
1.0
2.0
3.0
4.0
5.0
6.0
0 1 2 3 4 5
Pressure (MPa)
H2
(wt.
%)
H1
KUA6KUA5AX21
KUA4
KUA3KUA2KUA1
A-MWNT
A-NFNF
Fig. 6. Excess adsorption isotherms for hydrogen at 77 K on differentcarbon materials.
298 M. Jorda-Beneyto et al. / Carbon 45 (2007) 293–303
takes place under supercritical conditions and a saturationpressure for hydrogen does not exist. Moreover, there willnot exist volume filling of the adsorbate and the density ofthe adsorbed phase will depend on both pressure and poresize [64]. However, it is possible to estimate a ‘‘saturationpressure’’ under supercritical conditions by using differentempirical equations [58], for example, the equation pro-posed by Dubinin (Ps = Pc(T/Tc)
2) [58,65], what is usefulfor a qualitative interpretation of the experimental data.This equation gives a value of PS = 106 MPa for hydrogenat room temperature. Using this value of saturation pres-sure, hydrogen adsorption isotherms can be expressed asa function of relative pressures (Pr). Then, relative pres-sures of Pr = 0.19 and 0.47 are reached at 20 MPa and50 MPa, respectively. Considering these values of relativepressures, it can be understood that, at 50 MPa, there isnot a correlation between hydrogen adsorption capacityand the narrow micropore volume of the samples, but withthe total micropore volume, because at this high relativepressure, the contribution of the wider micropores to thetotal adsorption will be important.
3.3. Hydrogen adsorption at 77 K
Fig. 6 contains the excess adsorption isotherms forhydrogen at 77 K and up to 4 MPa for a selection of sam-ples, including activated carbons, carbon nanofibers andcarbon nanotubes. Hydrogen adsorption isotherms areclearly of Type I and they are completely reversible forall the samples studied, as expected from a physisorptionprocess. This series of samples covers a wide range ofhydrogen adsorption capacity, reaching, for the best sam-ples, values higher than 5 wt.% hydrogen at relatively lowpressures (3–4 MPa) (samples KUA5 and KUA6). Thesevalues are similar to those found in the literature for acti-vated carbons from different suppliers [49,66,67]. Again,the lowest hydrogen uptake values correspond to thenanofibers and nanotubes samples, accordingly to theirlower porosity development.
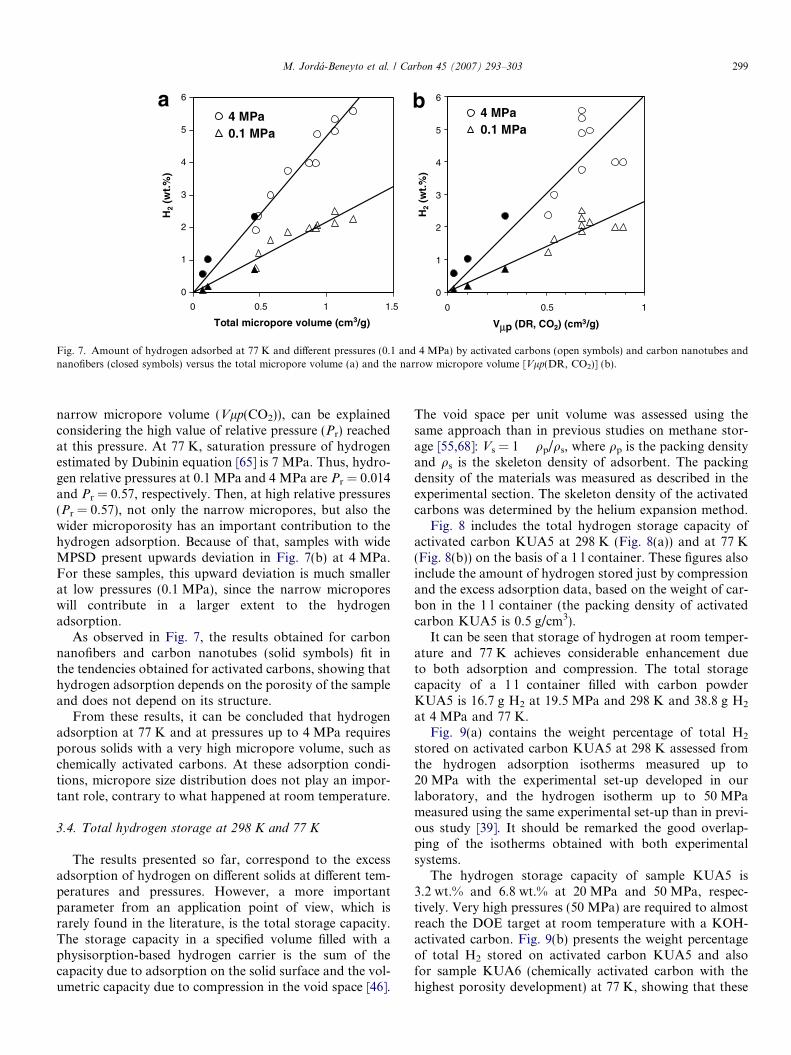
As in the case of hydrogen adsorption at room temper-ature, a linear relationship is obtained between the amountof hydrogen adsorbed at 77 K and the porosity of the sam-ples. As it can be observed in Fig. 7(a), a good correlationis obtained between the amount of hydrogen adsorbed atboth 0.1 MPa and 4 MPa and the total micropore volume.However, contrary to the results obtained at room temper-ature, in this case, the highest adsorption capacity corre-sponds to the KOH-activated carbon with the highestdevelopment of porosity (sample KUA6). That means that,at 77 K, no effect of the micropore size distribution(MPSD) on the hydrogen adsorption capacity has beenobserved, when the adsorption is done in this range ofpressures.
When the hydrogen adsorption capacity at 77 K is plot-ted versus the narrow micropore volume (Vlp(CO2))(Fig. 7b)), it can be seen that, the correlations are worsecompared to those with the total micropore volume,although the best one is obtained when the amount ofhydrogen adsorbed at low pressures (0.1 MPa) is used.Similarly to the discussion done for the results obtainedat room temperature, the fact that hydrogen adsorptioncapacity at high pressure (4 MPa) does not correlate with
0
1
2
3
4
5
6
0 0.5 1
Vμp (DR, CO2) (cm3/g)
H2
(wt.
%)
4 MPa0.1 MPa
0
1
2
3
4
5
6
0 0.5 1 1.5
Total micropore volume (cm3/g)
H2
(wt.
%)
4 MPa0.1 MPa
Fig. 7. Amount of hydrogen adsorbed at 77 K and different pressures (0.1 and 4 MPa) by activated carbons (open symbols) and carbon nanotubes andnanofibers (closed symbols) versus the total micropore volume (a) and the narrow micropore volume [Vlp(DR, CO2)] (b).
M. Jorda-Beneyto et al. / Carbon 45 (2007) 293–303 299
narrow micropore volume (Vlp(CO2)), can be explainedconsidering the high value of relative pressure (Pr) reachedat this pressure. At 77 K, saturation pressure of hydrogenestimated by Dubinin equation [65] is 7 MPa. Thus, hydro-gen relative pressures at 0.1 MPa and 4 MPa are Pr = 0.014and Pr = 0.57, respectively. Then, at high relative pressures(Pr = 0.57), not only the narrow micropores, but also thewider microporosity has an important contribution to thehydrogen adsorption. Because of that, samples with wideMPSD present upwards deviation in Fig. 7(b) at 4 MPa.For these samples, this upward deviation is much smallerat low pressures (0.1 MPa), since the narrow microporeswill contribute in a larger extent to the hydrogenadsorption.
As observed in Fig. 7, the results obtained for carbonnanofibers and carbon nanotubes (solid symbols) fit inthe tendencies obtained for activated carbons, showing thathydrogen adsorption depends on the porosity of the sampleand does not depend on its structure.
From these results, it can be concluded that hydrogenadsorption at 77 K and at pressures up to 4 MPa requiresporous solids with a very high micropore volume, such aschemically activated carbons. At these adsorption condi-tions, micropore size distribution does not play an impor-tant role, contrary to what happened at room temperature.
3.4. Total hydrogen storage at 298 K and 77 K
The results presented so far, correspond to the excessadsorption of hydrogen on different solids at different tem-peratures and pressures. However, a more importantparameter from an application point of view, which israrely found in the literature, is the total storage capacity.The storage capacity in a specified volume filled with aphysisorption-based hydrogen carrier is the sum of thecapacity due to adsorption on the solid surface and the vol-umetric capacity due to compression in the void space [46].
The void space per unit volume was assessed using thesame approach than in previous studies on methane stor-age [55,68]: Vs = 1 � qp/qs, where qp is the packing densityand qs is the skeleton density of adsorbent. The packingdensity of the materials was measured as described in theexperimental section. The skeleton density of the activatedcarbons was determined by the helium expansion method.
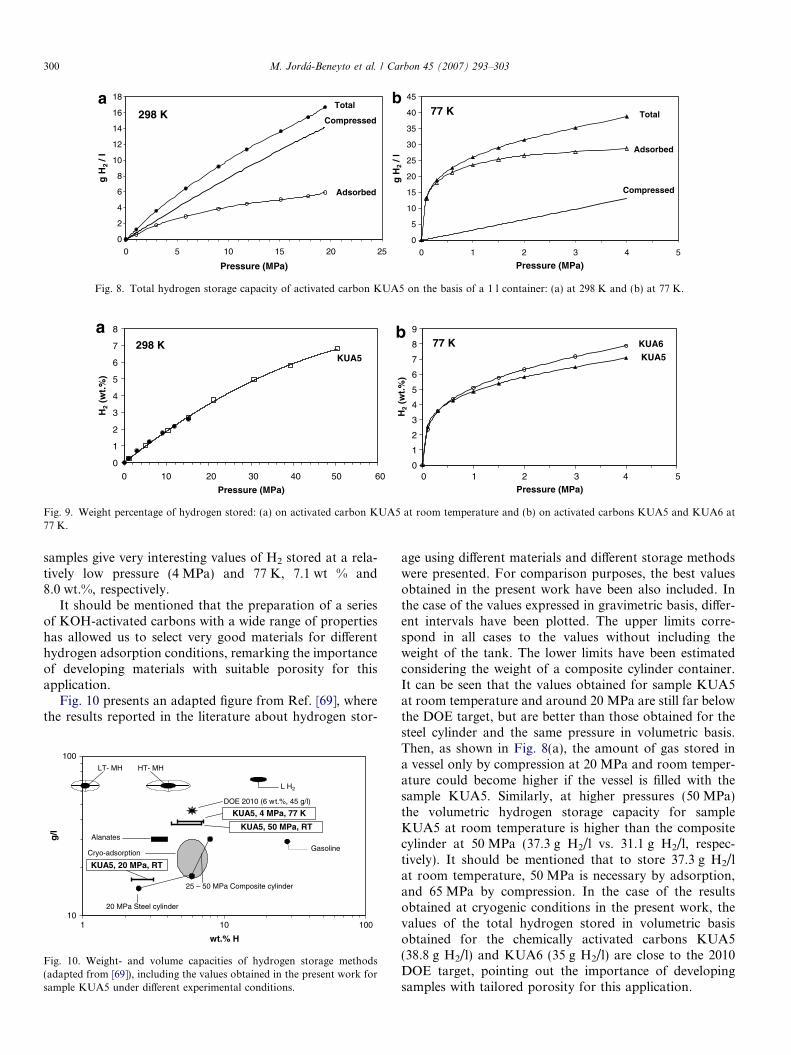
Fig. 8 includes the total hydrogen storage capacity ofactivated carbon KUA5 at 298 K (Fig. 8(a)) and at 77 K(Fig. 8(b)) on the basis of a 1 l container. These figures alsoinclude the amount of hydrogen stored just by compressionand the excess adsorption data, based on the weight of car-bon in the 1 l container (the packing density of activatedcarbon KUA5 is 0.5 g/cm3).
It can be seen that storage of hydrogen at room temper-ature and 77 K achieves considerable enhancement dueto both adsorption and compression. The total storagecapacity of a 1 l container filled with carbon powderKUA5 is 16.7 g H2 at 19.5 MPa and 298 K and 38.8 g H2
at 4 MPa and 77 K.Fig. 9(a) contains the weight percentage of total H2
stored on activated carbon KUA5 at 298 K assessed fromthe hydrogen adsorption isotherms measured up to20 MPa with the experimental set-up developed in ourlaboratory, and the hydrogen isotherm up to 50 MPameasured using the same experimental set-up than in previ-ous study [39]. It should be remarked the good overlap-ping of the isotherms obtained with both experimentalsystems.
The hydrogen storage capacity of sample KUA5 is3.2 wt.% and 6.8 wt.% at 20 MPa and 50 MPa, respec-tively. Very high pressures (50 MPa) are required to almostreach the DOE target at room temperature with a KOH-activated carbon. Fig. 9(b) presents the weight percentageof total H2 stored on activated carbon KUA5 and alsofor sample KUA6 (chemically activated carbon with thehighest porosity development) at 77 K, showing that these
0
2
4
6
8
10
12
14
16
18
0 5 10 15 20 25
Pressure (MPa)
g H
2 / l
Adsorbed
Total298 K
Compressed
0
5
10
15
20
25
30
35
40
45
0 1 2 3 4 5
Pressure (MPa)
g H
2 / l
Adsorbed
Total77 K
Compressed
Fig. 8. Total hydrogen storage capacity of activated carbon KUA5 on the basis of a 1 l container: (a) at 298 K and (b) at 77 K.
0
1
2
3
4
5
6
7
8
0 10 20 30 40 50 60
Pressure (MPa)
H2
(wt.
%)
KUA5298 K
0
1
2
3
4
5
6
7
8
9
Pressure (MPa)
H2
(wt.
%)
KUA6KUA5
77 K
0 1 2 3 4 5
Fig. 9. Weight percentage of hydrogen stored: (a) on activated carbon KUA5 at room temperature and (b) on activated carbons KUA5 and KUA6 at77 K.
300 M. Jorda-Beneyto et al. / Carbon 45 (2007) 293–303
samples give very interesting values of H2 stored at a rela-tively low pressure (4 MPa) and 77 K, 7.1 wt % and8.0 wt.%, respectively.
It should be mentioned that the preparation of a seriesof KOH-activated carbons with a wide range of propertieshas allowed us to select very good materials for differenthydrogen adsorption conditions, remarking the importanceof developing materials with suitable porosity for thisapplication.
Fig. 10 presents an adapted figure from Ref. [69], wherethe results reported in the literature about hydrogen stor-
10
100
1 10 100
wt.% H
g/l
25 – 50 MPa Composite cylinder
20 MPa Steel cylinder
Alanates
LT- MH HT- MH
L H2
Gasoline
DOE 2010 (6 wt.%, 45 g/l)
KUA5, 20 MPa, RT
KUA5, 50 MPa, RT
KUA5, 4 MPa, 77 K
Cryo-adsorption
Fig. 10. Weight- and volume capacities of hydrogen storage methods(adapted from [69]), including the values obtained in the present work forsample KUA5 under different experimental conditions.
age using different materials and different storage methodswere presented. For comparison purposes, the best valuesobtained in the present work have been also included. Inthe case of the values expressed in gravimetric basis, differ-ent intervals have been plotted. The upper limits corre-spond in all cases to the values without including theweight of the tank. The lower limits have been estimatedconsidering the weight of a composite cylinder container.It can be seen that the values obtained for sample KUA5at room temperature and around 20 MPa are still far belowthe DOE target, but are better than those obtained for thesteel cylinder and the same pressure in volumetric basis.Then, as shown in Fig. 8(a), the amount of gas stored ina vessel only by compression at 20 MPa and room temper-ature could become higher if the vessel is filled with thesample KUA5. Similarly, at higher pressures (50 MPa)the volumetric hydrogen storage capacity for sampleKUA5 at room temperature is higher than the compositecylinder at 50 MPa (37.3 g H2/l vs. 31.1 g H2/l, respec-tively). It should be mentioned that to store 37.3 g H2/lat room temperature, 50 MPa is necessary by adsorption,and 65 MPa by compression. In the case of the resultsobtained at cryogenic conditions in the present work, thevalues of the total hydrogen stored in volumetric basisobtained for the chemically activated carbons KUA5(38.8 g H2/l) and KUA6 (35 g H2/l) are close to the 2010DOE target, pointing out the importance of developingsamples with tailored porosity for this application.
M. Jorda-Beneyto et al. / Carbon 45 (2007) 293–303 301
4. Conclusions
In the present work, a series of chemically activated car-bons with a wide range of properties (specific surface areaand micropore size distribution) has been prepared for thestudy of hydrogen adsorption at different temperatures(298 K and 77 K) and high pressures. In addition, othertypes of carbon materials, such as activated carbon fibers,carbon nanotubes and carbon nanofibers have been alsoincluded, in order to analyze the effect of structure inhydrogen adsorption capacity. The preparation of this ser-ies of carbon materials has allowed us to analyze how thedifferent properties of the materials affect to the hydrogenadsorption capacity and also to select good samples for dif-ferent hydrogen adsorption conditions, remarking theimportance of developing materials with suitable porosityfor this application.
Moreover, this paper provides an interpretation of thehydrogen adsorption data at high pressures and differenttemperatures by applying the fundamentals of adsorptionat supercritical conditions. In this way, the apparent dis-crepancies in the correlations between hydrogen adsorptioncapacity and porosity found in the literature can beexplained.
The results obtained at 298 K for this series of samplesindicate that the hydrogen adsorption capacities up to20 MPa and 50 MPa depend on both micropore volumeand micropore size distribution. The results obtained withcarbon nanofibers and nanotubes fit into the tendenciesobtained with the other type of carbon materials, indicat-ing that hydrogen adsorption on these materials is also tak-ing place by a physisorption process. At these adsorptionconditions (298 K and 20 MPa), the sample with the besthydrogen adsorption capacity is a chemically activated car-bon (sample KUA5). This sample has both high microporevolume and narrow micropore size distribution, what isneeded for the adsorption of high amount of hydrogen atroom temperature and 20 MPa. This sample has beenselected to measure hydrogen adsorption capacity up to50 MPa, having a much higher adsorption capacity(2.7 wt.%) than the samples of the previous study [39].The total hydrogen stored on activated carbon KUA5 at298 K is 16.7 g H2/l (3.2 wt.%) and 37.2 g H2/l (6.8 wt.%)at 20 MPa and 50 MPa, respectively. These high valuesobtained remark the importance of developing materialswith suitable porosity for this application.
Hydrogen adsorption capacity at 77 K and at pressuresup to 4 MPa follows a good correlation with the totalmicropore volume for all the samples, including carbonnanofibers and carbon nanotubes. These results indicatethat hydrogen adsorption depends on the porosity of thesample and does not depend on its structure. The best valueof total hydrogen storage capacity obtained in the presentwork at 77 K and 4 MPa (38.8 g H2/l or 8 wt.%) corre-sponds to the chemically activated carbon with the highestspecific surface area (sample KUA6). The results obtainedfor the series of carbon materials point out that, at these
adsorption conditions, micropore size distribution doesnot play an important role, contrary to what happened atroom temperature. At cryogenic conditions is possible stor-age high amounts hydrogen at moderate pressures.
It has been shown that highly activated carbons have agreat potential as carriers of hydrogen. On the other hand,carbon nanotubes and carbon nanofibers are not promisingcarriers of hydrogen from an application point of view,contrary to what is concluded from many results publishedin the literature.
The comparison of the results obtained in the presentwork with those found in the literature, remarks the inter-esting results obtained using chemically activated carbons,especially at cryogenic conditions, which points out theimportance of developing samples with tailored porosityfor this application.
Acknowledgements
Authors thank financial support from MCYT (ProjectPPQ2003-03884), Generalitat Valenciana (ProjectGV04A-608) and EU (HyTRAIN MC RTN-512443).F. Suarez-Garcıa thanks MCYT for his contract ‘‘Juande la Cierva’’ and M. Jorda-Beneyto thanks MEC for herPh.D. fellowship. Authors also thank Dr. F. Lamari-Darkrim for the measurement of hydrogen isotherm onsample KUA5 up to 50 MPa.
References
[1] Nicoletti G. The hydrogen option for energy - a review of technical,environmental and economic-aspects. Int J Hydrogen Energy1995;20(10):759–65.
[2] Berry GD, Aceves SM. Onboard storage alternatives for hydrogenvehicles. Energy Fuels 1998;12(1):49–55.
[3] Seayad AM, Antonelli DM. Recent advances in hydrogen storage inmetal-containing inorganic nanostructures and related materials. AdvMater 2004;16(9–10):765–77.
[4] Schlapbach L, Zuttel A. Hydrogen-storage materials for mobileapplications. Nature 2001;414(6861):353–8.
[5] Dillon AC, Jones KM, Bekkedahl TA, Kiang CH, Bethune DS,Heben MJ. Storage of hydrogen in single-walled carbon nanotubes.Nature 1997;386(6623):377–9.
[6] Dillon AC, Heben MJ. Hydrogen storage using carbon adsorbents:past, present and future. Appl Phys A – Mater Sci Process2001;72(2):133–42.
[7] Anson A, Callejas MA, Benito AM, Maser WK, Izquierdo MT,Rubio B, et al. Hydrogen adsorption studies on single wall carbonnanotubes. Carbon 2004;42(7):1243–8.
[8] Ye Y, Ahn CC, Witham C, Fultz B, Liu J, Rinzler AG, et al.Hydrogen adsorption and cohesive energy of single-walled carbonnanotubes. Appl Phys Lett 1999;74(16):2307–9.
[9] Chen P, Wu X, Lin J, Tan KL. High H-2 uptake by alkali-dopedcarbon nanotubes under ambient pressure and moderate tempera-tures. Science 1999;285(5424):91–3.
[10] Challet S, Azais P, Pellenq RJM, Isnard O, Soubeyroux JL, DuclauxL. Hydrogen adsorption in microporous alkali-doped carbons –(activated carbon and single wall nanotubes). J Phys Chem Solids2004;65(2–3):541–4.
[11] Li XS, Zhu HW, Ci LJ, Xu CL, Mao ZQ, Wei BQ, et al. Hydrogenuptake by graphitized multi-walled carbon nanotubes under moder-ate pressure and at room temperature. Carbon 2001;39(13):2077–9.
302 M. Jorda-Beneyto et al. / Carbon 45 (2007) 293–303
[12] Hwang JY, Lee SH, Sim KS, Kim JW. Synthesis and hydrogenstorage of carbon nanofibers. Synth Metals 2002;126(1):81–5.
[13] Lupu D, Biris AR, Misan I, Jianu A, Holzhuter G, Burkel E.Hydrogen uptake by carbon nanofibers catalyzed by palladium. Int JHydrogen Energy 2004;29(1):97–102.
[14] Shaijumon MM, Ramaprabhu S. Studies of yield and nature ofcarbon nanostructures synthesized by pyrolysis of ferrocene andhydrogen adsorption studies of carbon nanotubes. Int J HydrogenEnergy 2005;30(3):311–7.
[15] Yang RT. Hydrogen storage by alkali-doped carbon nanotubes-revisited. Carbon 2000;38(4):623–6.
[16] Liu C, Fan YY, Liu M, Cong HT, Cheng HM, Dresselhaus MS.Hydrogen storage in single-walled carbon nanotubes at roomtemperature. Science 1999;286(5442):1127–9.
[17] Ci LJ, Zhu HW, Wei BQ, Xu CL, Wu DH. Annealing amorphouscarbon nanotubes for their application in hydrogen storage. ApplSurf Sci 2003;205(1–4):39–43.
[18] Callejas MA, Anson A, Benito AM, Maser W, Fierro JLG, SanjuanML, et al. Enhanced hydrogen adsorption on single-wall carbonnanotubes by sample reduction. Mater Sci Eng B – Solid State MaterAdv Technol 2004;108(1–2):120–3.
[19] Huang WZ, Zhang XB, Tu JP, Kong FZ, Ma JX, Liu F, et al. Theeffect of pretreatments on hydrogen adsorption of multi-walledcarbon nanotubes. Mater Chem Phys 2003;78(1):144–8.
[20] Zhu HW, Li CH, Li XS, Xu CL, Mao ZQ, Liang J, et al. Hydrogenstorage by platelet-carbon fibers at room temperature. Mater Lett2002;57(1):32–5.
[21] Hou PX, Xu ST, Ying Z, Yang QH, Liu C, Cheng HM. Hydrogenadsorption/desorption behavior of multi-walled carbon nanotubeswith different diameters. Carbon 2003;41(13):2471–6.
[22] Cheng HM, Liu C, Fan YY, Li F, Su G, Cong HT, et al. Synthesisand hydrogen storage of carbon nanofibers and single-walled carbonnanotubes. Zeitschrift fur Metallkunde 2000;91(4):306–10.
[23] Zhu HW, Chen A, Mao ZQ, Xu CL, Xiao X, Wei BQ, et al. Theeffect of surface treatments on hydrogen storage of carbon nanotubes.J Mater Sci Lett 2000;19(14):1237–9.
[24] Browning DJ, Gerrard ML, Lakeman JB, Mellor IM, Mortimer RJ,Turpin MC. Studies into the storage of hydrogen in carbonnanofibers: proposal of a possible reaction mechanism. Nano Lett2002;2(3):201–5.
[25] Bai XD, Zhong DY, Zhang GY, Ma XC, Liu S, Wang EG, et al.Hydrogen storage in carbon nitride nanobells. Appl Phys Lett2001;79(10):1552–4.
[26] Wang QK, Zhu CC, Liu WH, Wu T. Hydrogen storage by carbonnanotube and their films under ambient pressure. Int J HydrogenEnergy 2002;27(5):497–500.
[27] Gupta BK, Srivastava ON. Synthesis and hydrogenation behaviourof graphitic nanofibres. Int J Hydrogen Energy 2000;25(9):825–30.
[28] Fan YY, Liao B, Liu M, Wei YL, Lu MQ, Cheng HM. Hydrogenuptake in vapor-grown carbon nanofibers. Carbon 1999;37(10):1649–52.
[29] Gupta BK, Tiwari RS, Srivastava ON. Studies on synthesis andhydrogenation behaviour of graphitic nanofibres prepared throughpalladium catalyst assisted thermal cracking of acetylene. J AlloysCompd 2004;381(1–2):301–8.
[30] Chen P, Wu X, Lin J, Tan KL. High H2 uptake by alkali-dopedcarbon nanotubes under ambient pressure and moderate tempera-tures. Science 1999;285(5424):91–3.
[31] Nijkamp MG, Raaymakers JEMJ, van Dillen AJ, de Jong KP.Hydrogen storage using physisorption – materials demands. ApplPhys A – Mater Sci Process 2001;72(5):619–23.
[32] Takagi H, Hatori H, Soneda Y, Yoshizawa N, Yamada Y.Adsorptive hydrogen storage in carbon and porous materials. MaterSci Eng B – Solid State Mater Adv Technol 2004;108(1–2):143–7.
[33] Chambers A, Park C, Baker RTK, Rodriguez NM. Hydrogen storagein graphite nanofibers. J Phys Chem B 1998;102(22):4253–6.
[34] Hirscher M, Becher M, Haluska M, Quintel A, Skakalova V, ChoiYM, et al. Hydrogen storage in carbon nanostructures. J AlloysCompd 2002:330654–8.
[35] Blackman JM, Patrick JW, Snape CE. An accurate volumetricdifferential pressure method for the determination of hydrogenstorage capacity at high pressures in carbon materials. Carbon2006;44(5):918–27.
[36] Zhou L, Zhou YP, Sun Y. A comparative study of hydrogenadsorption on superactivated carbon versus carbon nanotubes. Int JHydrogen Energy 2004;29(5):475–9.
[37] Texier-Mandoki N, Dentzer J, Piquero T, Saadallah S, David P, Vix-Guterl C. Hydrogen storage in activated carbon materials: role of thenanoporous texture. Carbon 2004;42(12–13):2744–7.
[38] Rzepka M, Lamp P, de la Casa-Lillo M. Physisorption of hydrogenon microporous carbon and carbon nanotubes. J Phys Chem B1998;102(52):10894–8.
[39] de la Casa-Lillo M, Lamari-Darkrim F, Cazorla-Amoros D, Linares-Solano A. Hydrogen storage in activated carbons and activatedcarbon fibers. J Phys Chem B 2002;106(42):10930–4.
[40] Parra JB, Ania CO, Arenillas A, Rubiera F, Pis JJ. High value carbonmaterials from PET recycling. Appl Surf Sci 2004;238(1–4):304–8.
[41] Parra JB, Ania CO, Arenillas A, Rubiera F, Palacios JM, Pis JJ.Textural development and hydrogen adsorption of carbon materialsfrom PET waste. J Alloys Compd 2004;379(1–2):280–9.
[42] Terres E, Panella B, Hayashi T, Kim YA, Endo M, Dominguez JM,et al. Hydrogen storage in spherical nanoporous carbons. Chem PhysLett 2005;403(4–6):363–6.
[43] Furuya Y, Hashishin T, Iwanaga H, Motojima S, Hishikawa Y.Interaction of hydrogen with carbon coils at low temperature. Carbon2004;42(2):331–5.
[44] Shindo K, Kondo T, Sakurai Y. Hydrogen physisorption capacitiesof mechanically milled activated carbon powders in a H2 atmosphereusing a gravimetric method. J Alloys Compd 2004;379(1–2):252–5.
[45] Zhao XB, Xiao B, Fletcher AJ, Thomas KM. Hydrogen adsorptionon functionalized nanoporous activated carbons. J Phys Chem B2005;109(18):8880–8.
[46] Zhou L, Zhou YP, Sun Y. Enhanced storage of hydrogen at thetemperature of liquid nitrogen. Int J Hydrogen Energy 2004;29(3):319–22.
[47] Poirier E, Chahine R, Benard P, Cossement D, Lafi L, Melancon E.Storage of hydrogen on single-walled carbon nanotubes and othercarbon structures. Appl Phys A – Mater Sci Process 2004;78(7):961–7.
[48] Strobel R, Jorissen L, Schliermann T, Trapp V, Schutz W, Bohm-hammel K, et al. Hydrogen adsorption on carbon materials. J PowerSources 1999;84(2):221–4.
[49] Panella B, Hirscher M, Roth S. Hydrogen adsorption in differentcarbon nanostructures. Carbon 2005;43(10):2209–14.
[50] Gadiou R, Saadallah SE, Piquero T, David P, Parmentier J, Vix-Guterl C. The influence of textural properties on the adsorption ofhydrogen on ordered nanostructured carbons. Microporous Meso-porous Mater 2005;79(1–3):121–8.
[51] Raymundo-Pinero E, Azais P, Cacciaguerra T, Cazorla-Amoros D,Linares-Solano A, Beguin F. KOH and NaOH activation mecha-nisms of multiwalled carbon nanotubes with different structuralorganisation. Carbon 2005;43(4):786–95.
[52] Lozano-Castello D, Lillo-Rodenas MA, Cazorla-Amoros D, Linares-Solano A. Preparation of activated carbons from Spanish anthraciteI. Activation by KOH. Carbon 2001;39(5):741–9.
[53] Lozano-Castello D. Preparacion y Caracterizacion de materialescarbonosos avanzados para la separacion de gases y el almacenam-iento de gases y energıa. Universidad de Alicante, Alicante, Spain,Ph.D. Tesis; 2001.
[54] Alcaniz-Monge J, Cazorla-Amoros D, Linares-Solano A, Yoshida S,Oya A. Effect of the activating gas on tensile strength and porestructure of pitch-based carbon fibres. Carbon 1994;32(7):1277–83.
M. Jorda-Beneyto et al. / Carbon 45 (2007) 293–303 303
[55] Lozano-Castello D, Cazorla-Amoros D, Linares-Solano A, QuinnDF. Influence of pore size distribution on methane storage atrelatively low pressure: preparation of activated carbon with opti-mum pore size. Carbon 2002;40(7):989–1002.
[56] Zhang C, Lu XS, Gu AZ. How to accurately determine the uptake ofhydrogen in carbonaceous materials. Int J Hydrogen Energy2004;29(12):1271–6.
[57] Kiyobayashi T, Takeshita HT, Tanaka H, Takeichi N, Zuttel A,Schlapbach L, Kuriyama N. Hydrogen adsorption in carbonaceousmaterials – how to determine the storage capacity accurately. J AlloysCompd 2002;330:666–9.
[58] Agarwal RK, Schwarz JA. Analysis of high-pressure adsorption ofgases on activated carbon by potential-theory. Carbon 1988;26(6):873–87.
[59] Dubinin MM. The potential theory of adsorption of gases and vaporsfor adsorbents with energetically nonuniform surfaces. Chem Rev1960;60(2):235–41.
[60] Cazorla-Amoros D, Alcaniz-Monge J, Linares-Solano A. Character-ization of activated carbon fibers by CO2 adsorption. Langmuir1996;12(11):2820–4.
[61] Cazorla-Amoros, Alcaniz-Monge J, Casa-Lillo MA, Linares-SolanoA. CO2 as an adsorptive to characterize carbon molecular sieves andactivated carbons. Langmuir 1998;14(16):4589–96.
[62] Rodriguez-Reinoso F, Linares-Solano A. In: Thrower PA, editor.Chemistry and physics of carbon, vol. 21. New York: MarcelDekker; 1989. p. 1–146.
[63] Rouquerol F, Rouquerol J, Sing KWS. Adsorption by powders andporous solids. Principles, methodology and applications. AcademicPress; 1999.
[64] Wang QY, Johnson JK. Molecular simulation of hydrogen adsorp-tion in single-walled carbon nanotubes and idealized carbon slitpores. J Chem Phys 1999;110(1):577–86.
[65] Dubinin MM. In: Cadenhead DA et al., editors. Progress in surfaceand membrane science, vol. 9. New York: Academic Press; 1975. p.1–70.
[66] Quinn DF. Supercritical adsorption of ‘permanent’ gases undercorresponding states on various carbons. Carbon 2002;40(15):2767–73.
[67] Zhou L, Zhou YP, Sun Y. Studies on the mechanism and capacity ofhydrogen uptake by physisorption-based materials. Int J HydrogenEnergy 2006;31(2):259–64.
[68] Lozano-Castello D, Alcaniz-Monge J, de la Casa-Lillo M, Cazorla-Amoros D, Linares-Solano A. Advances in the study of methanestorage in porous carbonaceous materials. Fuel 2002;81(14): 1777–803.
[69] Yartys VA, Lototsky MV. Hydrogen materials science and chemistryof carbon nanomaterials. Kluwer Publishers; 2004.
Related Documents


