NREL is a national laboratory of the U.S. Department of Energy Office of Energy Efficiency & Renewable Energy Operated by the Alliance for Sustainable Energy, LLC This report is available at no cost from the National Renewable Energy Laboratory (NREL) at www.nrel.gov/publications. Contract No. DE-AC36-08GO28308 Hydrogen Station Cost Estimates Comparing Hydrogen Station Cost Calculator Results with other Recent Estimates M. Melaina and M. Penev National Renewable Energy Laboratory Technical Report NREL/TP-5400-56412 September 2013

Welcome message from author
This document is posted to help you gain knowledge. Please leave a comment to let me know what you think about it! Share it to your friends and learn new things together.
Transcript
NREL is a national laboratory of the U.S. Department of Energy Office of Energy Efficiency & Renewable Energy Operated by the Alliance for Sustainable Energy, LLC This report is available at no cost from the National Renewable Energy Laboratory (NREL) at www.nrel.gov/publications.
Contract No. DE-AC36-08GO28308
Hydrogen Station Cost Estimates Comparing Hydrogen Station Cost Calculator Results with other Recent Estimates M. Melaina and M. Penev National Renewable Energy Laboratory
Technical Report NREL/TP-5400-56412 September 2013
NREL is a national laboratory of the U.S. Department of Energy Office of Energy Efficiency & Renewable Energy Operated by the Alliance for Sustainable Energy, LLC This report is available at no cost from the National Renewable Energy Laboratory (NREL) at www.nrel.gov/publications.
Contract No. DE-AC36-08GO28308
National Renewable Energy Laboratory 15013 Denver West Parkway Golden, CO 80401 303-275-3000 • www.nrel.gov
Hydrogen Station Cost Estimates Comparing Hydrogen Station Cost Calculator Results with other Recent Estimates M. Melaina and M. Penev National Renewable Energy Laboratory
Prepared under Task No. HT12.2015
Technical Report NREL/TP-5400-56412 September 2013
NOTICE
This report was prepared as an account of work sponsored by an agency of the United States government. Neither the United States government nor any agency thereof, nor any of their employees, makes any warranty, express or implied, or assumes any legal liability or responsibility for the accuracy, completeness, or usefulness of any information, apparatus, product, or process disclosed, or represents that its use would not infringe privately owned rights. Reference herein to any specific commercial product, process, or service by trade name, trademark, manufacturer, or otherwise does not necessarily constitute or imply its endorsement, recommendation, or favoring by the United States government or any agency thereof. The views and opinions of authors expressed herein do not necessarily state or reflect those of the United States government or any agency thereof.
This report is available at no cost from the National Renewable Energy Laboratory (NREL) at www.nrel.gov/publications.
Available electronically at http://www.osti.gov/bridge
Available for a processing fee to U.S. Department of Energy and its contractors, in paper, from:
U.S. Department of Energy Office of Scientific and Technical Information P.O. Box 62 Oak Ridge, TN 37831-0062 phone: 865.576.8401 fax: 865.576.5728 email: mailto:[email protected]
Available for sale to the public, in paper, from:
U.S. Department of Commerce National Technical Information Service 5285 Port Royal Road Springfield, VA 22161 phone: 800.553.6847 fax: 703.605.6900 email: [email protected] online ordering: http://www.ntis.gov/help/ordermethods.aspx
Cover Photos: (left to right) photo by Pat Corkery, NREL 16416, photo from SunEdison, NREL 17423, photo by Pat Corkery, NREL 16560, photo by Dennis Schroeder, NREL 17613, photo by Dean Armstrong, NREL 17436, photo by Pat Corkery, NREL 17721.
Printed on paper containing at least 50% wastepaper, including 10% post consumer waste.
iii
Acknowledgements Funding for this report came from the U.S. Department of Energy’s Fuel Cell Technologies Office within the Office of Energy Efficiency and Renewable Energy. Guidance on the design of the Hydrogen Station Cost Calculator (HSCC) was provided by expert stakeholders who participated in the Hydrogen Infrastructure Market Readiness workshop held in National Harbor, Maryland, on February 16–17, 2011. In addition, key cost results presented in this report were provided by a select number of expert stakeholders who devoted significant time and attention to completing the HSCC.
Sam Jaffe and Casey Talon of IDC Energy Insights administered implementation of the HSCC. This included compiling and aggregating results received from expert stakeholders, as well as serving as a communication interface between National Renewable Energy Laboratory staff and responding stakeholders to clarify the relevance of the data provided while maintaining the anonymity of respondents. Stakeholder input on opportunities to reduce hydrogen station costs collected during the Hydrogen Infrastructure Market Readiness workshop and a description of the process of administering the HSCC can be found in the workshop proceedings (Melaina, Steward et al. 2012).
Earlier versions of this report benefited from comments and suggestions, and in some cases additional data, provided by several reviewers. These included Dr. Joan Ogden from the Institute of Transportation Studies at the University of California at Davis, Steve Eckhardt from The Linde Group, Tobias Muench and Jean Baronas from the California Energy Commission, and Tyson Eckerle and Remy Garderet from Energy Independence Now. Additional valuable review comments were received from Mark Ruth of the National Renewable Energy Laboratory. Amgad Elgowainy of Argonne National Laboratory provided cost data on delivery truck stations from the updated H2A Delivery Scenario Analysis (HDSAM) model. While many revisions were made in response to reviewer comments and suggestions, it was not possible to fully address all suggestions for improvement due to time and resource constraints. Any remaining errors or shortcomings are the responsibility of the authors.
This report is available at no cost from the National Renewable Energy Laboratory (NREL) at www.nrel.gov/publications.

iv
Acronyms and Abbreviations APCI Air Products and Chemicals, Inc. ARFVTP Alternative and Renewable Fuels and Vehicle Technologies Program CaFCP California Fuel Cell Partnership CEC California Energy Commission CSD compression storage & dispensing DOE U.S. Department of Energy EC Early Commercial (referring to station classification) EPA U.S. Environmental Protection Agency FCEV fuel cell electric vehicle GH2 gaseous hydrogen H2A Hydrogen Analysis (model) HDSAM H2A Delivery Scenario Analysis Model (model) HSCC Hydrogen Station Cost Calculator IDC International Data Corporation kg kilogram LH2 liquid hydrogen Linde The Linde Group LS Larger Stations (referring to station classification) MMBtu million British thermal units MS More Stations (referring to station classification) NREL National Renewable Energy Laboratory RFP request for proposals SMR steam methane reformer SOTA state of the art (referring to station classification) TAR Interim Joint Technical Assessment Report UCD University of California at Davis
This report is available at no cost from the National Renewable Energy Laboratory (NREL) at www.nrel.gov/publications.
v
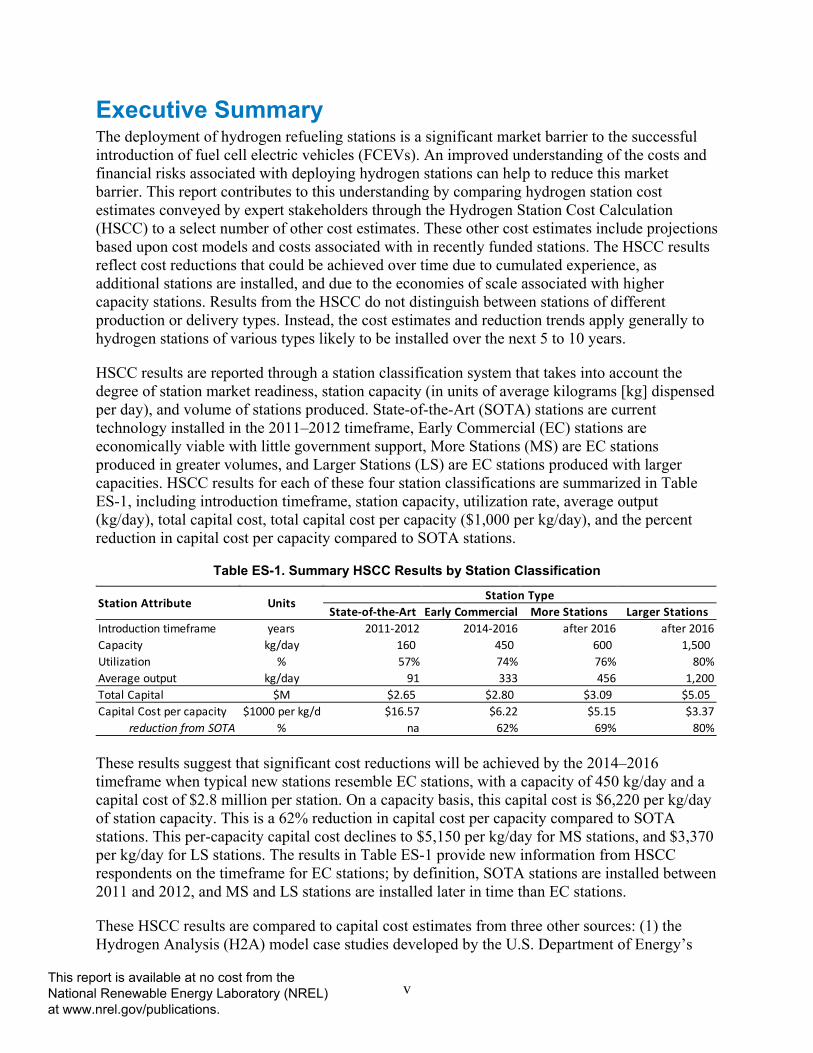
Executive Summary The deployment of hydrogen refueling stations is a significant market barrier to the successful introduction of fuel cell electric vehicles (FCEVs). An improved understanding of the costs and financial risks associated with deploying hydrogen stations can help to reduce this market barrier. This report contributes to this understanding by comparing hydrogen station cost estimates conveyed by expert stakeholders through the Hydrogen Station Cost Calculation (HSCC) to a select number of other cost estimates. These other cost estimates include projections based upon cost models and costs associated with in recently funded stations. The HSCC results reflect cost reductions that could be achieved over time due to cumulated experience, as additional stations are installed, and due to the economies of scale associated with higher capacity stations. Results from the HSCC do not distinguish between stations of different production or delivery types. Instead, the cost estimates and reduction trends apply generally to hydrogen stations of various types likely to be installed over the next 5 to 10 years.
HSCC results are reported through a station classification system that takes into account the degree of station market readiness, station capacity (in units of average kilograms [kg] dispensed per day), and volume of stations produced. State-of-the-Art (SOTA) stations are current technology installed in the 2011–2012 timeframe, Early Commercial (EC) stations are economically viable with little government support, More Stations (MS) are EC stations produced in greater volumes, and Larger Stations (LS) are EC stations produced with larger capacities. HSCC results for each of these four station classifications are summarized in Table ES-1, including introduction timeframe, station capacity, utilization rate, average output (kg/day), total capital cost, total capital cost per capacity ($1,000 per kg/day), and the percent reduction in capital cost per capacity compared to SOTA stations.
Table ES-1. Summary HSCC Results by Station Classification
These results suggest that significant cost reductions will be achieved by the 2014–2016 timeframe when typical new stations resemble EC stations, with a capacity of 450 kg/day and a capital cost of $2.8 million per station. On a capacity basis, this capital cost is $6,220 per kg/day of station capacity. This is a 62% reduction in capital cost per capacity compared to SOTA stations. This per-capacity capital cost declines to $5,150 per kg/day for MS stations, and $3,370 per kg/day for LS stations. The results in Table ES-1 provide new information from HSCC respondents on the timeframe for EC stations; by definition, SOTA stations are installed between 2011 and 2012, and MS and LS stations are installed later in time than EC stations.
These HSCC results are compared to capital cost estimates from three other sources: (1) the Hydrogen Analysis (H2A) model case studies developed by the U.S. Department of Energy’s
State-of-the-Art Early Commercial More Stations Larger StationsIntroduction timeframe years 2011-2012 2014-2016 after 2016 after 2016Capacity kg/day 160 450 600 1,500 Utilization % 57% 74% 76% 80%Average output kg/day 91 333 456 1,200Total Capital $M $2.65 $2.80 $3.09 $5.05Capital Cost per capacity $1000 per kg/d $16.57 $6.22 $5.15 $3.37
reduction from SOTA % na 62% 69% 80%
Station TypeUnitsStation Attribute
This report is available at no cost from the National Renewable Energy Laboratory (NREL) at www.nrel.gov/publications.
vi
Fuel Cell Technologies Office, (2) cost estimates reported in studies completed by researchers at the University of California at Davis, and (3) cost estimates associated with hydrogen stations recently installed or funded in California. Comparisons suggest that cost reduction trends from the HSCC align well with other cost estimates in terms of both anticipated installation year and station capacity. Alignment with cost estimates for specific station types (e.g., onsite production stations or truck delivery stations) suggests that the HSCC cost reduction trends are a reasonable representation of aggregate and generic station costs for an evolving network of hydrogen stations. This result is highlighted through a simulation of a California station network expansion scenario that integrates the influences of learning and experience, station coverage requirements, and economies of scale.
Though HSCC results may capture generic station network cost trends, several important considerations must be taken into account to understand investment risks and opportunities associated with specific station configurations and station network deployment strategies. These considerations include, but are not limited to, the following:
• To ensure convenient refueling availability for early adopters of hydrogen FCEVs, a balance must be achieved between geographic coverage provided by installing multiple stations across broad market areas and cost reductions due to the economies of scale of larger stations.
• Some station and delivery configurations may be more effective at providing coverage at relatively low cost or low financial risk, while other configurations may be more conducive to achieving economies of scale at particular station locations with high local demand potential.
• The station capacity metric used as the basis for capital costs in the present report, a simple kilogram-per-day metric, does not necessarily capture the value of high station throughput during peak demand hours. Some potential station locations in a given market area will benefit more than others from high hourly throughput capability.
• Total station network capital costs could be reduced by leveraging infrastructure investments made to support non-light-duty vehicle markets, such as onsite hydrogen production or truck delivery for fuel cell forklifts used in warehouses or fuel cell ground equipment at airports.
Considering these factors and limitations, the HSCC results are a reasonable representation of hydrogen station capital costs in the near term and can be relied upon as a basis for general cost simulations of early hydrogen infrastructure development. Cost estimation models will need to be updated periodically as more hydrogen stations are installed over time. Ideally, these updates will account for costs associated with distinct station technologies, costs associated with station upgrades or relocation, costs associated with hourly throughput capability, operation and maintenance costs, and other metrics relevant to stakeholder investment risk and early market infrastructure expansion dynamics.
This report is available at no cost from the National Renewable Energy Laboratory (NREL) at www.nrel.gov/publications.

vii
Table of Contents List of Figures .......................................................................................................................................... viii List of Tables .............................................................................................................................................. ix 1 Hydrogen Station Capital Cost Estimates ......................................................................................... 1 2 Results from the Hydrogen Station Cost Calculator (HSCC) ........................................................... 3 3 Comparisons with Other Recent Cost Estimates .............................................................................. 9
3.1 Hydrogen Analysis Model Case Studies (2012) .............................................................................. 9 3.2 UCD Transition Analysis Study and Recent Updates ................................................................... 15 3.3 Recent Hydrogen Station Installations and Estimates in California (2009–2013) ......................... 21 3.4 Comparing Cost Estimates ............................................................................................................. 25
4 Average Station Network Costs: Simulating a California Rollout ................................................. 28 5 Summary and Conclusions ............................................................................................................... 32 6 References .......................................................................................................................................... 33
This report is available at no cost from the National Renewable Energy Laboratory (NREL) at www.nrel.gov/publications.
viii
List of Figures Figure 1. Percentage of hydrogen station cost calculator respondents by type ................................. 5 Figure 2. Hydrogen station cost calculator capital cost results as a function of FCEVs supported
and station capacity ............................................................................................................................. 7 Figure 3. Total fixed operating costs, including a breakout of rent and maintenance and repairs,
from the HSCC. Vertical dashed lines indicate location of total fixed operating cost values and associated capacities for SOTA, EC, MS and LS station types. ...................................................... 8
Figure 4. Capital costs per capacity for H2A onsite SMR and electrolysis station future case studies from 100- to 2,000-kg/day station capacity (DOE 2012) .................................................... 11
Figure 5. Hydrogen cost breakdown by production and dispensing cost component for H2A onsite SMR and electrolysis station future case studies from 100- to 2,000-kg/day station capacity (DOE 2012) ........................................................................................................................................... 12
Figure 6. Comparison of HSCC costs to total station capital costs from H2A ................................... 13 Figure 7. Comparison of HSCC costs to CSD capital costs from H2A ................................................ 14 Figure 8. Cost comparison of UCD station cost estimates vs. HSCC cost estimates ....................... 20 Figure 9. California station costs on per-capacity basis in relation to HSCC cost estimates .......... 24 Figure 10. Capital costs per capacity for hydrogen stations over time: focus on smaller, high-cost
stations ................................................................................................................................................ 26 Figure 11. Capital costs per capacity as a function of station capacity ............................................. 27 Figure 12. Scenarios of installed capacity and FCEVs supported for HSCC results ........................ 29 Figure 13. Number of stations deployed by (a) station size and (b) total installed capacity by
station size .......................................................................................................................................... 30 Figure 14. Reduction in capital costs per capacity in the California simulation compared to other
cost estimates and cumulative installed station capacity ............................................................. 31
This report is available at no cost from the National Renewable Energy Laboratory (NREL) at www.nrel.gov/publications.
ix
List of Tables Table ES-1. Summary HSCC Results by Station Classification ............................................................. v Table 1. Early Capital Cost Estimates for Onsite SMR and Electrolysis Stations ................................ 2 Table 2. Station Definitions As Stated within the Hydrogen Station Cost Calculator (HSCC) ............ 4 Table 3. Summary Results by Station Classification .............................................................................. 5 Table 4. Capital Costs per Capacity ($/kg/day) for Gaseous (GH2) and Liquid (LH2) Truck Delivery,
Onsite SMR, and Onsite Electrolysis Stations from the H2A Production and HDSAM Models (DOE 2012, DOE 2013) ........................................................................................................................ 10
Table 5. Station Capital Costs per Capacity, by Year and by Type (Ogden and Nicholas 2011) ...... 17 Table 6. Variable and Fixed Operation and Maintenance and Land Rental Costs from UCD
Transition Study (Ogden and Nicholas 2011) .................................................................................. 18 Table 7. Gaseous Truck Delivery Station Capital Costs and Capital Cost per Capacity by Year and
Capacity ............................................................................................................................................... 19 Table 8. Cost Estimates for Early “Demonstration” Hydrogen Stations in California ....................... 22 Table 9. Cost Estimates for Recently Funded Hydrogen Stations in California ................................. 22
This report is available at no cost from the National Renewable Energy Laboratory (NREL) at www.nrel.gov/publications.
1
1 Hydrogen Station Capital Cost Estimates Hydrogen station costs have been estimated in a wide range of studies. This report focuses on results received from the Hydrogen Station Cost Calculator (HSCC) administered in 2011 and conducted in conjunction with an expert stakeholder workshop focusing on hydrogen station cost reduction opportunities (Melaina et al. 2012). Results from the HSCC are compared to three other sources for hydrogen station costs: (1) updated estimates from the Hydrogen Analysis (H2A) case studies, version 3 (U.S. Department of Energy [DOE] 2012), (2) an extensive study from the Institute of Transportation Studies at the University of California Davis (UCD) (Ogden et al. 2010; Ogden and Nicholas 2011) as well as more recent updates from ongoing research (Ogden and Nicholas 2012), and (3) cost information from recent installations in California (U.S. Environmental Protection Agency [EPA] 2010; California Energy Commission [CEC] 2010; CEC 2013a). HSCC results are also examined within the context of station coverage and network growth requirements in a California infrastructure rollout simulation. Examining HSCC results within the context of an evolving station network adds realism to the cost reduction estimates associated with experience and economies of scale.
As a point of reference for the cost estimates discussed below, Table 1 reviews projections from two early cost estimation studies from the 1990s. These estimates, as well as others, were developed before the DOE collected a variety of experts in 2002 to develop the H2A model to establish a common cost estimation framework and financial methodology. As indicated, these early estimates from reports published in 1996 and 1997 (Ogden et al. 1996; Thomas 1997) project long-term station capital costs for onsite steam methane reformer (SMR) stations in the range of $2,000–$3,400 per kilogram (kg) per day of station capacity, with the higher end reflecting the diseconomies of scale associated with smaller stations. Capital costs for electrolysis stations estimated in Thomas (1997) are higher, ranging from $3,300–$5,600 per kg/day of station capacity, again with the smaller station having significant diseconomies of scale. Both studies estimated capital costs assuming mass production of station equipment, in the range of hundreds of units per year. Anticipated years of station deployment were not suggested by the studies, but the approach suggested an asymptote for station capital costs in the range of $2,000–$3,200/kg/day for large stations and $2,000–$5,600/kg/day for small-scale stations. Additional early estimates of hydrogen station costs have been reviewed elsewhere (Basye and Swaminathan 1997; Padró and Putsche 1999; Melaina 2005), and more recent estimates for Europe have been reported by McKinsey (2010) and analyzed by Michalski et al. (2011). This report addresses estimates for the U.S. market with a focus on HSCC results.
The sections below review results from the HSCC (Section 2), compare HSCC results with other cost estimates (Section 3), and review the influence of coverage and network growth on station costs in a California simulation (Section 4). The final section provides a brief summary and conclusions.
This report is available at no cost from the National Renewable Energy Laboratory (NREL) at www.nrel.gov/publications.
2
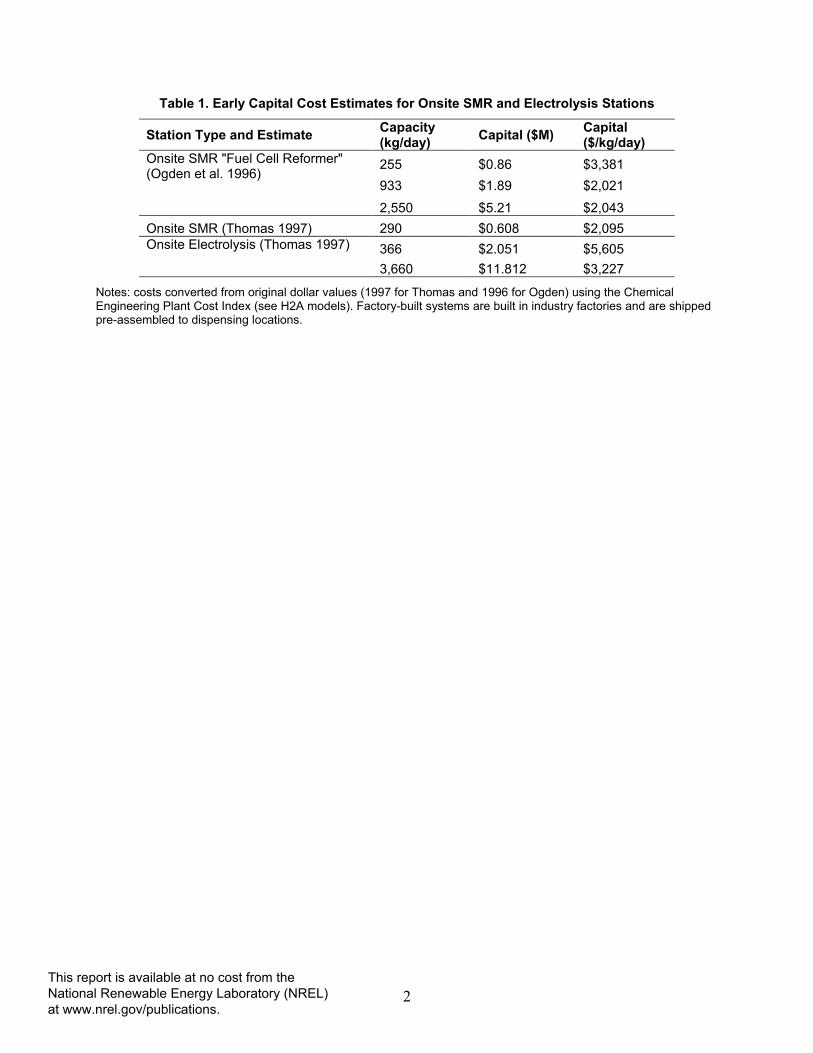
Table 1. Early Capital Cost Estimates for Onsite SMR and Electrolysis Stations
Station Type and Estimate Capacity (kg/day) Capital ($M) Capital
($/kg/day) Onsite SMR "Fuel Cell Reformer" (Ogden et al. 1996)
255 $0.86 $3,381 933 $1.89 $2,021
2,550 $5.21 $2,043 Onsite SMR (Thomas 1997) 290 $0.608 $2,095 Onsite Electrolysis (Thomas 1997) 366 $2.051 $5,605
3,660 $11.812 $3,227
Notes: costs converted from original dollar values (1997 for Thomas and 1996 for Ogden) using the Chemical Engineering Plant Cost Index (see H2A models). Factory-built systems are built in industry factories and are shipped pre-assembled to dispensing locations.
This report is available at no cost from the National Renewable Energy Laboratory (NREL) at www.nrel.gov/publications.

3
2 Results from the Hydrogen Station Cost Calculator (HSCC)
The National Renewable Energy Laboratory’s (NREL’s) Market Readiness study combined information on hydrogen station cost reduction opportunities from two sources: (1) the Hydrogen Infrastructure Market Readiness workshop held February 16–17, 2011, at the Gaylord National Hotel, National Harbor, Maryland; and (2) station cost estimates from the HSCC, administered as a quantitative follow-up activity to the workshop. The review in the present report focuses on the quantitative cost data received through the HSCC and comparison of these estimates to other studies. Stakeholder feedback from the Market Readiness workshop is reviewed in the workshop proceedings, along with preliminary cost reduction estimation results from the HSCC (Melaina et al. 2012). The HSCC was designed by NREL and IDC Energy Insights based upon stakeholder input resulting from the Market Readiness workshop. It was administered by IDC Energy Insights and provided anonymous, weighted, aggregate cost estimates for four types of hydrogen stations reflecting distinct levels of technology readiness. A total of 11 stakeholders provided cost data through the HSCC.
Over 60 attendees participated in the Market Readiness workshop and provided detailed descriptions of station cost reduction opportunities, as well as suggesting action items to pursue to achieve these cost reductions (Melaina et al. 2012). This feedback provides qualitative support and a descriptive context for the quantitative cost reductions reflected in the HSCC results. Eight general and high-priority cost reduction opportunities were identified during the workshop, summarized within four categories:
REDUCE STATION COMPONENT COSTS
1. Expand and enhance supply chains for production of high-performing, lower-cost parts
2. Reduce cost of hydrogen compression
3. Develop high-pressure hydrogen delivery and storage components
STATION DESIGNS
4. Develop “standard” station designs
5. Harmonize/standardize dispensing equipment specifications
PERMITTING PROCESS
6. Develop “type approvals” for use in permitting
7. Improve information and training available to safety and code officials
ANALYSIS AND INFORMATION SHARING
8. Develop mechanisms for planning station rollouts and sharing early market information.
Based upon feedback from Market Readiness workshop participants, four station classifications or types were defined to guide and focus expert responses within the HSCC. The descriptions of each station type, as provided within the HSCC, are indicated in Table 2. The HSCC was distributed to a select list of organizations with direct experience with hydrogen station projects.
This report is available at no cost from the National Renewable Energy Laboratory (NREL) at www.nrel.gov/publications.

4
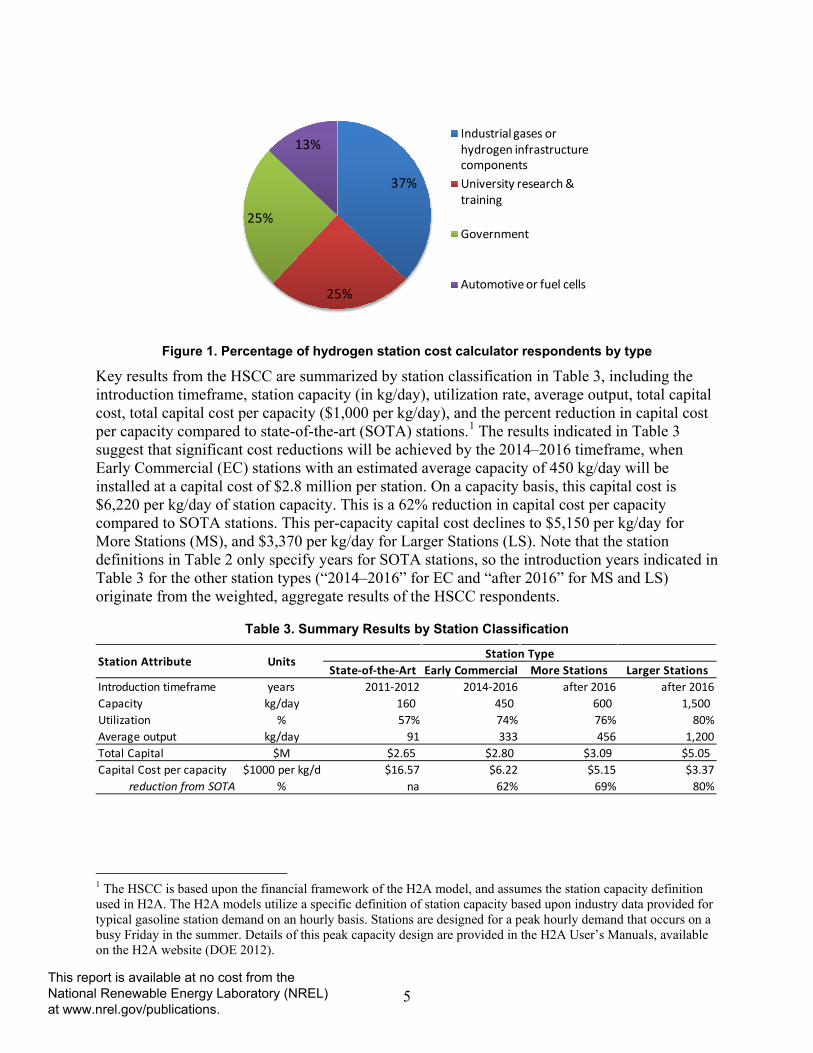
Responses were received from 11 stakeholders, shown by type in Figure 1. IDC Energy Insights administered the collection of responses from these stakeholders and conveyed the aggregated, weighted, anonymous results to NREL staff. IDC Energy Insights weighted responses based upon the historical experience of each respondent with the installation of hydrogen stations, thereby giving greater weight to respondents with more extensive experience.
Table 2. Station Definitions As Stated within the Hydrogen Station Cost Calculator (HSCC)
1. State-of-the-Art Stations (SOTA). Newly installed hydrogen stations with the following attributes:
• The stations would be installed and operational within the 2011–2012 timeframe.
• The stations would include the most recent generation of major components, but would not necessarily include novel or “demonstration” components that have not been previously tested in the field.
• The stations would be sized to meet hydrogen demands in a geographic region with promising future market demand.
2. Early Commercial Stations (EC). Based upon your organization’s understanding of the growth in demand for hydrogen in the near future (next 5–20 years from the fuel cell electric vehicle, transit bus, and material handling equipment markets), consider hydrogen stations to be Early Commercial stations if they have the following attributes:
• The stations are financially viable with little government support. Based on financial criteria, such
as ROI [return on investment], and requiring far less financial support or subsidy than the average support offered to all previous hydrogen stations in the same area or region (70%–90% less). Disregard ongoing support offered to all types of alternative or low carbon fuels, such as a LCFS [low carbon fuel standard], alternative fuel credits, or carbon credits.
• The stations are sized to support growing demand in a promising market region and to ensure adequate ROI. This size could vary from station to station and neighborhood to neighborhood, but consider what might be a typical size for new Early Commercial stations.
• The station design enables cost reductions because it is replicable. The same station design may be used for other stations, reducing the cost of subsequent stations through standardization and economies of production.
3. More Stations (MS). Identical to Early Commercial stations, but deployed in larger numbers. Default value is 10 times more stations being deployed than anticipated in the time period identified for Early Commercial stations. Additional cost reductions are achieved through standardization, mass production, streamlining of installation processes, and learning by doing.
4. Larger Stations (LS). Identical to Early Commercial stations, but designed for higher volume output. The number deployed is assumed to be similar to Early Commercial stations, but growth in market demand warrants larger station sizes. Default value is a 1.5 increase in size over the Early Commercial stations, with 2,000 kilograms per day as an upper limit.
This report is available at no cost from the National Renewable Energy Laboratory (NREL) at www.nrel.gov/publications.
5
Figure 1. Percentage of hydrogen station cost calculator respondents by type
Key results from the HSCC are summarized by station classification in Table 3, including the introduction timeframe, station capacity (in kg/day), utilization rate, average output, total capital cost, total capital cost per capacity ($1,000 per kg/day), and the percent reduction in capital cost per capacity compared to state-of-the-art (SOTA) stations.1 The results indicated in Table 3 suggest that significant cost reductions will be achieved by the 2014–2016 timeframe, when Early Commercial (EC) stations with an estimated average capacity of 450 kg/day will be installed at a capital cost of $2.8 million per station. On a capacity basis, this capital cost is $6,220 per kg/day of station capacity. This is a 62% reduction in capital cost per capacity compared to SOTA stations. This per-capacity capital cost declines to $5,150 per kg/day for More Stations (MS), and $3,370 per kg/day for Larger Stations (LS). Note that the station definitions in Table 2 only specify years for SOTA stations, so the introduction years indicated in Table 3 for the other station types (“2014–2016” for EC and “after 2016” for MS and LS) originate from the weighted, aggregate results of the HSCC respondents.
Table 3. Summary Results by Station Classification
1 The HSCC is based upon the financial framework of the H2A model, and assumes the station capacity definition used in H2A. The H2A models utilize a specific definition of station capacity based upon industry data provided for typical gasoline station demand on an hourly basis. Stations are designed for a peak hourly demand that occurs on a busy Friday in the summer. Details of this peak capacity design are provided in the H2A User’s Manuals, available on the H2A website (DOE 2012).
37%
25%
25%
13%Industrial gases or hydrogen infrastructure componentsUniversity research & training
Government
Automotive or fuel cells
State-of-the-Art Early Commercial More Stations Larger StationsIntroduction timeframe years 2011-2012 2014-2016 after 2016 after 2016Capacity kg/day 160 450 600 1,500 Utilization % 57% 74% 76% 80%Average output kg/day 91 333 456 1,200Total Capital $M $2.65 $2.80 $3.09 $5.05Capital Cost per capacity $1000 per kg/d $16.57 $6.22 $5.15 $3.37
reduction from SOTA % na 62% 69% 80%
Station TypeUnitsStation Attribute
This report is available at no cost from the National Renewable Energy Laboratory (NREL) at www.nrel.gov/publications.
6
Examples of near-term cost reduction opportunities that would likely contribute to the reduction of the SOTA station capital cost ($16,570 per kg/day) to the EC station capital cost ($6,220 per kg/day) by 2014–2016 include the following (Melaina et al. 2012):
• Economies of scale (SOTA < 250 kg/day; EC ~ 450 kg/day)
• Develop “standard” station designs
• Harmonize/standardize dispensing equipment specifications
• Develop “type approvals” for use in permitting
• Encourage station investors to design requests for proposals that incentivize standard, scalable designs or networks of stations (rather than one-off, custom-built projects).
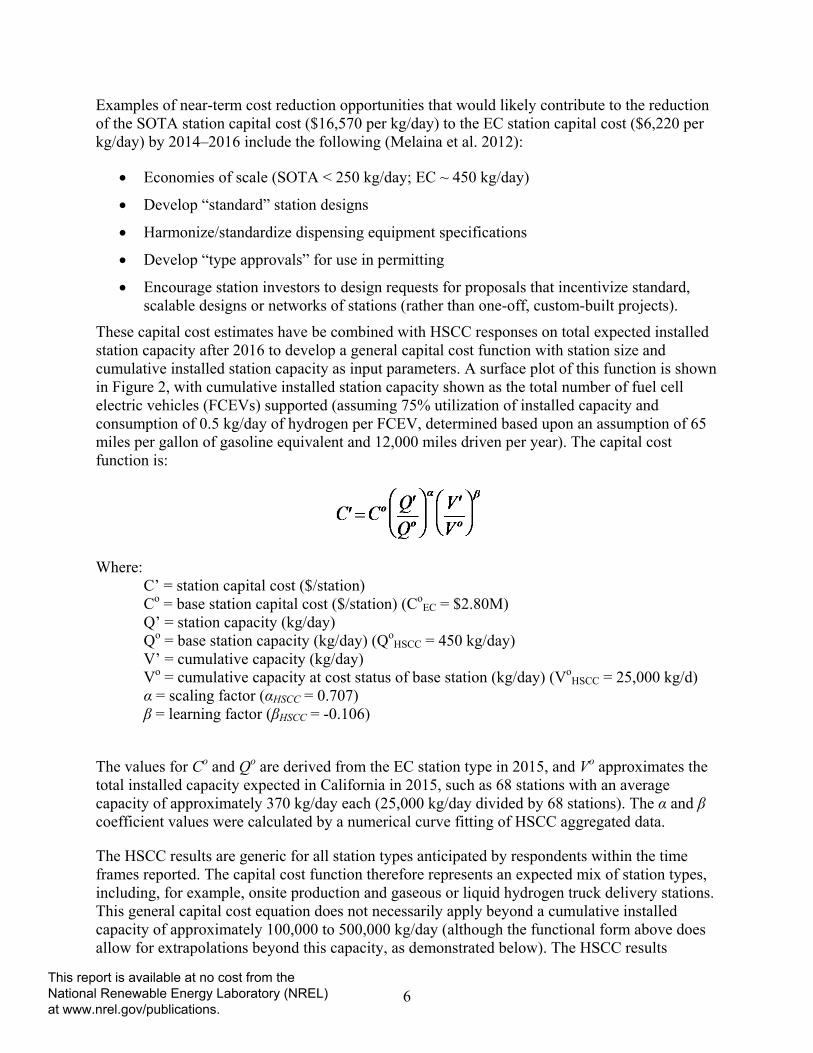
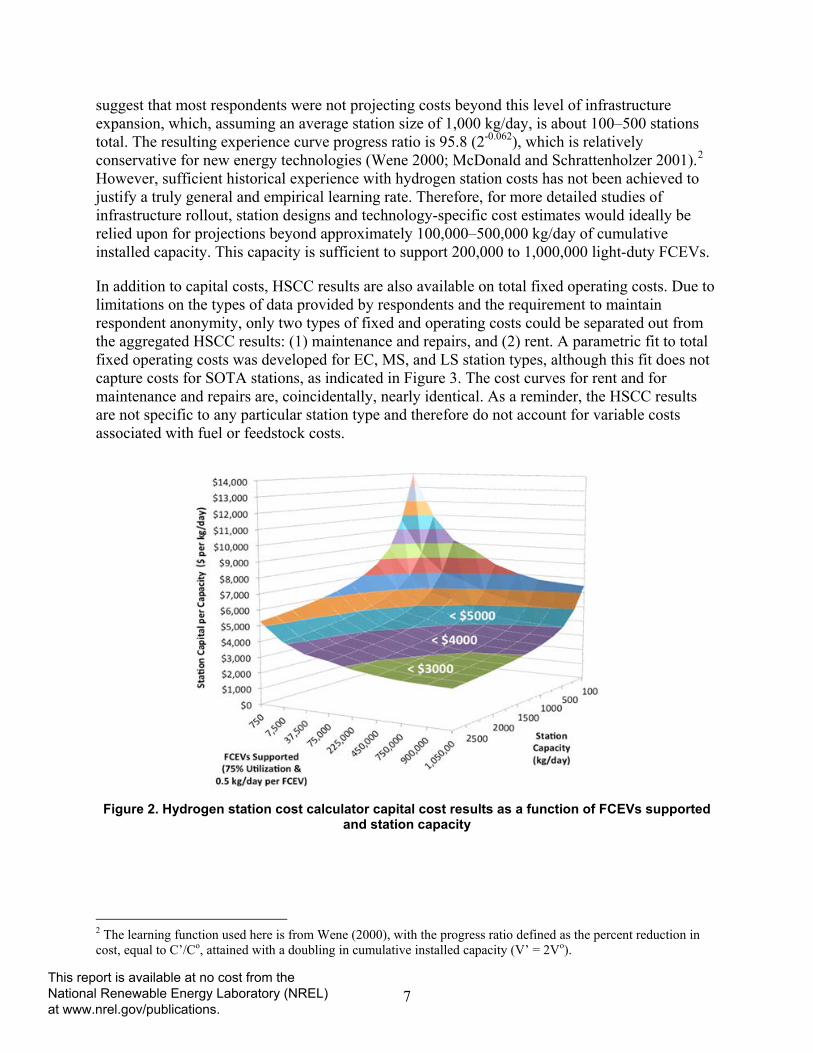
These capital cost estimates have be combined with HSCC responses on total expected installed station capacity after 2016 to develop a general capital cost function with station size and cumulative installed station capacity as input parameters. A surface plot of this function is shown in Figure 2, with cumulative installed station capacity shown as the total number of fuel cell electric vehicles (FCEVs) supported (assuming 75% utilization of installed capacity and consumption of 0.5 kg/day of hydrogen per FCEV, determined based upon an assumption of 65 miles per gallon of gasoline equivalent and 12,000 miles driven per year). The capital cost function is:
Where: C’ = station capital cost ($/station) Co = base station capital cost ($/station) (Co
EC = $2.80M) Q’ = station capacity (kg/day) Qo = base station capacity (kg/day) (Qo
HSCC = 450 kg/day) V’ = cumulative capacity (kg/day) Vo = cumulative capacity at cost status of base station (kg/day) (Vo
HSCC = 25,000 kg/d) α = scaling factor (αHSCC = 0.707) β = learning factor (βHSCC = -0.106)
The values for Co and Qo are derived from the EC station type in 2015, and Vo approximates the total installed capacity expected in California in 2015, such as 68 stations with an average capacity of approximately 370 kg/day each (25,000 kg/day divided by 68 stations). The α and β coefficient values were calculated by a numerical curve fitting of HSCC aggregated data.
The HSCC results are generic for all station types anticipated by respondents within the time frames reported. The capital cost function therefore represents an expected mix of station types, including, for example, onsite production and gaseous or liquid hydrogen truck delivery stations. This general capital cost equation does not necessarily apply beyond a cumulative installed capacity of approximately 100,000 to 500,000 kg/day (although the functional form above does allow for extrapolations beyond this capacity, as demonstrated below). The HSCC results
This report is available at no cost from the National Renewable Energy Laboratory (NREL) at www.nrel.gov/publications.
7
suggest that most respondents were not projecting costs beyond this level of infrastructure expansion, which, assuming an average station size of 1,000 kg/day, is about 100–500 stations total. The resulting experience curve progress ratio is 95.8 (2-0.062), which is relatively conservative for new energy technologies (Wene 2000; McDonald and Schrattenholzer 2001).2 However, sufficient historical experience with hydrogen station costs has not been achieved to justify a truly general and empirical learning rate. Therefore, for more detailed studies of infrastructure rollout, station designs and technology-specific cost estimates would ideally be relied upon for projections beyond approximately 100,000–500,000 kg/day of cumulative installed capacity. This capacity is sufficient to support 200,000 to 1,000,000 light-duty FCEVs.
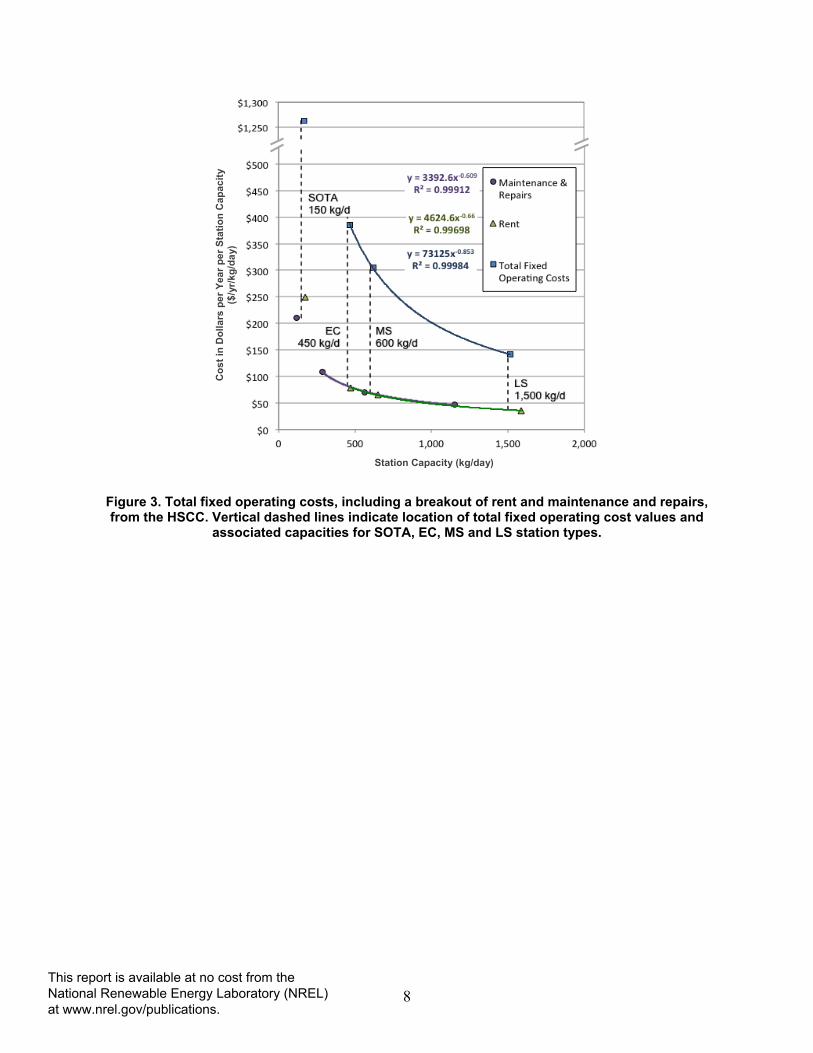
In addition to capital costs, HSCC results are also available on total fixed operating costs. Due to limitations on the types of data provided by respondents and the requirement to maintain respondent anonymity, only two types of fixed and operating costs could be separated out from the aggregated HSCC results: (1) maintenance and repairs, and (2) rent. A parametric fit to total fixed operating costs was developed for EC, MS, and LS station types, although this fit does not capture costs for SOTA stations, as indicated in Figure 3. The cost curves for rent and for maintenance and repairs are, coincidentally, nearly identical. As a reminder, the HSCC results are not specific to any particular station type and therefore do not account for variable costs associated with fuel or feedstock costs.
Figure 2. Hydrogen station cost calculator capital cost results as a function of FCEVs supported
and station capacity
2 The learning function used here is from Wene (2000), with the progress ratio defined as the percent reduction in cost, equal to C’/Co, attained with a doubling in cumulative installed capacity (V’ = 2Vo).
This report is available at no cost from the National Renewable Energy Laboratory (NREL) at www.nrel.gov/publications.
8
Figure 3. Total fixed operating costs, including a breakout of rent and maintenance and repairs, from the HSCC. Vertical dashed lines indicate location of total fixed operating cost values and
associated capacities for SOTA, EC, MS and LS station types.
C
ost i
n D
olla
rs p
er Y
ear p
er S
tatio
n C
apac
ity
($/y
r/kg/
day)
Station Capacity (kg/day)
This report is available at no cost from the National Renewable Energy Laboratory (NREL) at www.nrel.gov/publications.

9
3 Comparisons with Other Recent Cost Estimates 3.1 Hydrogen Analysis Model Case Studies (2012) In February of 2003, the DOE initiated the Hydrogen Analysis (H2A) Project to establish a consistent methodology and set of financial parameters for estimating the cost of hydrogen (DOE 2012). Prior to this effort, several organizations had analyzed hydrogen costs using a variety of detailed cost models, but it proved challenging to compare results given the wide range of methods and varying input parameters. The objectives of the H2A Project are the following (DOE 2012):
1. Establish a standard format and list of parameters for reporting analysis results for central production, distributed (forecourt) production, and delivery
2. Seek better validation of public analyses through dialog with industry
3. Enhance understanding of the differences among publicly available analyses and make these differences more transparent
4. Establish a mechanism for facile dissemination of public analysis results
5. Work to reach consensus on specific analysis parameters for production and delivery.
The first versions of the H2A models and case studies were published in 2005 and became the DOE standard for estimating hydrogen costs. These original case studies were developed with input and deliberation from a group of key industrial collaborators, which included representatives from American Electric Power, BOC Gases, British Petroleum, Chevron, Eastman Chemical, Entergy, ExxonMobil, Ferco, Framatome, General Electric, Praxair, Stuart Energy, and Thermochem. Of the various production and delivery technologies represented, the suite of H2A case studies included three onsite production or “forecourt” models: (1) reforming of natural gas by way of SMR, (2) production by way of electrolysis, and (3) production by way of reforming ethanol. For each of these onsite production technologies, H2A case studies were developed for Current and Future timeframes, originally identified as 2005 and 2015, respectively.
Costs for hydrogen delivery systems are represented as components in the H2A Delivery Components model, and as urban area scenarios in the H2A Hydrogen Delivery Scenario Analysis Model (HDSAM), including costs for retail stations receiving either gaseous or liquid truck deliveries, including upstream capital costs for terminal equipment and trucks (DOE 2013). Truck delivery systems, with production usually occurring at existing natural gas SMR plants located at petroleum refineries, have been the dominant configuration for recently installed hydrogen stations. The H2A case studies were updated to Version 3 in 2012 and have been integrated with the DOE’s HDSAM, Greenhouse Gases, Regulated Emissions, and Energy Use in Transportation (GREET), Hydrogen Production (HyPRO), and Hydrogen Demand and Resource Analysis (HyDRA) models through the Macro-System Model and serve as the cost basis for the Scenario Evaluation and Regionalization Analysis (SERA) infrastructure optimization model (Ruth et al. 2012; Bush et al. 2013).
The H2A Production model uses a standard discounted cash flow rate of return methodology to determine a levelized cost given a specific after-tax rate of return. The models and case studies can be downloaded from the H2A website and have flexible inputs and transparent cost
This report is available at no cost from the National Renewable Energy Laboratory (NREL) at www.nrel.gov/publications.
10
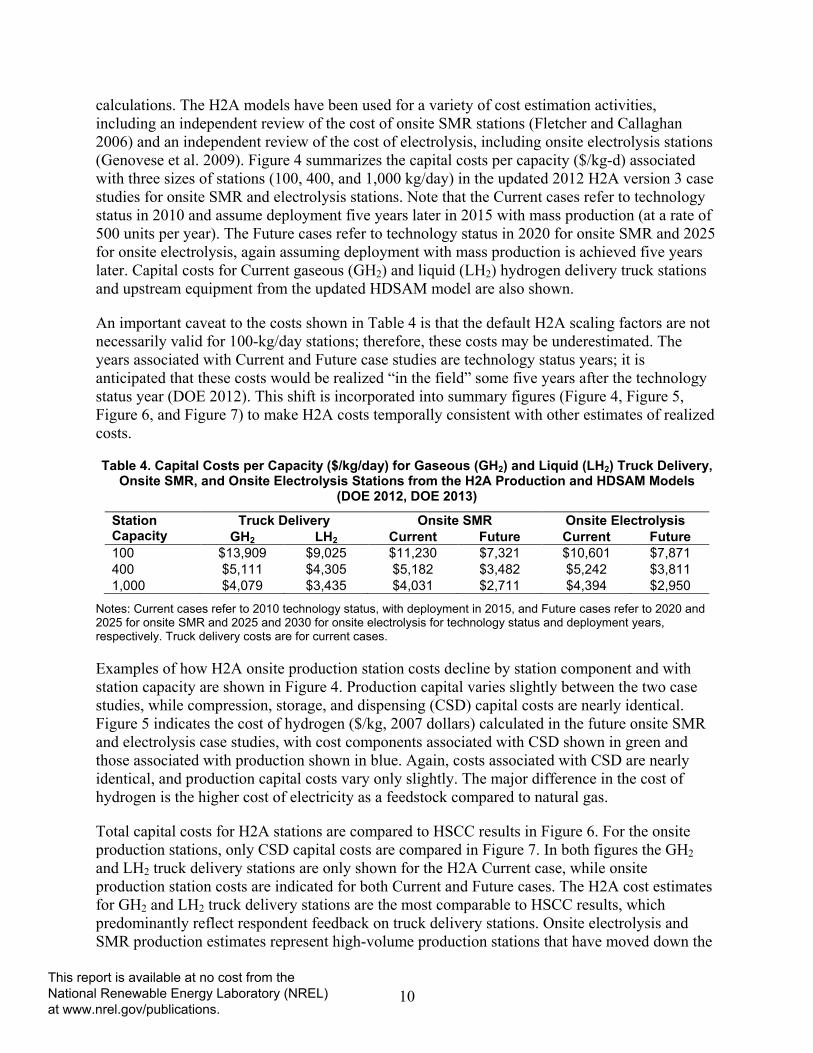
calculations. The H2A models have been used for a variety of cost estimation activities, including an independent review of the cost of onsite SMR stations (Fletcher and Callaghan 2006) and an independent review of the cost of electrolysis, including onsite electrolysis stations (Genovese et al. 2009). Figure 4 summarizes the capital costs per capacity ($/kg-d) associated with three sizes of stations (100, 400, and 1,000 kg/day) in the updated 2012 H2A version 3 case studies for onsite SMR and electrolysis stations. Note that the Current cases refer to technology status in 2010 and assume deployment five years later in 2015 with mass production (at a rate of 500 units per year). The Future cases refer to technology status in 2020 for onsite SMR and 2025 for onsite electrolysis, again assuming deployment with mass production is achieved five years later. Capital costs for Current gaseous (GH2) and liquid (LH2) hydrogen delivery truck stations and upstream equipment from the updated HDSAM model are also shown.
An important caveat to the costs shown in Table 4 is that the default H2A scaling factors are not necessarily valid for 100-kg/day stations; therefore, these costs may be underestimated. The years associated with Current and Future case studies are technology status years; it is anticipated that these costs would be realized “in the field” some five years after the technology status year (DOE 2012). This shift is incorporated into summary figures (Figure 4, Figure 5, Figure 6, and Figure 7) to make H2A costs temporally consistent with other estimates of realized costs.
Table 4. Capital Costs per Capacity ($/kg/day) for Gaseous (GH2) and Liquid (LH2) Truck Delivery, Onsite SMR, and Onsite Electrolysis Stations from the H2A Production and HDSAM Models
(DOE 2012, DOE 2013)
Station Truck Delivery Onsite SMR Onsite Electrolysis Capacity
GH2 LH2 Current Future Current Future
100 $13,909 $9,025 $11,230 $7,321 $10,601 $7,871 400 $5,111 $4,305 $5,182 $3,482 $5,242 $3,811 1,000 $4,079 $3,435 $4,031 $2,711 $4,394 $2,950
Notes: Current cases refer to 2010 technology status, with deployment in 2015, and Future cases refer to 2020 and 2025 for onsite SMR and 2025 and 2030 for onsite electrolysis for technology status and deployment years, respectively. Truck delivery costs are for current cases.
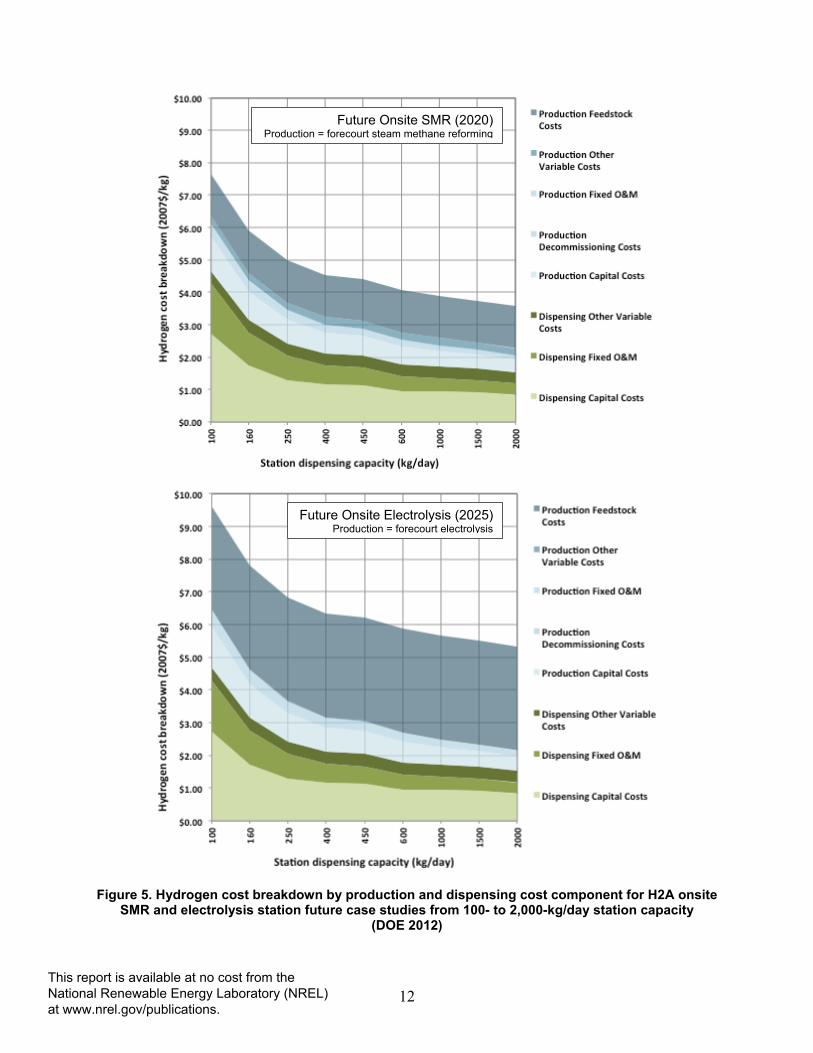
Examples of how H2A onsite production station costs decline by station component and with station capacity are shown in Figure 4. Production capital varies slightly between the two case studies, while compression, storage, and dispensing (CSD) capital costs are nearly identical. Figure 5 indicates the cost of hydrogen ($/kg, 2007 dollars) calculated in the future onsite SMR and electrolysis case studies, with cost components associated with CSD shown in green and those associated with production shown in blue. Again, costs associated with CSD are nearly identical, and production capital costs vary only slightly. The major difference in the cost of hydrogen is the higher cost of electricity as a feedstock compared to natural gas.
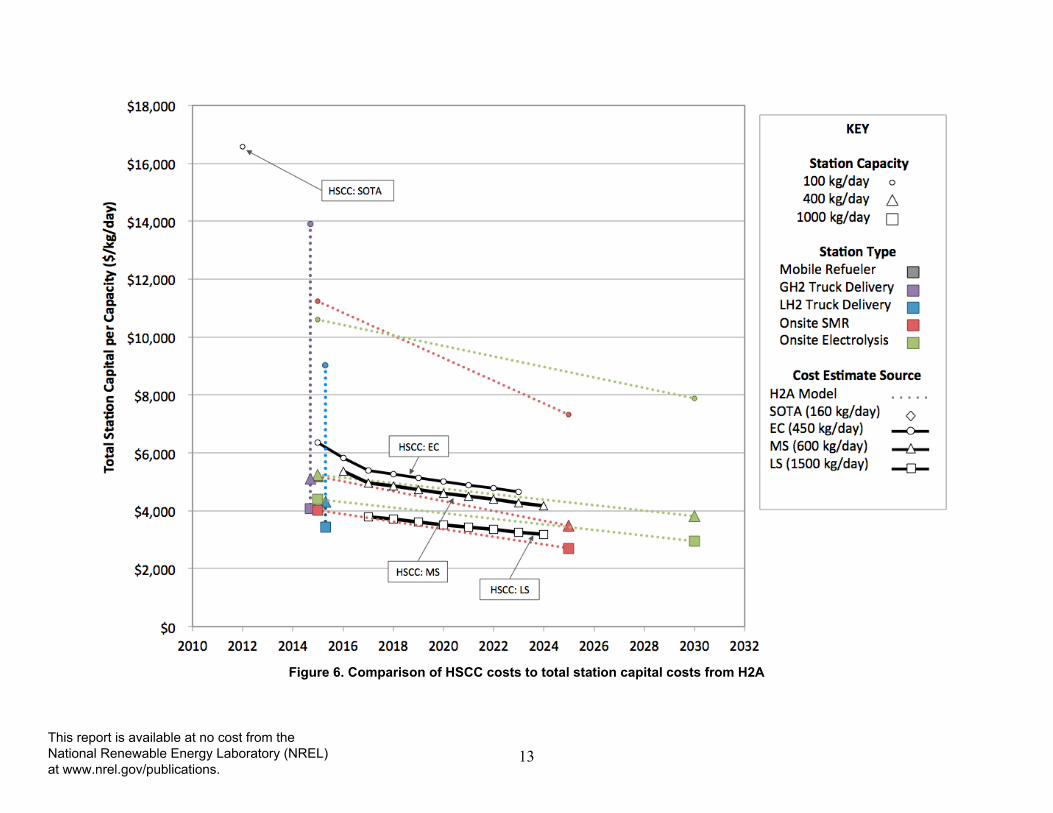
Total capital costs for H2A stations are compared to HSCC results in Figure 6. For the onsite production stations, only CSD capital costs are compared in Figure 7. In both figures the GH2 and LH2 truck delivery stations are only shown for the H2A Current case, while onsite production station costs are indicated for both Current and Future cases. The H2A cost estimates for GH2 and LH2 truck delivery stations are the most comparable to HSCC results, which predominantly reflect respondent feedback on truck delivery stations. Onsite electrolysis and SMR production estimates represent high-volume production stations that have moved down the
This report is available at no cost from the National Renewable Energy Laboratory (NREL) at www.nrel.gov/publications.

11
learning curve after a large number of stations have been deployed, with production volumes on the order of hundreds of units per year. The years indicated for these H2A estimates therefore reflect a different type of technology status and should be considered an estimate of an asymptotic floor on cost reduction potential rather than an estimate of station costs in the year indicated.
Figure 4. Capital costs per capacity for H2A onsite SMR and electrolysis station future case
studies from 100- to 2,000-kg/day station capacity (DOE 2012)
Future Onsite SMR (2020) Production = forecourt steam methane reforming
Future Onsite Electrolysis (2025) Production = forecourt electrolysis
This report is available at no cost from the National Renewable Energy Laboratory (NREL) at www.nrel.gov/publications.
12
Figure 5. Hydrogen cost breakdown by production and dispensing cost component for H2A onsite
SMR and electrolysis station future case studies from 100- to 2,000-kg/day station capacity (DOE 2012)
Future Onsite SMR (2020) Production = forecourt steam methane reforming
Future Onsite Electrolysis (2025) Production = forecourt electrolysis
This report is available at no cost from the National Renewable Energy Laboratory (NREL) at www.nrel.gov/publications.
13
Figure 6. Comparison of HSCC costs to total station capital costs from H2A
This report is available at no cost from the National Renewable Energy Laboratory (NREL) at www.nrel.gov/publications.

14
Figure 7. Comparison of HSCC costs to CSD capital costs from H2A
This report is available at no cost from the National Renewable Energy Laboratory (NREL) at www.nrel.gov/publications.
15
The HSCC results indicated for EC, MS, and LS stations are shown as a time series based upon a hypothetical demand scenario. This demand scenario is described in detail in Section 4. The trend of HSCC costs declining over time captures the influence of experience and learning, while differences in costs for each HSCC station size (EC, MS, and LS) are due to relative economies of scale for each particular station capacity. These same time series trends are used to compare HSCC results to UCD and recent California stations in the sections below.
3.2 UCD Transition Analysis Study and Recent Updates In a project primarily funded by industry representatives, UCD conducted a study in which input was collected from multiple stakeholders through a series of five workshops. The first report on the transition analysis study findings was published on December 21, 2009 (Ogden et al. 2010). One of the primary goals of the transition analysis study was to reach a consensus on technical and cost issues associated with near-term hydrogen infrastructure. Stakeholders participating in the UCD workshops were from the following organizations. Project sponsors are also indicated.
• California Air Resources Board
• California Fuel Cell Partnership (CaFCP)
• CEC
• Chevron (project sponsor)
• Daimler AG (project sponsor)
• DOE
• General Motors
• Honda Motor Company (project sponsor)
• NREL
• Shell Hydrogen (project sponsor)
• South Coast Air Quality Management District
• Toyota Motor Company (project sponsor)
• UCD
A general conclusion from the study on the cost of hydrogen infrastructure was (Ogden et al. 2010):
The analysis concluded that for an infrastructure of 42 hydrogen stations in the LA Basin that supports 25,000 FCVs [fuel cell vehicles] by 2017, a $200 million total investment would be required ($170 million to build the stations and $30 million to operate them). If this were amortized over 10 years, an average hydrogen fuel retail price of $10/kg could recoup the costs.
In addition to examining infrastructure costs and rollout trends needed to serve an emerging California market, the study reports on several recommendations addressing policy support options and actions for different stakeholder types, including policymakers, automotive firms, and energy firms. The study recognized FCEV costs from the 2008 National Academy of
This report is available at no cost from the National Renewable Energy Laboratory (NREL) at www.nrel.gov/publications.
16
Sciences report (NAS 2008) and acknowledged a hypothetical market growth curve in which FCEVs reach over 70% of new light-duty vehicles sales by 2050, based upon Cunningham et al. (2008). Timelines for various different activities are proposed, including the rollout of hydrogen stations in clusters with reference to average travel time modeling. This clustering analysis was elaborated upon in a separate report (Nicholas and Ogden 2010), and builds upon previous travel time traffic modeling conducted at UCD (Nicholas, Handy, and Sperling 2004). A summary of the UCD transition analysis was later articulated in a journal article by Ogden and Nicholas (2011). The costs reviewed below are taken from this most recent publication on the UCD transition analysis, which notes that information was collected through a series of interviews with key stakeholders, all of which were included in the original series of workshops. A major conclusion is that overall station network costs can be reduced through a station clustering strategy compared to the more typical spatial coverage strategy proposed in previous studies. This strategy of clustering and the role of station coverage have been discussed in deliberations among stakeholders engaged with the CEC, as discussed in workshops conducted in June and July of 2012 (CEC 2013b).
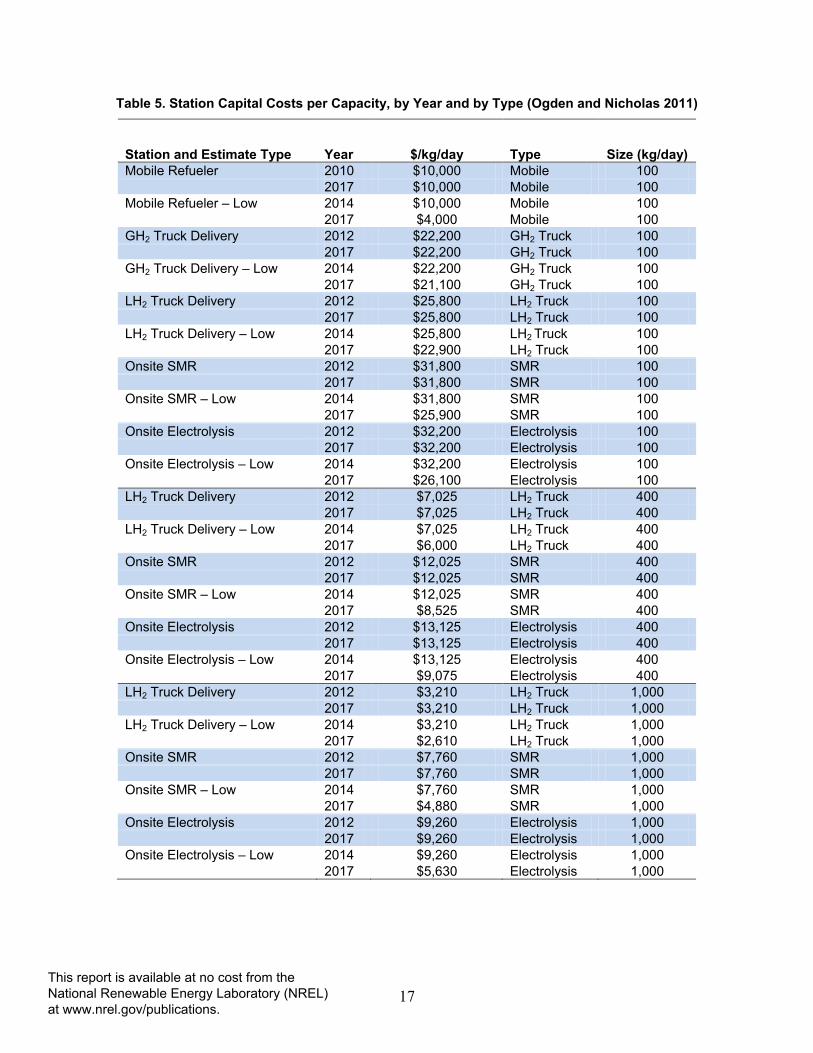
The station capital costs reported in the transition analysis study are summarized in Table 5, indicating year of station installation, total capital per station capacity ($/kg/day), station type, and station capacity (kg/day). Multiplying the capital cost per capacity by station capacity results in the total capital cost per station. High and low estimates are provided for 2014 through 2017. This study assumed that all new hydrogen stations would be greenfield installations, therefore incurring a cost of $2 million for site preparation, permitting, engineering, utility installation, and buildings. This $2 million is a “baseline cost” for any type of refueling station, other than mobile refuelers, and is independent of the fuel (e.g., it would be the same for a new gasoline station). For hydrogen stations, hydrogen equipment costs are added to this baseline. This is one explanation for why the UCD transition analysis cost estimates are high relative to other cost estimates reviewed in the present report.
For the first three-year period (2009–2011), it was assumed that mobile refuelers cost $1 million, and that “fixed” 100-kg/day stations (i.e., not mobile refuelers) cost $3–$4 million. These costs are higher than H2A estimates (DOE 2012) or estimates in Weinert et al. (2005) and Weinert (2006), but are consistent with current station costs reported in interviews with energy industry stakeholders. One reason for the high cost is that these stations are essentially “one of a kind” or “few of a kind” projects.
For the next three years (2012–2014), UCD researchers assumed that mobile refuelers cost $1 million. The costs for fixed refueling stations in the 100–400 kg/day size range are the baseline $2 million plus hydrogen equipment costs that are twice the H2A “current technology” values. The rationale for choosing twice the H2A “current technology” equipment cost is as follows. H2A’s costs are based on production of 500 stations per year. But in 2012–2014, we would expect many fewer stations to be produced. If we reduce annual station production by a factor of 50–100 (to 5 to 10 stations per year), the equipment capital cost should be about 2 times the H2A estimate when we apply station equipment learning rates developed in studies by Weinert (2006).
Two cost cases were analyzed for the final 3 years (2015–2017). In the “low cost” fixed station case, the study assumed a $2 million baseline plus equipment costs based on H2A “current technology” numbers. The “high cost” case assumes the same station costs as in 2012–2014.
This report is available at no cost from the National Renewable Energy Laboratory (NREL) at www.nrel.gov/publications.
17
Table 5. Station Capital Costs per Capacity, by Year and by Type (Ogden and Nicholas 2011)
Station and Estimate Type Year $/kg/day Type Size (kg/day) Mobile Refueler 2010 $10,000 Mobile 100 2017 $10,000 Mobile 100 Mobile Refueler – Low 2014 $10,000 Mobile 100 2017 $4,000 Mobile 100 GH2 Truck Delivery 2012 $22,200 GH2 Truck 100 2017 $22,200 GH2 Truck 100 GH2 Truck Delivery – Low 2014 $22,200 GH2 Truck 100 2017 $21,100 GH2 Truck 100 LH2 Truck Delivery 2012 $25,800 LH2 Truck 100 2017 $25,800 LH2 Truck 100 LH2 Truck Delivery – Low 2014 $25,800 LH2 Truck 100 2017 $22,900 LH2 Truck 100 Onsite SMR 2012 $31,800 SMR 100 2017 $31,800 SMR 100 Onsite SMR – Low 2014 $31,800 SMR 100 2017 $25,900 SMR 100 Onsite Electrolysis 2012 $32,200 Electrolysis 100 2017 $32,200 Electrolysis 100 Onsite Electrolysis – Low 2014 $32,200 Electrolysis 100 2017 $26,100 Electrolysis 100 LH2 Truck Delivery 2012 $7,025 LH2 Truck 400 2017 $7,025 LH2 Truck 400 LH2 Truck Delivery – Low 2014 $7,025 LH2 Truck 400 2017 $6,000 LH2 Truck 400 Onsite SMR 2012 $12,025 SMR 400 2017 $12,025 SMR 400 Onsite SMR – Low 2014 $12,025 SMR 400 2017 $8,525 SMR 400 Onsite Electrolysis 2012 $13,125 Electrolysis 400 2017 $13,125 Electrolysis 400 Onsite Electrolysis – Low 2014 $13,125 Electrolysis 400 2017 $9,075 Electrolysis 400 LH2 Truck Delivery 2012 $3,210 LH2 Truck 1,000 2017 $3,210 LH2 Truck 1,000 LH2 Truck Delivery – Low 2014 $3,210 LH2 Truck 1,000 2017 $2,610 LH2 Truck 1,000 Onsite SMR 2012 $7,760 SMR 1,000 2017 $7,760 SMR 1,000 Onsite SMR – Low 2014 $7,760 SMR 1,000 2017 $4,880 SMR 1,000 Onsite Electrolysis 2012 $9,260 Electrolysis 1,000 2017 $9,260 Electrolysis 1,000 Onsite Electrolysis – Low 2014 $9,260 Electrolysis 1,000 2017 $5,630 Electrolysis 1,000
This report is available at no cost from the National Renewable Energy Laboratory (NREL) at www.nrel.gov/publications.
18
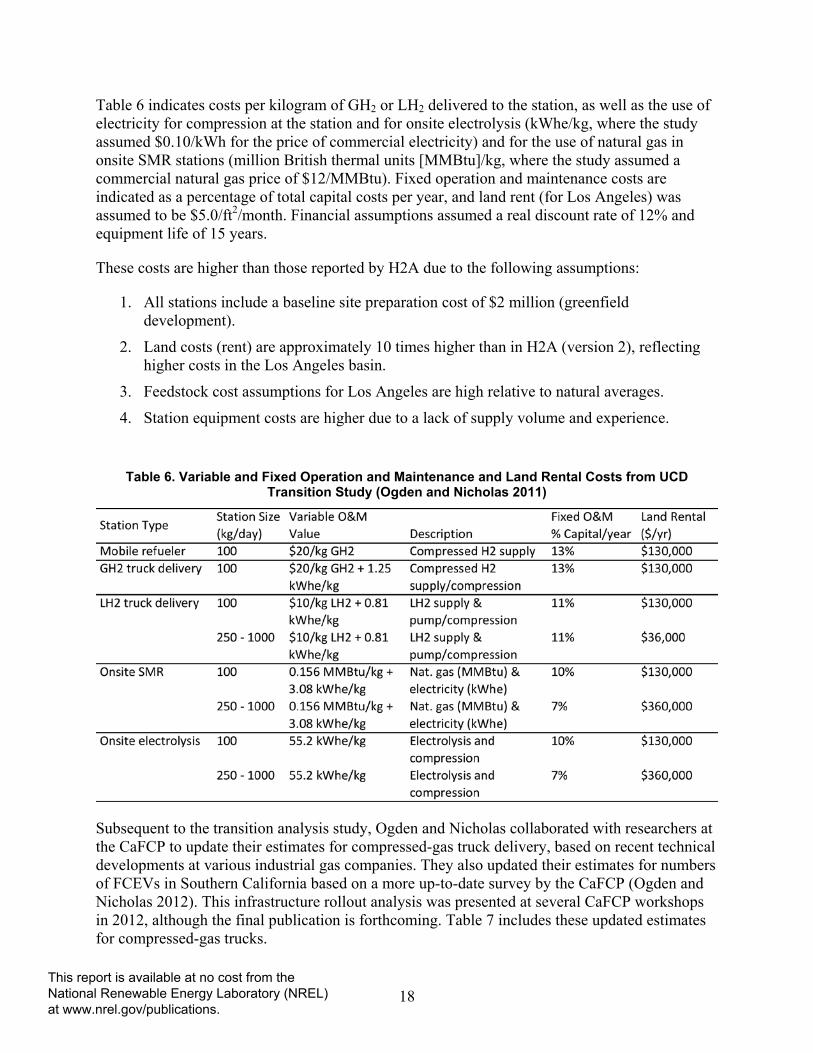
Table 6 indicates costs per kilogram of GH2 or LH2 delivered to the station, as well as the use of electricity for compression at the station and for onsite electrolysis (kWhe/kg, where the study assumed $0.10/kWh for the price of commercial electricity) and for the use of natural gas in onsite SMR stations (million British thermal units [MMBtu]/kg, where the study assumed a commercial natural gas price of $12/MMBtu). Fixed operation and maintenance costs are indicated as a percentage of total capital costs per year, and land rent (for Los Angeles) was assumed to be $5.0/ft2/month. Financial assumptions assumed a real discount rate of 12% and equipment life of 15 years.
These costs are higher than those reported by H2A due to the following assumptions:
1. All stations include a baseline site preparation cost of $2 million (greenfield development).
2. Land costs (rent) are approximately 10 times higher than in H2A (version 2), reflecting higher costs in the Los Angeles basin.
3. Feedstock cost assumptions for Los Angeles are high relative to natural averages.
4. Station equipment costs are higher due to a lack of supply volume and experience.
Table 6. Variable and Fixed Operation and Maintenance and Land Rental Costs from UCD Transition Study (Ogden and Nicholas 2011)
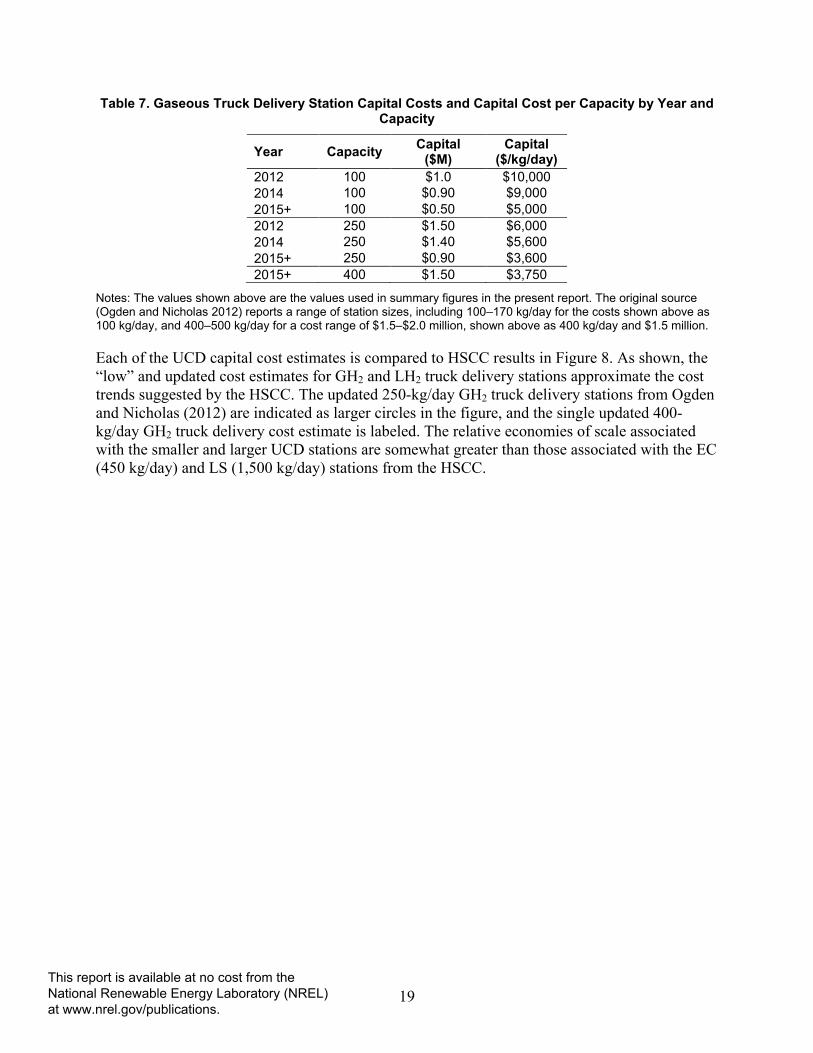
Subsequent to the transition analysis study, Ogden and Nicholas collaborated with researchers at the CaFCP to update their estimates for compressed-gas truck delivery, based on recent technical developments at various industrial gas companies. They also updated their estimates for numbers of FCEVs in Southern California based on a more up-to-date survey by the CaFCP (Ogden and Nicholas 2012). This infrastructure rollout analysis was presented at several CaFCP workshops in 2012, although the final publication is forthcoming. Table 7 includes these updated estimates for compressed-gas trucks.
This report is available at no cost from the National Renewable Energy Laboratory (NREL) at www.nrel.gov/publications.
19
Table 7. Gaseous Truck Delivery Station Capital Costs and Capital Cost per Capacity by Year and Capacity
Year Capacity Capital ($M)
Capital ($/kg/day)
2012 100 $1.0 $10,000 2014 100 $0.90 $9,000 2015+ 100 $0.50 $5,000 2012 250 $1.50 $6,000 2014 250 $1.40 $5,600 2015+ 250 $0.90 $3,600 2015+ 400 $1.50 $3,750
Notes: The values shown above are the values used in summary figures in the present report. The original source (Ogden and Nicholas 2012) reports a range of station sizes, including 100–170 kg/day for the costs shown above as 100 kg/day, and 400–500 kg/day for a cost range of $1.5–$2.0 million, shown above as 400 kg/day and $1.5 million.
Each of the UCD capital cost estimates is compared to HSCC results in Figure 8. As shown, the “low” and updated cost estimates for GH2 and LH2 truck delivery stations approximate the cost trends suggested by the HSCC. The updated 250-kg/day GH2 truck delivery stations from Ogden and Nicholas (2012) are indicated as larger circles in the figure, and the single updated 400-kg/day GH2 truck delivery cost estimate is labeled. The relative economies of scale associated with the smaller and larger UCD stations are somewhat greater than those associated with the EC (450 kg/day) and LS (1,500 kg/day) stations from the HSCC.
This report is available at no cost from the National Renewable Energy Laboratory (NREL) at www.nrel.gov/publications.

20
Figure 8. Cost comparison of UCD station cost estimates vs. HSCC cost estimates
This report is available at no cost from the National Renewable Energy Laboratory (NREL) at www.nrel.gov/publications.
21
3.3 Recent Hydrogen Station Installations and Estimates in California (2009–2013)
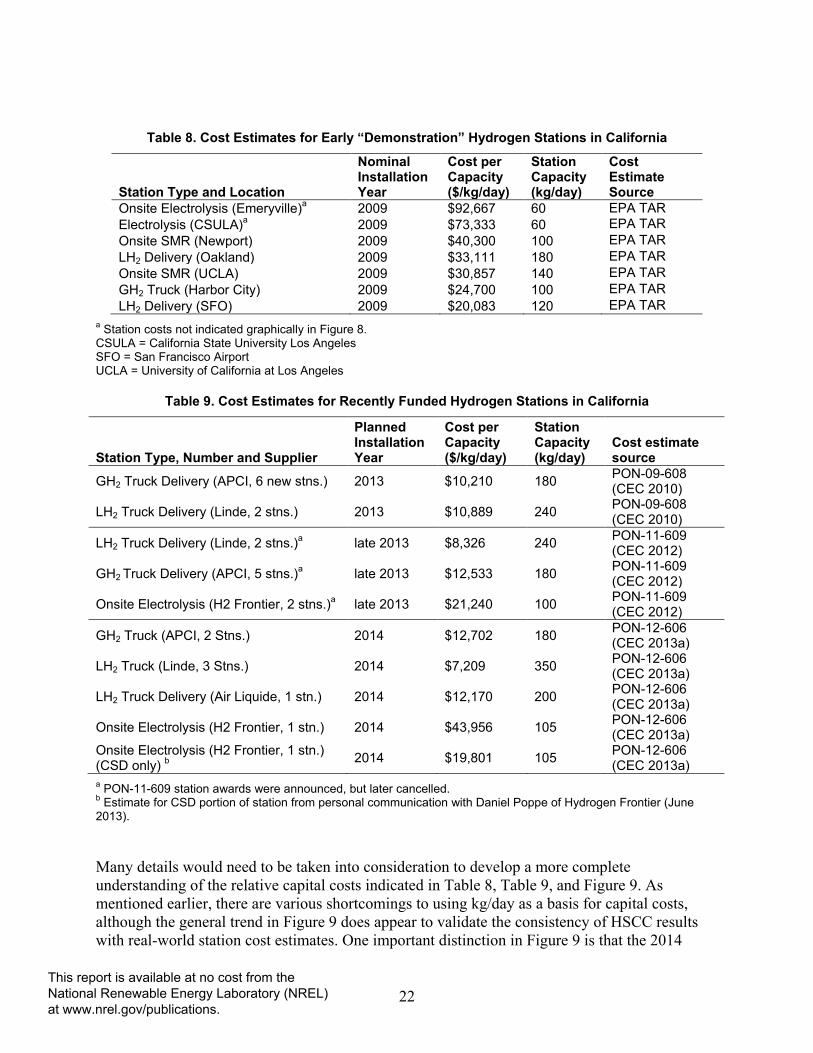
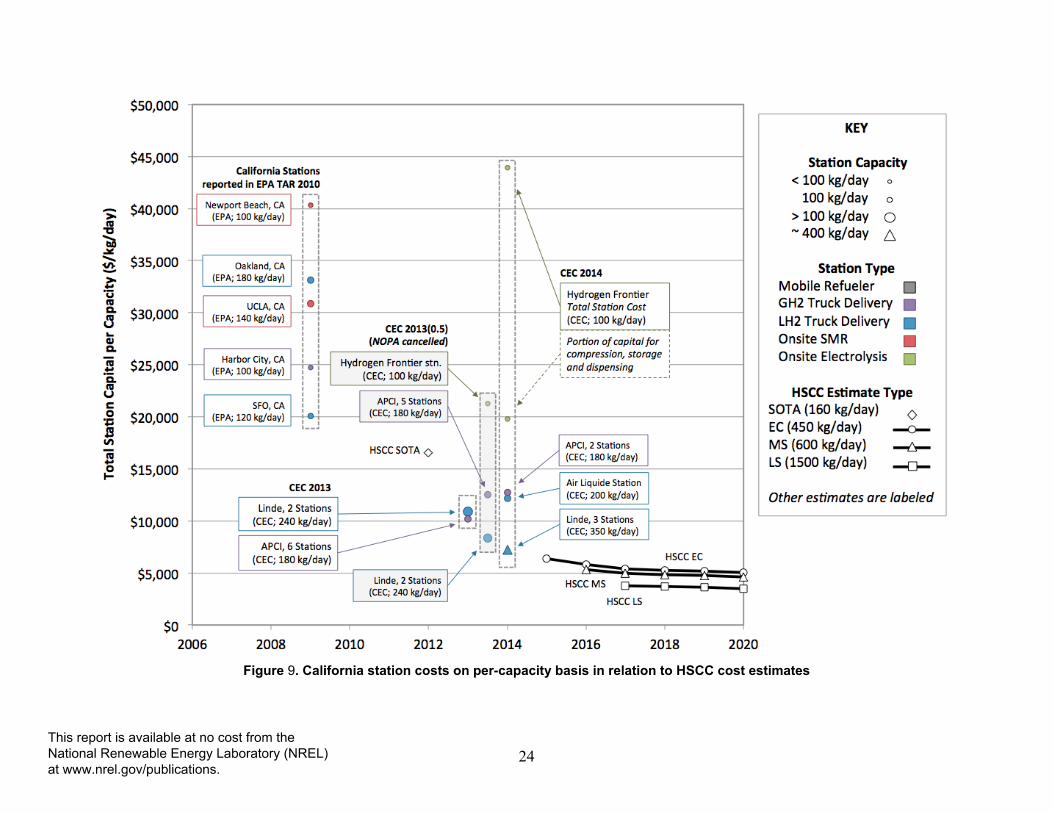
The majority of recent hydrogen station installations in the United States have been in California, which has been recognized as an early market (Greene et al. 2008) and has adopted strong policies to support low-carbon alternative fuel vehicles, such as the zero emission vehicle mandate and the Low Carbon Fuel Standard. The CEC has been funding hydrogen station installation projects through the Alternative and Renewable Fuels and Vehicle Technologies Program (ARFVTP). Stations installed with support from the California Air Resource Board were described, along with costs, in the Interim Joint Technical Assessment Report (TAR) as part of an assessment of new corporate average fuel economy standards (EPA 2010). The capital costs from these “demonstration” stations are summarized in Table 8 as capital costs per station capacity, along with the station type, location, and station capacity. It is assumed that these station costs reflect stations ready to be installed in the year 2009. In 2010, ARFVTP funded an additional eight new stations, with awards to Air Products and Chemicals, Inc. (APCI) for six stations and to The Linde Group (Linde) for two stations (CEC 2010). This 2010 award, referred to as PON-09-608, also funded two station upgrades by APCI and one station upgrade by Linde, although the costs associated with these upgrades are not included in the station cost comparisons below. Capital costs per capacity are shown for these new stations in Table 9, assuming a planned installation year of 2013.3 The average capital cost is indicated for the six stations from APCI, rated at 180 kg/day each, and the two Linde stations, rated at 240 kg/day each. Both types of stations have similar capital costs on a capacity basis, between $10,000 and $11,000 per kg/day of nominal installed capacity. These estimates reflect technology cost status in the planned installation year; expected installation dates have been pushed back for many stations.
The early Air Resources Board-funded stations (2009 vintage) in Table 8 are considered demonstration-type stations compared to the planned 2013 stations funded through PON-09-608. Stations funded through subsequent CEC ARFVTP awards were held to different standards and requirements, and therefore are not necessarily equivalent in terms of technical performance or market readiness. As indicated in Table 9, these stations have somewhat higher capital cost per capacity, although the trend varies and significant economies of scale appear to be achieved through larger station sizes. The nine station awards announced through PON-11-609 for APCI, Linde, and Hydrogen Frontier were later recalled; these stations are therefore no longer planned, but are indicated as “late 2013” stations for the sake of comparing cost estimates (CEC 2012). The seven stations subsequently funded through PON-12-606 are planned and indicated as 2014 stations (CEC 2013a). These cost estimates are indicated graphically, and compared to HSCC estimates in Figure 9. The cancelled stations are shaded to indicate that they are no longer planned as are the other California stations shown in the figure. This figure highlights that the HSCC SOTA estimate is an intermediary value between the 2009 “demonstration” stations and the more recent stations funded through ARFVTP. Moreover, these recently funded stations are trending over time towards the capital costs per capacity for the EC, MS, and LS station estimates. 3 Installation of these stations has been delayed for various reasons. CEC staff provided an update on progress and future plans to fund hydrogen stations through ARFVTP at the Hydrogen Fuel Infrastructure Workshop held on August 12, 2013. An agenda and WebEx recording from the workshop are available on the CEC Workshops and Notices website: http://www.energy.ca.gov/altfuels/notices.
This report is available at no cost from the National Renewable Energy Laboratory (NREL) at www.nrel.gov/publications.
22
Table 8. Cost Estimates for Early “Demonstration” Hydrogen Stations in California
Station Type and Location
Nominal Installation Year
Cost per Capacity ($/kg/day)
Station Capacity (kg/day)
Cost Estimate Source
Onsite Electrolysis (Emeryville)a 2009 $92,667 60 EPA TAR Electrolysis (CSULA)a 2009 $73,333 60 EPA TAR Onsite SMR (Newport) 2009 $40,300 100 EPA TAR LH2 Delivery (Oakland) 2009 $33,111 180 EPA TAR Onsite SMR (UCLA) 2009 $30,857 140 EPA TAR GH2 Truck (Harbor City) 2009 $24,700 100 EPA TAR LH2 Delivery (SFO) 2009 $20,083 120 EPA TAR a Station costs not indicated graphically in Figure 8.
CSULA = California State University Los Angeles SFO = San Francisco Airport UCLA = University of California at Los Angeles
Table 9. Cost Estimates for Recently Funded Hydrogen Stations in California
Station Type, Number and Supplier
Planned Installation Year
Cost per Capacity ($/kg/day)
Station Capacity (kg/day)
Cost estimate source
GH2 Truck Delivery (APCI, 6 new stns.) 2013 $10,210 180 PON-09-608 (CEC 2010)
LH2 Truck Delivery (Linde, 2 stns.) 2013 $10,889 240 PON-09-608 (CEC 2010)
LH2 Truck Delivery (Linde, 2 stns.)a late 2013 $8,326 240 PON-11-609 (CEC 2012)
GH2 Truck Delivery (APCI, 5 stns.)a late 2013 $12,533 180 PON-11-609 (CEC 2012)
Onsite Electrolysis (H2 Frontier, 2 stns.)a late 2013 $21,240 100 PON-11-609 (CEC 2012)
GH2 Truck (APCI, 2 Stns.) 2014 $12,702 180 PON-12-606 (CEC 2013a)
LH2 Truck (Linde, 3 Stns.) 2014 $7,209 350 PON-12-606 (CEC 2013a)
LH2 Truck Delivery (Air Liquide, 1 stn.) 2014 $12,170 200 PON-12-606 (CEC 2013a)
Onsite Electrolysis (H2 Frontier, 1 stn.) 2014 $43,956 105 PON-12-606 (CEC 2013a)
Onsite Electrolysis (H2 Frontier, 1 stn.) (CSD only) b 2014 $19,801 105 PON-12-606
(CEC 2013a) a PON-11-609 station awards were announced, but later cancelled. b Estimate for CSD portion of station from personal communication with Daniel Poppe of Hydrogen Frontier (June 2013).
Many details would need to be taken into consideration to develop a more complete understanding of the relative capital costs indicated in Table 8, Table 9, and Figure 9. As mentioned earlier, there are various shortcomings to using kg/day as a basis for capital costs, although the general trend in Figure 9 does appear to validate the consistency of HSCC results with real-world station cost estimates. One important distinction in Figure 9 is that the 2014
This report is available at no cost from the National Renewable Energy Laboratory (NREL) at www.nrel.gov/publications.
23
onsite electrolysis station estimate (Hydrogen Frontier) is shown for both total station capital costs and for the capital costs that are not associated with onsite production, referred to as “compression, storage, and dispensing” costs. In addition, the costs indicated for the 2014 APCI stations have been adjusted downwards for an assumed $400,000 per station cost associated with an upstream central fill station, as reported in PON-11-609 (CEC 2012). Additional details on specific station requirements for each round of ARFVTP funding can be found in proposal materials (CEC 2013c).
This report is available at no cost from the National Renewable Energy Laboratory (NREL) at www.nrel.gov/publications.
24
Figure 9. California station costs on per-capacity basis in relation to HSCC cost estimates
This report is available at no cost from the National Renewable Energy Laboratory (NREL) at www.nrel.gov/publications.
25
3.4 Comparing Cost Estimates This section compares trends across each of the station capital cost estimate sources reviewed above. The capital costs per capacity from the HSCC and the other three sources are summarized as a function of installation year in Figure 10, focusing on estimates below $14,000 per kg/day. Approximate station capacity is indicated by symbol shape, station type is indicated by color, and for time series or high/low estimates (H2A only) line patterns indicate the estimate source. Text boxes indicate sources for other cost estimates. Dashed lines indicate the low estimates from the 2011 UCD study as a linear trend between 2014 and 2017, and updated UCD estimates for gaseous truck delivery stations are shown as broad shaded lines with small circles for the 100-kg/day stations and larger circles for the 250-kg/day stations. Total station capital costs (rather than just CSD capital costs) are indicated for H2A onsite production stations, and Current status year results are shown for GH2 and LH2 truck delivery stations for 100-, 400-, and 1,000-kg/day capacities. These different cost estimate sources have each been discussed and visualized in separate figures in Sections 3.1, 3.2, and 3.3.
The HSCC capital cost function, being a temporal aggregate representation of multiple types of stations, provides intermediary costs bridging the 2014–2017 estimates from UCD and the 2020–2025 mass production estimates from H2A. However, given the stakeholder responses received through the HSCC, it is likely that the majority of responses may be associated with LH2 truck delivery (Melaina et al. 2012), suggesting these estimates should align with the LH2 truck delivery estimates from UCD. Although cost estimates become much more uncertain after around 2023, the trends in Figure 10 suggest that LH2 truck delivery and onsite production technology station capital costs may reach a tipping point for larger stations (1,000–2,000 kg/day) within the 2020–2030 timeframe. This is emphasized in Figure 11, which shows the capital cost estimates from Figure 10 as a function of station capacity. Dashed and solid lines indicate near- and long-term timeframes for UCD and H2A estimates, and symbol shape indicates the cost estimate source. As indicated, future cost estimates for LH2 truck delivery stations and onsite production stations tend to converge near $3,000–$5,000 per kg/day capacity near the 1,000-kg/day station size (cf. Ogden et al. 1996; Thomas 1997). However, as discussed in Section 4, hydrogen station networks will tend to have a broad range of station sizes as FCEV markets expand geographically and grow in size. Both small and larger stations will be required to meet coverage requirements and to achieve economies of scale.
This report is available at no cost from the National Renewable Energy Laboratory (NREL) at www.nrel.gov/publications.

26
Figure 10. Capital costs per capacity for hydrogen stations over time: focus on smaller, high-cost stations
This report is available at no cost from the National Renewable Energy Laboratory (NREL) at www.nrel.gov/publications.

27
Figure 11. Capital costs per capacity as a function of station capacity
This report is available at no cost from the National Renewable Energy Laboratory (NREL) at www.nrel.gov/publications.
28
4 Average Station Network Costs: Simulating a California Rollout
Though significant capital cost reductions can be achieved for hydrogen stations with larger capacities, as suggested in Figure 11, a significant number of smaller stations will be needed to provide sufficient refueling availability for early adopters (Melaina and Ross 2000; Melaina 2003; Nicholas, Handy and Sperling 2004). Larger stations can be installed as demand grows in a given area, but a balance must be achieved between station coverage to stimulate market growth and increased station capacity to achieve economies of scale. This section reviews a simulation of early market growth in California where this balance between coverage and capacity is reconciled (analytically) over time. The result is an estimate of average capital costs as FCEV markets and station networks expand over time. This simplified rollout simulation relies upon the capital cost function derived from the HSCC and provides perspective on how quickly, and at what scale, station capital cost reductions might be achieved during the early market introduction phase.
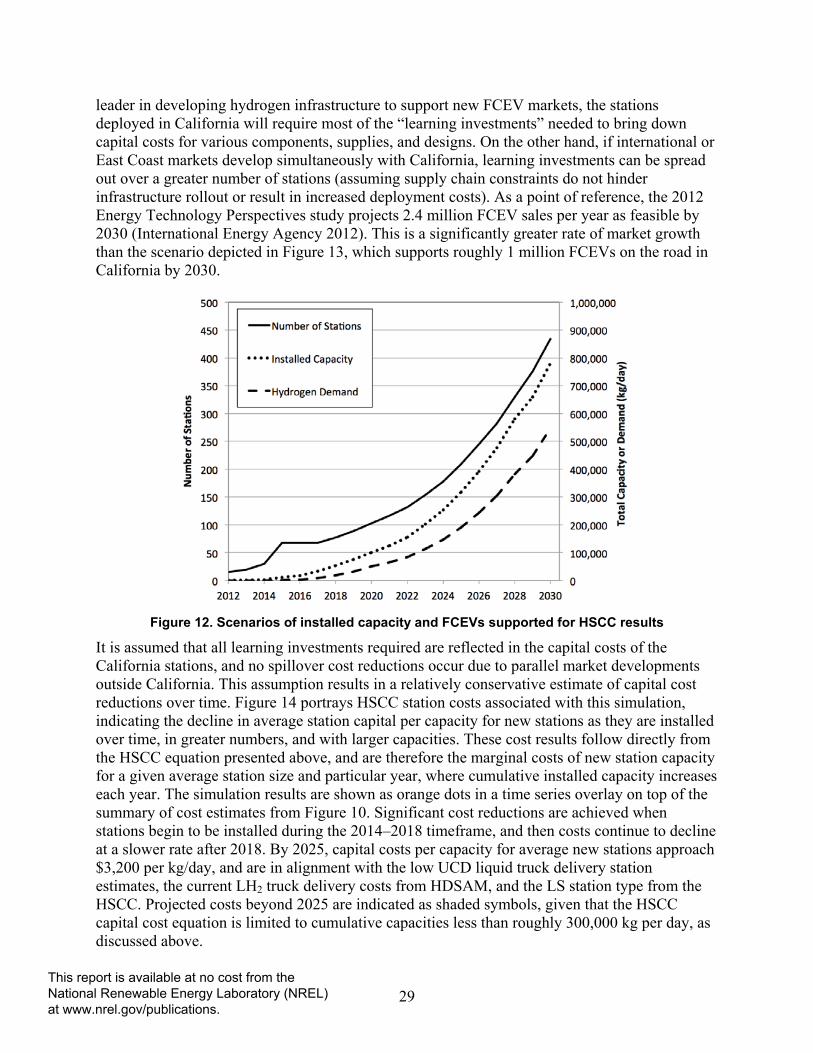
An updated California Roadmap report was released by the CaFCP in June 2012 (CaFCP 2012) that identifies the strategic placement of 68 hydrogen stations required to serve a growing fleet of FCEVs, which is expected to reach 53,000 vehicles in the 2015–2017 timeframe. We use these early market growth trends as a basis for a modest growth scenario for FCEVs in California between 2015 and 2030. The scenario is depicted in Figure 12 in terms of total number of stations installed, total installed station capacity (kg/day), and demand for hydrogen by FCEVs. A plateau of 68 stations is maintained from 2015 through 2017 as vehicle fleets grow in size and demand for hydrogen increases. The scenario reflects modest growth compared to the CaFCP Roadmap in that 50,000 vehicles are deployed around 2018–2019 instead of 2015–2017. However, demand continues to grow over time, with approximately 350,000 FCEVs deployed by 2025, which is comparable to a recent California Air Resources Board report articulating a scenario in which the zero emission vehicle mandate is met completely by FCEVs in California (California Air Resources Board 2012), and just over 500,000 FCEVs deployed by 2030. This market growth rate is relatively slow compared to scenarios explored in other studies (International Energy Agency 2012; National Research Council 2013).
The scenario station rollout trends resolve geographic coverage requirements and station economies of scale by relying upon the relative station size algorithm deployed in the Scenario Evaluation and Regionalization Analysis model (Bush et al. 2013) and described by Melaina and Bremson (2006). Figure 13a indicates the resulting number of stations by size category, and Figure 13b indicates total installed station capacity by station size category. Smaller stations (100 to 250 kg/day) dominate initially, but give way to larger stations after 2017. Stations with a capacity greater than 1,500 kg/day become more prevalent over time and eventually become the majority of installed station capacity around 2025. As indicated, many early stations begin to be upgraded to larger capacities before 2017; after 2017, smaller stations are either upgraded to larger capacities or relocated to serve new emerging markets (not indicated in the graphs) and replaced with new, larger stations. The number of stations indicated for the 2012–2013 timeframe is nominal, based upon model capacity categories.
This simulation is limited to California and does not take into account additional station deployments that would likely occur in other states or internationally. If California proves to be a
This report is available at no cost from the National Renewable Energy Laboratory (NREL) at www.nrel.gov/publications.
29
leader in developing hydrogen infrastructure to support new FCEV markets, the stations deployed in California will require most of the “learning investments” needed to bring down capital costs for various components, supplies, and designs. On the other hand, if international or East Coast markets develop simultaneously with California, learning investments can be spread out over a greater number of stations (assuming supply chain constraints do not hinder infrastructure rollout or result in increased deployment costs). As a point of reference, the 2012 Energy Technology Perspectives study projects 2.4 million FCEV sales per year as feasible by 2030 (International Energy Agency 2012). This is a significantly greater rate of market growth than the scenario depicted in Figure 13, which supports roughly 1 million FCEVs on the road in California by 2030.
Figure 12. Scenarios of installed capacity and FCEVs supported for HSCC results
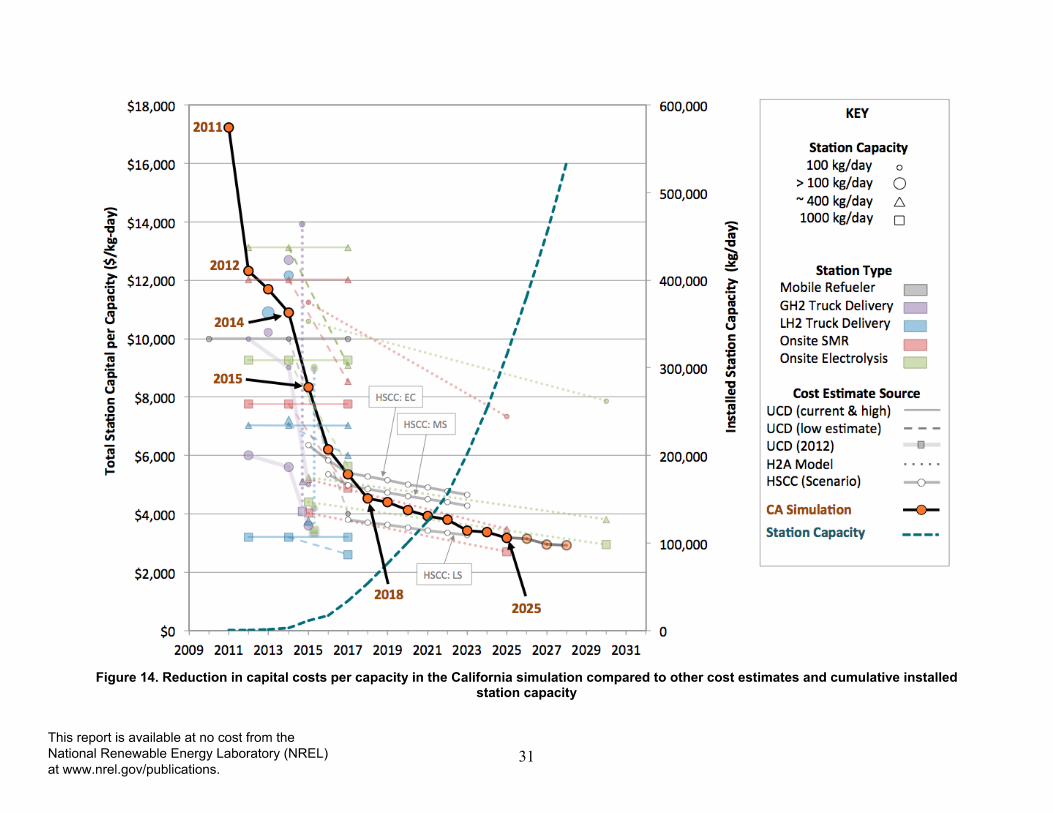
It is assumed that all learning investments required are reflected in the capital costs of the California stations, and no spillover cost reductions occur due to parallel market developments outside California. This assumption results in a relatively conservative estimate of capital cost reductions over time. Figure 14 portrays HSCC station costs associated with this simulation, indicating the decline in average station capital per capacity for new stations as they are installed over time, in greater numbers, and with larger capacities. These cost results follow directly from the HSCC equation presented above, and are therefore the marginal costs of new station capacity for a given average station size and particular year, where cumulative installed capacity increases each year. The simulation results are shown as orange dots in a time series overlay on top of the summary of cost estimates from Figure 10. Significant cost reductions are achieved when stations begin to be installed during the 2014–2018 timeframe, and then costs continue to decline at a slower rate after 2018. By 2025, capital costs per capacity for average new stations approach $3,200 per kg/day, and are in alignment with the low UCD liquid truck delivery station estimates, the current LH2 truck delivery costs from HDSAM, and the LS station type from the HSCC. Projected costs beyond 2025 are indicated as shaded symbols, given that the HSCC capital cost equation is limited to cumulative capacities less than roughly 300,000 kg per day, as discussed above.
This report is available at no cost from the National Renewable Energy Laboratory (NREL) at www.nrel.gov/publications.

30
(a)
(b)
Figure 13. Number of stations deployed by (a) station size and (b) total installed capacity by station size
This report is available at no cost from the National Renewable Energy Laboratory (NREL) at www.nrel.gov/publications.
31
Figure 14. Reduction in capital costs per capacity in the California simulation compared to other cost estimates and cumulative installed
station capacity
This report is available at no cost from the National Renewable Energy Laboratory (NREL) at www.nrel.gov/publications.
32
5 Summary and Conclusions The HSCC was used to collect expert stakeholder input on near-term opportunities to reduce the cost of hydrogen stations and was implemented in parallel with the 2011 Market Readiness workshop (Melaina et al. 2012). Cost estimate results from the HSCC are compared to three other sources of hydrogen station cost estimates: (1) the DOE’s H2A models, revised in 2012, (2) results from an extensive study of the transition to hydrogen conducted by UCD with significant industry and government stakeholder input with updates in 2012, and (3) public cost information on hydrogen stations to be installed in California between 2009 and 2013. Considering capital cost trends over time from these three sources suggests that the representation of capital costs in the HSCC provides intermediary values between the near-term estimates from stations recently installed in California and the longer-term mass production cost estimates from UCD and H2A. HSCC results therefore appear to be in alignment with other estimates of hydrogen station costs, and may be somewhat conservative with respect to projected cost reductions that could be achieved as technologies improve over time and economies of scale result from high-volume deployment of stations. As market conditions evolve over time and hydrogen station technologies improve, revised cost estimates and additional feedback from stakeholders may be needed to assess future cost reduction opportunities and market barriers.
Although station capital costs show strong economies of scale, a balance between station coverage and capacity must be achieved during early market growth. A simulation of station network growth in California suggests how the balance between coverage and economies of scale may influence average station capital costs. Strong reductions in capital costs are achieved during the ramp-up of station installations in the 2014–2018 timeframe, with continued but more moderate cost reductions after approximately 2020–2025. This is a relatively simple representation of station costs and rollout dynamics. Improved network cost estimates can be achieved by incorporating more realistic representations of coverage requirements in additional urban markets outside California, learning and experience from international market growth, the costs associated with the replacement of stations with larger capacity equipment, modular expansion of existing stations, and transaction costs associated with relocating smaller stations to provide coverage in new emerging markets. Leveraging infrastructure facilities supporting emerging non-FCEV markets, such as forklifts at warehouses or ground equipment at airports, may also reduce overall station network costs.
This report is available at no cost from the National Renewable Energy Laboratory (NREL) at www.nrel.gov/publications.
33
6 References Basye, L.; Swaminathan, S. (1997). Hydrogen Production Costs – A Survey. DOE/GO/10170-T18. Prepared by Sentech, Inc., Bethesda, MD. Washington, DC: U.S. Department of Energy. Available at http://www.osti.gov/bridge/servlets/purl/674693-UIUZUy/webviewable.
Bush, B.; Melaina, M.; Penev, M.; Daniel W. (2013). Scenarios for Early Market Clustering of Fuel Cell Electric Vehicle Introductions. NREL/TP-5600-56588. Golden, CO: National Renewable Energy Laboratory.
CaFCP (2012). A California Road Map: The Commercialization of Hydrogen Fuel Cell Vehicles. Sacramento, CA: California Fuel Cell Partnership. Accessed July 6, 2012: http://cafcp.org/sites/files/A%20California%20Road%20Map%20June%202012%20%28CaFCP%20technical%20version%29_1.pdf.
CARB (2012). Zero Emission Vehicle (ZEV) Program. Sacramento, CA: California Air Resources Board. Available at http://www.arb.ca.gov/msprog/zevprog/zevprog.htm.
Cunningham, J.; Gronich, S.; Nicholas, M. (2008). Why Hydrogen and Fuel Cells are Needed to Support California Climate Policy. University of California at Davis, Institute of Transportation Studies, Davis, CA. UCD-ITS-RR-08-06.
CEC (2010). Notice of Proposed Award (Revised): Alternative and Renewable Fuel and Vehicle Technology Program, Grant Solicitation PON-09-608, Hydrogen Fuel Infrastructure. PON-09-608-Revised. Sacramento, CA: California Energy Commission. Accessed July 6, 2012: http://www.energy.ca.gov/contracts/PON-09-608_Revised_NOPA.pdf.
CEC (2012). Notice of Proposed Award: Alternative and Renewable Fuel and Vehicle Technology Program, Grant Solicitation PON-11-609, Hydrogen Fuel Infrastructure. Sacramento, CA: California Energy Commission. Accessed May 5, 2012: http://www.energy.ca.gov/contracts/transportation.html#PON-11-609.
CEC (2013a). Notice of Proposed Award: Alternative and Renewable Fuel and Vehicle Technology Program, Grant Solicitation PON-012-606, Hydrogen Fuel Infrastructure. Sacramento, CA: California Energy Commission. Accessed August 28, 2013: http://www.energy.ca.gov/contracts/transportation.html#PON-12-606.
CEC (2013b). Hydrogen Fuel Infrastructure Workshop. August 12, 2013. Sacramento, CA: California Energy Commission. Available at http://www.energy.ca.gov/altfuels/notices.
CEC (2013c). Request for Proposals, Contracts, and Solicitations. Sacramento, CA: California Energy Commission. Available at http://www.energy.ca.gov/contracts.
DOE (2012). “H2A Analysis.” Washington, DC: U.S. Department of Energy Hydrogen and Fuel Cells Program. Accessed July 6, 2012: http://www.hydrogen.energy.gov/h2a_analysis.html.
This report is available at no cost from the National Renewable Energy Laboratory (NREL) at www.nrel.gov/publications.

34
DOE (2013). “H2A Delivery Analysis.” Washington, DC: U.S. Department of Energy Hydrogen and Fuel Cells Program. Accessed February 7, 2013: http://www.hydrogen.energy.gov/h2a_delivery.html.
EPA (2010). Interim Joint Technical Assessment Report. Washington, DC: U.S. Environmental Protection Agency, National Highway Traffic Safety Administration, California Air Resources Board. Accessed July 6, 2012: http://www.epa.gov/oms/climate/regulations/ldv-ghg-tar.pdf.
Fletcher, J.; Callaghan, V. (2006). Distributed Hydrogen Production from Natural Gas: Independent Review. NREL/BK-150-40382. Golden, CO: National Renewable Energy Laboratory.
Genovese, J.; Harg, K.; Paster, M.; Turner, J. (2009). Current (2009) State-of-the-Art Hydrogen Production Cost Estimate Using Water Electrolysis: Independent Review. NREL/BK-6A1-46676. Golden, CO: National Renewable Energy Laboratory.
Greene, D.L.; Leiby, P.N.; James, B.D.; Perez, J.; Melendez, M.; Milbrandt, A.; Unnasch, S.; Hooks, M. (2008). Analysis of the Transition to Hydrogen Fuel Cell Vehicles & the Potential Hydrogen Energy Infrastructure Requirements. Oak Ridge, TN: Oak Ridge National Laboratory. Available at http://www-cta.ornl.gov/cta/Publications/Reports/ORNL_TM_2008_30.pdf.
International Energy Agency (2012). Energy Technology Perspectives 2012: Pathways to a Clean Energy System. Paris: International Energy Agency, http://www.iea.org/etp/.
McDonald, A.; Schrattenholzer , L. (2001). “Learning Rates for Energy Technologies.” Energy Policy (29); pp. 255-261.
McKinsey & Company. (2010). A Portfolio of Power-Trains for Europe: A Fact-Based Analysis. McKinsey & Company. Accessed December 28, 2011: http://www.iphe.net/docs/Resources/Power_trains_for_Europe.pdf.
Melaina, M.W.J.; Ross, M.H. (2000). “The Ultimate Challenge: Developing an Infrastructure for Fuel Cell Vehicles.” Environment (42:7); pp. 10-22.
Melaina, M.W. (2003). “Initiating Hydrogen Infrastructures: Preliminary Analysis of a Sufficient Number of Initial Hydrogen Stations in the U.S.” International Journal of Hydrogen Energy (28:7); pp. 743-755.
Melaina, M.W. (2005). Initiating Hydrogen Infrastructures: Analysis of Technology Dynamics during the Introduction of Hydrogen Fuel for Passenger Vehicles. Dissertation. Ann Arbor, MI: School of Natural Resources, University of Michigan. Available at http://css.snre.umich.edu/css_doc/CSS05-16.pdf.
Melaina, M.W.; Bremson, J. (2006). “Regularities in Early Hydrogen Station Size Distributions.” Energy in a World of Changing Costs and Technologies. 26th North American Conference, International Association of Energy Economics, Ann Arbor, Michigan.
This report is available at no cost from the National Renewable Energy Laboratory (NREL) at www.nrel.gov/publications.
35
Melaina, M.W.; Steward, D.; Penev, M.; McQueen, S.; Jaffe, S.; Talon, C. (2012). Hydrogen Infrastructure Market Readiness: Opportunities and Potential for Near-term Cost Reductions. NREL/BK-5600-55961. Golden, CO: National Renewable Energy Laboratory. Available at http://www.nrel.gov/docs/fy12osti/55961.pdf.
Michalski, J.; Buenger, U.; Stiller C. (2011). “Business Analysis of the Hydrogen Refueling Station Infrastructure and the Role of the Pricing System.” International Journal of Hydrogen Energy (36); pp. 8152-8157.
Nicholas, M.A.; Handy, S.L.; Sperling, D. (2004). “Using Geographic Information Systems to Evaluate Siting and Networks of Hydrogen Stations.” Transportation Research Record (1880); pp. 126-134.
Nicholas, M.; Ogden, J. (2010). An Analysis of Near-Term Hydrogen Vehicle Rollout Scenarios for Southern California. UCD-ITS-RR-10-03. Davis, CA: University of California Davis, Institute of Transportation Studies. Accessed July 5, 2012: http://www.its.ucdavis.edu/research/Findings/h2_roadmap.php.
National Research Council (2008). Transitions to Alternative Transportation Technologies: A Focus on Hydrogen. Committee on Assessment of Resource Needs for Fuel Cell and Hydrogen Technologies, National Research Council. Washington, DC: The National Academies Press. Available at http://www.nap.edu/catalog.php?record_id=12222.
National Research Council (2013). Transitions to Alternative Vehicles and Fuels. Committee on Transitions to Alternative Vehicles and Fuels; Board on Energy and Environmental Systems; Division on Engineering and Physical Sciences, National Research Council. Washington, DC: The National Academies Press. Available at http://www.nap.edu/catalog.php?record_id=18264.
Ogden, J.M.; Kreutz, T.; Kartha, S.; Iwan, L. (1996). Hydrogen Energy Systems Studies. DOE/GO/10061--T1. Work performed by Center for Energy and Environmental Studies, Princeton, NJ. Washington, DC: U.S. Department of Energy. Available at http://www.osti.gov/dublincore/gpo/servlets/purl/290910-N9I0SZ/webviewable.
Ogden, J.M.; Cunningham, J.; Nicholas, M. (2010). Roadmap for Hydrogen and Fuel Cell Vehicles in California: A Transition Strategy through 2017. UCD-ITS-RR-10-04. Davis, CA: University of California at Davis, Institute of Transportation Studies. Accessed July 5, 2012: http://www.its.ucdavis.edu/research/Findings/h2_roadmap.php.
Ogden, J.M.; Nicholas, M. (2011). “Analysis of a ‘Cluster’ Strategy for Introducing Hydrogen Vehicles in Southern California.” Energy Policy (39:4); pp. 1923-1938.
Ogden, J.M.; Nicholas, M. (2012). “Analysis of a ‘Cluster’ Strategy for Introducing Hydrogen Fuel Cell Vehicles and Infrastructure in Southern California.” Revised Feb 22, 2012. Presentation to California Fuel Cell Partnership, November 1, 2012.
Padró, C.E.G.; Putsche, V. (1999). Survey of the Economics of Hydrogen Technologies. NREL/TP-570-27079. Golden, CO: National Renewable Energy Laboratory. Available at http://www.osti.gov/dublincore/gpo/servlets/purl/12212-Tocsc6/native.
This report is available at no cost from the National Renewable Energy Laboratory (NREL) at www.nrel.gov/publications.
36
Ruth, M.; Diakov, V.; Sa, T.; Goldsby, M. (2011). Macro System Model (MSM) User Guide, Version 1.3. NREL/TP-6A10-51618. Golden, CO: National Renewable Energy Laboratory. Available at http://www.nrel.gov/docs/fy11osti/51618.pdf.
Thomas, C.E. (1997). Direct-Hydrogen-Fueled Proton-Exchange-Membrane Fuel Cell System for Transportation Applications: Vehicle Safety Report. DOE/CE/50389-502. Arlington, VA: Directed Technologies, Inc.
Weinert, J.; Ogden, J.M. (2005). A Near-Term Economic Analysis of Hydrogen Fueling Stations. UCD-ITS-RP-05-12. Davis, CA: Institute of Transportation Studies, University of California.
Weinert, J.X. (2006). “A Cost Analysis of Hydrogen Stations for the California Hydrogen Highway.” Presented at the 2006 U.S. Association for Energy Economics Conference, Ann Arbor, Michigan.
Wene, C.-O. (2000). Experience Curves for Energy Technology Policy. Paris: Organisation for Economic Co-operation and Development, International Energy Agency.
This report is available at no cost from the National Renewable Energy Laboratory (NREL) at www.nrel.gov/publications.
Related Documents